1. Introduction
According to the Federal Ministry for the Environment, most of the water resources in Germany are in a chemically and ecologically poor state [
1]. In addition to chemical parameters, such as nitrate, anthropogenic inputs and microbiological pollution are increasingly affecting the raw water quality. Therefore, a robust and efficient water treatment is essential for a safe drinking water supply. Water treatment requirements are exacerbated by the increase in extreme weather events, such as flooding and prolonged droughts, as well as improved laboratory analytics and new legislation.
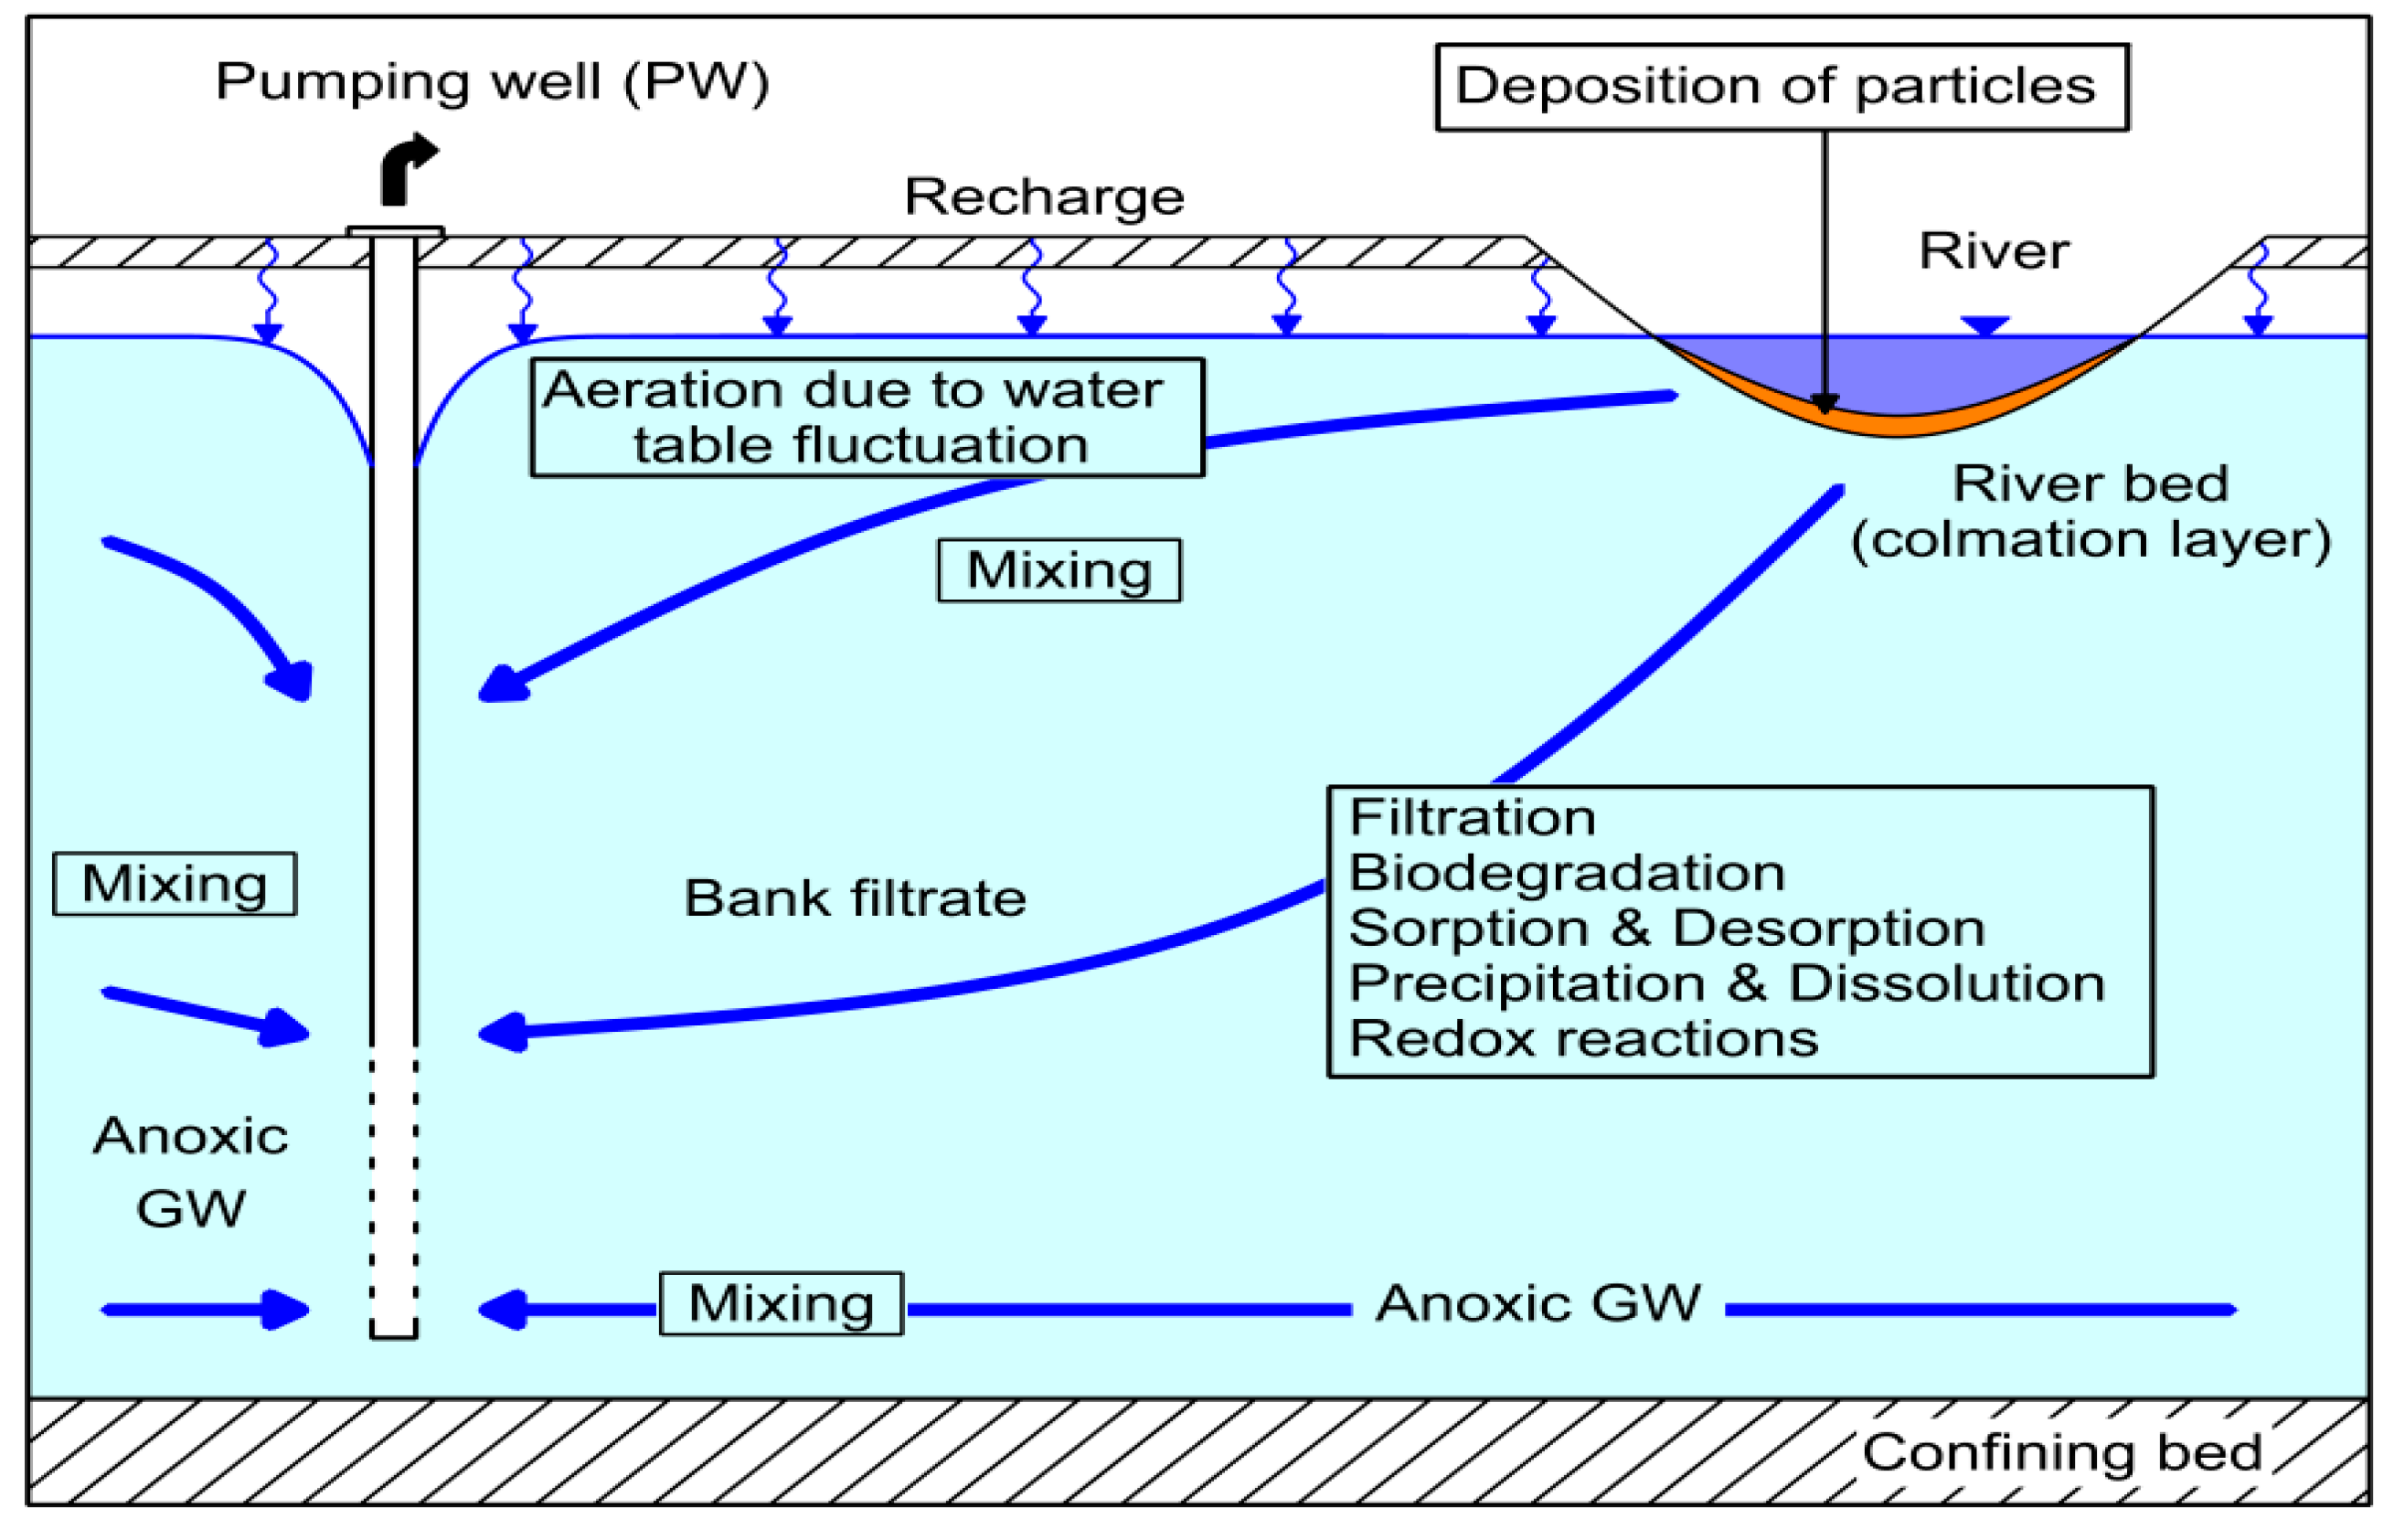
Riverbank filtration (RBF) is a robust and natural water treatment process. It has been used for drinking water treatment in Dresden, Germany for more than 140 years [
2]. Surface water infiltrates due to a hydraulic gradient created by nearby wells. The underground passage between the river and the wells provides pre-treatment. Sorption, biodegradation, filtration, and mixing processes in the aquifer (
Figure 1) result in a partial removal of heavy metals, organic compounds, bacteria, viruses, and protozoa as a function of residence time, flow path length, and hydrogeological/geochemical properties of the aquifer material [
3].
At the same time, RBF is used for water quantity management. The interaction between surface water and groundwater (GW) prevents over-exploitation of the aquifer, salinisation by rising deep saline groundwater, and subsidence due to groundwater abstraction [
4]. Against the background of the world’s increasing demand for drinking water, RBF is also suitable as a low-cost treatment process with low technical requirements for developing countries [
5].
Extreme events, such as floods, or increases in the capacity of the water intake lead to a shorter retention time of the bank filtrate in the exploited aquifer. This is a problem that can occur in the medium term, especially in conurbations with bank filtrate abstraction, such as the Rhine River region, or large cities, such as Berlin, Dresden, Budapest, and Poznan. With channeling rivers, more frequent weather extremes, and higher drinking water demand, abstraction of bank filtrate is becoming increasingly strained. One consequence may be breakthroughs of contaminants, which lead to microbiological and other pollution of the bank filtrate. A medium-term strategy for such scenarios is, therefore, advisable for water supply companies [
6]. During such events, bank filtration should be coupled with an additional technical treatment stage.
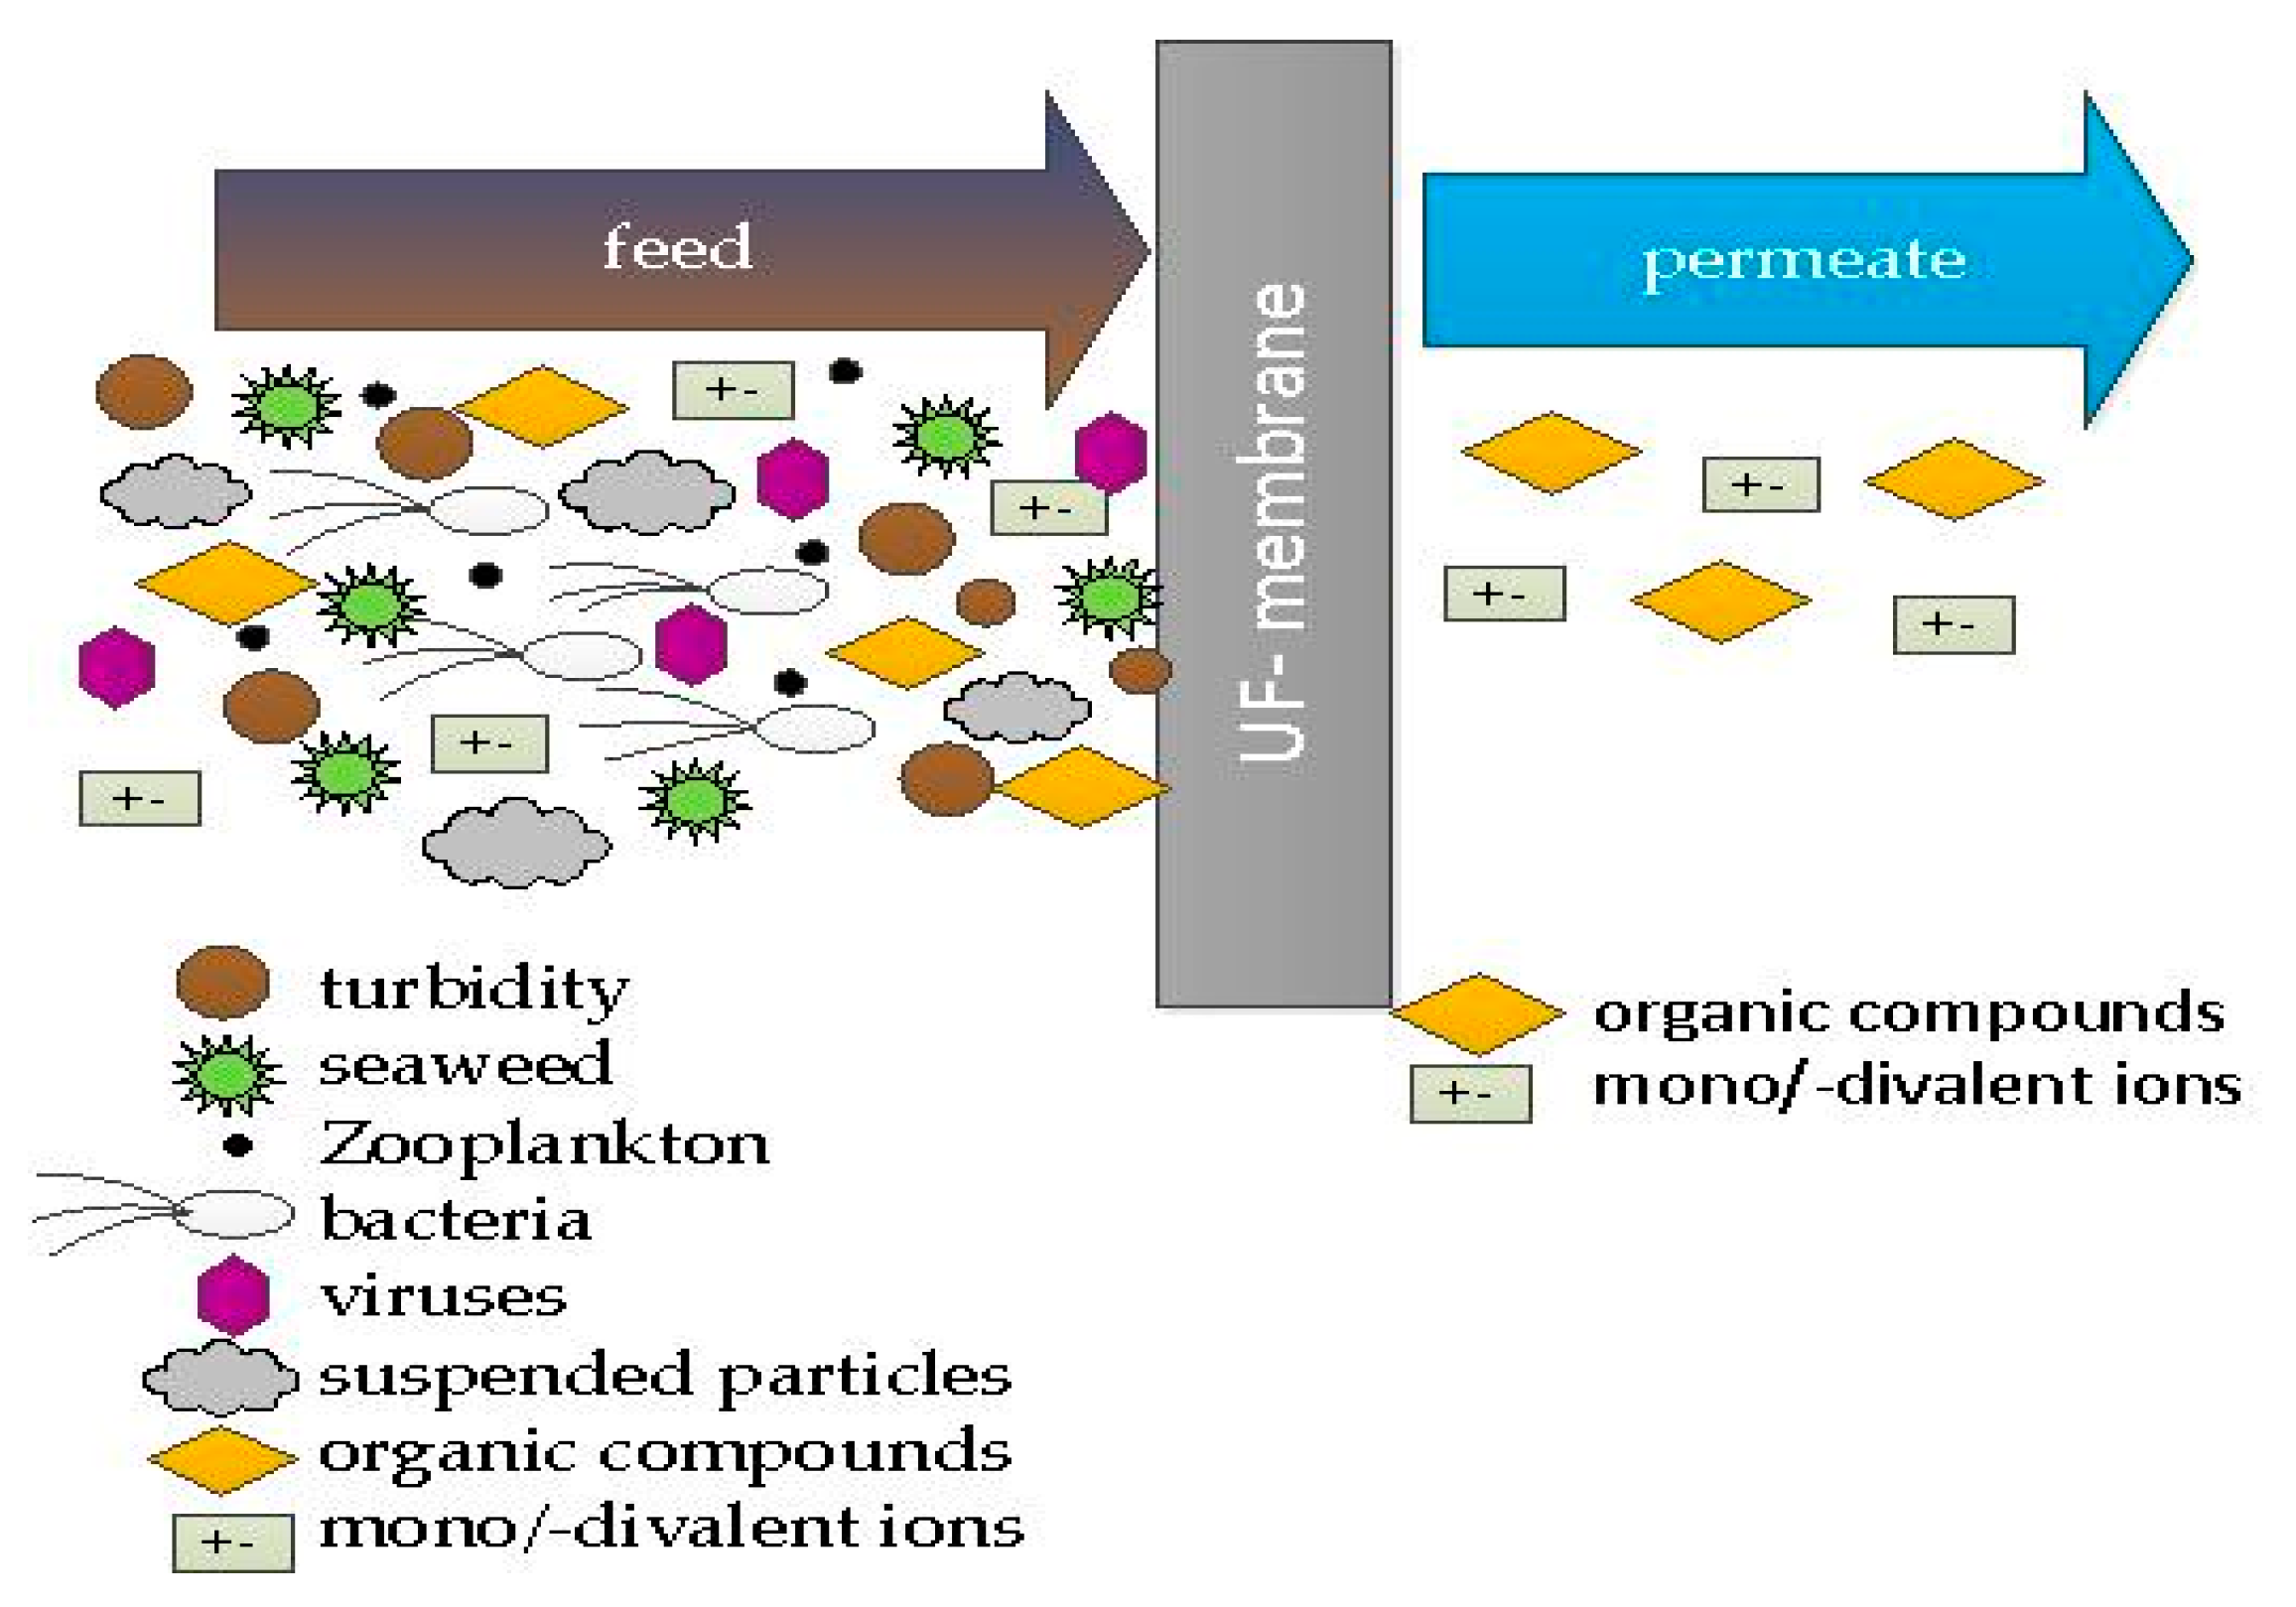
Ultrafiltration is a treatment stage that reliably avoids microbiological breakthroughs. It is a pressure-based filtration through a membrane that cannot be passed by macromolecular compounds. Particles between 0.1 and 0.01 μm are retained regardless of the raw water quality (
Figure 2). These include bacteria, viruses, protozoa, and suspended solids [
7].
In Germany, there are more than 200 ultrafiltration plants for water treatment, mostly for reservoir water or groundwater [
8]. Worldwide, ultrafiltration plants for drinking water treatment are increasingly used in arid areas or in the case of necessary use of water resources that are microbiologically polluted [
9].
A disadvantage is the comparatively high energy requirement of ultrafiltration compared to other treatment techniques, such as sand filtration [
10]. The energy consumption depends primarily on the fouling potential of the membrane, which is affected by the raw water quality and the cleaning processes. By combining bank filtration and ultrafiltration, the disadvantages of the respective treatment process can be reduced as both treatment steps complement each other.
The AquaNES project investigates various combinations of natural and technical water treatment processes for drinking water and wastewater treatment. The water company DREWAG works on an energetic, operational, and economical comparison considering the ultrafiltration of different source waters such as bank filtrates and untreated river water on a semi-technical scale. The focus is on the treatment performance and energy consumption of ultrafiltration membranes. In addition, the effect of the treatment of water for rinsing/cleaning by inline electrolysis on the fouling potential of ultrafiltration in terms of dissolved manganese and chlorine concentration in the backwash water is shown. Dissolved manganese and iron from the bank filtrate can lead to severe fouling of ultrafiltration membranes. By introducing oxygen into the backwashing process, the dissolved manganese can be oxidized and precipitate on the filtrate side of the membrane. Removal of such deposits requires additional chemical cleaning. Backwash water treatment by inline electrolysis can reduce this fouling and, thus, have a positive effect on the economic operation of an ultrafiltration plant.
This paper presents the first results of the semi-technical experiments and illustrates the advantages of the combination of bank filtration and ultrafiltration for water treatment compared to conventional treatment techniques.
2. Materials and Methods
2.1. Raw Water for Drinking Water Treatment and Feed Water for the Ultrafiltration Plant
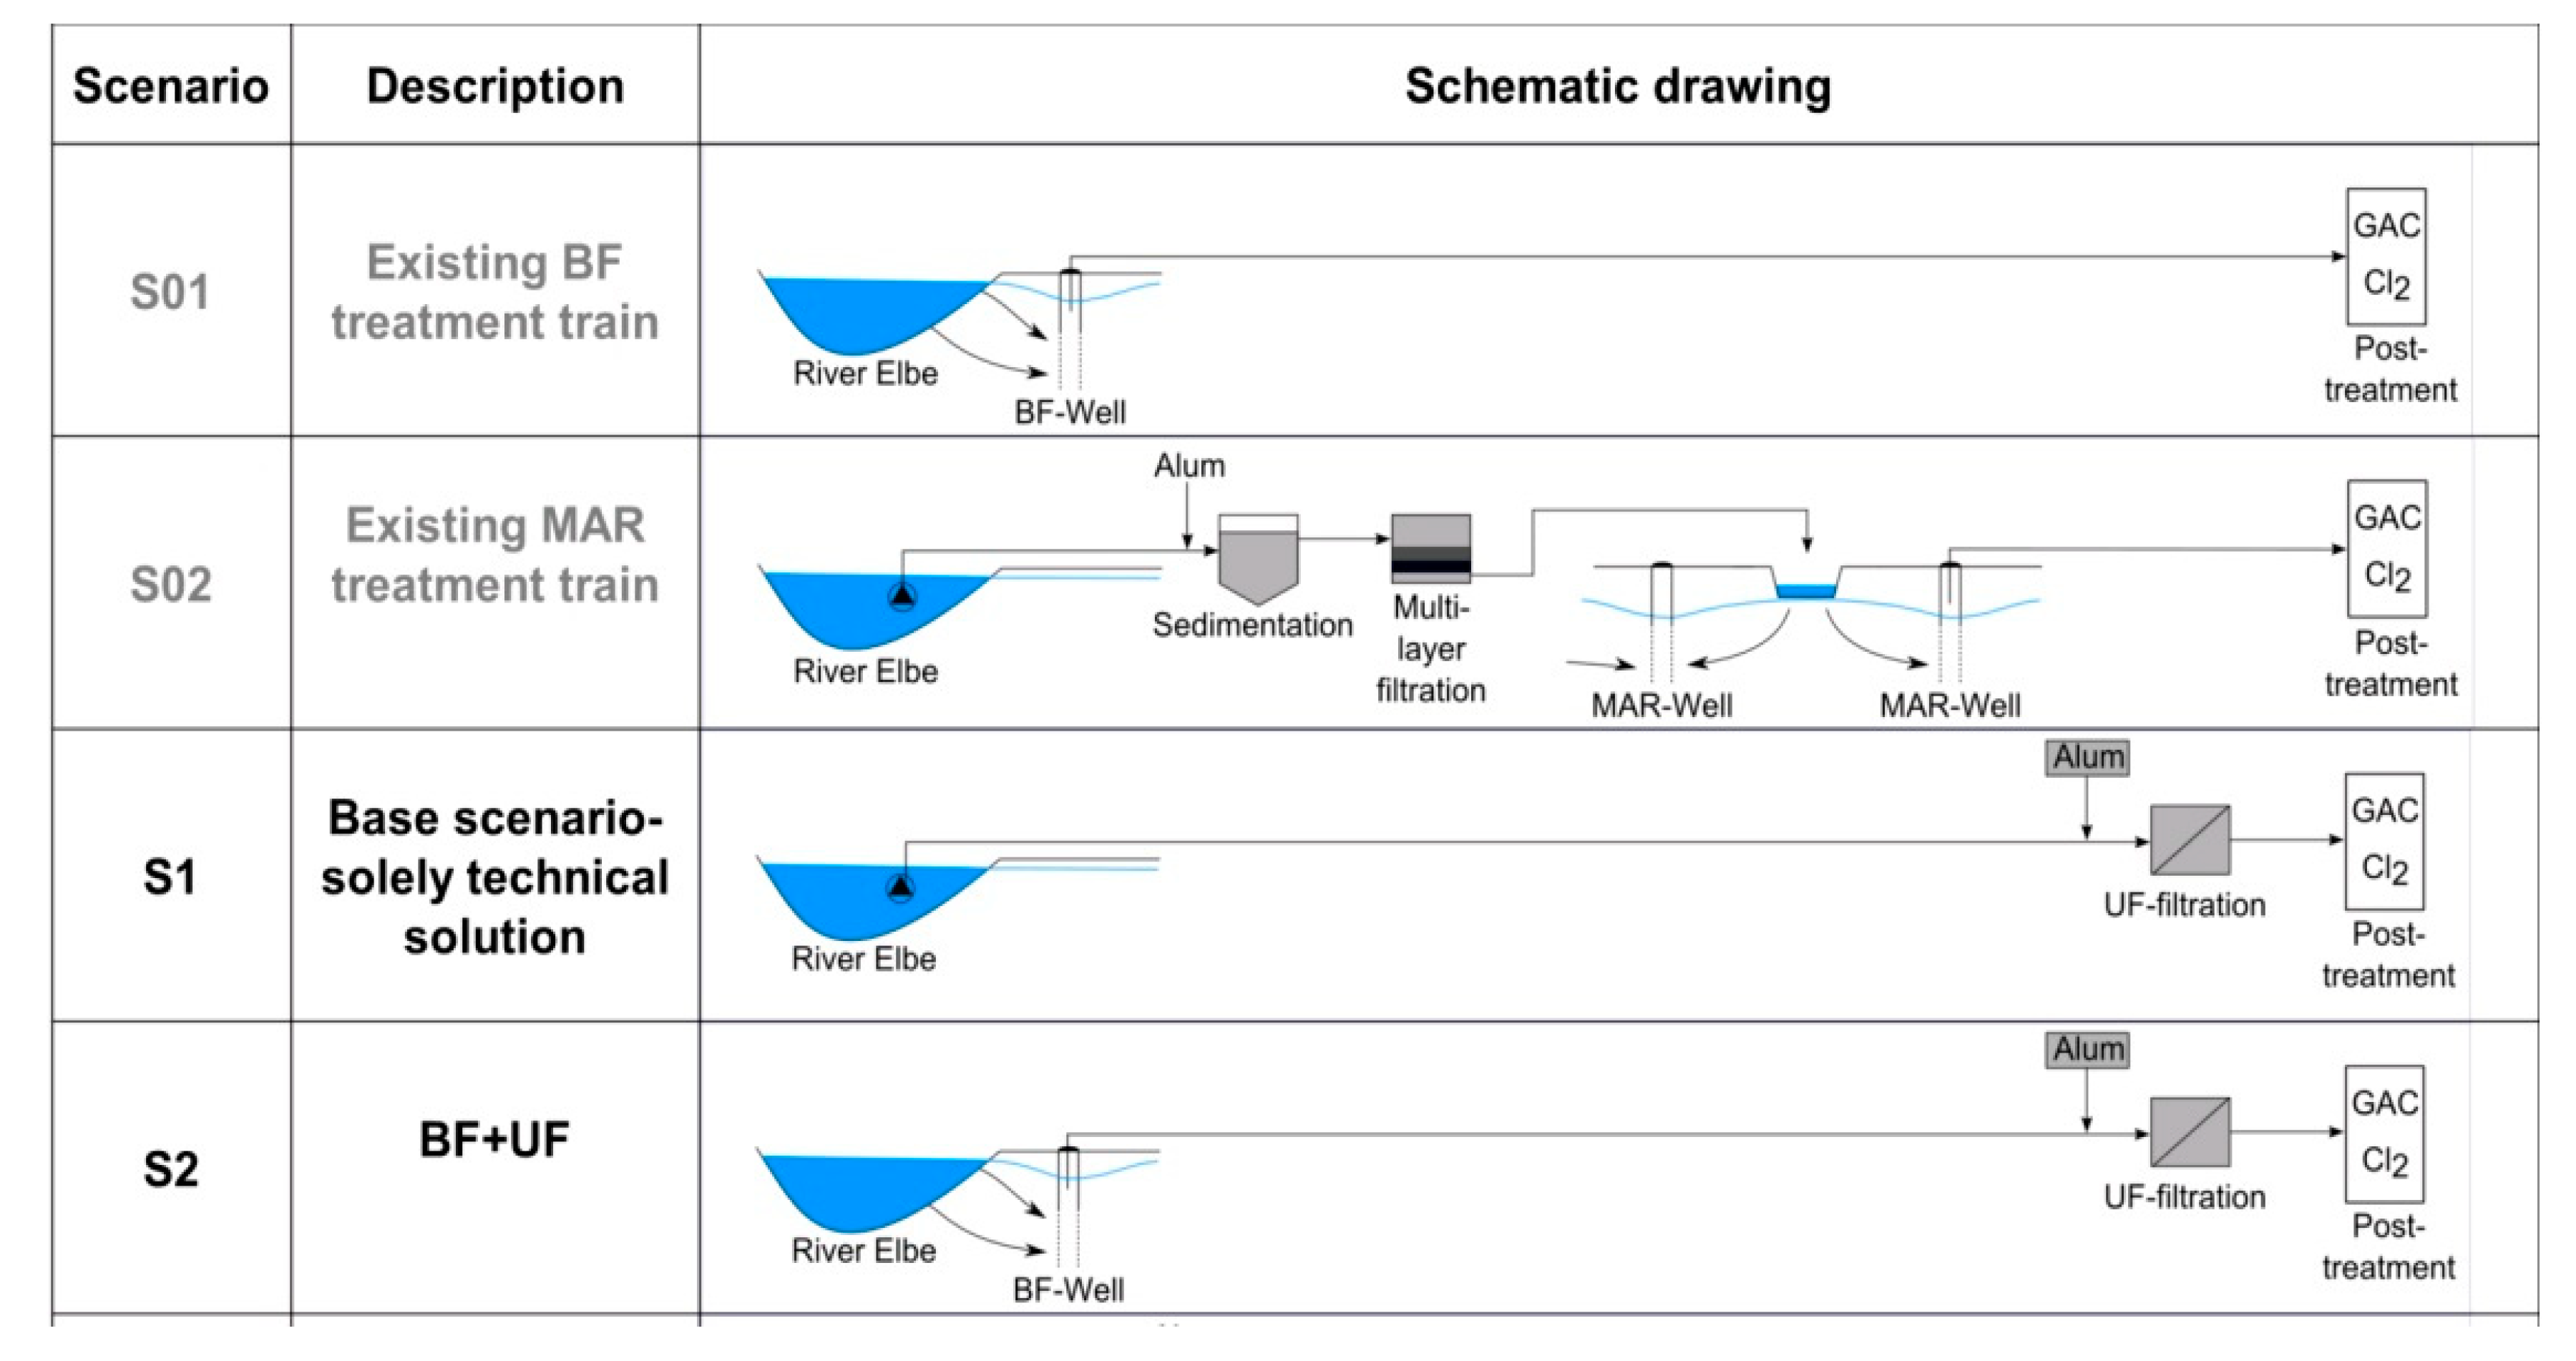
The ultrafiltration plant was operated in the second largest waterworks in the city of Dresden, which is located at the Elbe River. This waterworks has a total capacity of 72,000 m
3/day, and 111 vertical siphons wells and 36 wells with submersible pumps that extract bank filtrate from a depth of 5–8 m at a distance of 60–120 m to the river. After extraction, the water is aerated and filtered through activated carbon before it is disinfected with chlorine and distributed as drinking water (
Figure 3, Scenario S01).
Besides bank filtrate (BF), river water (RW) is used as raw water for drinking water production. High drinking water demand requires direct abstraction of river water. The river water is first pre-treated by coagulation, sedimentation, and filtration through a multilayer filter. Subsequently, the water is artificially recharged into the aquifer via infiltration basins. The artificial recharge significantly increases the capacity of the waterworks. The infiltrated water is pumped together with the bank filtrate to the treatment stages aeration, activated carbon filtration, and disinfection (
Figure 3, Scenario S02).
Both bank filtrate and untreated river water has been used as feed water for the ultrafiltration plant. From May 2018 to September 2018, river water was directly treated via ultrafiltration (
Figure 3, Scenario S1). A robust feed pump with a capacity of 30 m
3/h delivered river water directly into the storage tank of the membrane plant through a 435-m long supply pipe. Because the river water was not pre-treated, some sediment entered the storage tank. Bank filtrate was extracted from a well group of eight vertical filter wells with submersible pumps (
Figure 3, Scenario S2). The wells are located at a distance of 80–110 m to the river with a depth of 6–8 m. Because of the riverbed and aquifer composition, some wells show an increased manganese concentration of 0.17 mg/L on average. Maximum concentrations up to 0.43 mg/L have been observed.
The bank filtrate was delivered via a 700-m long supply line into an overflow tank in the waterworks. From October 2017 to May 2018, a feed pump transported the bank filtrate to the ultrafiltration plant.
2.2. Construction and Operation of the Ultrafiltration Plant
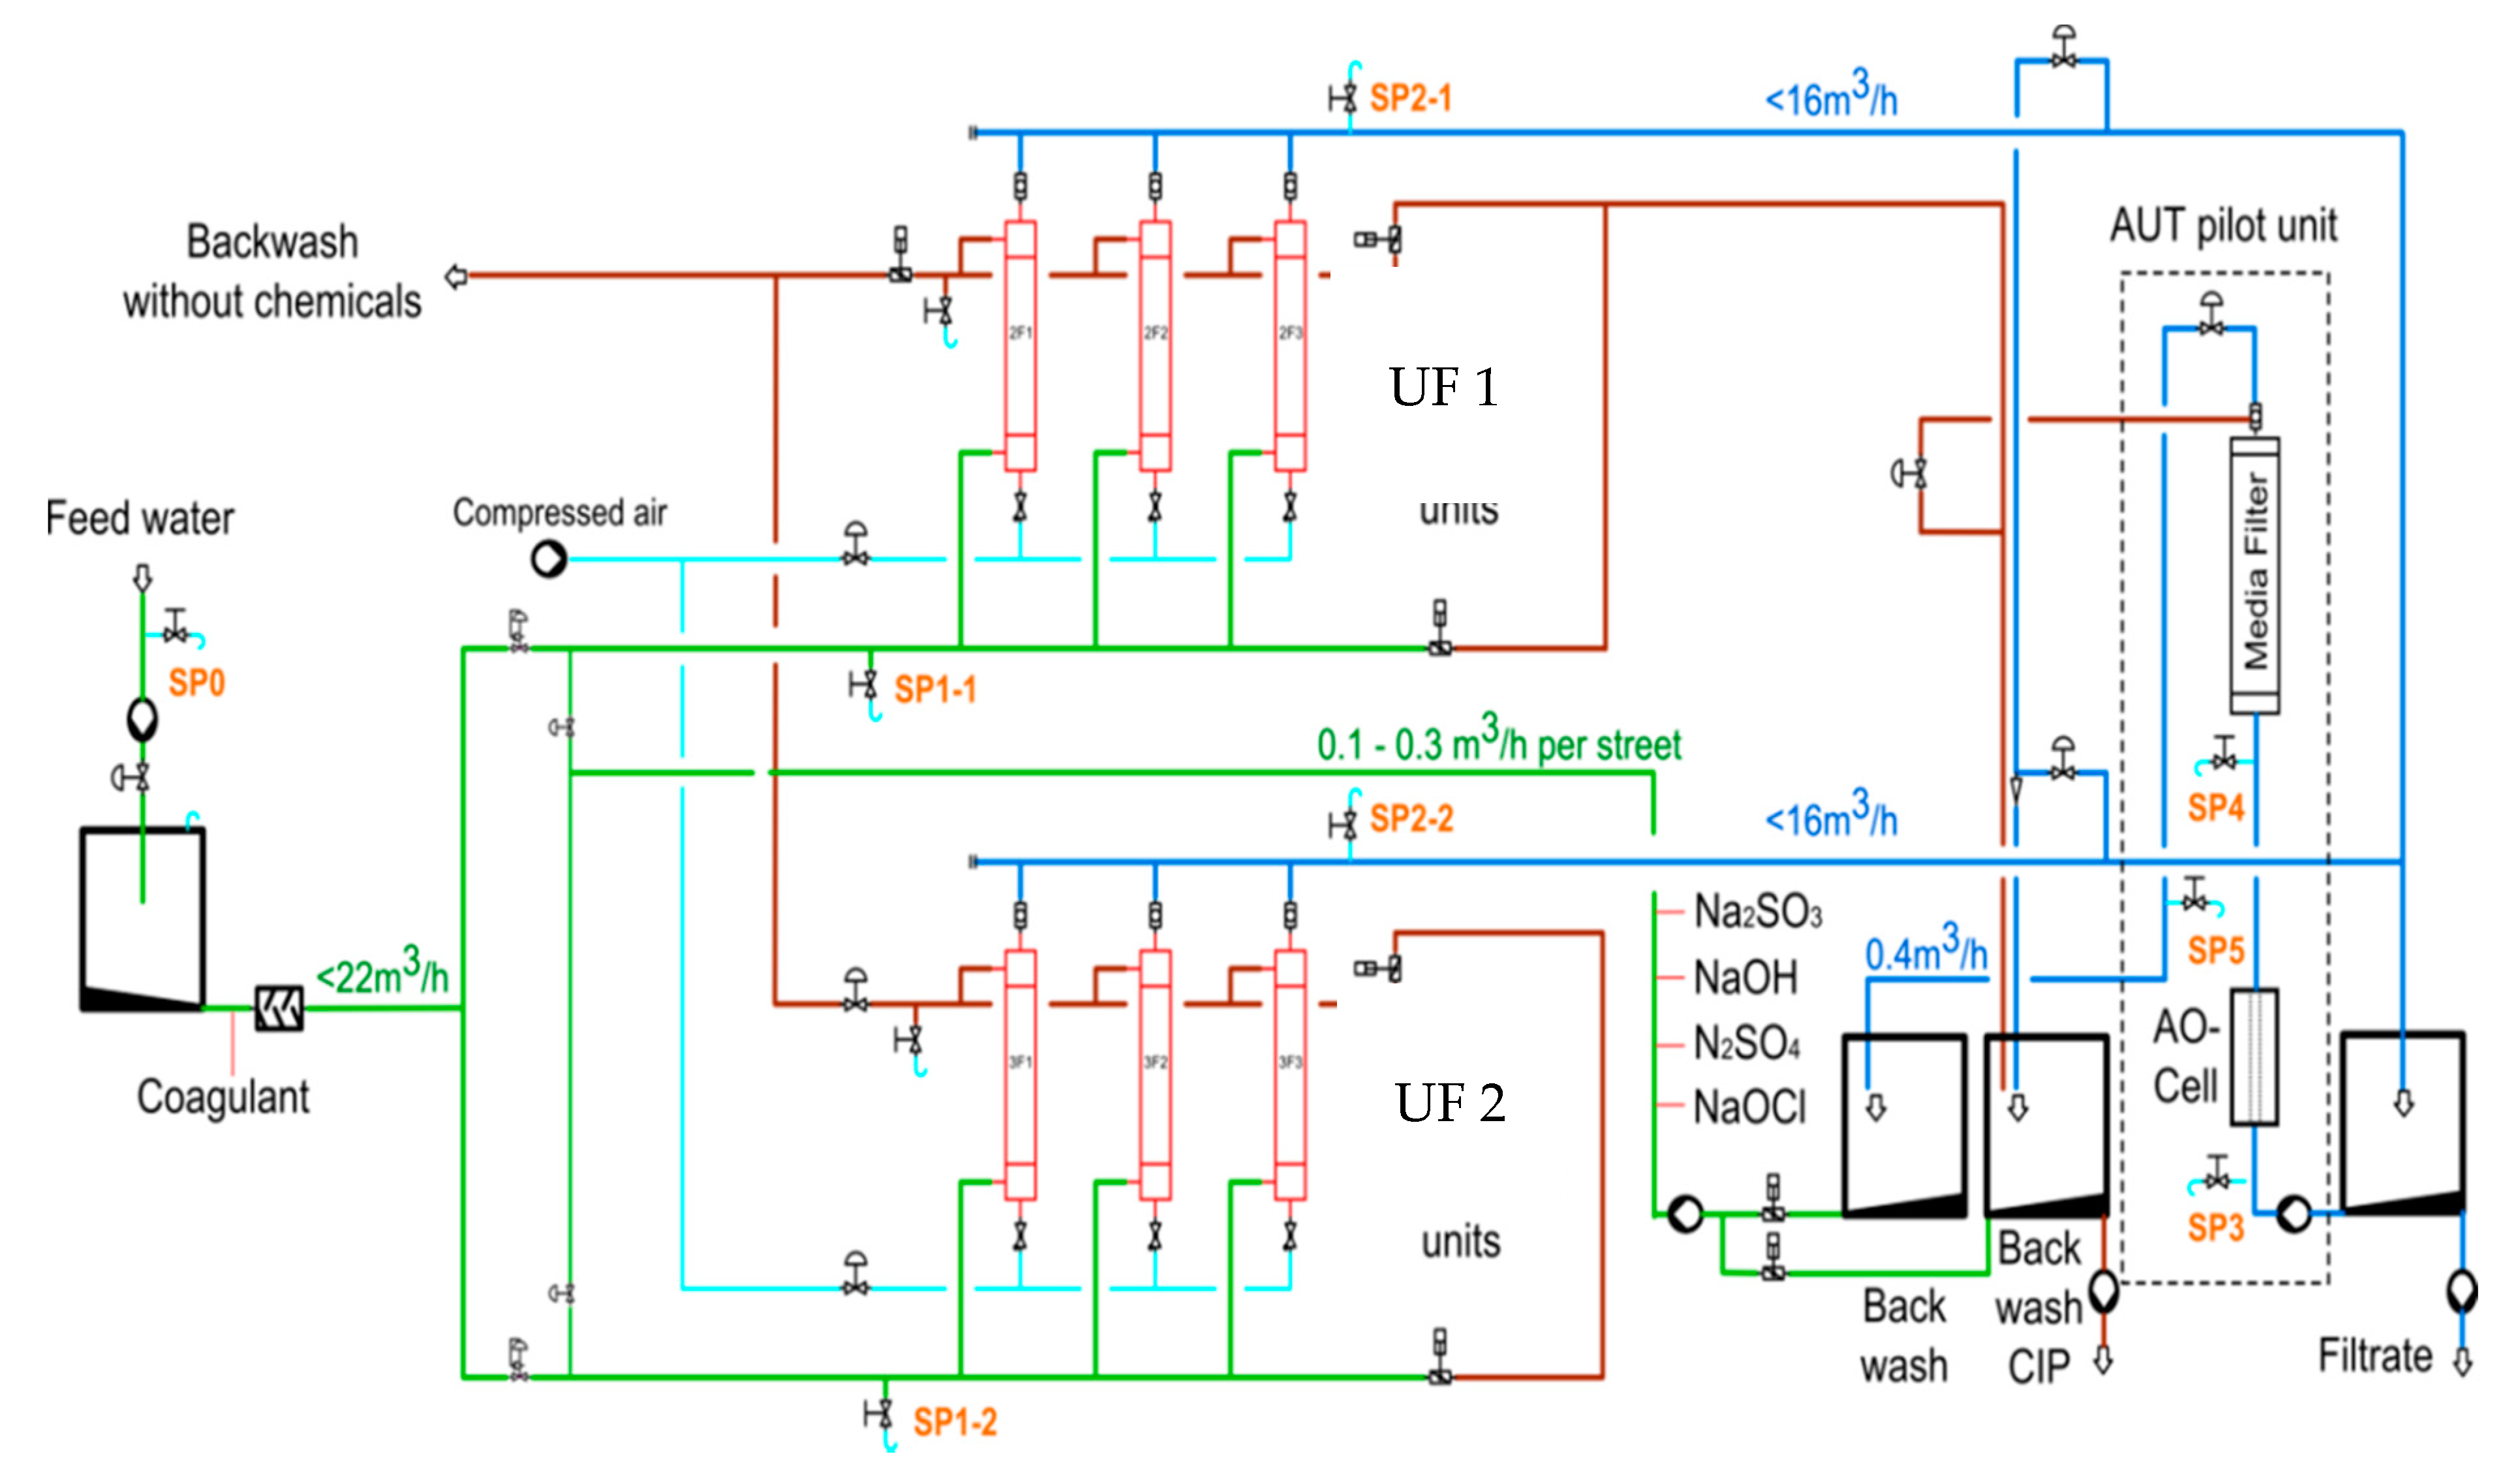
The maximum treatment capacity of the ultrafiltration plant was 20 m3/h. The feed water tank with a volume of 1.9 m3 was filled with BF or RW. The pumping was controlled by the water level. A permanent operation was guaranteed. From the feed tank, the water was pumped into the membrane unit (Q = 20 m3/h, 3 bar operating pressure). A pre-filter with a pore size of 300 µm protected the membrane from coarse material and damage. The pre-filter was pressure-controlled and cleaned automatically when the pressure increased or after 2 min.
The first measuring point in the plant was placed after the pre-filter with online recording of the parameters temperature, turbidity, and conductivity. Subsequently, the feed water reached the membranes. There were two membrane lines, each consisting of three membrane modules (
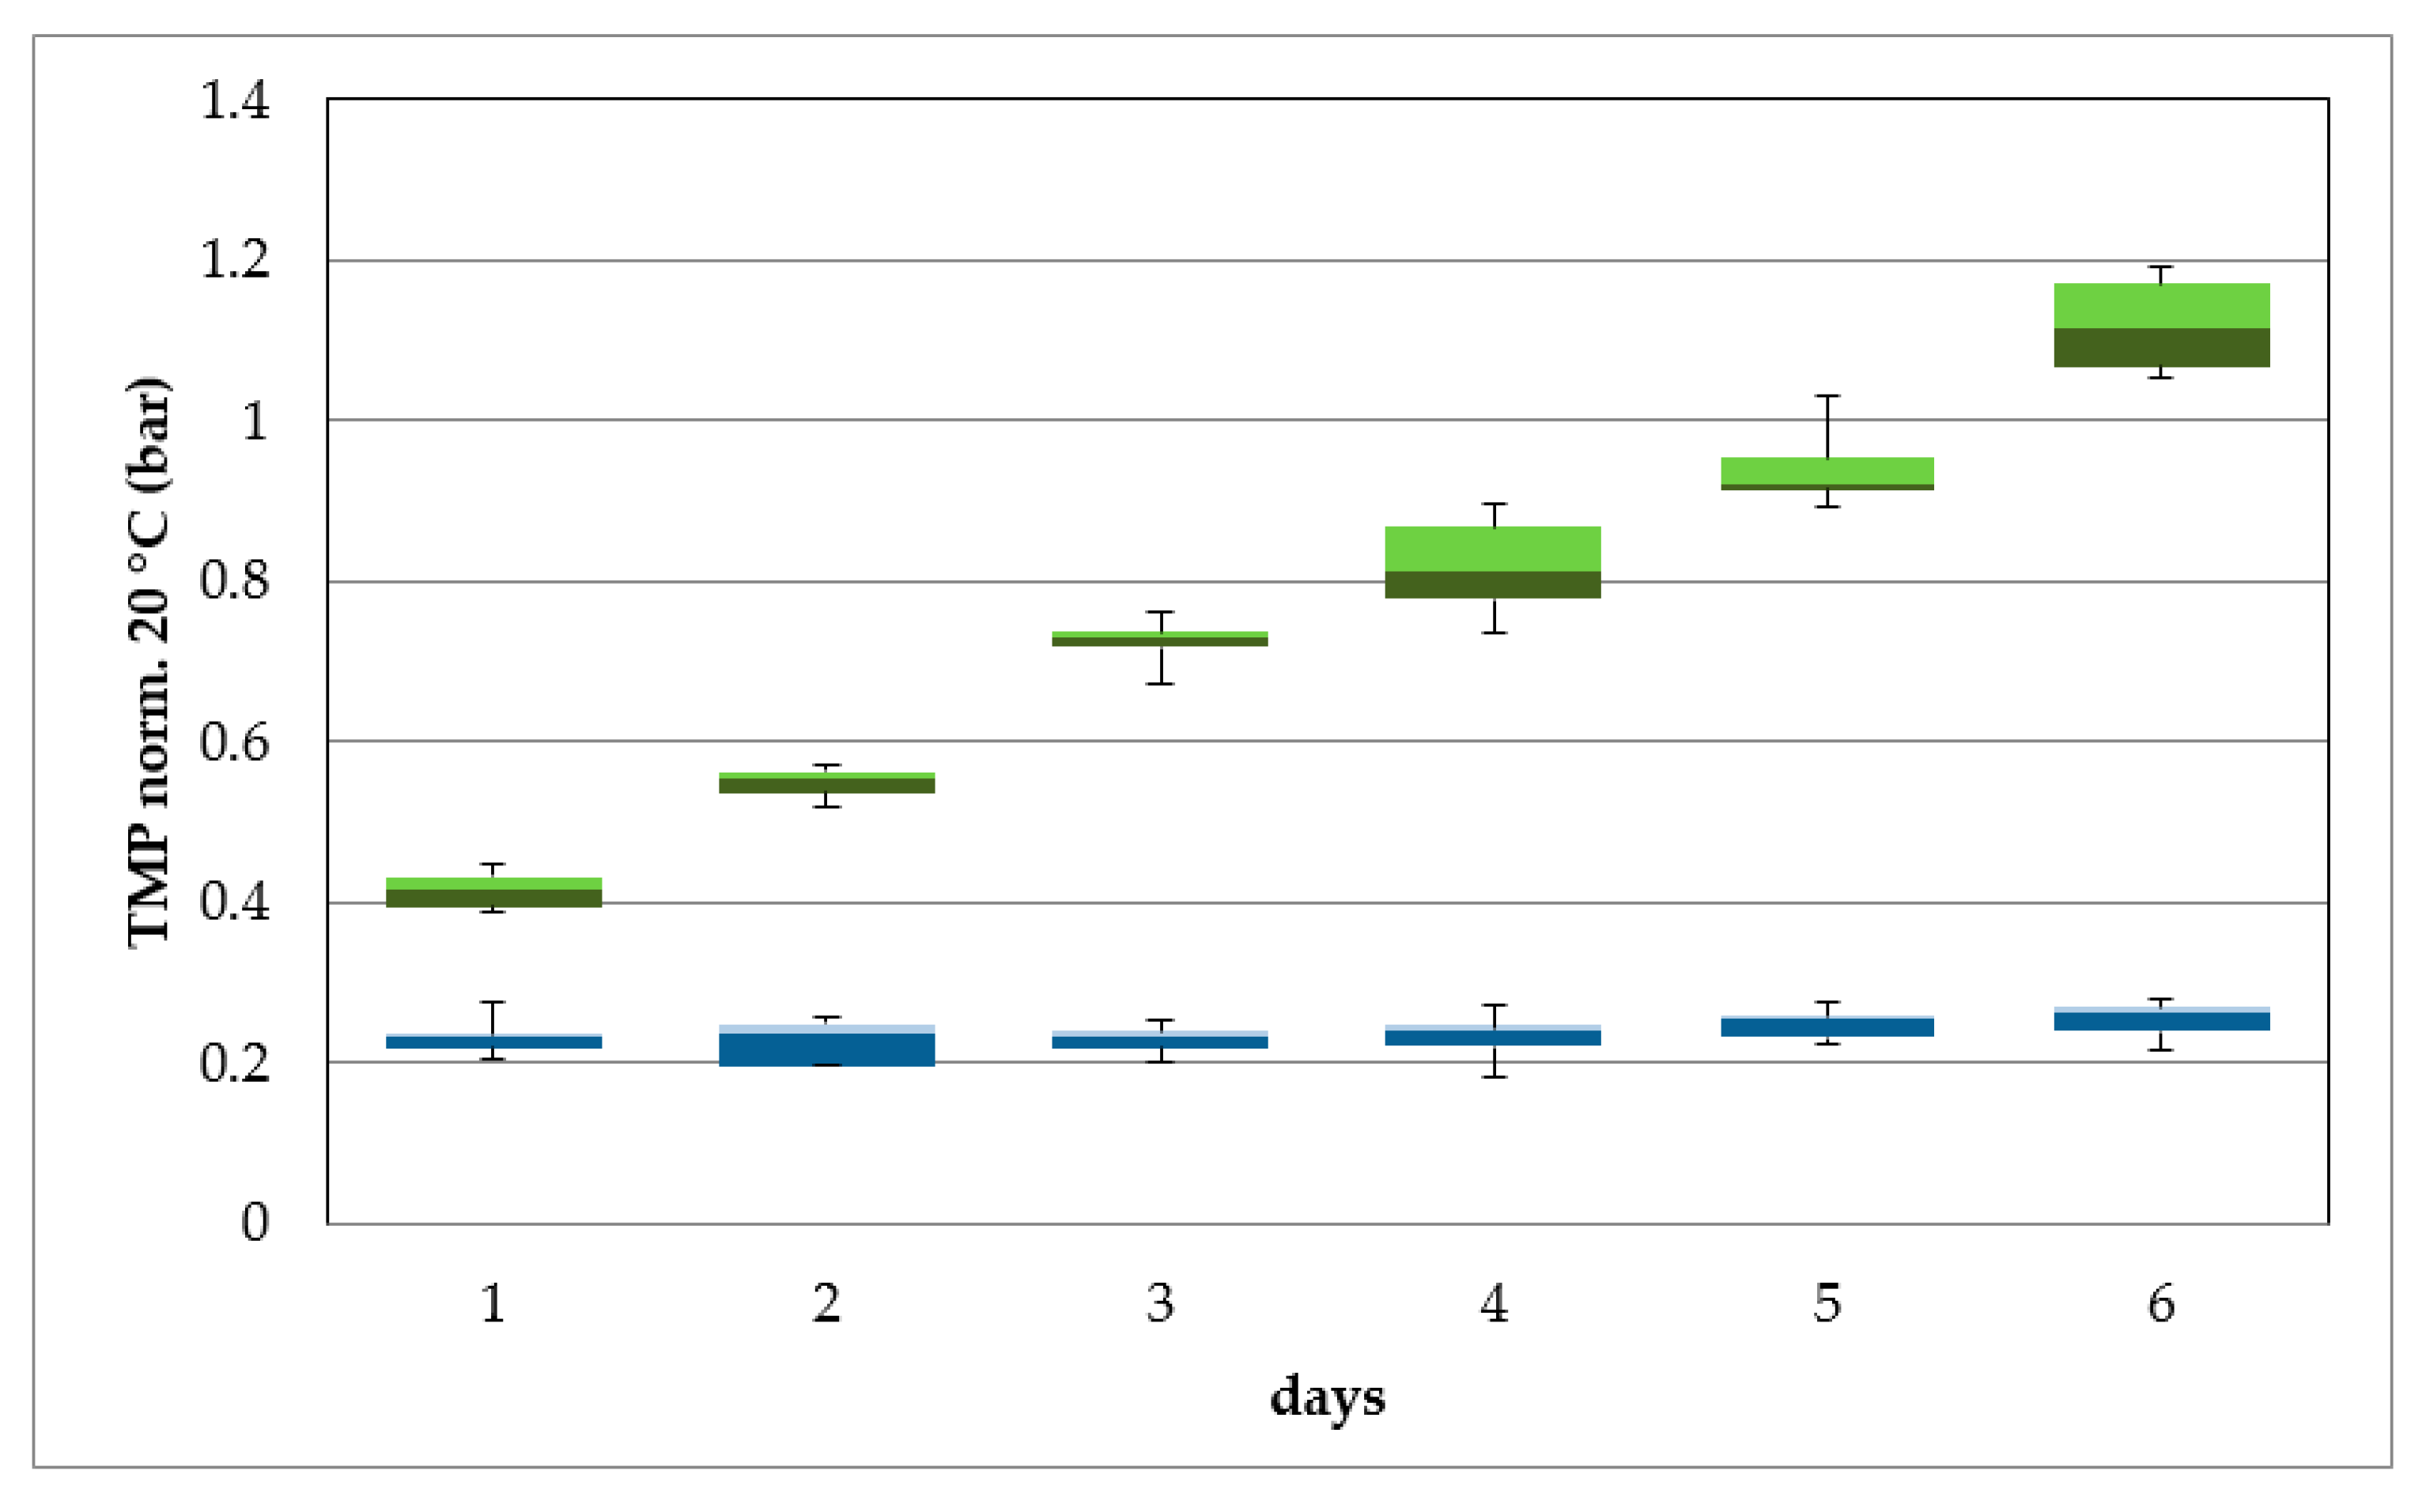
Figure 4). The inflow and filtration performance of the membrane line was controlled through flowmeters, pressure measurement, and control valves in front of the modules. Pressure directly before and after the membrane modules was recorded online, allowing for determination of the permeability and the transmembrane pressure (TMP). The permeate was stored in the permeate tank (3 m
3), and afterwards pumped (20 m
3/h) to one of the infiltration basins. The filtrate was also used for backwashing and chemical cleaning of the modules. All measurement and control data converged at the control panel.
The wastewater from backwashing without chemicals was discharged into the sedimentation basin of the waterworks. Chemical cleaning was carried out with a 50% hydrochloric acid, 35% sodium hydroxide solution, and 12% sodium hypochlorite solution. Depending on the cleaning program, setting parameters, such as temperature, concentration of the chemicals, and contact time were adjusted automatically via dosing pumps. The chemical wastewater was collected in the clean-in-place (CIP) container, neutralized, and discharged into a sewer after a safety residence time. Flowmeters recorded the volumes of the filtrate, backwash water flow, and chemical wastewater. The power consumption of the system was also measured. The ultrafiltration plant was fully automated.
Next to the membrane station, an AUTARCON electro-chlorination ECl
2 system (AUT,
Figure 4) was installed for treatment of backwash water. A small portion of the UF filtrate passed through the electrolysis reactor, where chlorine (≤1 mg/L) was produced from the natural chloride content of the water. This led to an increase in the redox potential of the water, allowing for the oxidation of dissolved Mn
2+ to Mn
4+ and its removal in the Green Sand Plus (GSP) filter unit.
The treated water was then stored in a 1 m3 Intermediate Bulk Container (IBC) storage tank. Here, the redox potential was monitored in order to derive the required potential, which assures the oxidation of Mn2+. The redox potential could be used as a control parameter in future applications.
The ECl2 system was originally designed for a flow rate of up to 1000 L/h. Due to the low natural chloride concentration in the river water and bank filtrate, and the anticipated residual chlorine concentration of 0.2–0.5 mg/L, the flow rate was set to 400 L/h. This was sufficient to meet the demand for backwash water for both UF membrane modules. The GSP media was automatically backwashed every two days with a flow rate of 900 L/h for 20 min, including rinse using UF permeate. Backwash and rinse water were discharged.
Sampling of the feed water and the two permeates (UF 1 and UF 2) was done weekly. The analyses were carried out in the accredited drinking water laboratory of DREWAG NETZ GmbH in accordance with the German Drinking Water Ordinancee.
Additionally, manganese and chlorine were analysed onsite using a handheld spectrophotometer (Aqualytic AL410, Dortmund, Germany). The chlorine was determined using the diethyl-p-phenylendiamin (DPD) method, where the free, bound, and total chlorine concentration is measured by the color reaction with diethyl-p-diphenylenediamine. According to wastewater regulations, the wastewater was tested monthly for arsenic, adsorbable organic halogens (AOX), and pH.
ATP measurements can detect living cells simply and easily and, thus, provide an onsite analysis of the effect for treatment steps or disinfections in addition to the legally required laboratory measurements. Set up for the measurement was carried out by measuring bioluminescence. An increase in light can be measured through enzymatic degradation of adenosine triphosphate (ATP) and adenosine monophosphate (AMP) using luciferase and pyruvate phosphate dikinase, which results in a biochemical reaction (bioluminescence).
The results are quantified as numerical Relative Light Units (RLU). If the number of micro-organisms in the water sample is high, the reactions are more intense and, therefore, the bioluminescence is high.
2.3. Ultrafiltration Membranes and Membrane Cleaning
Each membrane line was from a different membrane manufacturer. The first membrane line (UF 1) had modules with a 60 m2 membrane area per module. The second line had modules with a 55.7 m2 membrane area. The membrane fibres of both modules were made of polyvinylidene fluoride (PVDF) and operated in the filtration mode OUT-IN. The flux per membrane modules was 40–80 (L/m2 h). The operating pressure of 1.5 bar was set in consultation with membrane manufacturers as the TMP limit.
The cleaning process of the membrane modules was adjusted depending on the filtration performance for the respective modules during operation in consultation with the manufacturers. Backwashing took place for bank filtrate every 90 min and for river water every 30 min.
UF 1 was cleaned with 60 s backwash as a combination of air and water with 5 m3/h per module. Air was added in the filtration direction, water in the reverse direction. Afterwards, a 45 s forward flush was performed with 7 m3/h feed in the direction of filtration.
UF 2 was first pre-cleaned with a 10 s air flushing from the feed side. Subsequently, the air-water backwashing from the filtrate took place in the flow direction as per UF 1 for 50 s. The cleaning was completed with a 15 s forward flush at 7 m/h in the filtration direction.
For manganese-containing feed water (bank filtrate), the backwash water was taken from the IBC tank of the inline electrolysis system.
The settings for the chemical cleaning process were different for the membrane line. Enhanced flux maintenance (EFM) and CIP (clean-in-place) were applied to UF 1, CEB (chemical enhanced backwash), and CIP in UF 2.
EFM is a purification process. Five hundred litres (500 L) of permeate were heated up to 32 °C and dosed with 1500 mg/L NaOH (35% solution) and 500 mg/L NaOCl (12% solution). The cleaning solution was pumped in the permanent filtration circuit of the membrane modules for 2400 s with 6 m3/h. After the EFM, the membrane was rinsed for 90 s with permeate (15 m3/h) and a forward flush for 30 s with feed water (7 m3/h).
The dosage of 1750 mg/L NaOH and 500 mg/L NaOCl was done directly into the membrane with a flow rate of 6 m3/h permeate in the CEB. This was followed by an exposure time of 1200 s with 3 min air intervals in the membrane. The chemical was rinsed out with filtrate (15 m3/h) for 90 s. Afterwards, H2SO4 was added. After the exposure time and filtrate rinse like at NaOH, the TMP is reduced, which reflects a cleaning of the membrane. A forward flush for 15 s by 7 m3/h completed the cleaning process. The strongest cleaning was the CIP. This was carried out separately with H2SO4 as well as with NaOH or NaOCl. The cleaning processes were identical to the EFM; however, the chemical exposure time of 7200 s was significantly longer.
4. Discussion
Microbiological particles, such as bacteria and other particulate matter, were efficiently removed by ultrafiltration independent from feed water quality.
Typically, all particles >0.02 µm should be removed by the membrane. Ions with mono or bivalent charge pass through the membrane. These include calcium, potassium, and chloride as well as pesticides and humic substances [
11]. This statement was confirmed during this investigation. The results obtained through the monitoring of manganese concentration at different stages illustrate that dissolved manganese passes through the membrane. Particulate manganese from the river water, on the other hand, was completely removed by the membrane.
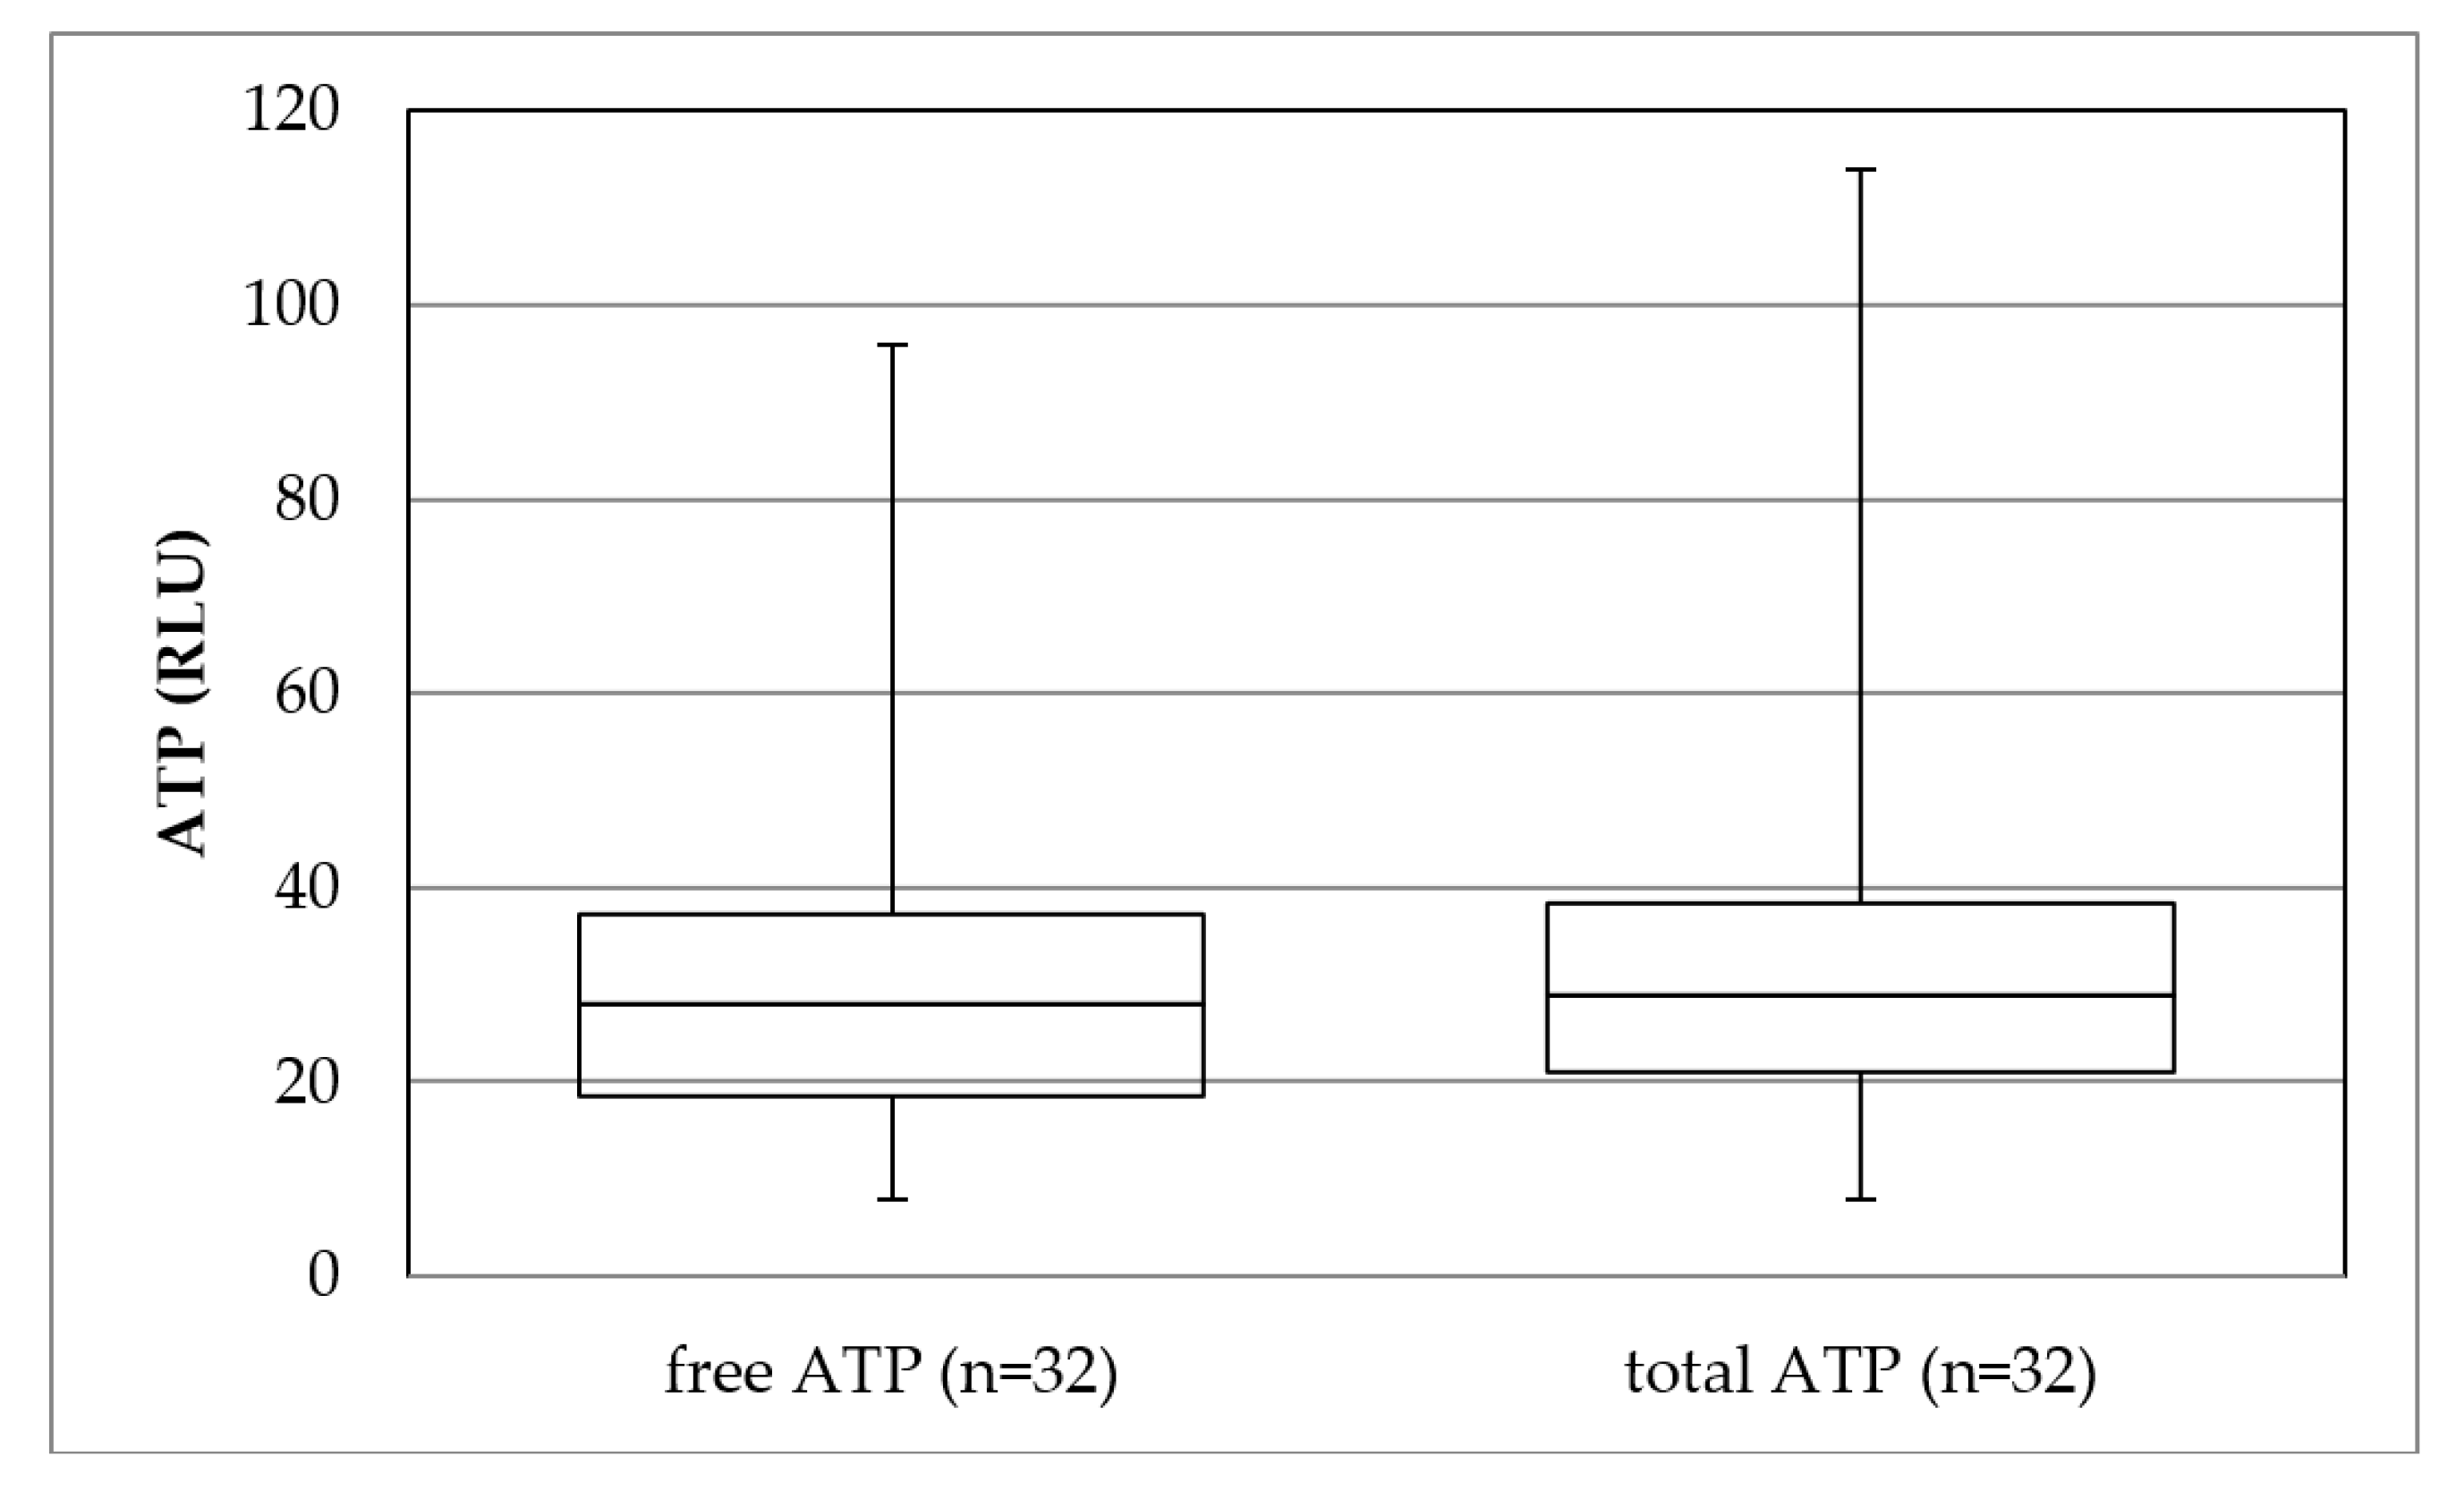
The parameter ATP was measured in addition to common microbiological parameters to better assess the removal performance of ultrafiltration concerning micro-organisms. The results illustrate that ultrafiltration reduced ATP and the number of micro-organisms (bacteria). A complete removal was found. The ATP in the permeate consisted of 98% cell-free ATP, which passed through the membrane. Cumming (2015) showed that free ATP was detected after ultrafiltration but not cell-bound [
12]. The presented results confirm this statement (see
Figure A1 in
Appendix A).
It has to be noted that the ultrafiltration results were achieved without addition of activated carbon or flocculants before the membrane. The retention of humic substances, DOC, and reduction in UV-absorption (UVA) by ultrafiltration can be significantly improved by adding flocculants [
13].
Furthermore, the requirements from the German Drinking Water Guideline were not met with ultrafiltration and surface water treatment without flocculation or activated carbon in two parameters, including UVA 436nm, which is an indicator for color and smell.
Humic substances that passed through the membrane were responsible for this, resulting in a slightly yellow color of water, which is measured by UVA.
On the other hand, the smell and taste of the surface water is not affected by the membrane [
11]. In conclusion, exclusive treatment of Elbe River water using ultrafiltration without flocculation/activated carbon will not comply with German drinking water standards.
Microbiological and chemically relevant parameters for drinking water aside from UVA and color did comply with the German Drinking Water Guideline. Thus, in emergencies or regions without strict taste and color requirements, ultrafiltration can be an efficient treatment process for the provision of drinking water. In combination with flocculation or activated carbon, ultrafiltration effectively reduces DOC and UVA [
14]. Disadvantages are increased operating costs through frequent cleaning and increased wastewater.
On the other hand, the results shown here indicate that bank filtration significantly reduces the number of micro-organisms but does not assure complete removal. Therefore, an efficient barrier against bacteria and viruses is essential, especially with regard to reduced residence times of bank filtrate during to floods or increased water abstraction. The advantages of the combination of both treatment processes are the production of safe drinking water independent from the raw water quality and the residence time of the bank filtrate in the aquifer as well as a more efficient operation of the ultrafiltration.
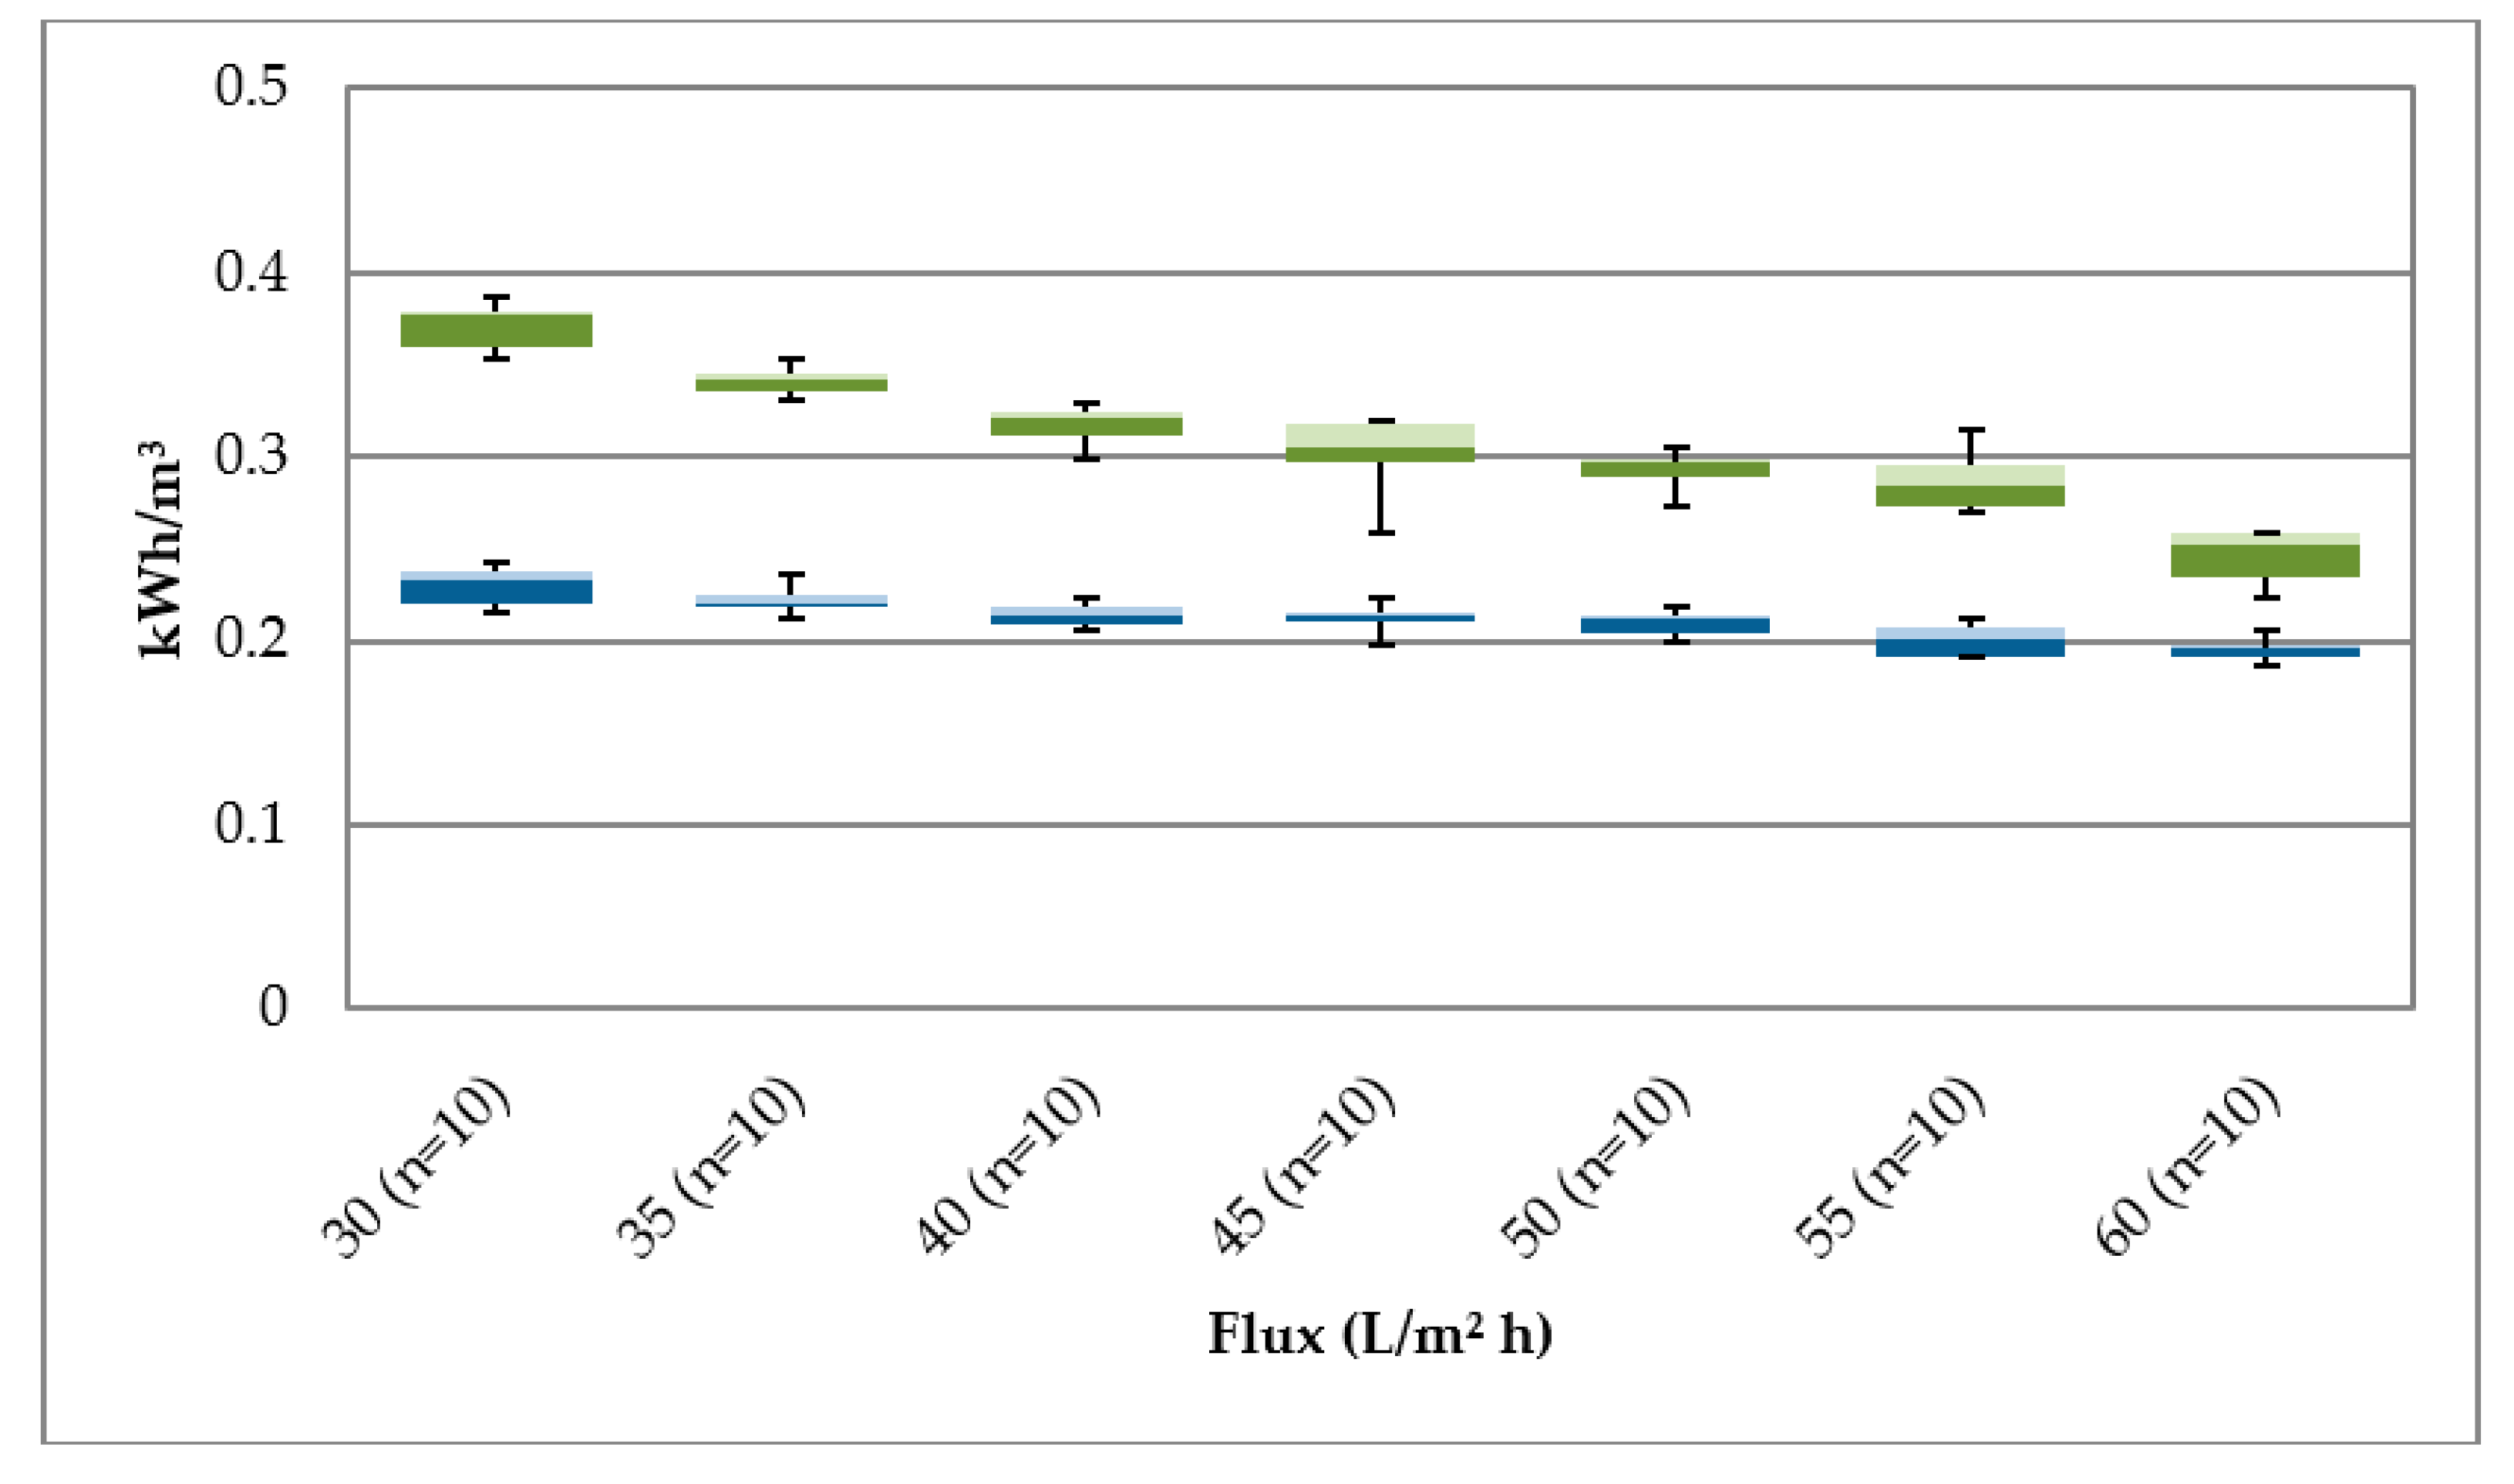
Higher content of particles in the river water leads to a significantly higher fouling potential than during ultrafiltration of bank filtrate.
This means that bank filtration acts as an efficient pre-treatment step for membrane filtration. The reduction of fouling indicators, such as bacteria, DOC, and UVA, as well as particulate matter minimizes the accumulation on the membrane. Bank filtration is comparable to slow sand filtration. Sand filters mainly remove biopolymers, proteins, and polysaccharides, which minimizes the fouling of membranes [
15]. The result is an economically efficient operation compared to direct treatment of surface water. The low fouling potential of the membrane leads to longer filtration times and minimizes wastewater/backwashing. This reduces operating costs. A longer filtration time also leads to a more efficient use of energy in relation to energy consumption and filtrate production. This was demonstrated by the reduction in energy consumption for filtration of river water from 0.25 kWh/m
3 to 0.18 kWh/m
3 for filtration of bank filtrate at a flux of 60 L/m
2 h. The decrease in energy consumption with increasing flux was due to the optimized operating point of the raw water pump in terms of filtration volume and pressure.
The pilot plant’s energy consumption is relatively high, with 0.18 kWh/m
3 at a flux of 60 L/m
2 h even for bank filtrate compared to other ultrafiltration plants with 0.05–0.2 kWh/m
3. One reason could be hydraulic losses due to control valves. Pressure filtration or open filters have an energy consumption of 0.03–0.1 kWh/m
3 and are more energy-efficient [
10,
11]. After upscaling of the ultrafiltration system, a reduction in power consumption is expected. The pre-cleaning of the surface water by bank filtration also results in a reduced use of chemicals. In the case of surface water, chemical cleaning was required weekly. It is estimated that cleaning for bank filtrate is necessary every six months depending on the TMP and water quality. Operation costs are, therefore, reduced, as the life-span of the membrane is increased, which is mainly influenced by the use of chemicals [
16].
Another advantage of ultrafiltration of bank filtrate is the possibility to waive another pre-treatment, such as activated carbon or flocculation. DOC and UVA and, thus, humic substances are significantly reduced by bank filtration. An additional fouling of the membrane is, therefore, avoided. The volume of wastewater is reduced and, thus, the filtration efficiency increased. A disadvantage of bank filtration is the potential increase in dissolved manganese and iron concentration during an anoxic aquifer passage, which has a negative impact on membrane filtration and fouling. Oxidation and precipitation of the solutes in the membrane should be avoided, as it can lead to severe fouling [
17]. Chemically intensive cleanings are necessary in the case of fouling with manganese or iron to completely clean the membrane. One solution could be a pre-oxidation with potassium permanganate or by aeration. This leads to increased operation costs and can increase the fouling on the membrane in the case of an inaccurate reaction sequence [
18]. In principle, this does not apply if the raw water has to be de-acidified.
The filtration system is designed in a way that as little water as possible is vented to prevent the precipitation of manganese or iron. Without air entrainment, the dissolved manganese passes through the membrane without causing fouling. A disadvantage of this approach is the combination of air-permeate backwash during the membrane operation out/in in which dissolved manganese from the bank filtrate would precipitate during the backwash on the filtrate side of the membrane and could lead to irreversible damage to the membrane. Inline-electrolysis produced exactly the backwashing volumes that were needed for the membrane system.
Manganese was oxidized by raising the redox potential and removed from the backwash water via a GSP filter. The additional low chlorine dose in the treated backwash water additionally purified the membrane, which led to a lower fouling potential. The reason for this is that, during each backwash, a short disinfection of the membrane fibres was achieved. Besides the protection of the membrane against manganese precipitation, the biological fouling was minimized. The same results have been seen during filtration of river water. A disadvantage of such a backwash process is that the permanent dosage of chlorine could reduce the life-span of the membrane. Whether such a low dosage of chlorine during a short reaction time of less than 50 s will permanently damage the membrane has not been investigated so far. A long-term study to determine this would be required.
It should also be noted that, aside from the membrane protection against manganese or iron fouling, the determination of the operation costs in terms of the power consumption of the inline-electrolysis is still outstanding compared to the use of chemicals, the fouling potential, and the cleaning performance without IEL.
One point of discussion is the retention of anthropogenic substances, such as drugs or microplastics. Microplastics are by definition completely retained by ultrafiltration membranes; however, nanoparticles are not removed [
19]. A large number of drugs can pass through the membrane [
20]. Studies show that bank filtration significantly removes pharmaceuticals such as antibiotics [
21,
22,
23]. A retention of drugs can be improved with flocculation and/or activated carbon before ultrafiltration [
24]. This supports the statement that drinking water treatment via ultrafiltration without flocculation of surface water is not effective for operational and economic reasons. However, in emergencies, it can maintain the drinking water supply under the aspect of preventing microbiological contamination. The combination of both treatment processes—bank filtration and ultrafiltration—has certain advantages and can offer a safe drinking water supply even under difficult boundary conditions.
5. Conclusions
Direct river water treatment using ultrafiltration was investigated in comparison to using bank filtrate as feed water. Neither bank filtration nor ultrafiltration treatment processes are suitable as single treatment steps for drinking water production under German law at the location of the Elbe waterworks. The combination of both techniques leads to an efficient and economically more feasible treatment for drinking water production. However, membrane filtration cannot compete with open sand filters in terms of energy efficiency. A decision between 100% retention and microbial safety for drinking water compared to a more cost-effective operation by means of open filtration must be made by each operator.
Dissolved iron and manganese in the bank filtrate can enhance fouling of ultrafiltration membranes. Dissolved manganese and iron can be oxidized by inline-electrolysis and then removed by filtration.
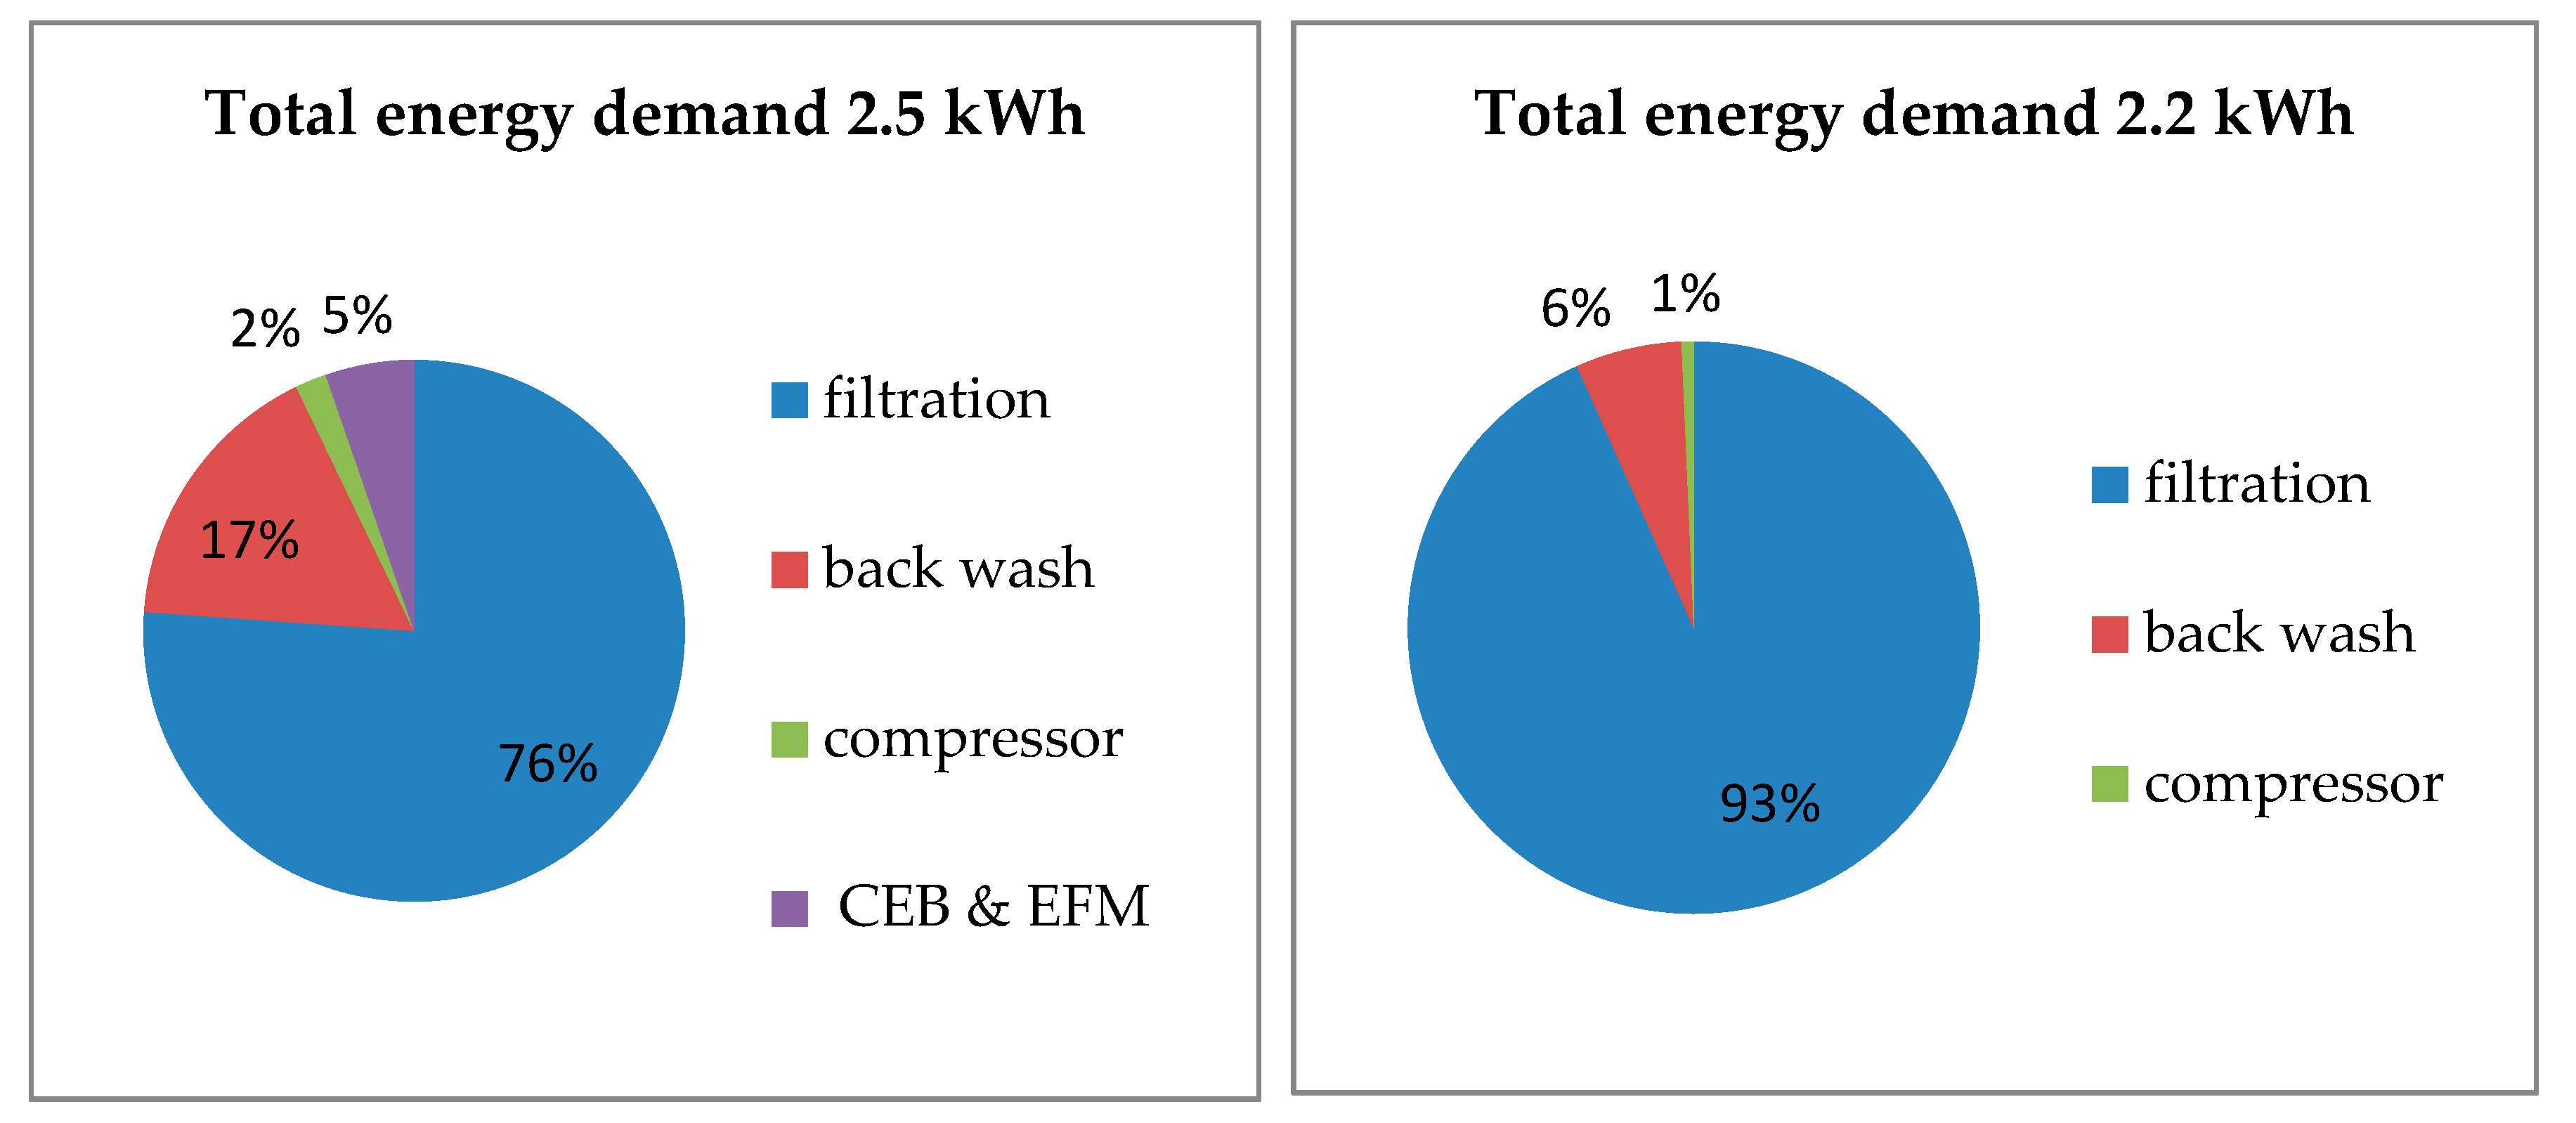
Treatment of bank filtrate using ultrafiltration without pre-treatment, such as flocculation, demonstrated the high performance of the membranes in terms of 100% removal of bacteria and turbidity with an energy consumption of 0.18 kWh/m3 at a flux of 60 L/m2 h (Q = 20.8 m3/h).
The results of the research project AquaNES for the combination of natural and technical treatment processes are intended to serve as indicators for potential process design for water suppliers and constructors for drinking water treatment.
Limits and operational boundary conditions of ultrafiltration in the out/in operation have been demonstrated for the combination of bank filtration and ultrafiltration.
A reference is given for a meaningful use of such a combination in water treatment in the context of the achievement of requirements.


