Article

Time-Averaged Turbulent Velocity Flow Field through the Various Bridge Contractions during Large Flooding

1
Korea Institute of Civil Engineering and Building Technology, Goyang 10223, Korea
2
School of Urban and Civil Engineering, Hongik University, 94 Wausan-ro, Mapo-gu, Seoul 04066, Korea
3
Department of Civil and Environmental Engineering, West Virginia University, 1306 Evansdale Drive, Morgantown, WV 26506, USA
*
Author to whom correspondence should be addressed.
Water 2019, 11(1), 143; https://doi.org/10.3390/w11010143
Submission received: 18 December 2018 / Revised: 8 January 2019 / Accepted: 11 January 2019 / Published: 15 January 2019
(This article belongs to the Special Issue Advances in Hydraulics and Hydroinformatics)

Abstract

:
Extreme rainfall events, larger than 500-year floods, have produced a large number of flooding events in the land and also close to the shore, and have resulted in massive destruction of hydraulic infrastructures because of scour. In light of climate change, this trend is likely to continue in the future and thus, resilience, security and sustainability of hydraulic infrastructures has become an interesting topic for hydraulic engineering stakeholders. In this study, a physical model experiment with a geometric similarity of the bridge embankments, abutments, and bridge deck as well as river bathymetry was conducted in a laboratory flume. Flow conditions were utilized to get submerged orifice flow and overtopping flow in the bridge section in order to simulate extreme hydrologic flow conditions. Point velocities of the bridge section were measured in sufficient details and the time-averaged velocity flow field were plotted to obtain better understandings of scour and sediment transport under high flow conditions. The laboratory study concluded that existing lateral flow contraction as well as vertical flow contraction resulted in a unique flow field through the bridge and the shape of velocity profile being “fuller”, thereby increasing the velocity gradients close to the bed and subsequently resulting in a higher rate of bed sediment transport. The relationships between the velocity gradients measured close to the bed and the degree of flow contraction through the bridge are suggested. Furthermore, based on the location of maximum scour corresponding to the measured velocity flow field, the classification of scour conditions, long setback abutment scour and short setback abutment scour, are also suggested.

1. Introduction

Usually, bridge foundation failure occurs due to the processes of (1) contraction scour-scouring across the entire channel due to the flow contraction caused by the bridge opening and deflection of floodplain flow into the main channel and (2) local scour at the base of piers and abutments caused by local flow contraction, down flow, and formation of a horseshoe vortex that wraps around the obstructions. Thus, the contraction scour and the local scour (pier scour and abutment scour) have been considered as two separate types of scour caused by different processes.
However, recent studies [1,2] show that abutment scour can be expressed as one type of contraction scour, not as a fundamental mechanism of local scour. When flow area is reduced by the bridge opening, velocity and bed shear stress are increased in order to satisfy continuity and momentum equations. The higher velocity resulted in increased erosive force, so more bed material is removed from the contracted section. In addition to the higher velocity due to the flow contraction, local flow structures associated with the base of the abutment result in additional erosion around the abutment. Due to the local flow structures, the scour depth near the upstream edge or corner of the abutment is usually deeper than that near the center of the channel. Thus, the combined effect of flow contraction as well as the local flow structure around an abutment made the problem of abutment scour more challenging. Although some researchers have suggested the need for more research on the subject of local flow structures and velocity distribution, past studies [3,4,5,6,7,8,9,10] have provided acceptable insight for the mechanisms of local flow structure around single and a group of bridge foundations under free flow conditions. However, for high flow conditions such as in an extremely hydrologic event, there is no widely applicable abutment scour formula, and the term has not been distinctly defined because of difficulties in understanding the complicated flow and scouring mechanism combined with complex geometries of bridge and various flow conditions.
Furthermore, a lot of research on bridge scour has focused only on simple and idealized situations where the bridge is placed in straight rectangular channels, even though many bridges are sited in non-rectangular channels whose geometry and hydraulic characteristics are site-specific in the real world. Thus, in this study, scour experiments were carried out in a compound channel cross-section using various lengths of bridge under free-surface flow (F) as well as in submerged orifice flow (SO), and overtopping flow (OT) cases. To investigate the effect of bridge submergences during large flooding scenarios, a bridge deck model was constructed based on the bridge design and dimensions commonly used in a rural region in the United States (USA). To understand the complex flow physics through the bridge, three components of velocities were measured by acoustic Doppler velocimeters (ADV).
The experimental results show new insights into the velocity flow field through the scour-critical bridges subject to the submerged orifice flow and overtopping flow during extreme flooding events. It is shown that vertical flow contraction by submerged flow resulted in a unique flow field through which the bridge and the shape of vertical velocity profile are “fuller” and thereby push the location of the maximum velocity closer to the bed, increasing the shear stress and erosion. Because the unique shape of velocity profile under the submerged flow causes higher erosion rate on the bed, examination of the relationships between the velocity gradient measured close to the bed and the non-dimensional parameters commonly used for the contraction scour is suggested to understand the effect of local flow variables on the scour. Furthermore, with the locations of the maximum scour corresponding to the measured velocity flow field, the scour conditions, long setback abutment scour and short setback abutment scour were classified for the practitioners to use in bridge design.

2. Methodology

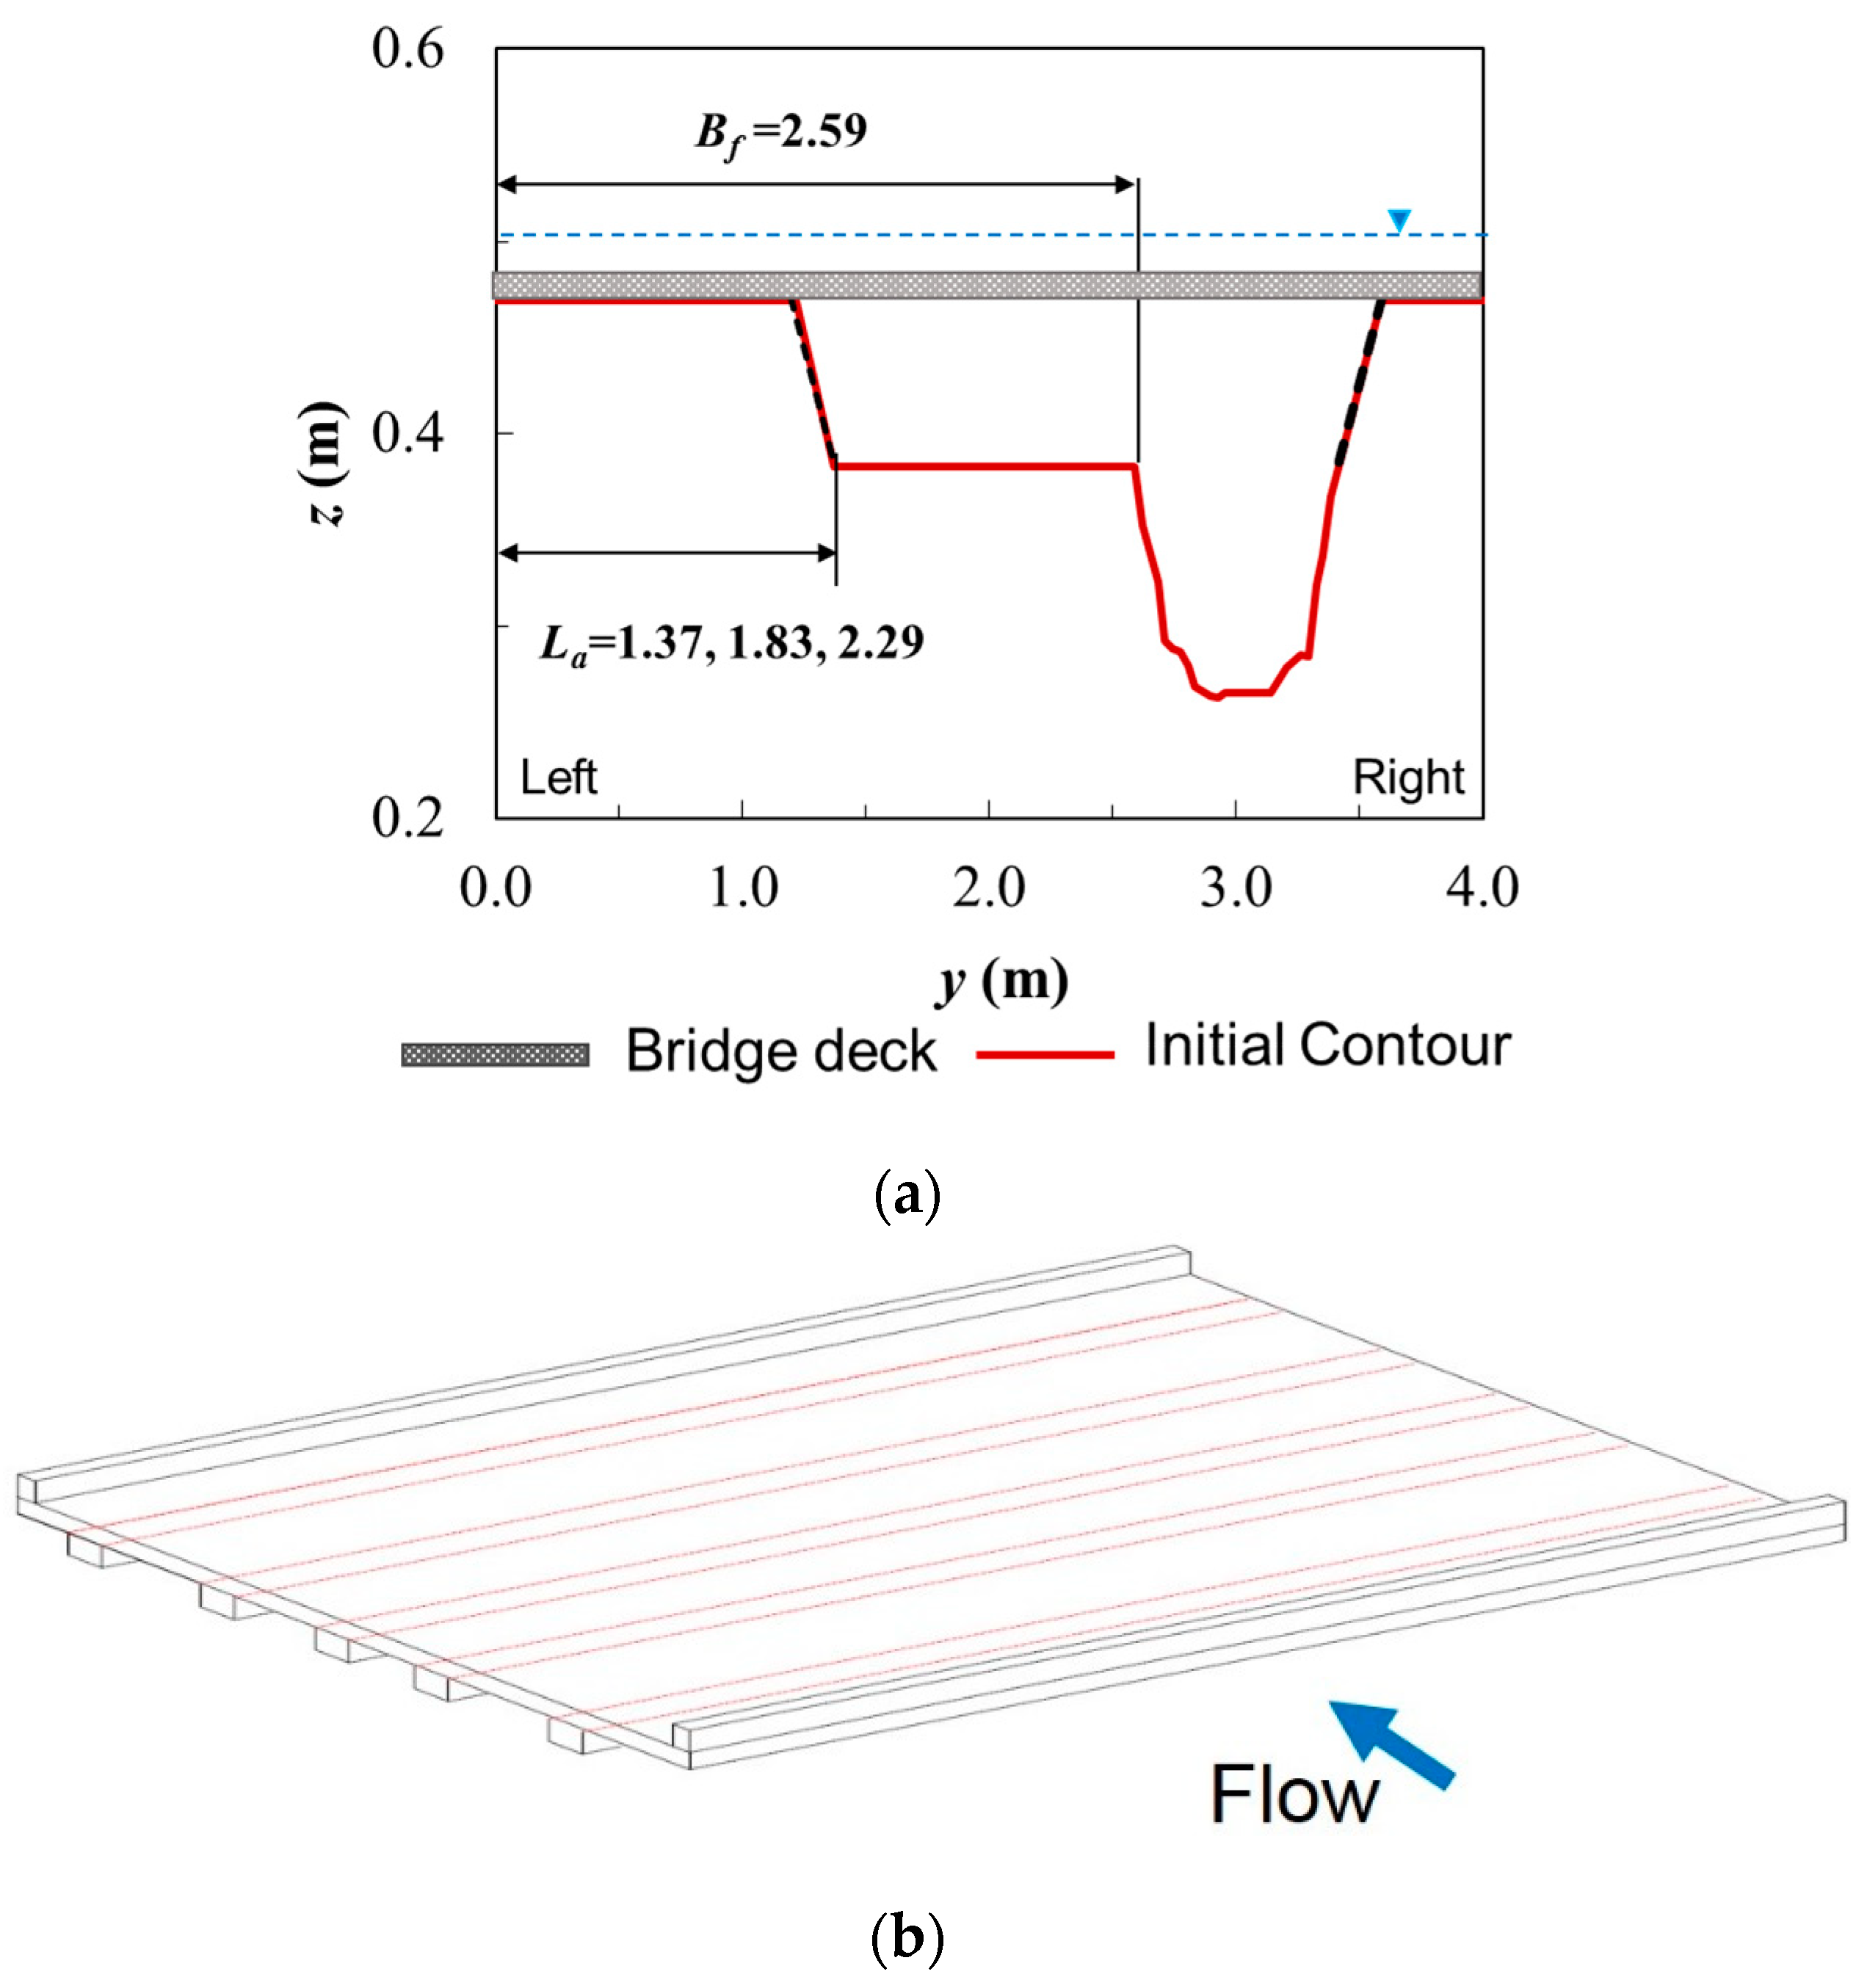
2.1. Experimental Setup

In a previous study [11,12,13], laboratory experiments were carried out using a 1:60 scaled hydraulic model of the Towaliga River bridge at Macon, Georgia, USA including the full river bathymetry. The field data including measured discharge, bed elevation of cross sections, and gage height from the United State Geology Service (USGS) were reproduced by Froude number similarity. The previous experimental results showed that the hydraulic model can reproduce field scour data.
For the current set of experiments, the cross section shape and river geometry used in the previous experiments were slightly simplified and modified for the experiments to address more general features of the velocity flow field. The shape of the floodplain was horizontal on both sides of the main channel cross-section while preserving the original parabolic shape of the main channel. Also, the channel was constructed to have a straight alignment rather than meandering and all the piers were removed to be able to focus on the abutment scour. Figure 1 shows the modified laboratory model for the experiment in the flume and initial contour before the scouring experiment.
The approach channel upstream of the bridge was 11 m long followed by a working mobile bed section with a length of approximately 5.2 m in which the bridge model was placed. The fixed bed approach section was filled with 3.3 mm of gravel, and the 5.2 m moveable bed working section was filled with sand with d50 = 1.1 mm and σg = 1.3, where d50 and σg is the median diameter of sand and the geometric standard deviation often to describe the grain size distribution. To ensure a fully developed boundary layer at the bridge approach section consistent with the moveable bed sediment size, the fixed-bed approach channel consisted of a surface layer of fixed 1.1 mm sand having a depth of 3 cm. Based on the results, the approach channel has enough length to obtain a fully developed turbulent flow before reaching the moveable bed section. The range of approach section length/flow depth is 80 to 150, and the velocity measurements in the approach of the bridge, measured 3 m upstream of the bridge, shows perfect logarithmic velocity profiles for all the experimental cases (R2 = 0.99) [14]. At the downstream of moveable bed section, there is 1.6 m long sediment trap section; this section trapped the sediment transported out of the working moveable bed section.
The model of the embankment and abutment was constructed as an erodible fill with rock riprap protection [1,2,14]. Three different lengths of erodible-embankment/abutment were modeled to simulate wide range of flow contractions on the left floodplain, but on the right floodplain, the toe of the abutment was maintained at the bankline for all experiments. This arrangement allowed the study of bankline abutment as well as setback abutments in the floodplain simultaneously under realistic geometric conditions similar to in the field. Based on the above modifications, abutment and embankment lengths and river bathymetry to be modeled in the laboratory were constructed as shown in Figure 2a. The ratio between abutment lengths (La) to the floodplain width (Bf), La/Bf, varied from 0.53 to 0.88 in the left floodplain. One of the main purposes of this study is to find the effect of velocity flow field on scour through the bridge for extreme hydrologic conditions. In those extreme conditions, overtopping or submerged orifice flow is likely to occur at the bridge. To simulate those extreme cases, the following dimensions normally used in a bridge design in rural region were used for the model bridge deck.
(a)
Width of bridge deck 12.2 m, in accordance with standard two-lane roads;
(b)
Bridge barrier 0.61 m high with 0.46 m top without sidewalks on non-bicycle routes;
(c)
Slab depth of 0.46 m including the pavement;
(d)
Girders 0.43 m wide and 0.46 m deep with 2.74 m spacing.
These design dimensions are commonly used for rural region two-lane bridges. Based on the prototype dimension, the 1:45 length scale bridge deck was constructed as shown in Figure 2b and a solid bridge deck model was supported and leveled with respect to an upper support beam as shown in Figure 1a.

2.2. Experimental Procedure

After completion of laboratory setup, the flume was filled with water slowly enough to saturate sand in working moveable-bed section without changing the original contours. After complete saturation, the initial bed elevations were measured in detail throughout the test section using an ADV and a point gage. The ADV gives distance from the sampling volume to the bed, which can be converted into elevation relative to the fixed datum by reading the point gage. After that, the required discharge and a flow depth larger than the target value were set by using a magnetic flow meter and by adjusting a tailgate, respectively, to prevent un-expected scour (erosion) while the experimental condition was set. Then, the tailgate was lowered slowly enough to achieve the target value of flow depth without abrupt water depth change. During this time, the point gage and/or wave gage mounted on the instrument carriage were used to measure the flow depth. Once the target flowrate and flow depth had been reached, the experiment was continued for five to six days until equilibrium scour was achieved (change in scour depth less than 2% within 24 hour). At the end of experiment, the equilibrium bed elevations were measured in the same way as in the initial bed-elevations measurements using the ADV and the point gage. The end of the experiment was defined when the scour depth reached the equilibrium state at which there were negligible changes in bed elevation with time. Once each experimental study was completed, the original river model was re-constructed, and scour experiment was re-started under same procedure as explained above using different flow variables. Total eighteen experimental conditions were used for the scour experiments to satisfy the purpose of the research.
Then, after the moveable bed experiments, the complete river bathymetry was modeled with a fixed-bed channel by spraying it with polyurethane. In the fixed-bed experiments, water surface profiles and velocities were measured to address the initial hydraulic conditions. Figure 1b shows the velocity measuring cross section (C.S. 1 and C.S. 2) along the bridge. Velocities were taken every 15 cm laterally in both the floodplain and the main channel. A minimum of six measuring points in each vertical profile and as many as 15 points were measured at both C.S. 1 and C.S. 2. With a similar way as in the bridge section, velocities were also measured at 3 m from the upstream face of the bridge for the approach flow velocity. During the velocity measurements, correlation values in these experiments were greater than 80% and the Signal Noise Ratio (SNR) was greater than 15. The sampling frequency of the ADV was chosen to be 25 Hz with a sampling duration of two minutes and perhaps as much as five minutes depending on the turbulence at each measuring location [14,15,16,17,18,19]. The phase-space despiking algorithm of Goring and Nikora [20] was also employed to remove any spikes in the time record caused by aliasing of the Doppler signal, which sometimes occurs near a boundary.

3. Results and Discussion

Initial hydraulic parameters measured in fixed bed have been summarized in Table 1: Q is the total discharge; Vf1/Vfc1 and Vm1/Vmc1 is approach flow intensity in the floodplain and in the main channel, respectively, where Vf1 and Vm1 is approach flow velocity and Vfc1 and Vmc1 is approach flow critical velocity calculated by Keulegan’s equation; yf1 and ym1 is the water depth of floodplain and main channel in the approach section, respectively; qf2/qf1 and qm2/qm1 is unit discharge contraction ratio in the floodplain and main channel, respectively; W is the setback distance; Lm is the traverse distance from the toe of the abutment to the maximum scour hole depth. The definition sketch for the variables are shown in Figure 3.
As shown in Table 1, in the first three runs, the value of Vf1/Vfc1 (approach flow intensity parameter) was similar. The experimental plan was to reproduce increasing tailwater with increasing discharge according to a tailwater rating curve, just as would occur in the field moving from F to SO to OT flow. The experiments were conducted in such a fashion that Vf1/Vfc1 was held constant in the floodplain for a series of runs encompassing the three flow types for a given abutment length. This arrangement allowed us to find the effect of different flow types in scour because three flow types were encountered for different value of discharge and water depth, but their approach flow intensity parameter remained nearly constant for the three runs. The same conditions were also applied to other sets of the experiment. As explained in Hong et al. [2], the magnitude of maximum scour depth increased as the flow type changed from free flow (F) to submerged orifice flow (SO) and then decreased again for overtopping flow (OT) while holding the flow intensity (Vf1/Vfc1) constant. This pattern can be found in Figure 4. The scour depth is decreased in OT compared to SO even if the discharge is higher. This can be explained by the flow relief over the deck in OT rather than under the bridge. In most cases, the value of maximum scour depth was greater for OT flow than for F flow depending on the fraction of the total flow going under the bridge.

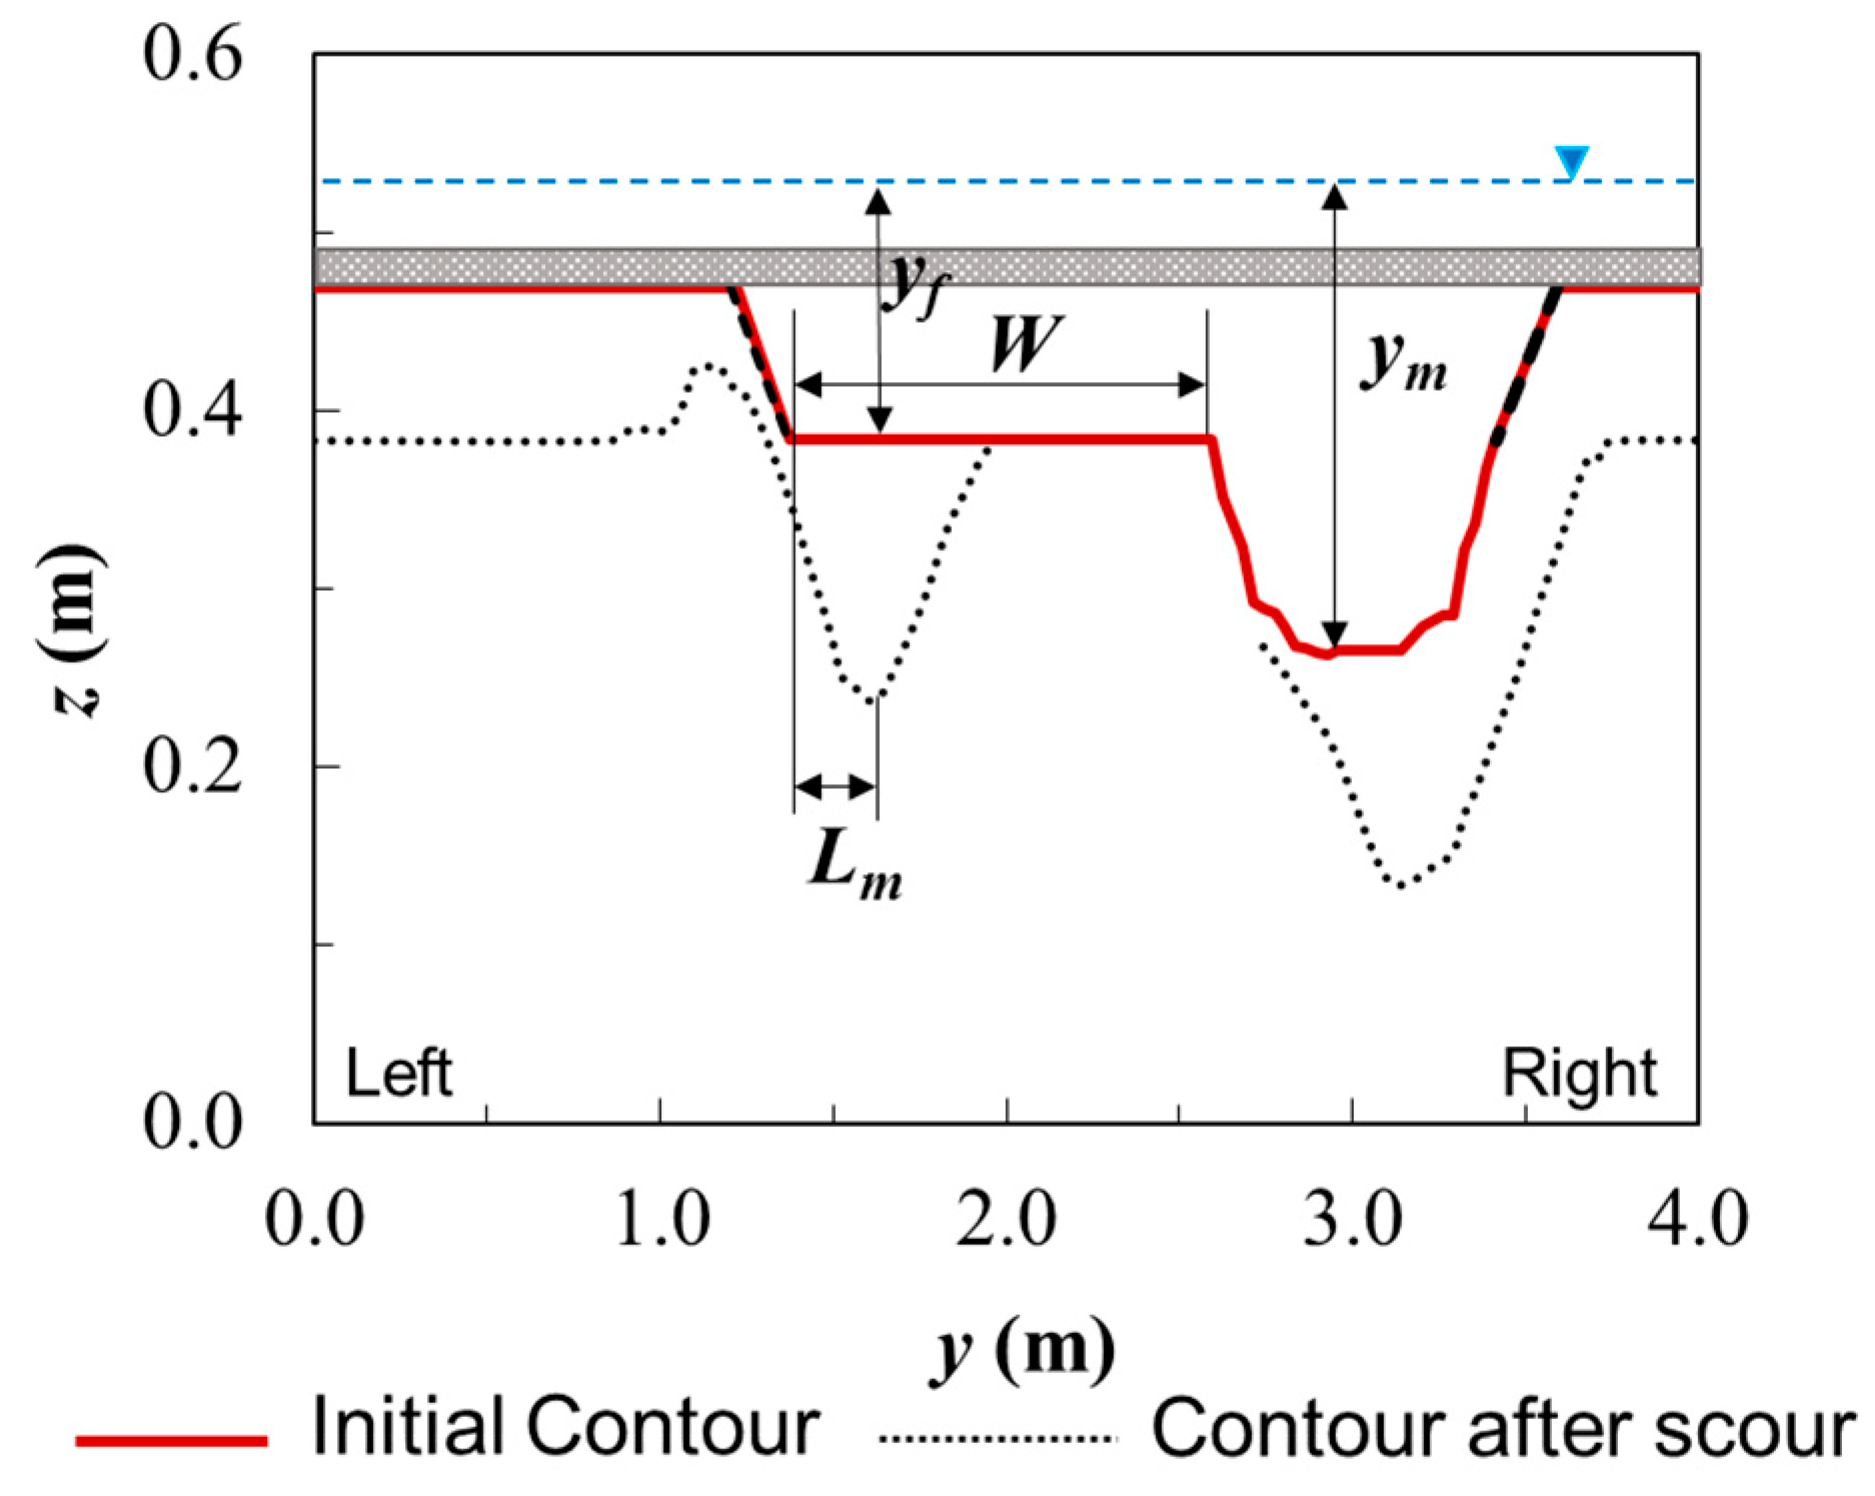
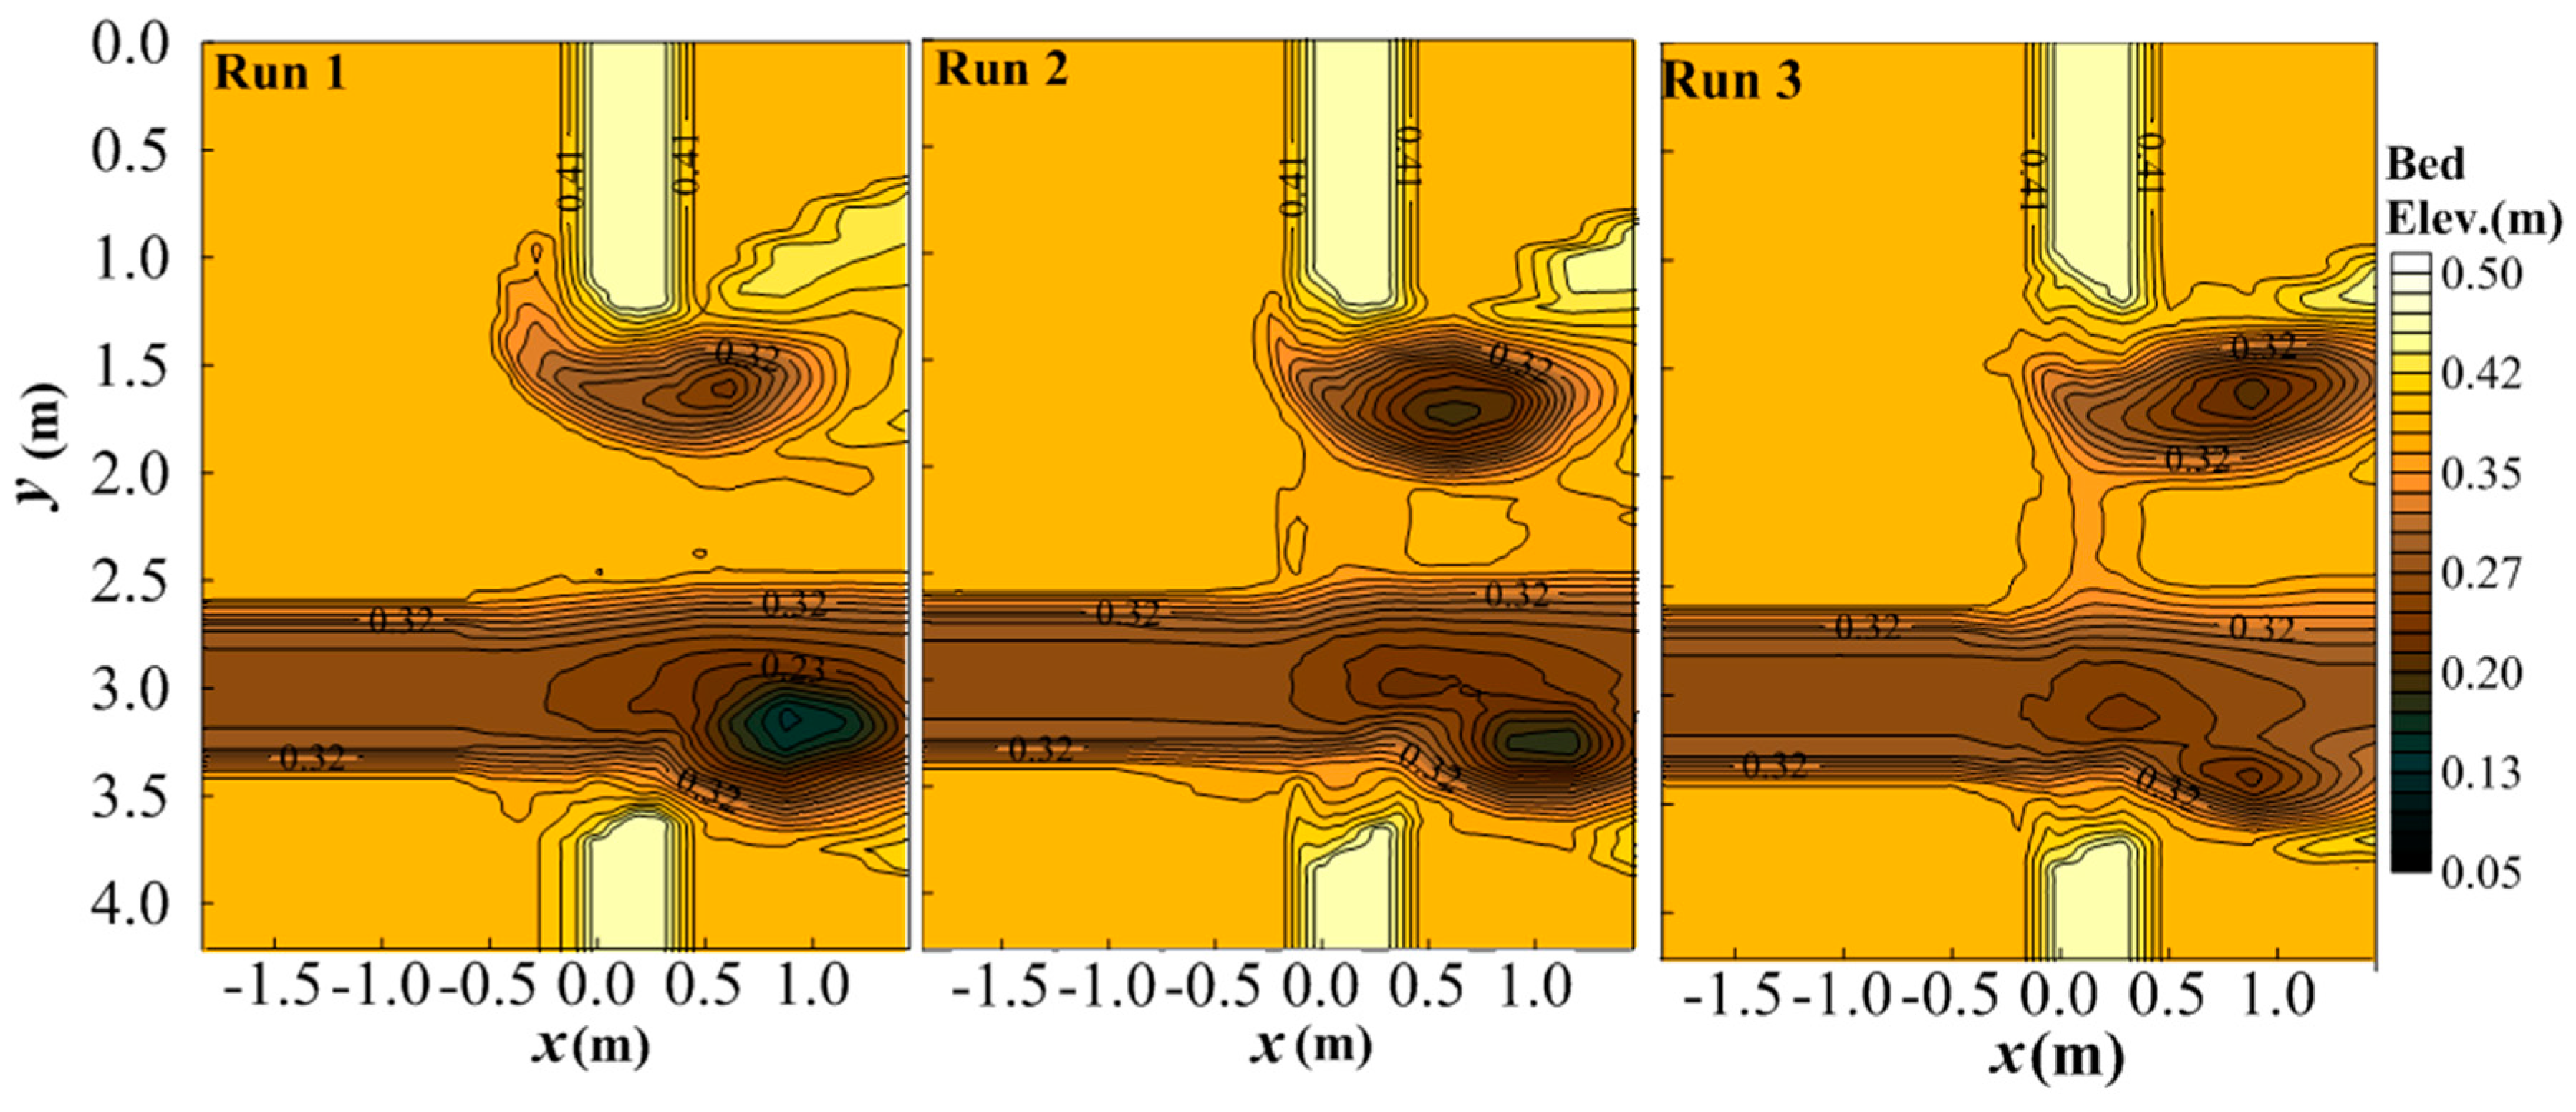
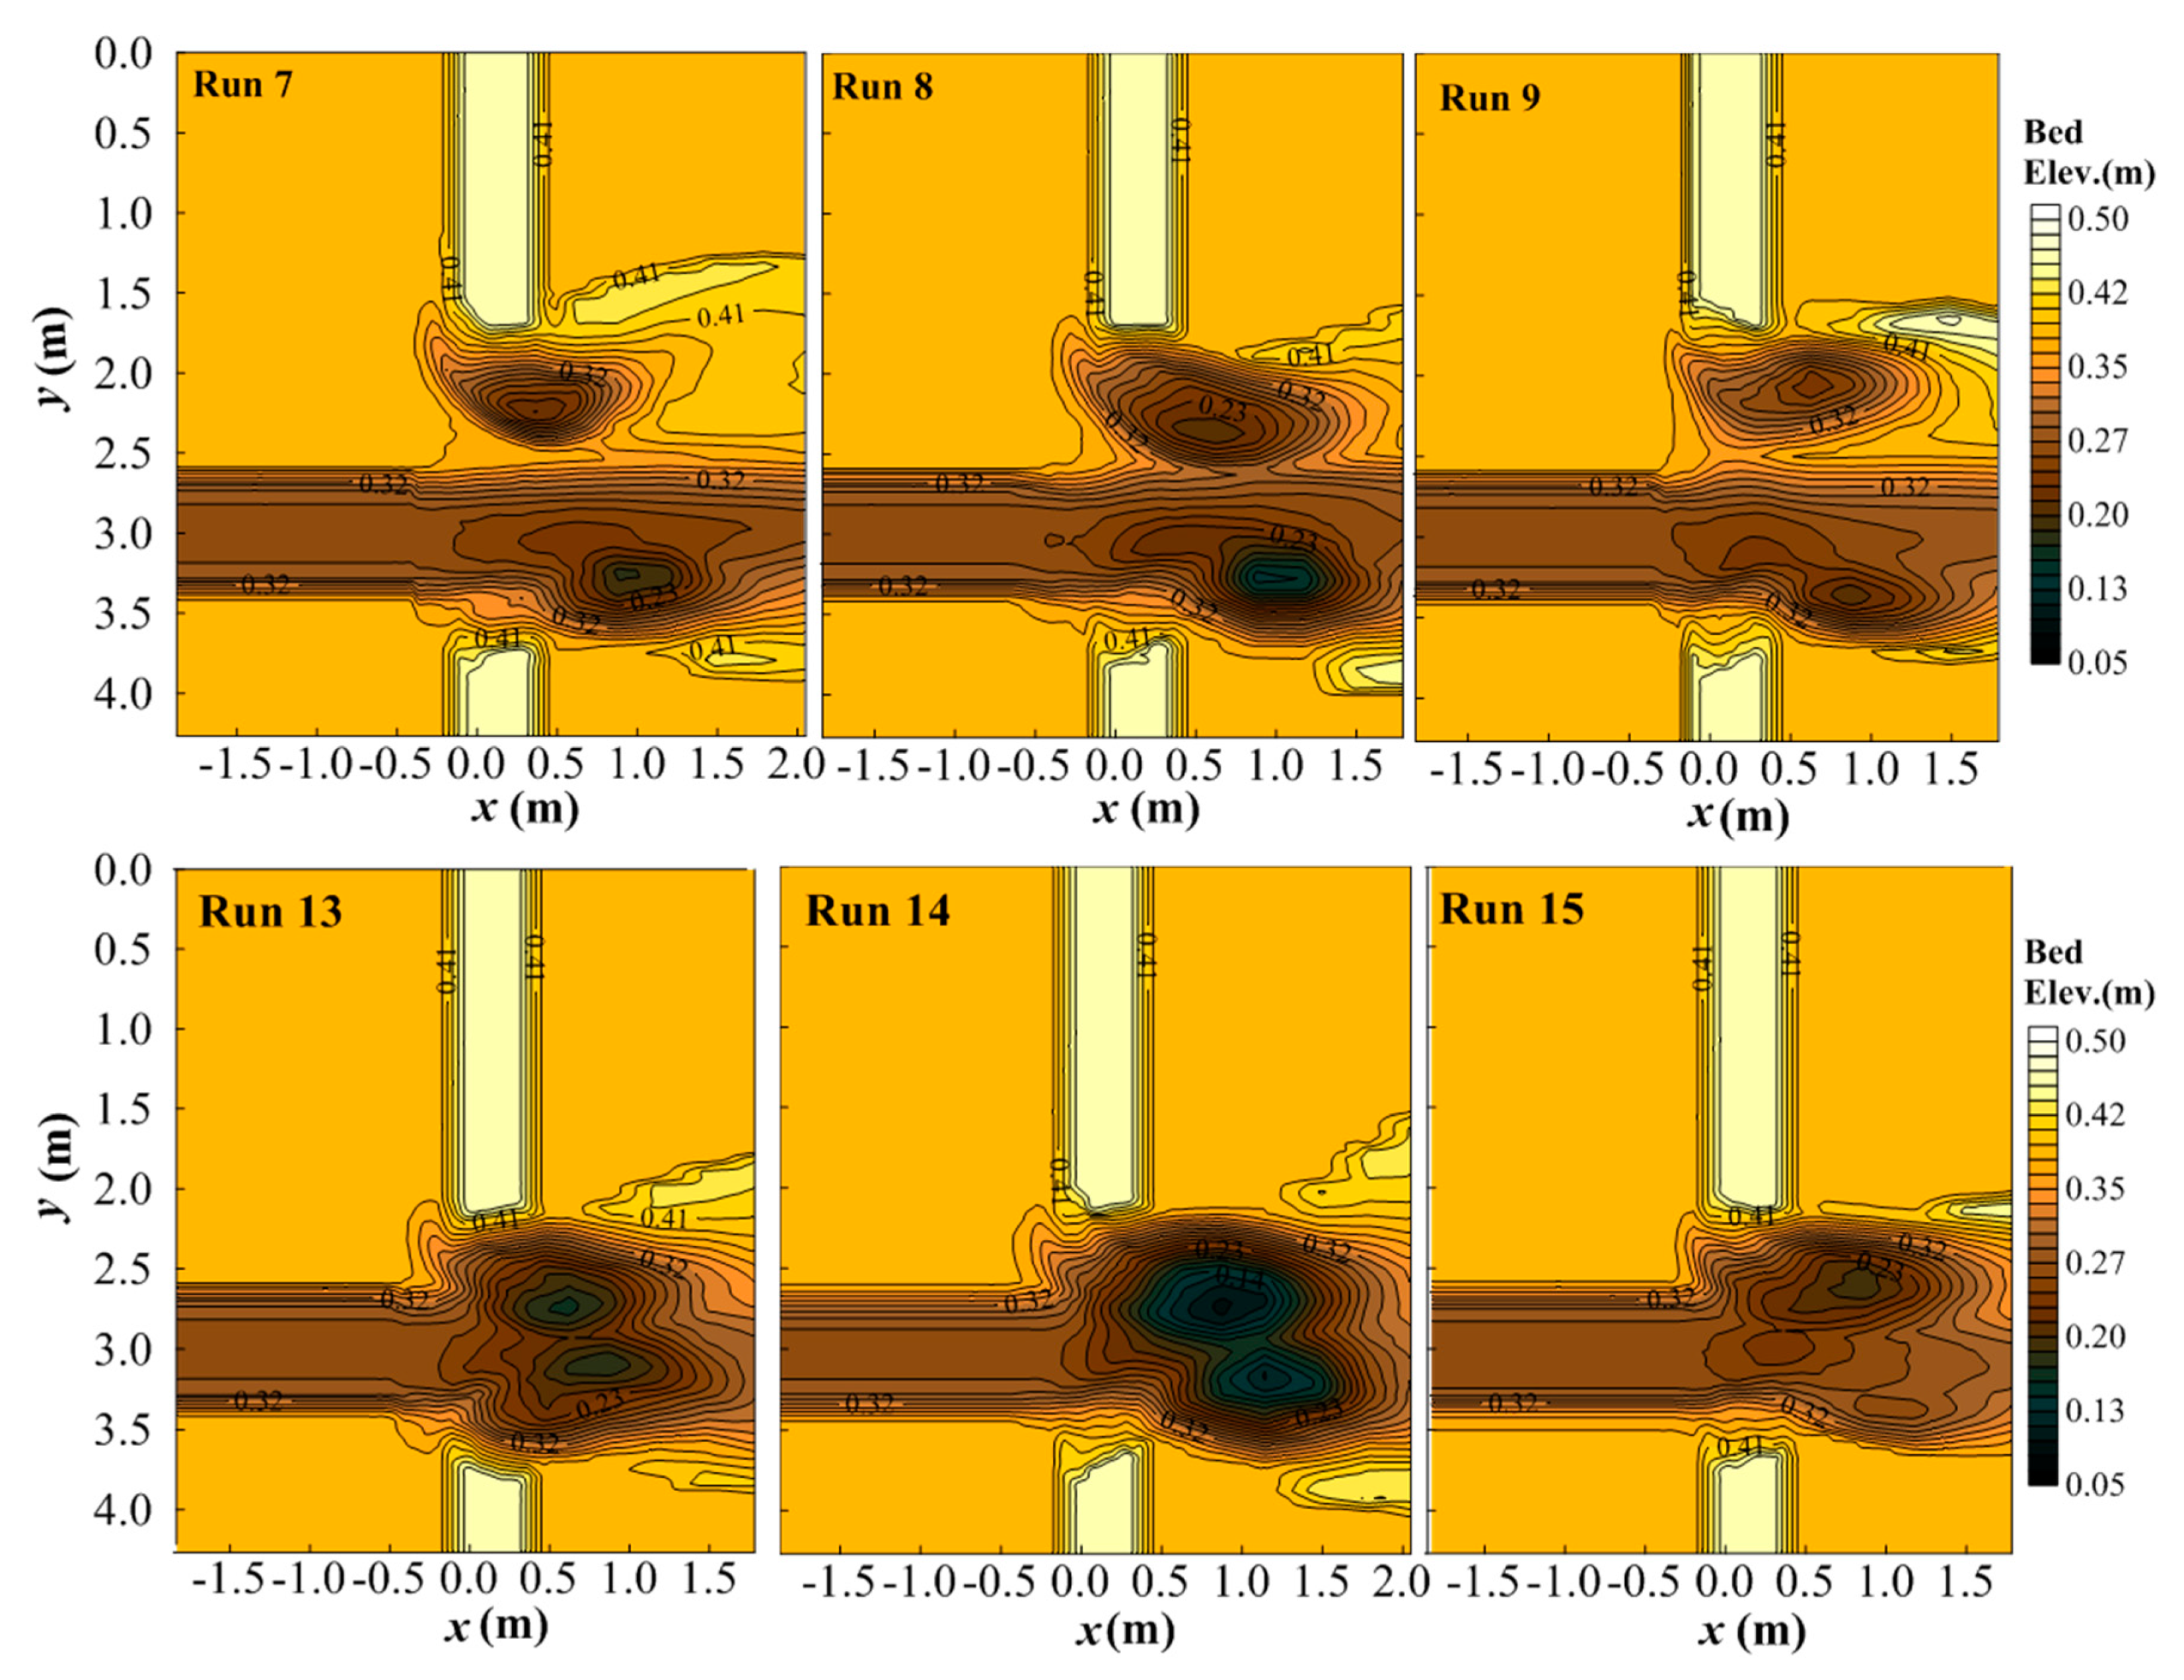
3.1. Classification of Abutment Scour

Figure 4 shows the selected bed contours after each run. Based on the findings from Hong [14], the scour hole moved downstream from the abutment over time and the region of the deepest scour hole was located near the downstream region of the abutment. Because the scour process differed depending on the flow type over time, the detailed location of the deepest scour depth was case dependent. However, a similar trend can be deduced with respect to the shape of the scour hole and locations of the maximum scour depth in the experiments conducted with the same length of abutment. As shown in Figure 4, for runs 1, 2, and 3, the scour hole shape in the left floodplain showed curvature around the abutment, and the resulting point of the maximum scour was located downstream of the abutment. Similar findings can be applied for runs 7, 8, and 9. However, for runs 13, 14, and 15 with a longer abutment, the scour hole initially developed around the upstream corner of the abutment, the same as in the other runs, and then moved along the toe of the abutment in the left floodplain. However, as the scour hole elongated diagonally from the face of the abutment over time, the resulting point of maximum scour hole depth terminated at the bankline of the main channel, thus, the maximum scour depth in equilibrium was located inside the main channel on the bank side slope. For the bankline abutment in the right floodplain when looking downstream, the maximum scour depth can be found around the main channel side slope downstream of the bridge.
As explained in the previous paragraph, the location of maximum scour depth around the abutment varies in accordance with the length of abutment because the velocity flow field developed by the geometrical characteristics of an abutment is a leading factor to define the location of maximum scour depth. Thus, Melville and Coleman [4] classified the abutment to account for the effect of abutment/embankment length on the scour depth. In their classification, Case A applies to the abutment sited in a rectangular channel, while Case B represents the abutment that is sited on a floodplain and extended into the main channel. Case C is an abutment set well back from the main channel such that all scour takes place on the floodplain only. Case D is the limit of Case B and C where the abutment protrudes out to the edge of the main channel. Also, Chang and Davis [21,22] classified the abutment by the three categories as short, intermediate and long depending on the value of the setback distance and assumed that converging flow under the bridge with the abutment near the channel bank (long abutment) is mixed with the flow in the main channel and distributed uniformly. On the other hand, if the abutment is set well back from the channel bank, it is assumed that the overbank flow and the main channel flow remain separated from each other and do not mix as the flow passes under the bridge. Similar as in the previous research, scour conditions are classified as three cases, Condition A, Condition B, and Condition C in this study, but instead of using the length of the abutment, the scour conditions were classified in accordance with the location of maximum scour hole with respect to geometric ratio between length of abutment and width of the floodplain.
To find whether the maximum scour hole occurs in the floodplain or in the main channel, the non-dimensional value of W/yf1 was compared with Lm/yf1. When the value of Lm/yf1 is larger than that of W/yf1, the location of maximum scour hole is in the main channel. The maximum value of Lm/yf1 in all experiments is 5.84 in Run 13, as shown in Table 1. Thus, if the value of W/yf1 is smaller than approximately 6, the location of the maximum scour hole is expected to be outside of the floodplain. Thus, based on the findings in this study, clear water abutment scour conditions can be classified as: Condition A - long setback abutment scour; Condition B - bankline abutment scour; and Condition C - short setback abutment scour. The detailed descriptions and classification in terms of the ratio of setback distance (W) to the approach flow depth in the floodplain, W/yf1, in this study are given below:
  • Condition A (W/yf1 > 6, La/Bf = 0.53 and 0.77): In a long setback abutment, scour occurs in the floodplain only, well removed from the main channel;
  • Condition B (W/yf1 = 0, La/Bf = 1.0): For a bankline abutment, maximum scour occurs in the main channel of a compound channel;
  • Condition C (W/yf1 < 6, La/Bf = 0.88): In a short setback abutment, scour occurs on the floodplain in the initial stage, but maximum scour at equilibrium occurs in the main channel because the setback distance is short.

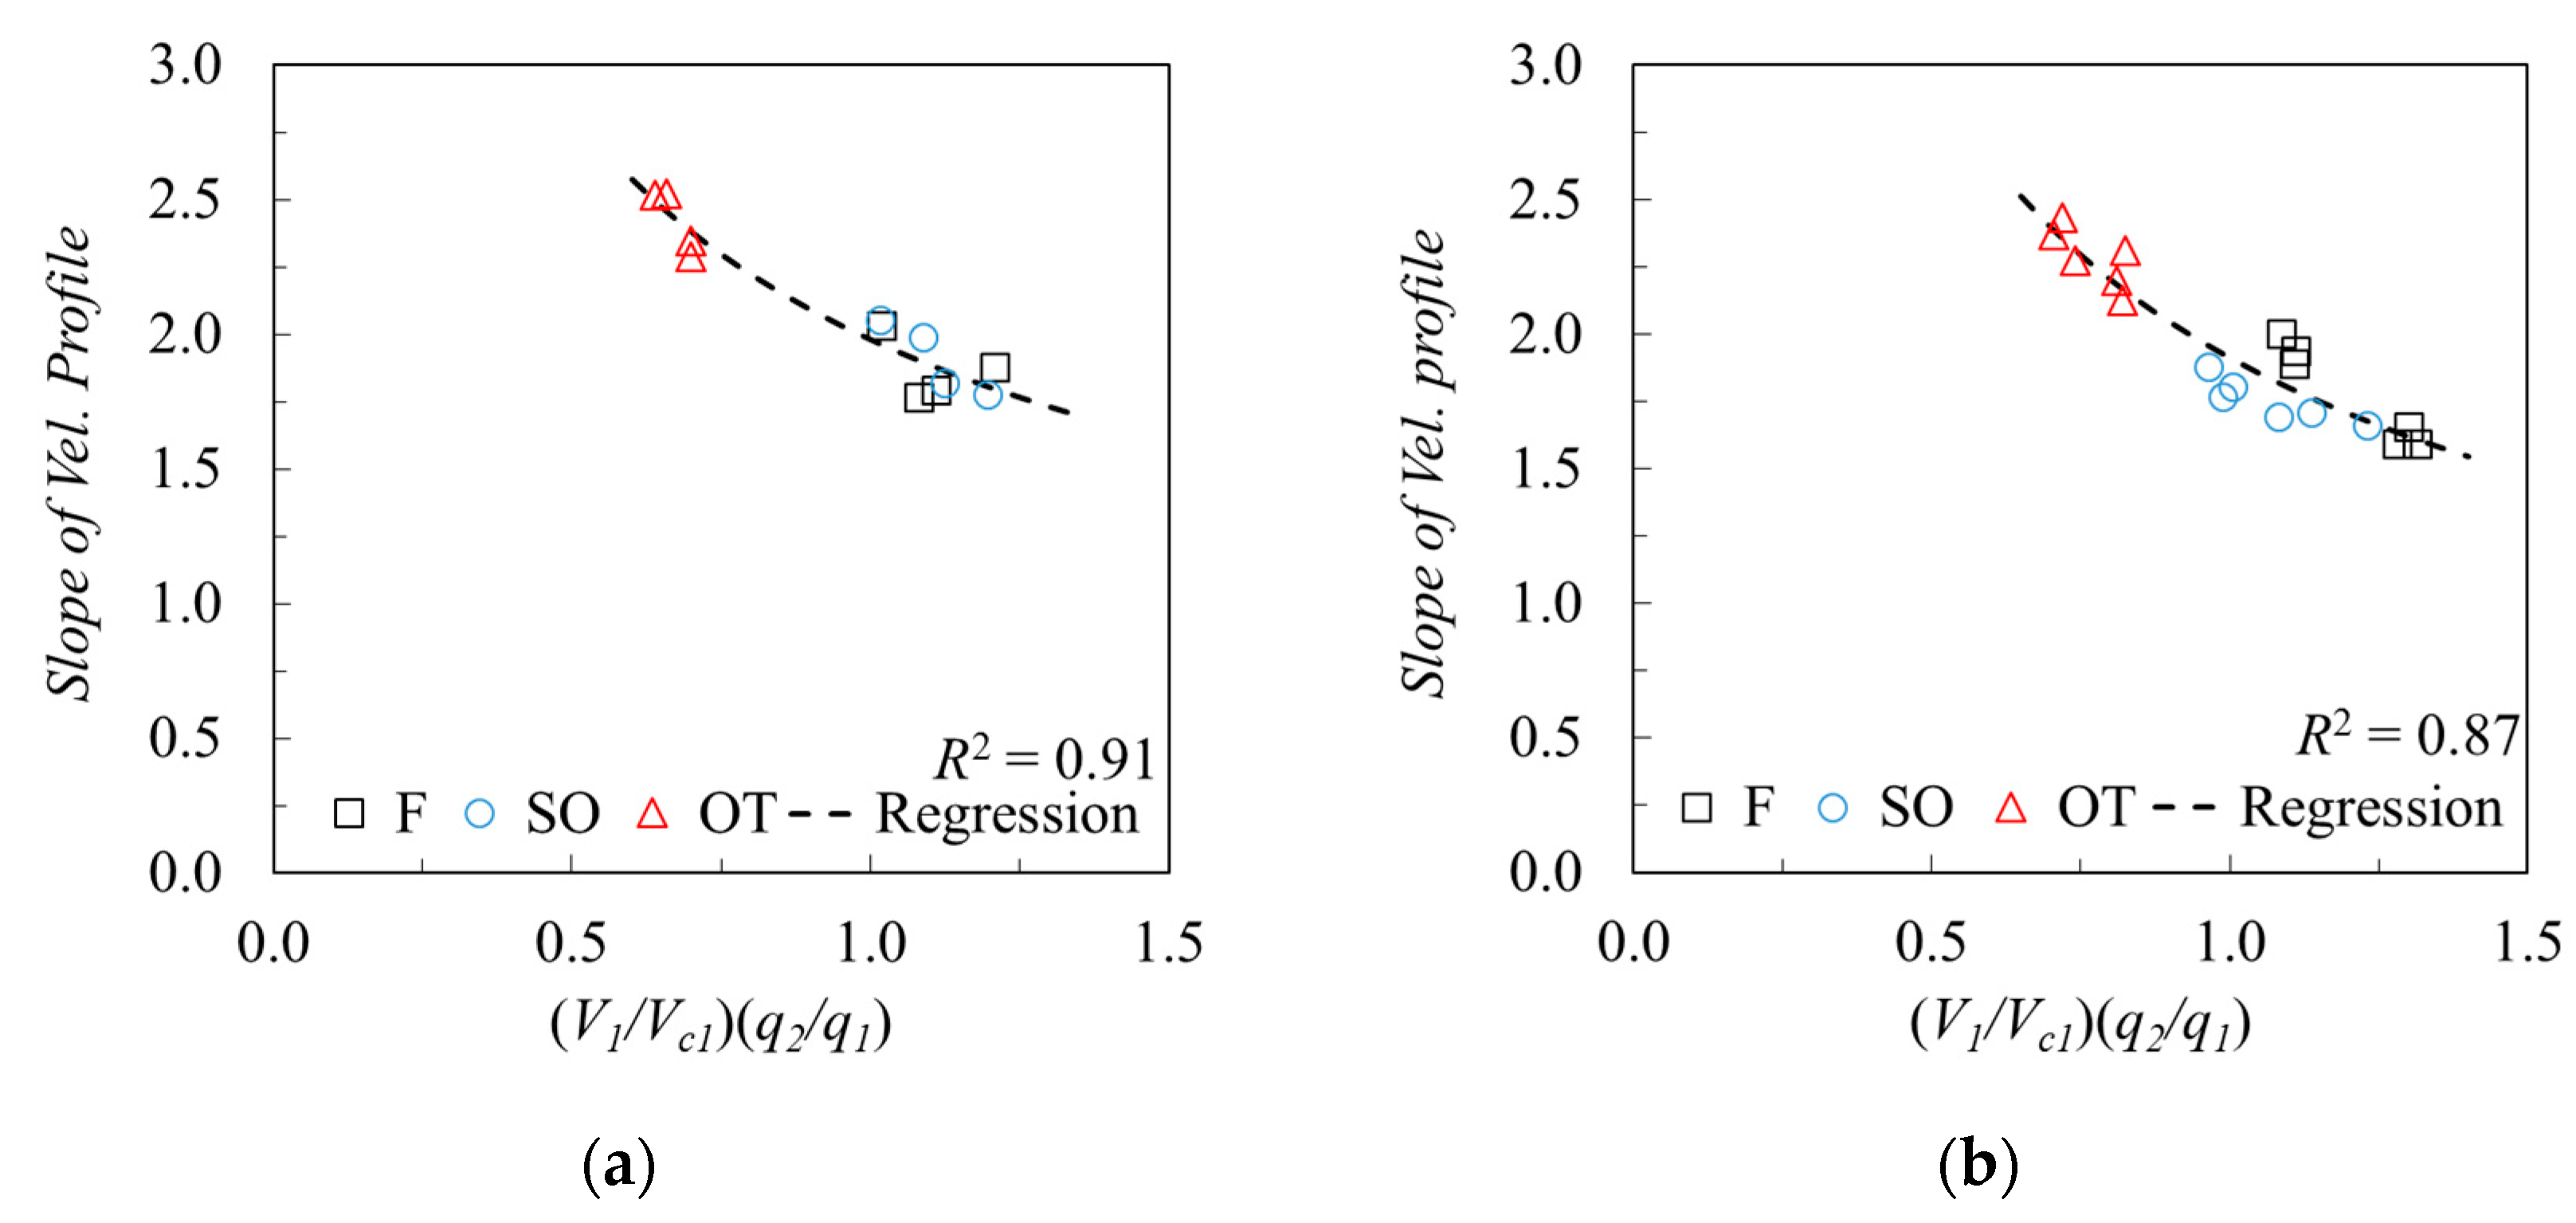
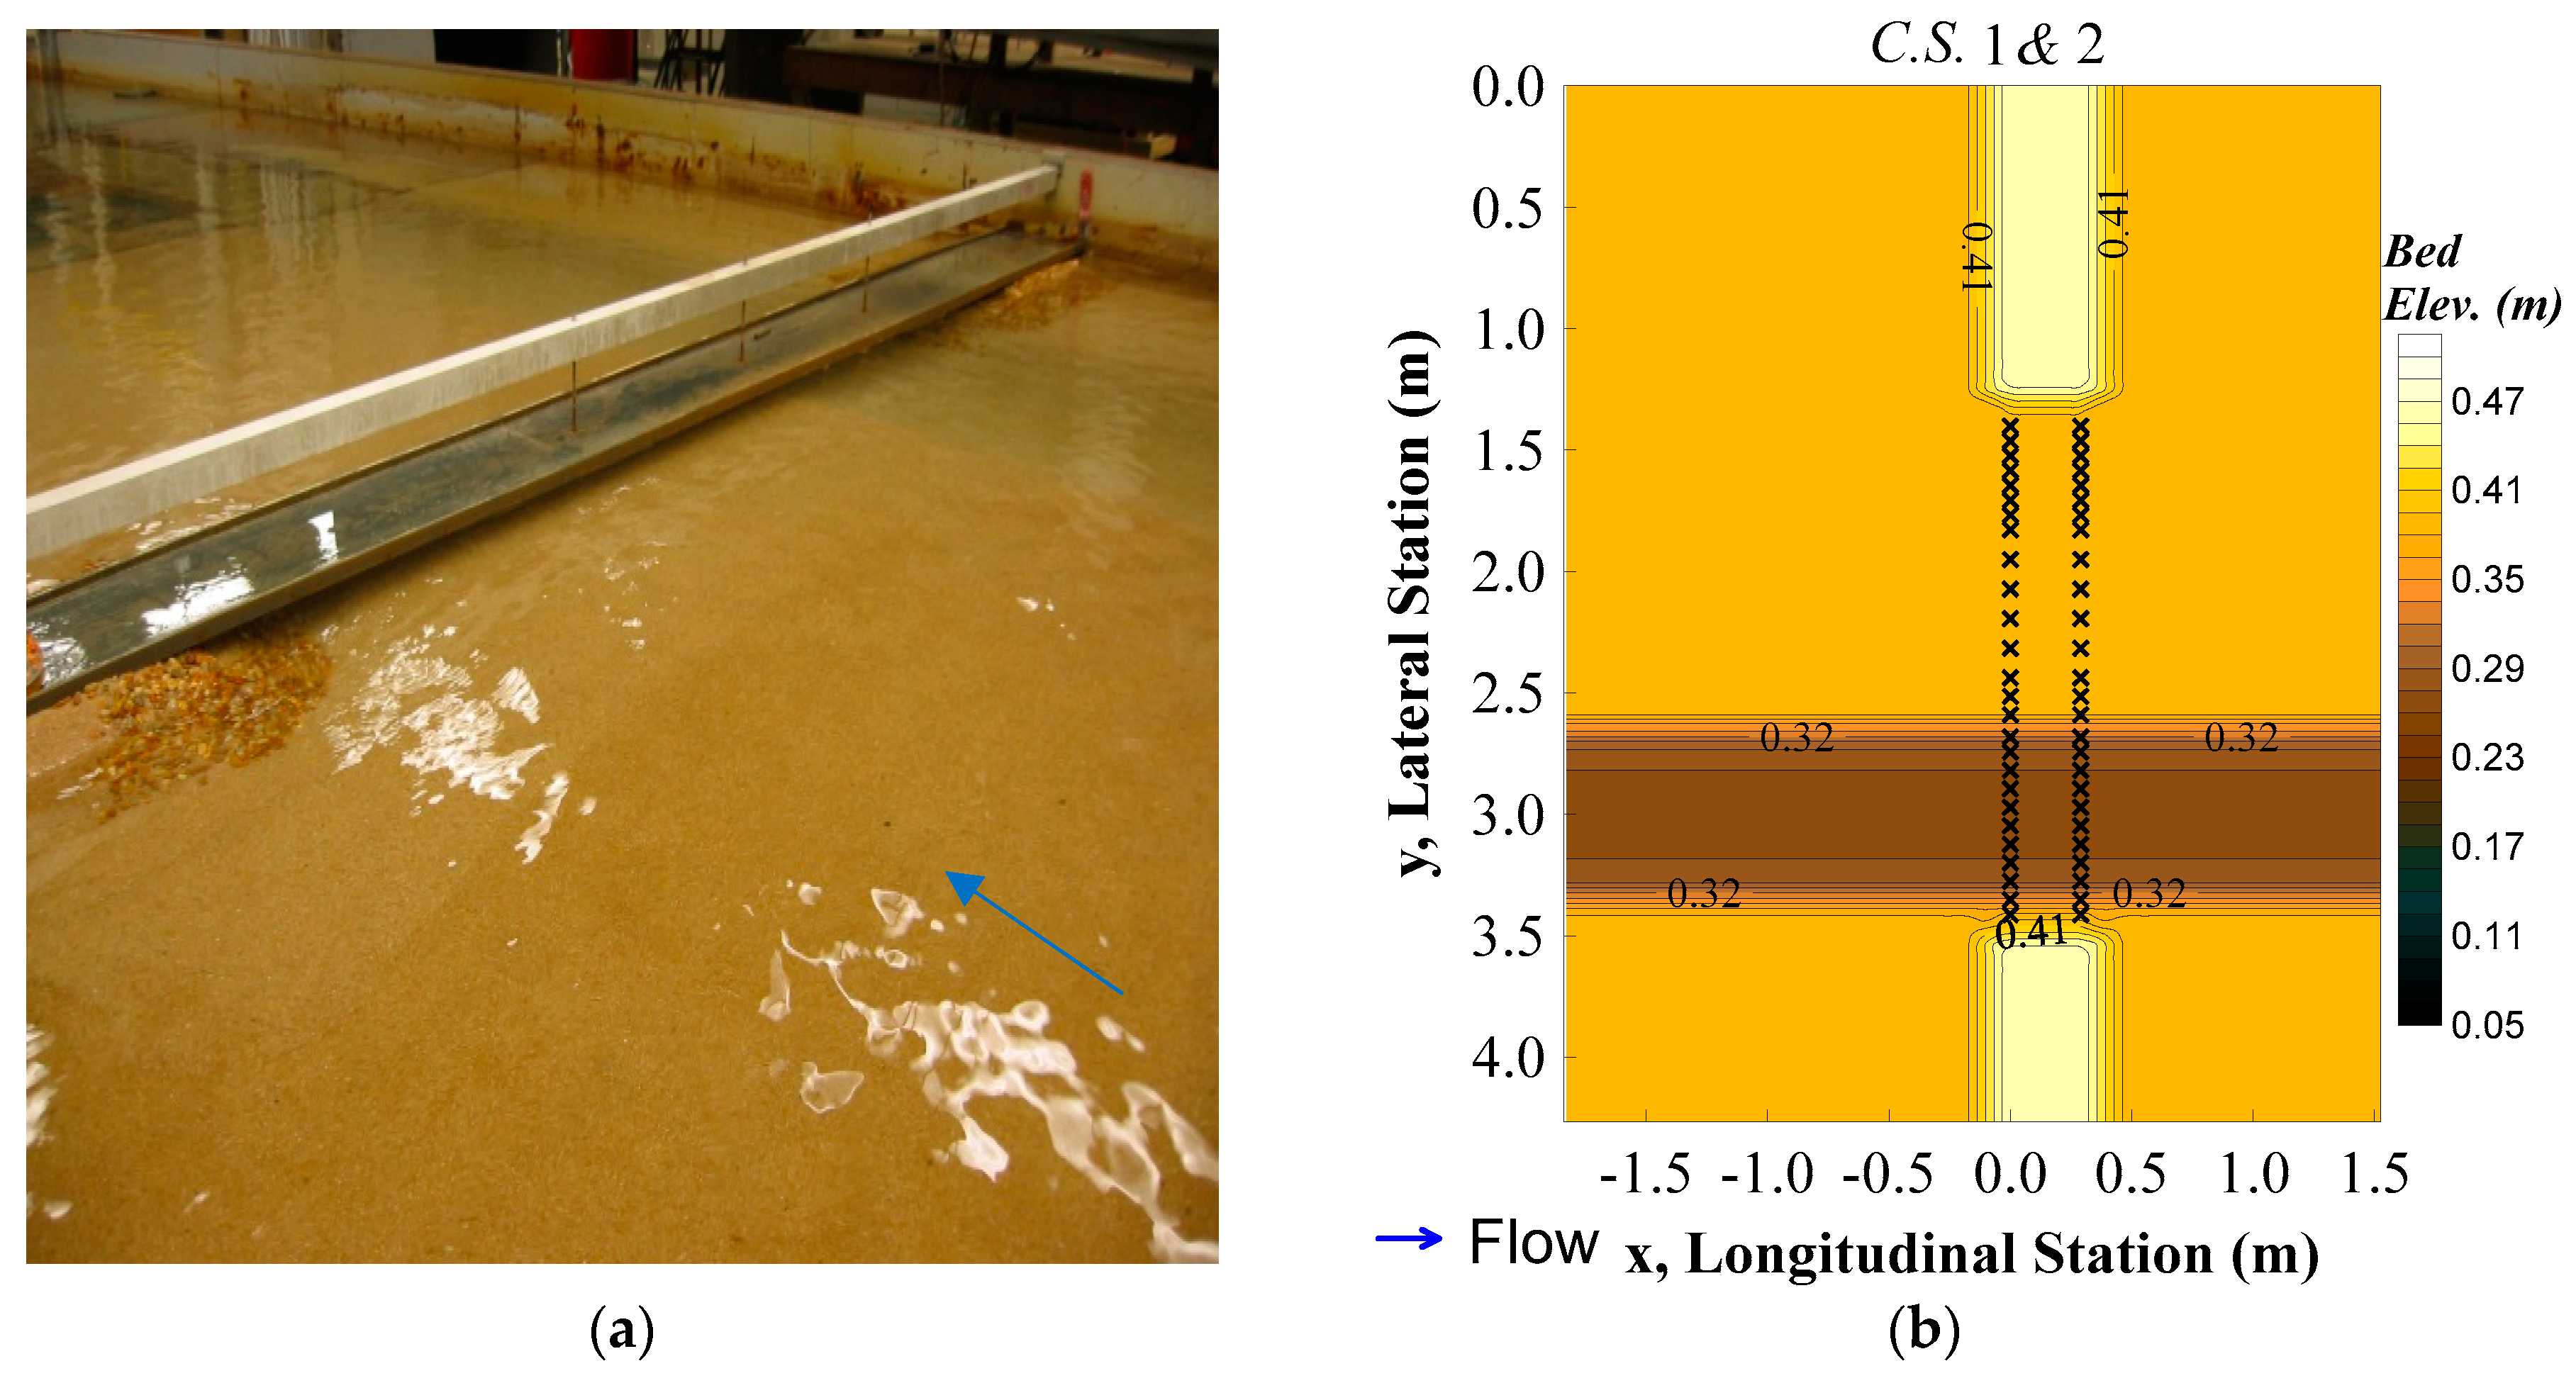
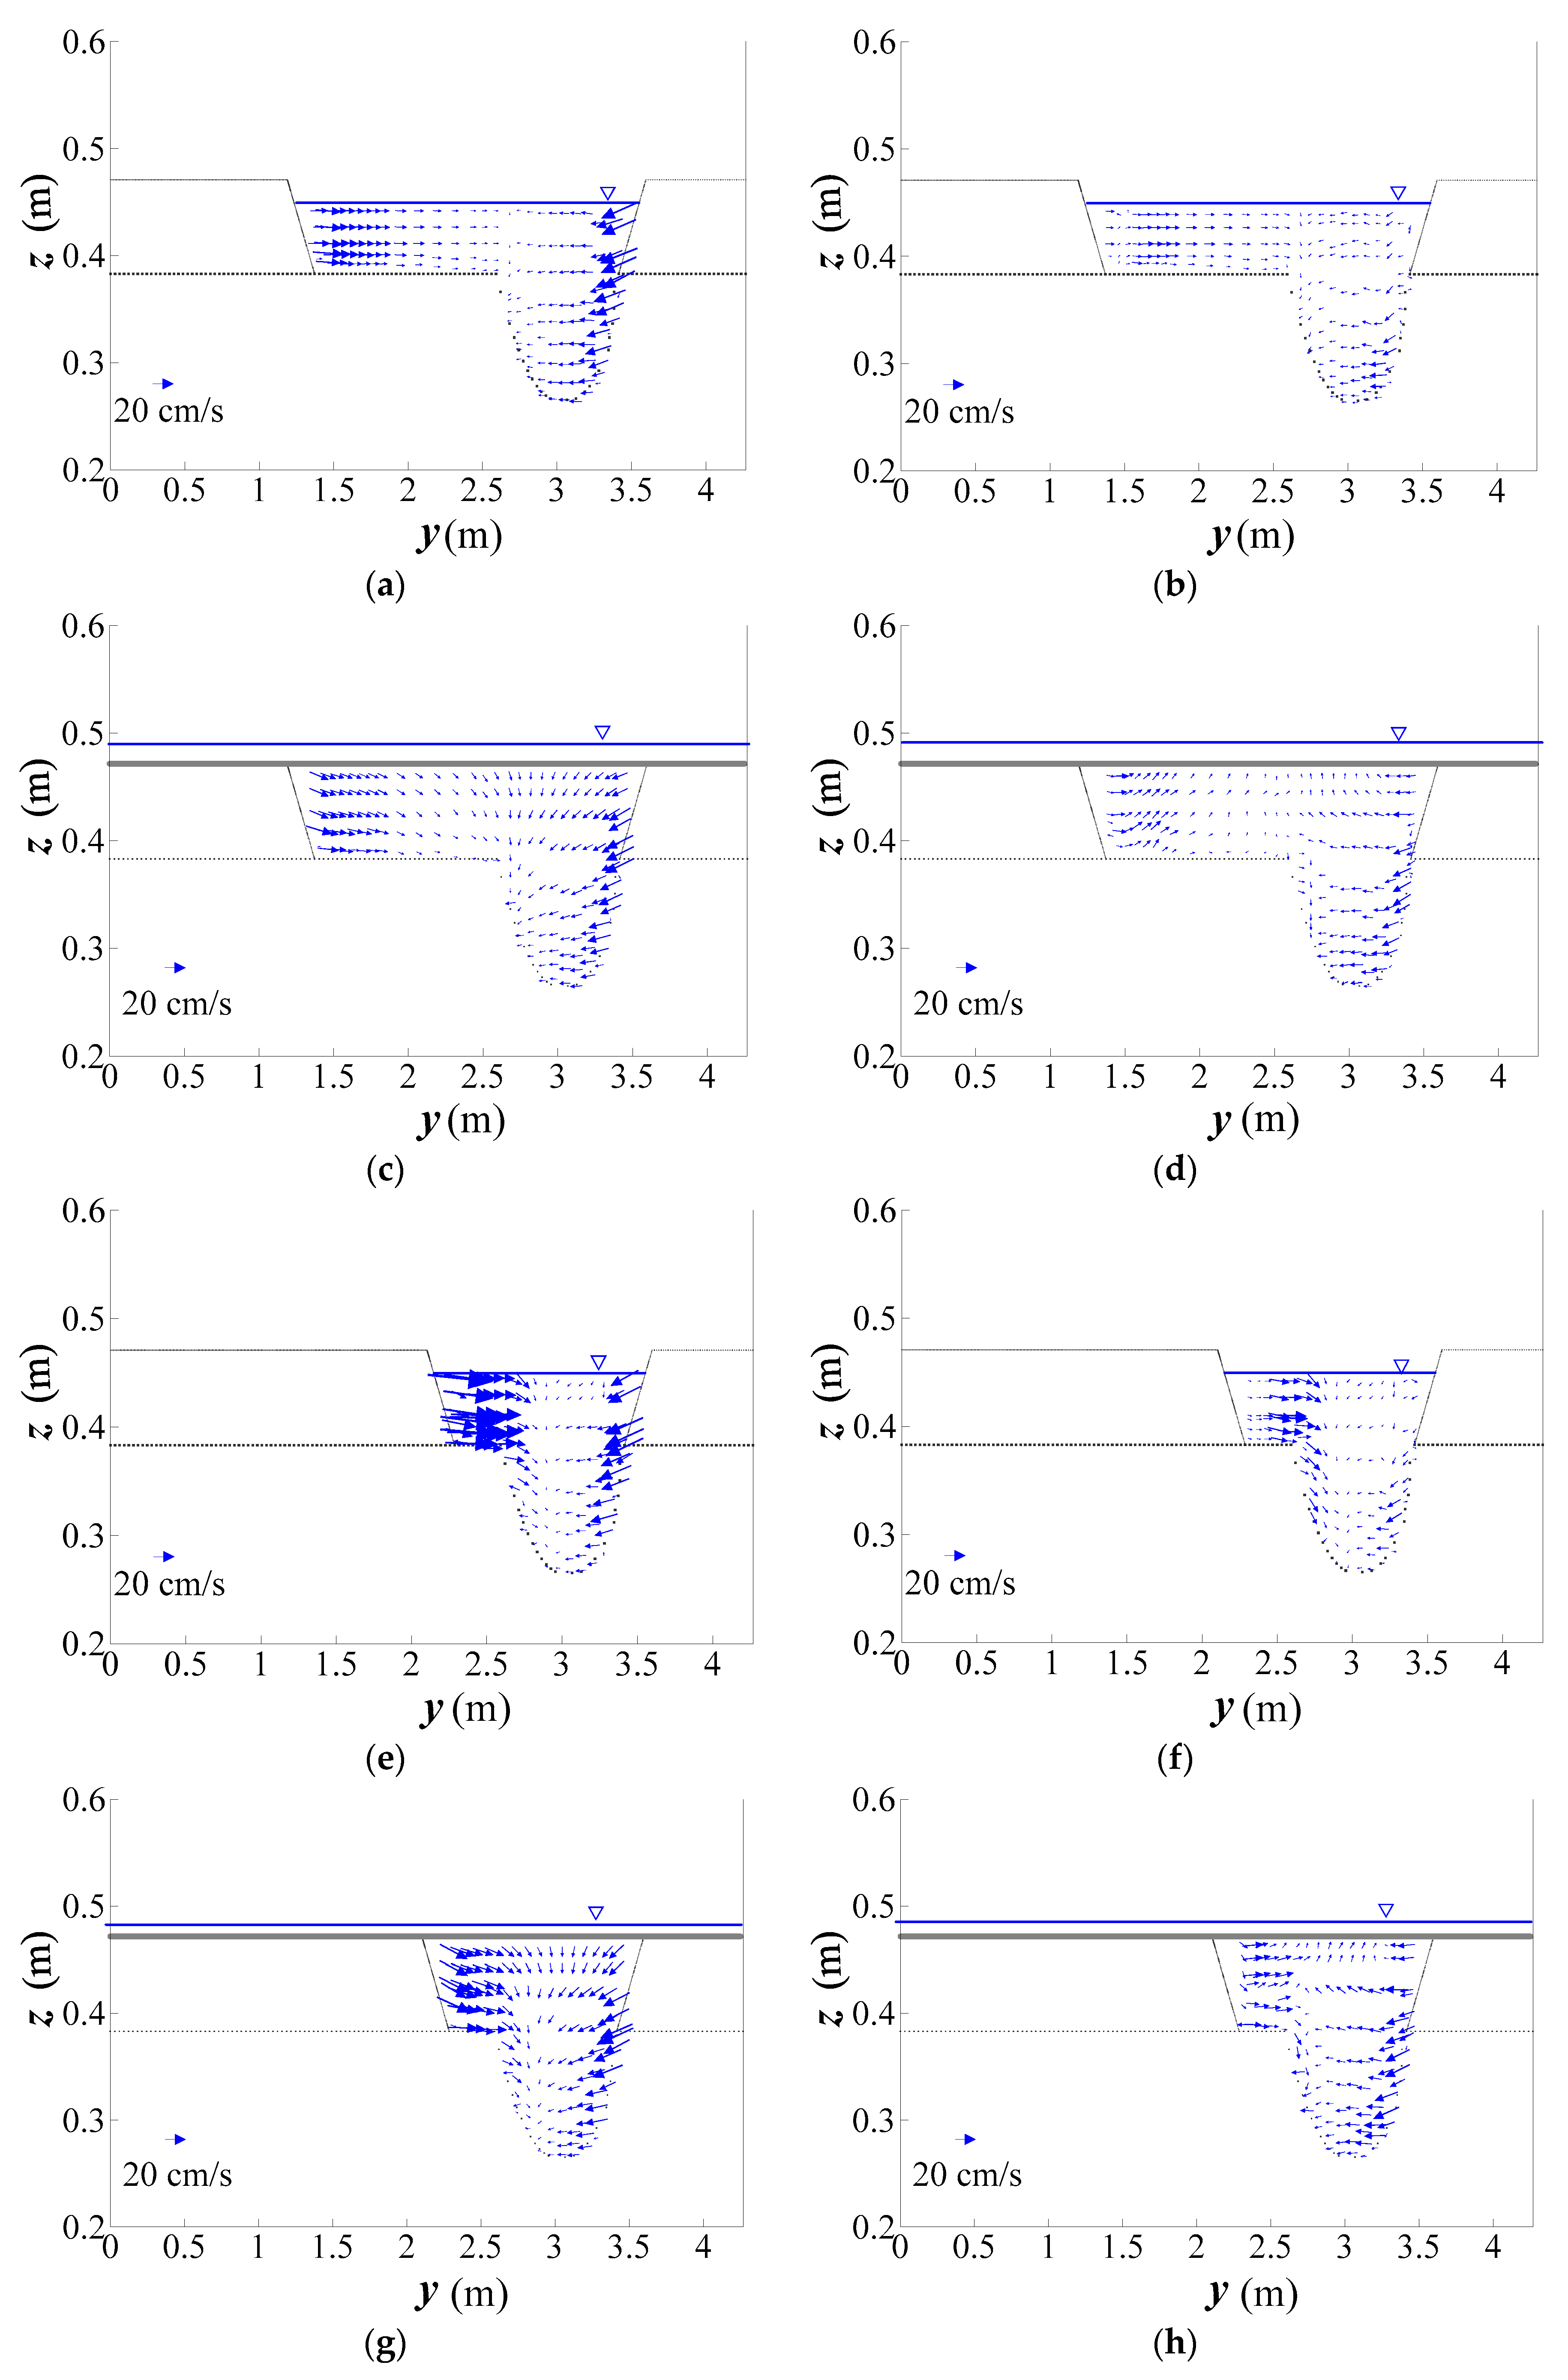
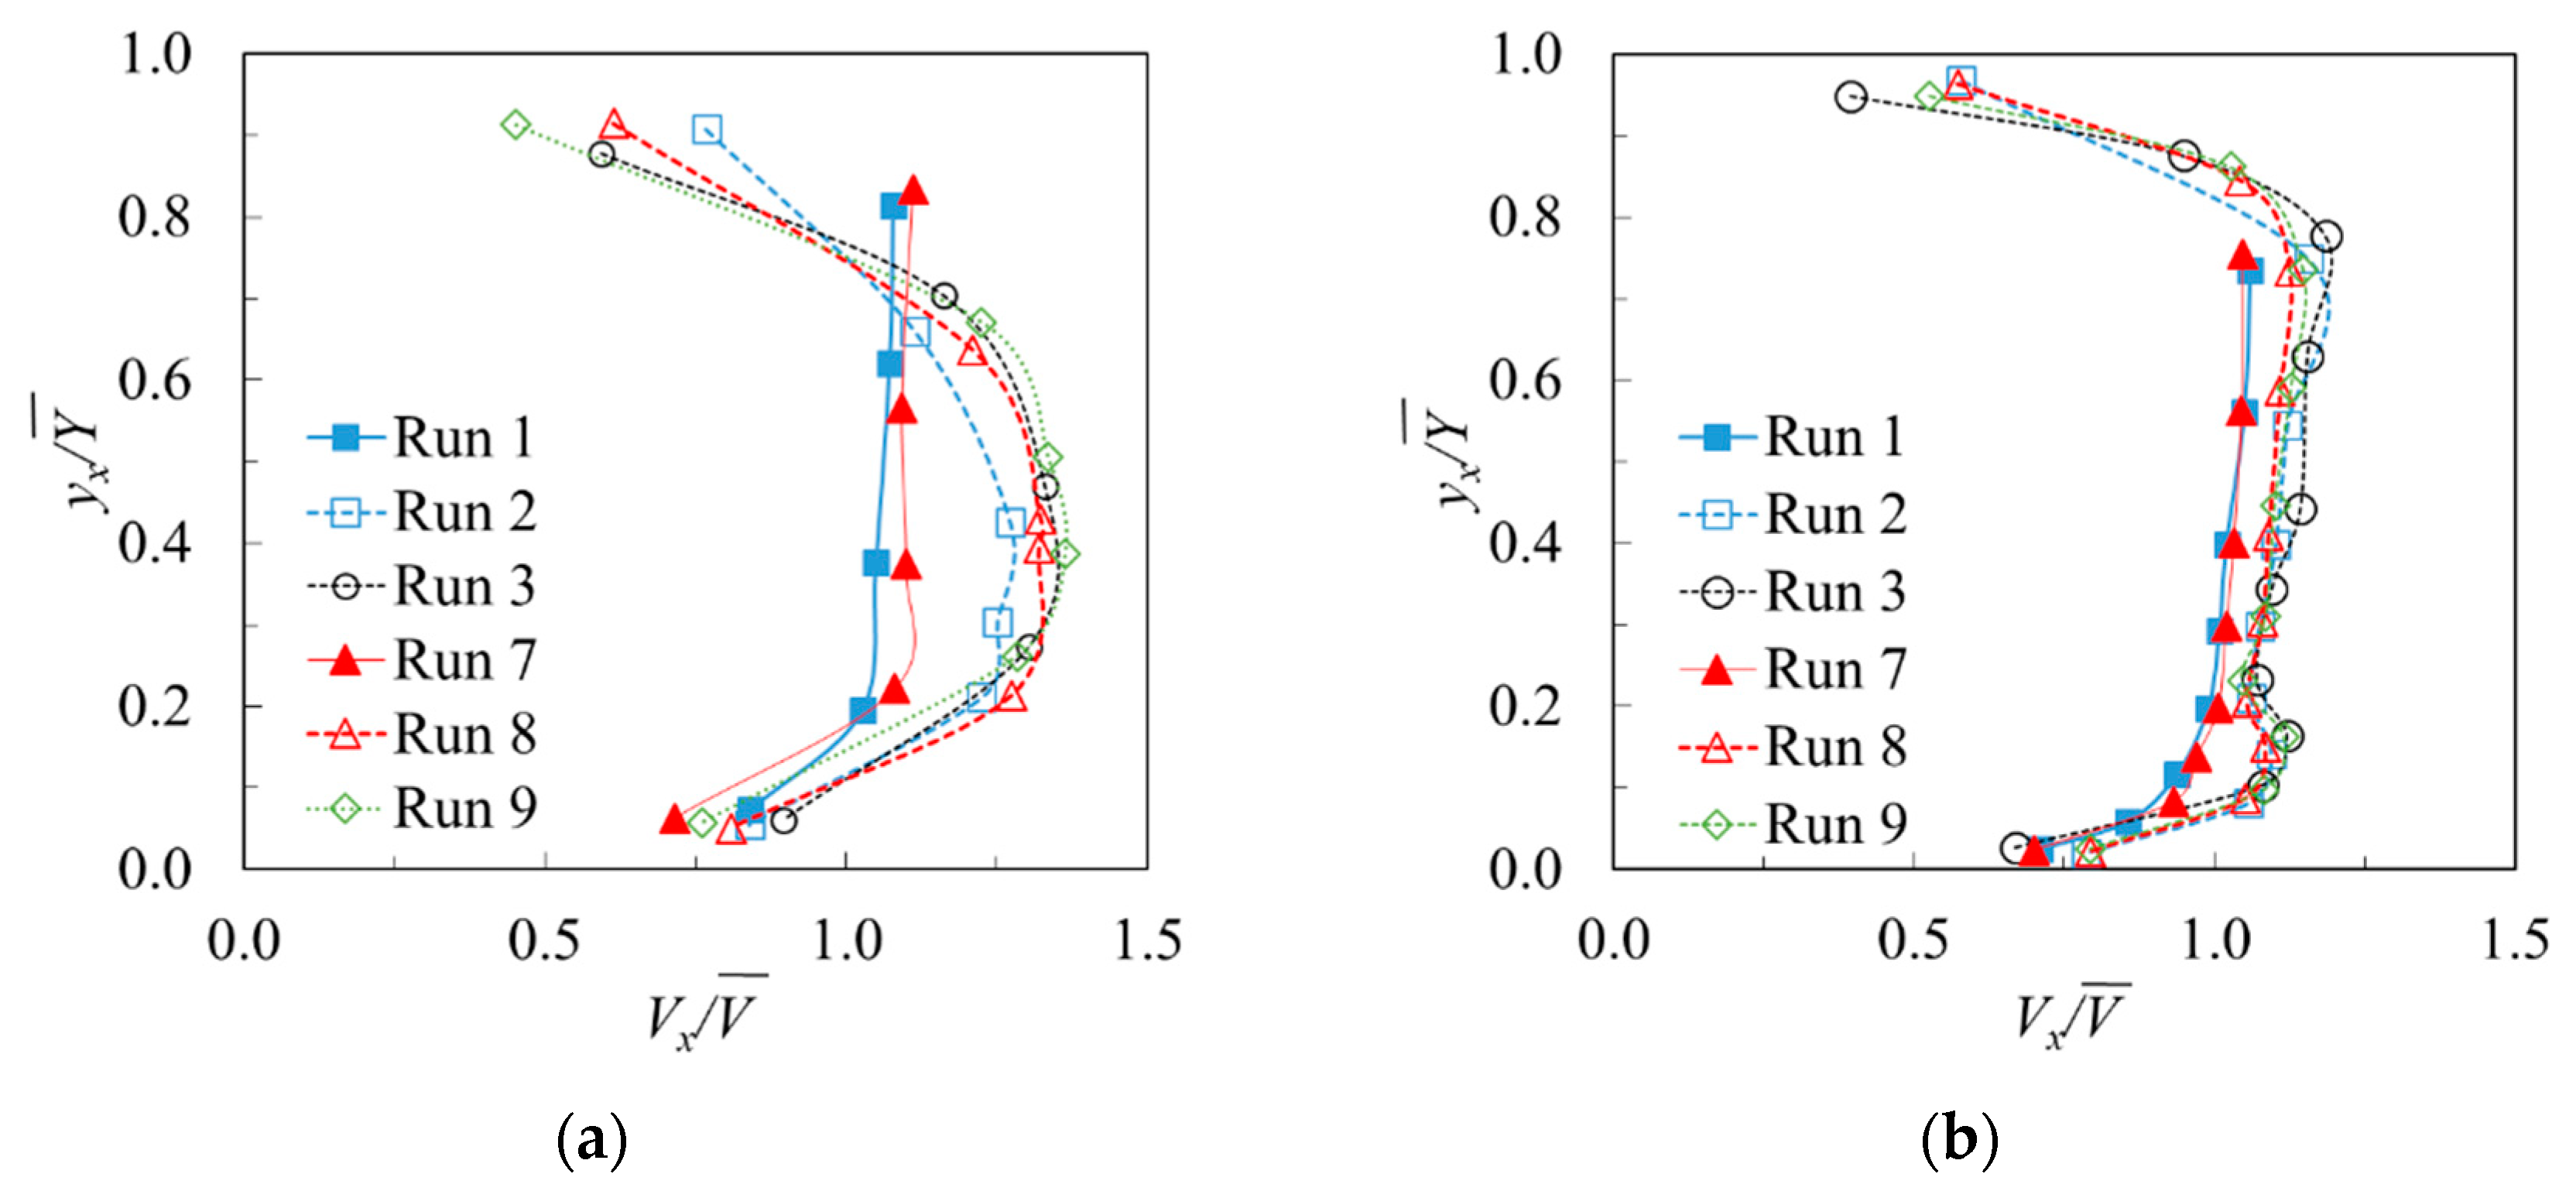
3.2. Velocity Flow Field around the Abutment

The unique shape of the scour hole around an abutment, which results from a longitudinal and diagonal displacement of the deepest scour point relative to the abutment face, can be explained by the velocity flow field around the abutment. Thus, to understand the complex flow physics and resulting sediment transport, velocities were measured at C.S. 1 and C.S. 2. Figure 5 shows the resultant velocity vectors in y direction (v) and z direction (w) in the floodplain and in the main channel for runs 1, 3 (F) and 13, 15 (OT). As shown in Figure 5, in the cross-sectional velocity plot at upstream face of the bridge (C.S. 1) and the downstream face of the bridge (C.S. 2), higher magnitude velocity vectors are observed around the abutment resulting from local lateral flow contraction where deeper scour can occur as the contracted flow curved around the abutment. For runs 13 and 15, the velocity is even higher than in runs 1 and 3 because of the higher lateral flow contraction in longer abutment. In addition to the existing lateral flow contraction, for the cases with higher discharge (SO and OT case), the submergence of the upstream face of the bridge produced vertical flow contraction (i.e., the downward component of the velocity vectors in Figure 5c,g). However, at C.S. 2 (downstream of the bridge section in Figure 5d,h), the upward components of velocity are observed. The downward velocity in upstream and upward velocity in downstream flow motion through the bridge induced by the bridge deck resulted in vertical contraction scour because the flow is accelerated, then decelerated. For Run 2 and Run 3, as shown in Figure 4, the lower bed elevation along the location of bridge deck in the floodplain is the result of vertical flow contraction by the unique velocities motions under the bridge. For the cases in other runs, similar observations as in runs 2 and 3 for the contours cannot be discovered because of the extent of abutment scour hole. However, the existing lateral flow contraction as well as vertical flow contraction definitely shows the higher scour depth through the bridge.
In the main channel, the v-w velocity plots also show unique flow motions. The narrow bridge opening induced by the abutments forced the water to re-enter through the bridge opening, causing lateral directional velocity. As shown in the Figure 5, for the setback abutment in the left floodplain, the flow moved towards the main channel, but the amount of shifting velocity was small compared to that of the bankline abutment in the right floodplain. Because the direction of lateral velocity vectors from the left side of abutment and the right side of abutment are opposite, the strong momentum transfer occurs when they meet at one point, and the interaction resulted in large counter clock-wise secondary current observed within the main channel. This secondary current initiates another scour hole close to the toe of the left-side slope within the main channel [23]. As shown in Figure 4, however, maximum scour depth around the bankline abutment occurred in the bottom of the main channel near the toe of the right bank. In fact, there appears to be interaction between the two scour holes from the left and right abutments during the initial scour development, but there was one remaining scour hole left in the equilibrium stage. Kara et al. [24] have applied a 3D numerical model to the problem of compound channel flows because the flow and turbulence distributions are so important to the prediction of scour when a bridge abutment is placed in a compound channel. Their results show the important contribution of secondary currents and turbulent stresses to the apparent shear stress at the main channel/floodplain interface when the momentum equation is depth-averaged. Both the secondary current and turbulent stress contributions to the apparent shear stress increase as the relative depth in the floodplain decreases.
Figure 6 shows the vertical velocity profiles for each run measured in the floodplain (Figure 6a) and in main channel (Figure 6b). It is interesting to note that the shape of velocity profiles is different for the case with submerged flow compared to in the free flow case. The vertical velocity measurement location (yx) on the ordinate axis has been non-dimensionalized by total water depth ( Y ¯ ) and the point velocity measurements (Vx) was normalized by depth-averaged velocity ( V ¯ ) in Figure 6. Submergence of the bridge during extreme hydrologic events produced vertical flow contraction leading to more complex flow field through the bridge than in the free flow cases. As shown in Figure 6, the presence of bridge deck resulted in a “fuller” velocity profile than in the free flow cases and tends to shift the higher velocity closer to the bed. The degree of shifting of higher velocity closer to the bed is a key element to understanding the intensity of shear stress that causes erosion.
Thus, the degree of shifting of velocity at the bed is explored with non-dimensional parameters commonly used for the theoretical contraction scour. Hong et al. [2], with their experimental results, confirmed that maximum scour around an abutment can be considered as some amplification of the theoretical contraction scour, ( V 1 / V c ) ( q 2 / q 1 ) . Previously, this concept has only applied to the free flow cases. However, they observed that maximum scour depth even in different flow types can be calculated with the product of ( V 1 / V c ) and ( q 2 / q 1 ) , as long as the flow contraction ratio ( q 2 / q 1 ) is predicted accurately. Thus, the effect of submerged orifice flow and overtopping flow provided by the vertical flow contraction as well as the lateral flow contraction can also be parameterized by the flow contraction ratio. In this study, the velocity gradients (slope) between the origin and a point measured around 20% of water depth was decided using the vertical velocity profiles shown in Figure 6 and are plotted for the floodplain in Figure 7a and for the main channel in Figure 7b, respectively, according to the dimensionless variables, ( V 1 / V c ) ( q 2 / q 1 ) , suggested by the theoretical contraction analysis. As shown in Figure 7, as the dimensionless variables, ( V 1 / V c ) ( q 2 / q 1 ) , in the x-axis increases, the value of slope decreases because the higher flow contraction increases the velocity close to the bed, leading to the milder slope shown in Figure 6. The measured slope from each profile seems to follow the same trend, even if they have different flow types because the value of q 2 / q 1 can be a viable indicator of the combined influence of vertical flow contraction as well as lateral contraction, as explained in the previous paragraph.
A least-squared regression analysis was conducted on the data given in Figure 7, and the best-fit equation is given by
S l o p e = 1.98   × [ ( V f 1 V f c 1 ) ( q f 2 q f 1 ) ] 0.514 ,   for   floodplain
S l o p e = 1.91   × [ ( V m 1 V m c 1 ) ( q m 2 q m 1 ) ] 0.635 ,   for   main   channel
with coefficients of determination of 0.91 and 0.87, respectively. Equations (1) and (2) can be used to calculate bed shear stress because shear stress is decided by the velocity gradient (slope). Theoretically, scour is initiated when the bed shear stress induced by the flow is larger than the value of critical shear stress of the bed sediment size and the magnitude of scour depth is directly related to the value of shear stress. Thus, predicting shear stress is key driver to a better understanding of scour around an abutment. Furthermore, the provided equations can be used for bed shear stress closure of numerical modeling around bridge abutments for model developers.

4. Conclusions

A lot of research in past twenty years has focused on a particular type of bridge foundation scour, e.g. pier scour and/or abutment scour using simple experimental set-up. Thus, so far, engineers and researchers have been using SINGLE factors such as mean hydraulic variables, Reynolds stresses, turbulent kinetic energy (TKE), vorticity, and other measures of turbulent structure to understand/calculate the scour depth. However, recent extreme rainfall events associated with climate change can often result in submerged orifice flow with or without overtopping flow, in which the flow field through the bridge is more complex because of the simultaneous existence of local turbulence around the base of the structure as well as vertical flow contraction in addition to the lateral flow contraction. Thus, in this paper, for the investigation of the complex mechanism of scour under extreme hydrologic events, laboratory experiments were conducted using scale down river geometry and the detailed velocity flow field through the bridge were measured. The results show that, in addition to the local turbulence structure being wrapped around the base of abutment, higher cross-sectional velocity around an abutment due to the local flow acceleration cause the maximum scour close to the abutment. During large flooding and bridge submergence, in addition to the higher velocity and the local turbulence structure in the vicinity of the abutment, the unique down-ward and up-ward flow motion lead to the additional scour. Furthermore, the experimental results show that the shape of the velocity profiles is “fuller” compared to the free flow cases, and the unique shape of velocity profiles resulted in higher velocity gradients close to the bed. Based on the measurements, the way of estimating higher velocity gradients close to the bed, which is the key element to exploring shear stress, is suggested with respect to the discharge contraction ratio. For broader impacts, the research is expected to contribute practical design for hydraulic engineers by suggesting the classification of scour conditions with respect to the non-dimensional value of set-back distance because the opening width, location of pier and abutment are important design criteria for the safety of bridges vulnerable to scour.
Even if this study provides new insights into the velocity flow field through the scour-critical bridges subject to the submerged orifice flow and submerged flow with overtopping, the entire erosion development process should be simulated numerically to find the changes in turbulent structure, flow contraction and their interactions with the bed in both time and space. The qualitative understanding of the flow pattern and the resulting sediment transport shown in this study can serve to stimulate and guide quantitative experiments and numerical simulation. Furthermore, based on the research for scouring under ice cover, very rough ice can push the maximum velocity even further towards the bed [25,26]. These findings alarmed us and suggest that additional studies should be conducted with different types of bridge deck because the value of roughness under the model bridge deck varies depending on the size and shape of the girders.

Author Contributions

K.S.Y., S.O.L., and S.H.H. provided descriptions and motivation. K.S.Y. and S.H.H. designed experiments and measured the results; S.O.L., S.H.H., and K.S.Y. analyzed the data and interpretation of results; K.S.Y. and S.H.H. prepared the manuscript; and all authors show their efforts in reviewing and editing of the manuscript.

Funding

This work was partially supported by the Korea Agency for Infrastructure Technology Advancement (KAIA) grant funded by the Ministry of Land, Infrastructure and Transport (Grant 18AWMP-B121095-03). Seung Ho Hong was supported from West Virginia University.

Acknowledgments

Authors would like to show our sincere appreciation to Terry W. Sturm in Georgia Tech for his support. The detailed velocity measurement data for additional research using numerical simulation are available upon request from an interested party.

Conflicts of Interest

The authors declare no conflict of interest.

References

  1. Ettema, R.; Nakato, T.; Muste, M. Estimation of Scour Depth at Bridge Abutments; Final Report, NCHRP 24-20; TRB: Washington, DC, USA, 2010. [Google Scholar]
  2. Hong, S.H.; Sturm, T.W.; Stoesser, T. Clear water abutment scour in a compound channel for extreme hydrologic events. J. Hydraul. Eng. 2015, 141, 04015005. [Google Scholar] [CrossRef]
  3. Kwan, T.F.; Melville, B.W. Local scour and flow measurements at bridge abutments. J. Hydraul. Res. 1994, 32, 661–673. [Google Scholar] [CrossRef]
  4. Melville, B.W.; Coleman, S.E. Bridge Scour; Water Resources Publications: Highlands Ranch, CO, USA, 2000. [Google Scholar]
  5. Chrisohoides, A.; Sotiropoulos, F.; Sturm, T.W. Coherent structures in flat-bed abutment flow: Computational fluid dynamics simulations and experiments. J. Hydraul. Eng. 2003, 129, 177–186. [Google Scholar] [CrossRef]
  6. Kim, H.; Roh, M.; Nabi, M. Computational modeling of flow and scour around two cylinders in staggered array. Water 2017, 9, 654. [Google Scholar] [CrossRef]
  7. Zang, L.; Wang, P.; Yang, W.; Zuo, W.; Gu, X.; Yang, X. Geometric characteristics of spur dike scour under clear-water scour conditions. Water 2018, 10, 680. [Google Scholar] [CrossRef]
  8. Chen, S.; Tfwala, S.; Wu, T.; Chan, H.; Chou, H. A hooked-collar for bridge piers protection: Flow fields and scour. Water 2018, 10, 1254. [Google Scholar] [CrossRef]
  9. Zang, L.; Wang, H.; Zang, X.; Wang, B.; Chen, J. The 3-D morphology evolution of spur dike scour under clear-water scour conditions. Water 2018, 10, 1583. [Google Scholar] [CrossRef]
  10. Yang, Y.; Qi, M.; Li, J.; Ma, X. Evolution of hydrodynamics characteristics with scour hole developing around a pile group. Water 2018, 10, 1632. [Google Scholar] [CrossRef]
  11. Hong, S.H.; Sturm, T.W. Physical Model Study of Bridge Abutment and Contraction Scour under Submerged Orifice Flow Conditions. In Proceedings of the 33rd IAHR Congress: Water Engineering for a Sustainable Environment, Vancouver, BC, Canada, 9–14 August 2009. [Google Scholar]
  12. Hong, S.H.; Sturm, T.W. Physical Modeling of Abutment Scour for Overtopping, Submerged Orifice and Free Surface Flows. In Scour and Erosion, Proceedings of the Fifth International Conference on Scour and Erosion, San Francisco, CA, USA, 7–10 November 2010; American Society of Civil Engineers: Reston, VA, USA, 2010. [Google Scholar]
  13. Saha, R.; Lee, S.; Hong, S.H. A comprehensive method of calculating maximum bridge scour depth. Water 2018, 10, 1572. [Google Scholar] [CrossRef]
  14. Hong, S.H. Prediction of Clear Water Abutment Scour Depth in Compound Channel for Extreme Hydrologic Events. Ph.D. Thesis, School of Civil and Environmental Engineering, Georgia Institute of Technology, Atlanta, GA, USA, 2013. [Google Scholar]
  15. Ge, L.; Lee, S.; Sotiropoulos, F.; Sturm, T.W. 3D unsteady RANS modeling of complex hydraulic engineering flows. Part II: Model validation and flow physics. J. Hydraul. Eng. 2005, 131, 809–820. [Google Scholar] [CrossRef]
  16. Garcia, C.M.; Cantero, M.I.; Nino, Y.; Garcia, M.H. Closure to “Turbulence measurements with acoustic doppler velocimeters”. J. Hydraul. Eng. 2007, 131, 1062–1073. [Google Scholar] [CrossRef]
  17. Hong, S.H.; Abid, I. Physical model study of bridge contraction scour. KSCE J. Civ. Eng. 2016, 20, 2578–2585. [Google Scholar] [CrossRef]
  18. Hong, S.H.; Lee, S.O. Insight of Bridge Scour during Extreme Hydrologic Events by Laboratory Model Studies. KSCE J. Civ. Eng. 2018, 22, 12871–12879. [Google Scholar] [CrossRef]
  19. Lee, S.O.; Hong, S.H. Reproducing field measurements using scaled-down hydraulic model studies in a laboratory. Adv. Civ. Eng. 2018, 2018, 9091506. [Google Scholar] [CrossRef]
  20. Goring, D.; Nikora, V. Despiking acoustic Doppler velocimeter data. J. Hydraul. Eng. 2002, 128, 117–126. [Google Scholar] [CrossRef]
  21. Chang, F.; Davis, S. Maryland SHA Procedure for Estimating Scour at Bridge Abutments, Part 2—Clear Water Scour. In Proceedings of Water Resources Engineering ′98; ASCE: Memphis, TN, USA, 1998; pp. 169–173. [Google Scholar]
  22. Chang, F.; Davis, S. Maryland SHA Procedure for Estimating Scour at Bridge Waterways, Part 1—Live Bed Scour. In Stream Stability and Scour at Highway Bridges; Richardson, E., Lagasse, P., Eds.; American Society of Civil Engineers: Reston, VA, USA, 1999; pp. 4001–4011. [Google Scholar]
  23. Hong, S.H.; Abid, I. Scour around an erodible abutment with riprap apron over time. J. Hydraul. Eng. 2019, in press. [Google Scholar]
  24. Kara, S.; Stoesser, T.; Sturm, T.W. Flow dynamics through a submerged bridge opening with overtopping. J. Hydraul. Res. 2015, 53, 186–195. [Google Scholar] [CrossRef]
  25. Zabilansky, L.J.; Hains, D.B.; Remus, J.I. Increased Bed Erosion Due to Ice. In Cold Regions Engineering 2006: Current Practices in Cold Regions Engineering; American Society for Civil Engineers: Reston, VA, USA, 2006; pp. 1–12. [Google Scholar]
  26. Hains, D.; Zabilansky, L. Laboratory Test of Scour under Ice: Data and Preliminary Results; ERDC/CRREL TR-04-9; U.S. Army Engineer Research and Development Center: Hanover, NH, USA, 2004. [Google Scholar]
Figure 1. Laboratory model in this study in (a) and initial contour with velocity measurements cross sections in (b).
Water 11 00143 g001
Figure 2. Geometries for (a) compound channel and abutment before scouring and (b) shape of model bridge deck.
Water 11 00143 g002
Figure 3. Definition sketch for classification of scour conditions.
Water 11 00143 g003
Figure 4. Contours for selected run in equilibrium condition.
Water 11 00143 g004aWater 11 00143 g004b
Figure 5. Cross-sectional velocity vectors measured at C.S. 1 and C.S. 2 for each run. (a) v-w plot at C.S. 1 (Run 1, F), (b) v-w plot at C.S. 2 (Run 1, F) ,(c) v-w plot at C.S. 1 (Run 3, OT), (d) v-w plot at C.S. 2 (Run 3, OT), (e) v-w plot at C.S. 1 (Run 13, F), (f) v-w plot at C.S. 2 (Run 13, F), (g) v-w plot at C.S. 1 (Run 15, OT), (h) v-w plot at C.S. 2 (Run 15, OT).
Water 11 00143 g005
Figure 6. Vertical velocity profiles for (a) in the floodplain and (b) in the main channel
Water 11 00143 g006
Figure 7. Variation of velocity gradient close to the bed as a function of ( V 1 / V C 1 ) ( q 2 / q 1 ) for (a) in the floodplain and (b) in the main channel
Water 11 00143 g007
Table 1. Initial experimental parameters and results for location of maximum scour depth.
RunFlow TypeQ (m3/s) L a B f V f 1 V f c 1 V m 1 V m c 1 Yf1 (m)Ym1 (m) q f 2 q f 1 q m 2 q m 1 L m y f 1 W y f 1 Cond-Itions
1F0.0930.530.610.830.0740.1521.8181.5433.7016.46A
2SO0.1160.600.730.1060.1841.8751.4833.7511.53A
3OT0.1640.610.720.1490.2271.1481.1462.058.20A
4F0.0850.580.770.0750.1531.7551.4414.0516.19A
5SO0.1100.570.680.1080.1861.7811.4163.3811.27A
6OT0.1500.560.640.1480.2261.251.1001.868.26A
7F0.0850.710.540.740.0760.1542.2361.7565.2410.08A
8SO0.1030.530.710.1030.1812.2571.6025.057.42A
9OT0.1500.560.660.1500.2281.1761.2431.635.09A
10F0.0740.490.720.0730.1512.2081.5394.1510.37A
11SO0.0910.490.610.1050.1832.2231.6474.087.29A
12OT0.1300.500.570.1470.2251.2781.2621.455.18A
13F0.0740.880.440.690.0760.156*1.9045.844.03C
14SO0.0880.430.630.1030.180*1.9514.762.97C
15OT0.1300.450.570.1500.227*1.4222.462.04C
16F0.0620.380.550.0730.155*1.9764.724.15C
17SO0.0740.370.520.1050.181*1.9024.442.92C
18OT0.1100.400.500.1470.224*1.4812.092.07C
(Subscript 1 and 2 refers to the approach section and bridge section, respectively; Condition A = long setback and Condition C = short setback abutment; symbol *: discharge per unit width in the bridge section were only measured in the main channel for short setback abutment).

