Sediment Grain-Size Characteristics and its Sources of Ten Wind-Water Coupled Erosion Tributaries (the Ten Kongduis) in the Upper Yellow River


Abstract
1. Introduction
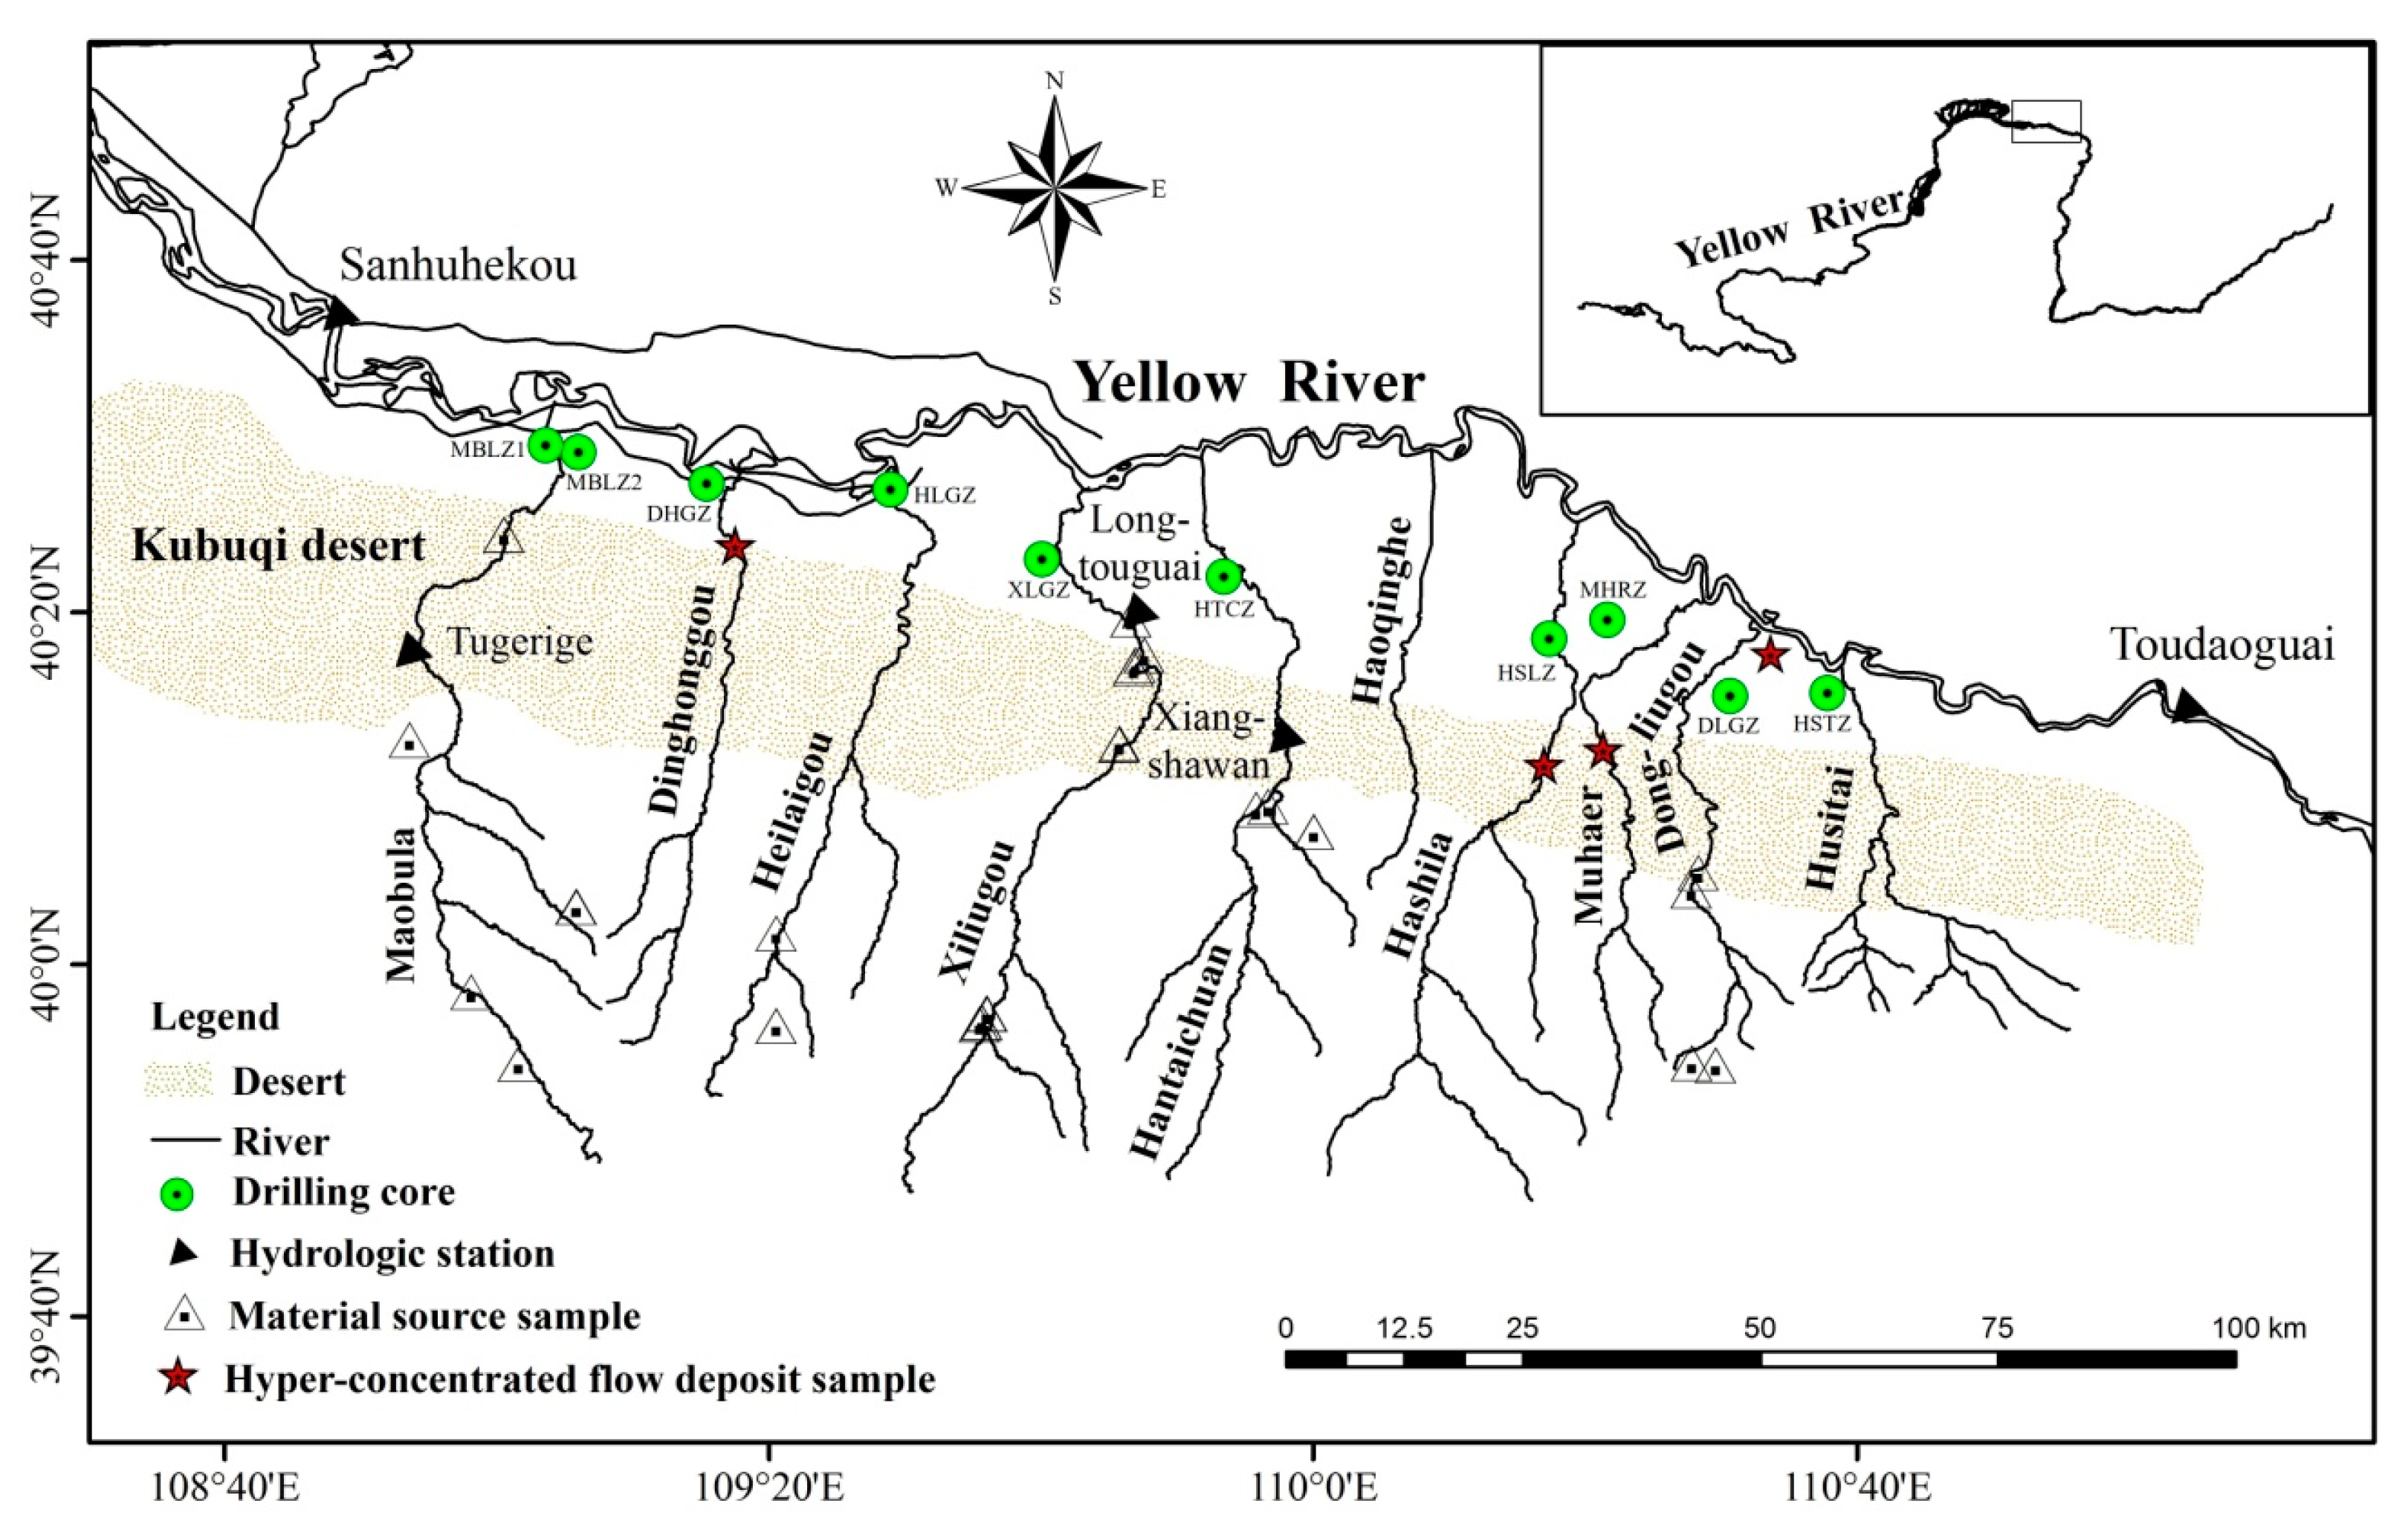
2. Study Area
3. Materials and Methods
3.1. Sediment Sampling and Analysis Methods
3.2. Sediment Source Tracing Methods
4. Results
4.1. Sediment Grain-Size Characteristics
4.1.1. Sediments in Sources
4.1.2. Deposits of Hyperconcentrated Flows
4.1.3. Drilling Cores in the Alluvial Fan
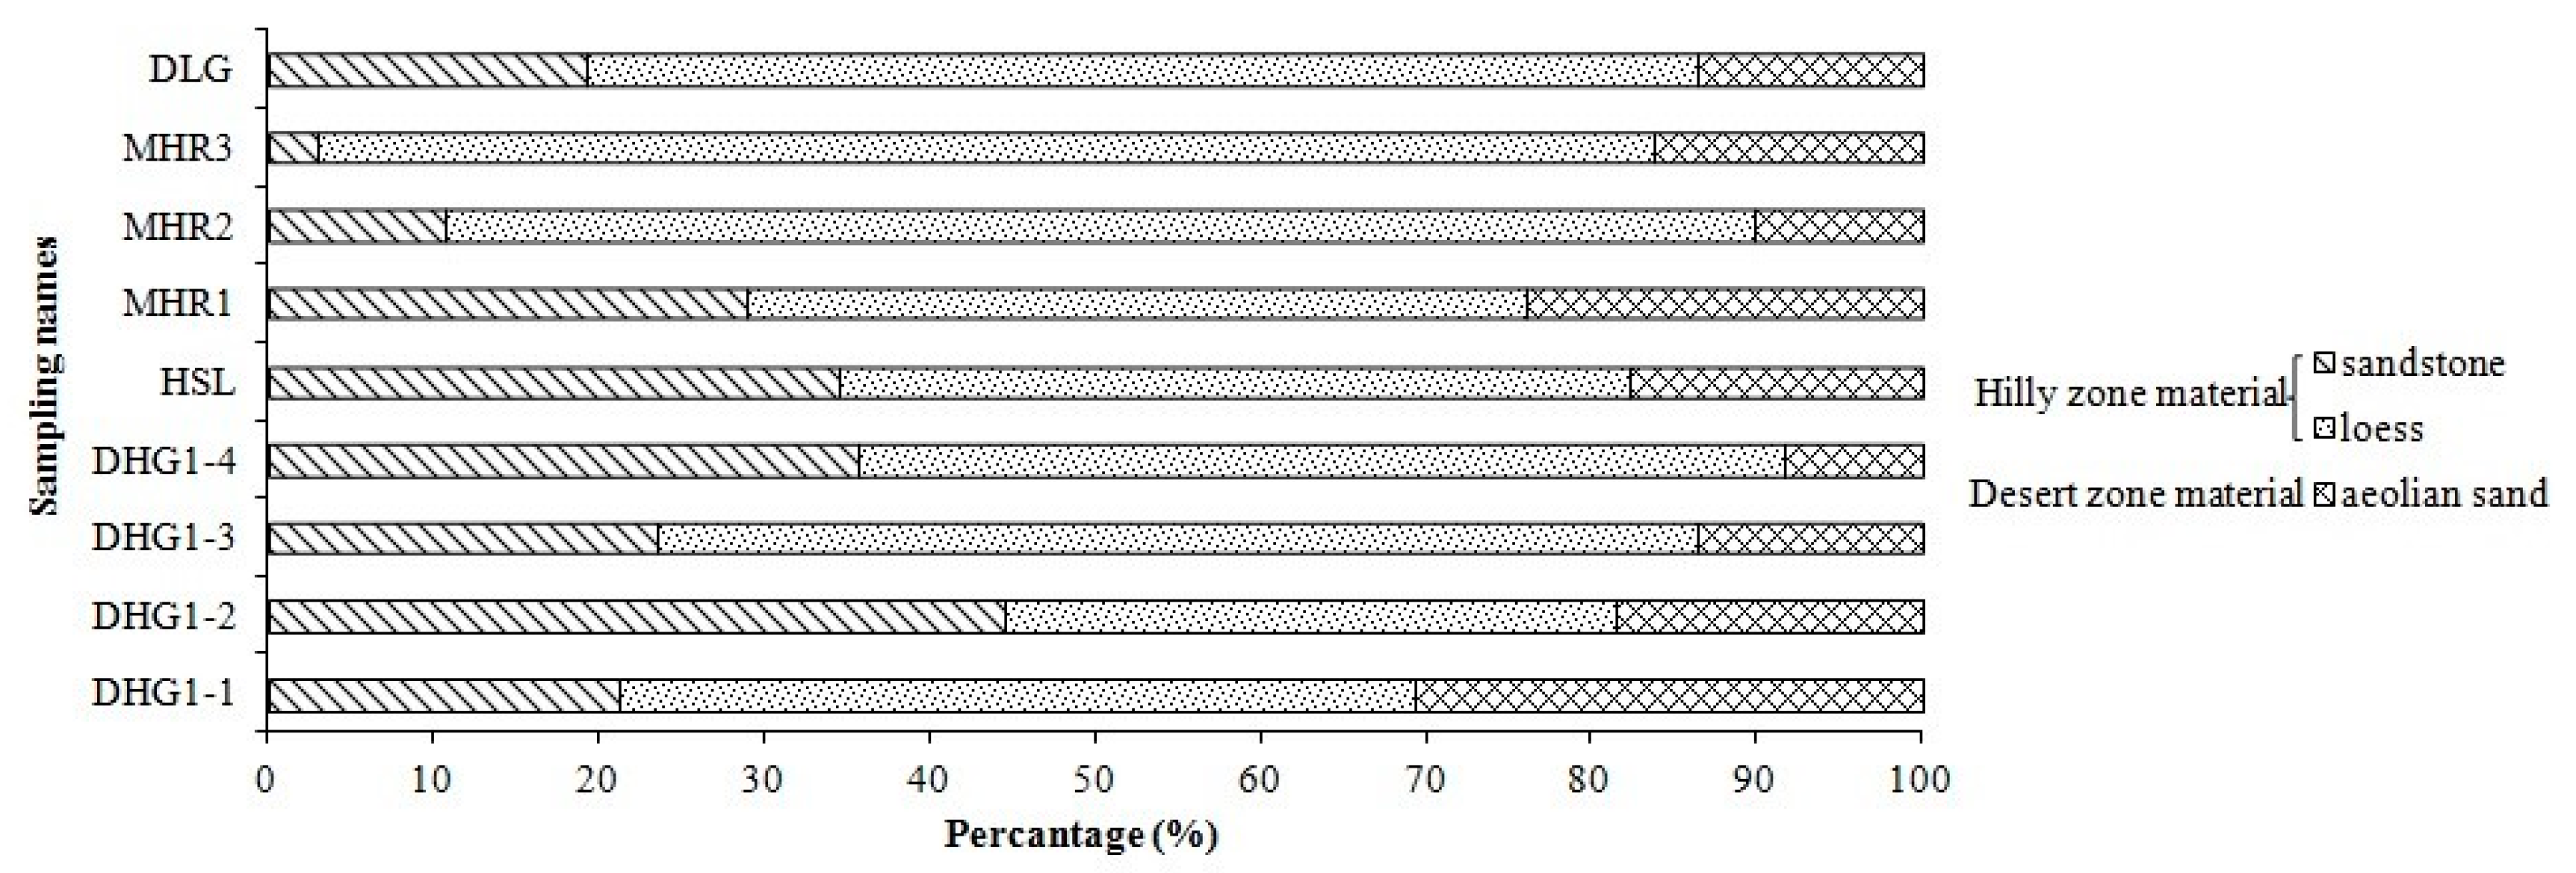
4.2. Sediment Sources Identification
4.2.1. Hyperconcentrated Flows
4.2.2. Non-Hyperconcentrated Flows
5. Discussion
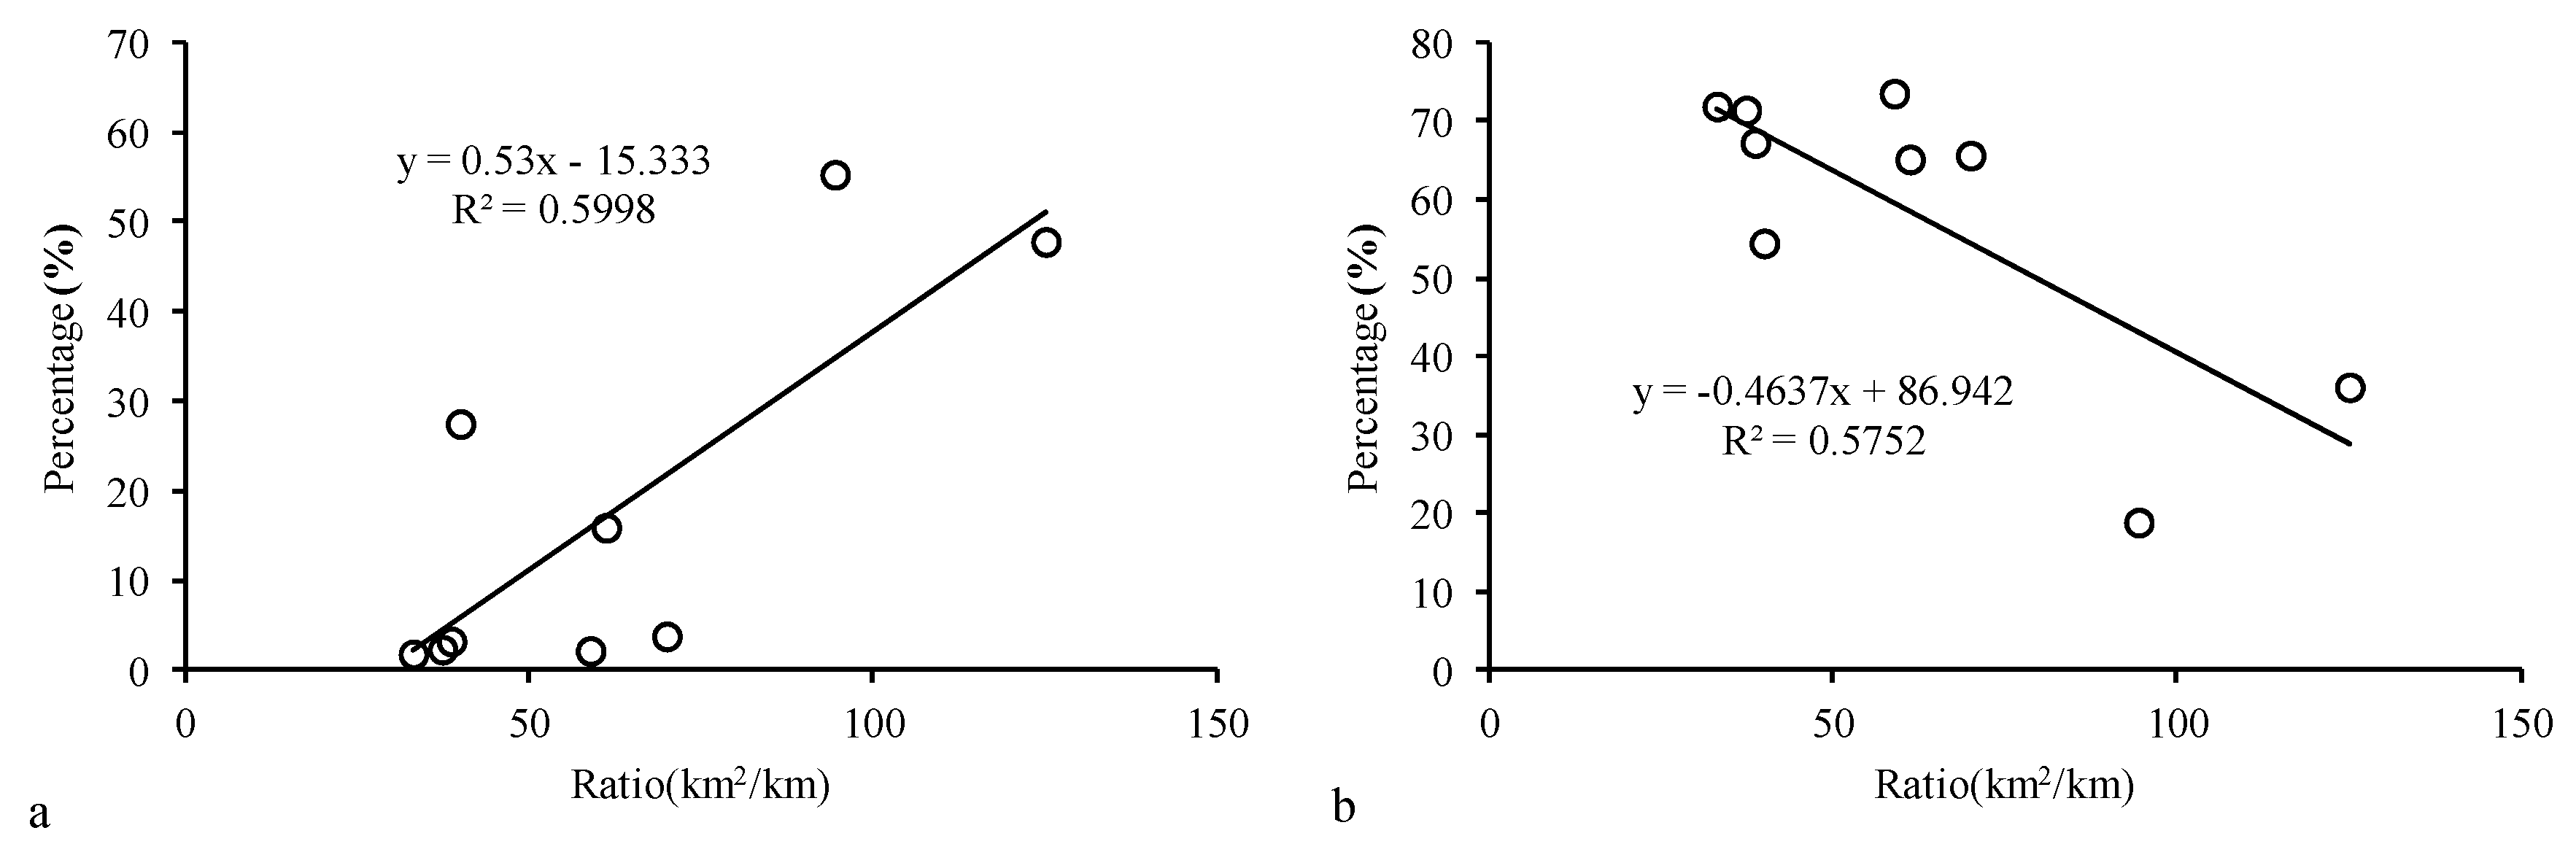
5.1. The Causes for Changes in Sediment Yield Proportion from Different Sources
5.2. The Coarse Sediment Sources
6. Conclusions
Author Contributions
Funding
Acknowledgments
Conflicts of Interest
References
- Chien, N.; Wan, Z.H. Mechanics of Sediment Transport; Science Press: Beijing, China, 1983. (In Chinese) [Google Scholar]
- Xu, J.X. Grain-size characteristics of suspended sediment in the Yellow River, China. Catena 1999, 38, 243–263. [Google Scholar] [CrossRef]
- Choubey, V.K. The effect of properties of sediment type on the relationship between suspended sediment concentration and radiance. Hydrol. Sci. J. 1994, 39, 459–470. [Google Scholar] [CrossRef]
- Walling, D.E.; Russell, M.A.; Webb, B.W. Controls on the nutrient content of suspended sediment transported by British rivers. Sci. Total Environ. 2001, 266, 113–123. [Google Scholar] [CrossRef]
- Grabowski, R.C.; Droppo, I.G.; Wharton, G. Erodibility of cohesive sediment: The importance of sediment properties. Earth-Sci. Rev. 2011, 105, 101–120. [Google Scholar] [CrossRef]
- Lázaro, R.; Mora, J. Sediment content and chemical properties of water runoff on biocrusts in drylands. Biologia 2014, 69, 1539–1554. [Google Scholar] [CrossRef]
- Heitmuller, F.T.; Hudson, P.F. Downstream trends in sediment size and composition of channel-bed, bar, and bank deposits related to hydrological and lithologic controls in the Llano River watershed, central Texas, USA. Geomorphology 2009, 112, 246–260. [Google Scholar] [CrossRef]
- Henshaw, A.J.; Gurnell, A.M.; Bertoldi, W.; Drake, N. An assessment of the degree to which Landsat TM data can support the assessment of fluvial dynamics as revealed by changes in vegetation extent and channel position, along a large river. Geomorphology 2013, 202, 74–85. [Google Scholar] [CrossRef]
- Pan, B.T.; Pang, H.L.; Zhang, D.; Guan, Q.Y.; Wang, L.; Li, F.Q.; Guan, W.Q.; Cai, A.; Sun, X.S. Sediment grain-size characteristics and its source implication in the Ningxia-Inner Mongolia sections on the upper reaches of the Yellow River. Geomorphology 2015, 246, 255–262. [Google Scholar] [CrossRef]
- Panwar, S.; Khan, M.Y.A.; Chakrapani, G.J. Grain size characteristics and provenance determination of sediment and dissolved load of Alaknanda River, Garhwal Himalaya, India. Environ. Earth Sci. 2016, 75, 75–91. [Google Scholar] [CrossRef]
- Asadi, H.; Moussavi, A.; Ghadiri, H.; Rose, C.W. Flow-driven soil erosion process and the size selectivity of sediment. J. Hydrol. 2011, 406, 73–81. [Google Scholar] [CrossRef]
- Folk, R.L.; Ward, W.C. Brazos River bars: A study in the significance of grain size parameters. J. Sediment. Petrol. 1957, 27, 3–27. [Google Scholar] [CrossRef]
- Visher, G.S. Grain Size Distributions and Depositional Processes. J. Sediment. Petrol. 1969, 39, 1074–1106. [Google Scholar]
- Venkatramanan, S.; Ramkuar, T.; Anithamary, I.; Ramesh, G. Variations in texture of beach sediments in the vicinity of the Tirumalairajanar River mouth of India. Int. J. Sediment Res. 2011, 26, 460–470. [Google Scholar] [CrossRef]
- Rajganapathi, V.C.; Jitheshkumar, N.; Sundarajan, M.; Bhat, K.H.; Velusamy, S. Grain size analysis and characterization of sedimentary environment along Thiruchendur coast, Tamilnadu, India. Arabian J. Geosci. 2013, 6, 4717–4728. [Google Scholar] [CrossRef]
- Hunt, H.L. Effects of sediment source and flow regime on clam and sediment transport. Mar. Ecol. Prog. Ser. 2005, 296, 143–153. [Google Scholar] [CrossRef]
- Walling, D.E.; Russell, M.A.; Hodgkinson, R.A. Establishing sediment budgets for two small lowland agricultural catchments in the UK. Catena 2002, 47, 323–353. [Google Scholar] [CrossRef]
- Walling, D.E. Tracing suspended sediment sources in catchments and river system. Sci. Total Environ. 2005, 344, 159–184. [Google Scholar] [CrossRef] [PubMed]
- Yang, M.Y.; Xu, L.J. Fingerprinting suspended sediment sources in a small catchment on the Loess Plateau. J. Soil Water Conserv. 2010, 24, 30–34, (In Chinese with English abstract). [Google Scholar]
- Li, C.S.; Shi, X.F.; Kao, S.J.; Liu, Y.G.; Lyu, H.H.; Zou, J.J.; Liu, S.F.; Qiao, S.Q. Rare earth elements in fine-grained sediments of major rivers from the high-standing island of Taiwan. J. Asian Earth Sci. 2013, 69, 39–47. [Google Scholar] [CrossRef]
- Koiter, A.J.; Owens, P.N.; Petticrew, E.L.; Lobb, D.A. Assessment of particle size and organic matter correction factors in sediment source fingerprinting investigations: An example of two contrasting watersheds in Canada. Geoderma 2018, 325, 195–207. [Google Scholar] [CrossRef]
- Juez, C.; Hassan, M.A.; Franca, M.J. The origin of fine sediment determines the observations of suspended sediment fluxes under unsteady flow conditions. Water Resour. Res. 2018, 54, 5654–5669. [Google Scholar] [CrossRef]
- Laceby, J.P.; McMahon, J.; Evrard, O.; Olley, J. A comparison of geological and statistical approaches to element selection for sediment fingerprinting. J. Soils Sediments 2015, 15, 2117–2131. [Google Scholar] [CrossRef]
- Walling, D.E. The evolution of sediment source fingerprinting investigations in fluvial systems. J. Soils Sediments 2013, 13, 1658–1675. [Google Scholar] [CrossRef]
- Collins, A.L.; Walling, D.E.; Leeks, G.J.L. Sediment sources in the Upper Severn catchment: A fingerprinting approach. Hydrol. Earth Syst. Sci. 1997, 1, 509–521. [Google Scholar] [CrossRef]
- Douglas, G.; Palmer, M.; Caitcheon, G. The provenance of sediments in Moreton Bay, Australia: A synthesis of major, trace element and Sr-Nd-Pb isotopic geochemistry, modeling and landscape analysis. Hydrobiologia 2003, 494, 145–152. [Google Scholar] [CrossRef]
- Blake, W.H.; Ficken, K.J.; Taylor, P.; Russell, M.A.; Walling, D.E. Tracing crop-specific sediment sources in agriculture catchments. Geomorphology 2012, 139–140, 322–329. [Google Scholar] [CrossRef]
- Pulley, S.; Foster, I. Can channel banks be the dominant source of fine sediment in a UK river?: An example using 137Cs to interpret sediment yield and sediment source. Earth Surf. Process. Landf. 2016, in press. [Google Scholar]
- Liu, B.; Storm, D.E.; Zhang, X.C.J.; Cao, W.H.; Duan, X.W. A new method for fingerprinting sediment source contributions using distances from discriminant function analysis. Catena 2016, 147, 32–39. [Google Scholar] [CrossRef]
- Pulley, S.; Collins, A.L. Tracing catchment fine sediment sources using the new SIFT (Sediment Fingerprinting Tool) open source software. Sci. Total Environ. 2018, 635, 838–858. [Google Scholar] [CrossRef]
- Xu, J.X. Erosion and sediment yield of 10 small tributaries joining Inner Mongolia reach of upper Yellow River in relation with coupled wind-water processes and hyperconcentrated flows. J. Sediment Res. 2013, 6, 28–37, (In Chinese with English abstract). [Google Scholar]
- Hamdan, M.A.; Refaat, A.A.; Abu Anwar, E.; Shallaly, N.A. Source of the aeolian dune sand of Toshka area, southeastern Western Desert, Egypt. Aeolian Res. 2015, 17, 275–289. [Google Scholar] [CrossRef]
- Xu, G.; Tang, S.; Lu, K.; Li, P.; Li, Z.; Gao, H.; Zhao, B. Runoff and sediment yield under simulated rainfall on sand-covered slopes in a region subject to wind-water erosion. Environ. Earth Sci. 2015, 74, 2523–2530. [Google Scholar] [CrossRef]
- Cuomo, S.; Della Sala, M. Rainfall-induced infiltration, runoff and failure in steep unsaturated shallow soil deposits. Eng. Geol. 2013, 162, 118–127. [Google Scholar] [CrossRef]
- Harvey, A.M. Coupling between hill slopes and channels in upland fluvial systems: Implications for landscape sensitivity, illustrated from the How gill Fells, northwest England. Catena 2001, 42, 225–250. [Google Scholar] [CrossRef]
- Zhang, X.; Li, Z.B.; Li, P.; Cheng, S.D.; Zhang, Y.; Tang, S.S.; Wang, T. A model to study the grain size components of the sediment deposited in aeolian–fluvial interplay erosion watershed. Sediment. Geol. 2015, 330, 132–140. [Google Scholar] [CrossRef]
- Lin, X.Z.; Guo, Y.; Hou, S.Z. Estimation of sediment discharge of ten tributaries of Yellow River in Inner-Mongolia. J. Sediment Res. 2014, 2, 15–20, (In Chinese with English abstract). [Google Scholar]
- Yang, G.S.; Ta, W.Q. The effect of wind-blown sand on sediment deposition in the channel for Inner Mongolia reach of Yellow River. Northwest Hydropower 2004, 3, 44–49, (In Chinese with English abstract). [Google Scholar]
- Hou, S.Z.; Wang, P.; Guo, X.J.; Chu, W.B. Responses of river sedimentation to water-sediment conditions in Inner Mongolia reach of upper Yellow River. J. Sediment Res. 2015, 1, 61–66, (In Chinese with English abstract). [Google Scholar]
- Thomas, D.S.; Stokes, S.; Shaw, P.A. Holocene aeolian activity in the southwestern Kalahari Desert, southern Africa: Significance and relationships to late-Pleistocene dune-building events. Holocene 1997, 7, 273–281. [Google Scholar] [CrossRef]
- Xu, J.; Yang, J.; Yan, Y. Erosion and sediment yields as influenced by coupled aeolian and fluvial processes: The Yellow River, China. Geomorphology 2006, 73, 1–15. [Google Scholar] [CrossRef]
- YRIHR (Yellow River Institute of Hydraulic Research). The River Situation Advisory Report of Yellow River in 2006; The Yellow River Water Conservancy Press: Zhengzhou, China, 2009. (In Chinese) [Google Scholar]
- Liu, R.X. Analysis of water and soil conservation in the Ten Kongduis of the Jin-Shan-Meng soft sandstone area. Inner Mong. Water Resour. 2013, 6, 68–69, (In Chinese with English abstract). [Google Scholar]
- Konert, M.; Vandenberghe, J. Comparison of laser grain size analysis with pipette and sieve analysis: A solution for the underestimation of the clay fraction. Sedimentology 1997, 44, 523–535. [Google Scholar] [CrossRef]
- McManus, J. Grain size determination and interpretation. In Techniques in Sedimentology; Tucker, M., Ed.; Backwell: Oxford, UK, 1988; pp. 63–85. [Google Scholar]
- Xu, J.X. Temporal and spatial variations in erosion and sediment yield and the cause in the ten small tributaries to the Inner Mongolia Reach of the Yellow River. J. Desert Research 2014, 34, 1–9, (in Chinese with English abstract). [Google Scholar]
- Haddadchi, A.; Ryder, D.S.; Evrard, O.; Olley, J. Sediment fingerprinting in fluvial systems: Review of tracers, sediment sources and mixing models. Int. J. Sediment Res. 2013, 28, 560–578. [Google Scholar] [CrossRef]
- Palazón, L.; Latorre, B.; Gaspar, L.; Blake, W.H.; Smith, H.G.; Navas, A. Comparing catchment sediment fingerprinting procedures using an auto-evaluation approach with virtual sample mixtures. Sci. Total Environ. 2015, 532, 456–466. [Google Scholar] [CrossRef] [PubMed]
- Koiter, A.J.; Owens, P.N.; Petticrew, E.L.; Lobb, D.A. The role of gravel channel beds on the particle size and organic matter selectivity of transported fine-grained sediment: Implications for sediment fingerprinting and biogeochemical flux research. J. Soils Sediments 2015, 15, 2174–2188. [Google Scholar] [CrossRef]
- Fei, X. Mechanism of sediments delivery by hyperconcentrated flows for a long distance and its application. J. Sediment Res. 1998, 1998, 55–61. [Google Scholar]
- Walling, D.E. The sediment delivery problem. J. Hydrol. 1983, 65, 209–237. [Google Scholar] [CrossRef]
- Jerolmack, D.J.; Brzinski, T.A. Equivalence of abrupt grain-size transitions in alluvial rivers and eolian sand seas: A hypothesis. Geology 2010, 38, 719–722. [Google Scholar] [CrossRef]
- Zhang, R.J. River Sediment Dynamics, 2nd ed.; China Water Power Press: Beijing, China, 1998. (In Chinese) [Google Scholar]
- Morris, G.L.; Fan, J. Reservoir Sedimentation Handbook; McGraw-Hill Book Co.: New York, NY, USA, 1998. [Google Scholar]
- Xu, J.X. The effects of coupled wind-water erosion on the hyperconcentrated flows of the Yellow River. Scientia Sinica Terrae 2005, 35, 899–906. (In Chinese) [Google Scholar]
- Liu, J.; Ding, L.; Zeng, L.S.; Tapponnier, P.; Gaudemer, Y. Large-scale terrain analysis of selected regions of the Tibetan plateau: discussion on the origin of plateau planation surface. Earth Science Frontiers 2006, 13, 285–299, (In Chinese with English abstract). [Google Scholar]
- Srisutam, C.; Wagner, J.-F. Tsunami sediment characteristics at the Thai Andaman coast. Pure Appl. Geophys. 2010, 167, 215–232. [Google Scholar] [CrossRef]
- Qian, N.; Zhang, R.; Wan, Z.; Wang, X. The hyperconcentrated flow in the main stem and tributaries of the Yellow River. Int. J. Sediment Res. 1988, 3, 76–95. [Google Scholar]
- Chien, N.; Wan, Z.; Qian, Y. The flow with heavy sediment concentration in the Yellow River basin. J. Tsinghua Univ. (Sci. Technol.) 1979, 19, 1–17, (In Chinese with English abstract). [Google Scholar]
- Ta, W.Q.; Yang, G.S.; Qu, J.J.; Wang, T.; Dai, F.N. The effect of the coarse aeolian sand on siltation of the Inner Mongolian reach of the Yellow River. Environ. Geol. 2003, 43, 493–502. [Google Scholar] [CrossRef]
- Yao, H.F.; Shi, C.X.; Shao, W.W.; Bai, J.B.; Yang, H. Changes and influencing factors of sediment load in the Xiliugou basin of the upper Yellow River, China. Catena 2016, 142, 1–10. [Google Scholar] [CrossRef]


| Sediment Source | Number of Samples | Values | Grain-Size Classes | |||
|---|---|---|---|---|---|---|
| <0.02 mm | 0.02–0.05 mm | 0.05–0.5 mm | 0.5–2 mm | |||
| Pisha | 13 | Mean value | 17.50% | 18.84% | 25.73% | 37.93% |
| Range | 7.28%–41.59% | 5.17%–29.02% | 5.59%–51.16% | 2.12%–81.96% | ||
| Loess | 5 | Mean value | 57.39% | 28.58% | 13.63% | 0.40% |
| Range | 45.35%–61.65% | 26.77%–29.05% | 9.30%–27.88% | 0–1.2% | ||
| Aeolian sand | 5 | Mean value | 0 | 0 | 100% | 0 |
| Range | 0–0 | 0–0 | 100%–100% | 0–0 | ||
| Sampling Sites | Grain-Size Parameters | Median Grain Size (ϕ) | ||||
|---|---|---|---|---|---|---|
| Mean Grain Size (ϕ) | Sorting Coefficient (ϕ) | Skewness | Kurtosis | |||
| DHG1 | DHG1-1 | 5.90 | 3.96 | −0.60 | 2.36 | 7.10 |
| DHG1-2 | 3.43 | 4.73 | 0.08 | 1.47 | 5.64 | |
| DHG1-3 | 4.87 | 3.48 | −0.12 | 2.34 | 5.65 | |
| DHG1-4 | 3.50 | 3.84 | 0.16 | 1.97 | 4.33 | |
| HSL | 4.03 | 3.60 | 0.20 | 2.05 | 4.33 | |
| MHR | MHR1 | 3.68 | 3.37 | 0.19 | 2.32 | 3.85 |
| MHR2 | 5.00 | 2.80 | 0.03 | 3.90 | 4.85 | |
| MHR3 | 5.10 | 2.28 | 0.61 | 5.08 | 4.56 | |
| DLG | 5.04 | 3.35 | −0.27 | 2.62 | 5.63 | |
| Cores or Sections | Samples | Depth (m) | p Values | Cores or Sections | Samples | Depth (m) | p Values |
|---|---|---|---|---|---|---|---|
| MBLZ1 | MBLZ1-1~3 | 0–2.1 | 0.017 | MBLZ2 | MBLZ2-1~3 | 0–1.27 | 0.025 |
| MBLZ1-4~9 | 2.1–4.6 | MBLZ2-4~6 | 1.27–1.8 | ||||
| MBLZ1-10~11 | 4.6–5 | MBLZ2-7~18 | 1.8–5.79 | ||||
| DHGZ | DHGZ1-1~2 | 0–0.9 | 0.046 | HLGZ | HLGZ1-1~4 | 0–2.2 | 0.089 |
| DHGZ1-3~8 | 0.9–5 | HLG1-5~11 | 2.2–5 | ||||
| XLGZ | XLGZ1-1~3 | 0–3.02 | 0.212 | HTCZ | HTCZ1-1~3 | 0–1.45 | 0.053 |
| XLGZ1-4~5 | 3.02–3.65 | HTCZ1-4~10 | 1.45–5 | ||||
| XLGZ1-6~9 | 3.65–5 | ||||||
| HSLZ | HSLZ1-1~12 | 0–3.25 | 0.085 | MHRZ | MHRZ1-1~9 | 0–4.4 | 0.223 |
| HSLZ1-13~19 | 3.25–5 | MHRZ1-10 | 4.4–5 | ||||
| DLGZ | DLGZ1-1~5 | 0–2.45 | 0.011 | HSTZ | HSTZ1-1~2 | 0–1.2 | 0.036 |
| DLGZ1-6~11 | 2.45–5 | HSTZ1-3~6 | 1.2–3.8 | ||||
| HSTZ1-7~10 | 3.8–5 |
| Kongduis | Proportion of Different Sources (%) | Kongduis | Proportion of Different Sources (%) | ||||||
|---|---|---|---|---|---|---|---|---|---|
| Sandstone | Loess | Aeolian Sand | Sandstone | Loess | Aeolian Sand | ||||
| MBLZ1 | 0–2.1 m | 59.42 | 26.23 | 14.35 | XLG | 0–5 m | 3.68 | 30.84 | 65.48 |
| 2.1–4.6 m | 77.45 | 10.78 | 11.77 | HTC | 0–5 m | 15.79 | 19.22 | 64.98 | |
| 4.6–5 m | 81.11 | 8.07 | 10.82 | HSL | 0–5 m | 47.67 | 16.38 | 35.95 | |
| Weighted average | 70.17 | 17.05 | 12.78 | MHR | 0–5 m | 1.70 | 26.56 | 71.74 | |
| MBLZ2 | 0–1.27 m | 44.13 | 31.61 | 24.26 | DLG | 0–2.45 m | 1.84 | 24.22 | 73.93 |
| 1.27–1.8 | 39.31 | 31.93 | 28.76 | 2.45–5 m | 2.57 | 28.78 | 68.65 | ||
| 1.8–5.79 | 38.99 | 36.79 | 24.22 | Weighted average | 2.21 | 26.55 | 71.24 | ||
| Weighted average | 40.15 | 35.21 | 24.64 | HST | 0–1.2 m | 68.75 | 1.35 | 29.90 | |
| DHG | 0–0.9 m | 3.71 | 24.53 | 71.77 | 1.2–3.8 m | 0.16 | 28.75 | 71.10 | |
| 0.9–5 m | 3.00 | 30.95 | 66.06 | 3.8–5 m | 44.91 | 12.81 | 42.27 | ||
| Weighted average | 3.12 | 29.79 | 67.09 | Weighted average | 27.36 | 18.35 | 54.29 | ||
| HLG | 0–5 m | 2.06 | 24.56 | 73.38 | |||||
© 2019 by the authors. Licensee MDPI, Basel, Switzerland. This article is an open access article distributed under the terms and conditions of the Creative Commons Attribution (CC BY) license (http://creativecommons.org/licenses/by/4.0/).
Share and Cite
Yang, H.; Shi, C. Sediment Grain-Size Characteristics and its Sources of Ten Wind-Water Coupled Erosion Tributaries (the Ten Kongduis) in the Upper Yellow River. Water 2019, 11, 115. https://doi.org/10.3390/w11010115
Yang H, Shi C. Sediment Grain-Size Characteristics and its Sources of Ten Wind-Water Coupled Erosion Tributaries (the Ten Kongduis) in the Upper Yellow River. Water. 2019; 11(1):115. https://doi.org/10.3390/w11010115
Chicago/Turabian StyleYang, Hui, and Changxing Shi. 2019. "Sediment Grain-Size Characteristics and its Sources of Ten Wind-Water Coupled Erosion Tributaries (the Ten Kongduis) in the Upper Yellow River" Water 11, no. 1: 115. https://doi.org/10.3390/w11010115
APA StyleYang, H., & Shi, C. (2019). Sediment Grain-Size Characteristics and its Sources of Ten Wind-Water Coupled Erosion Tributaries (the Ten Kongduis) in the Upper Yellow River. Water, 11(1), 115. https://doi.org/10.3390/w11010115