Interval Multi-Attribute Decision of Watershed Ecological Compensation Schemes Based on Projection Pursuit Cluster


Abstract
:1. Introduction
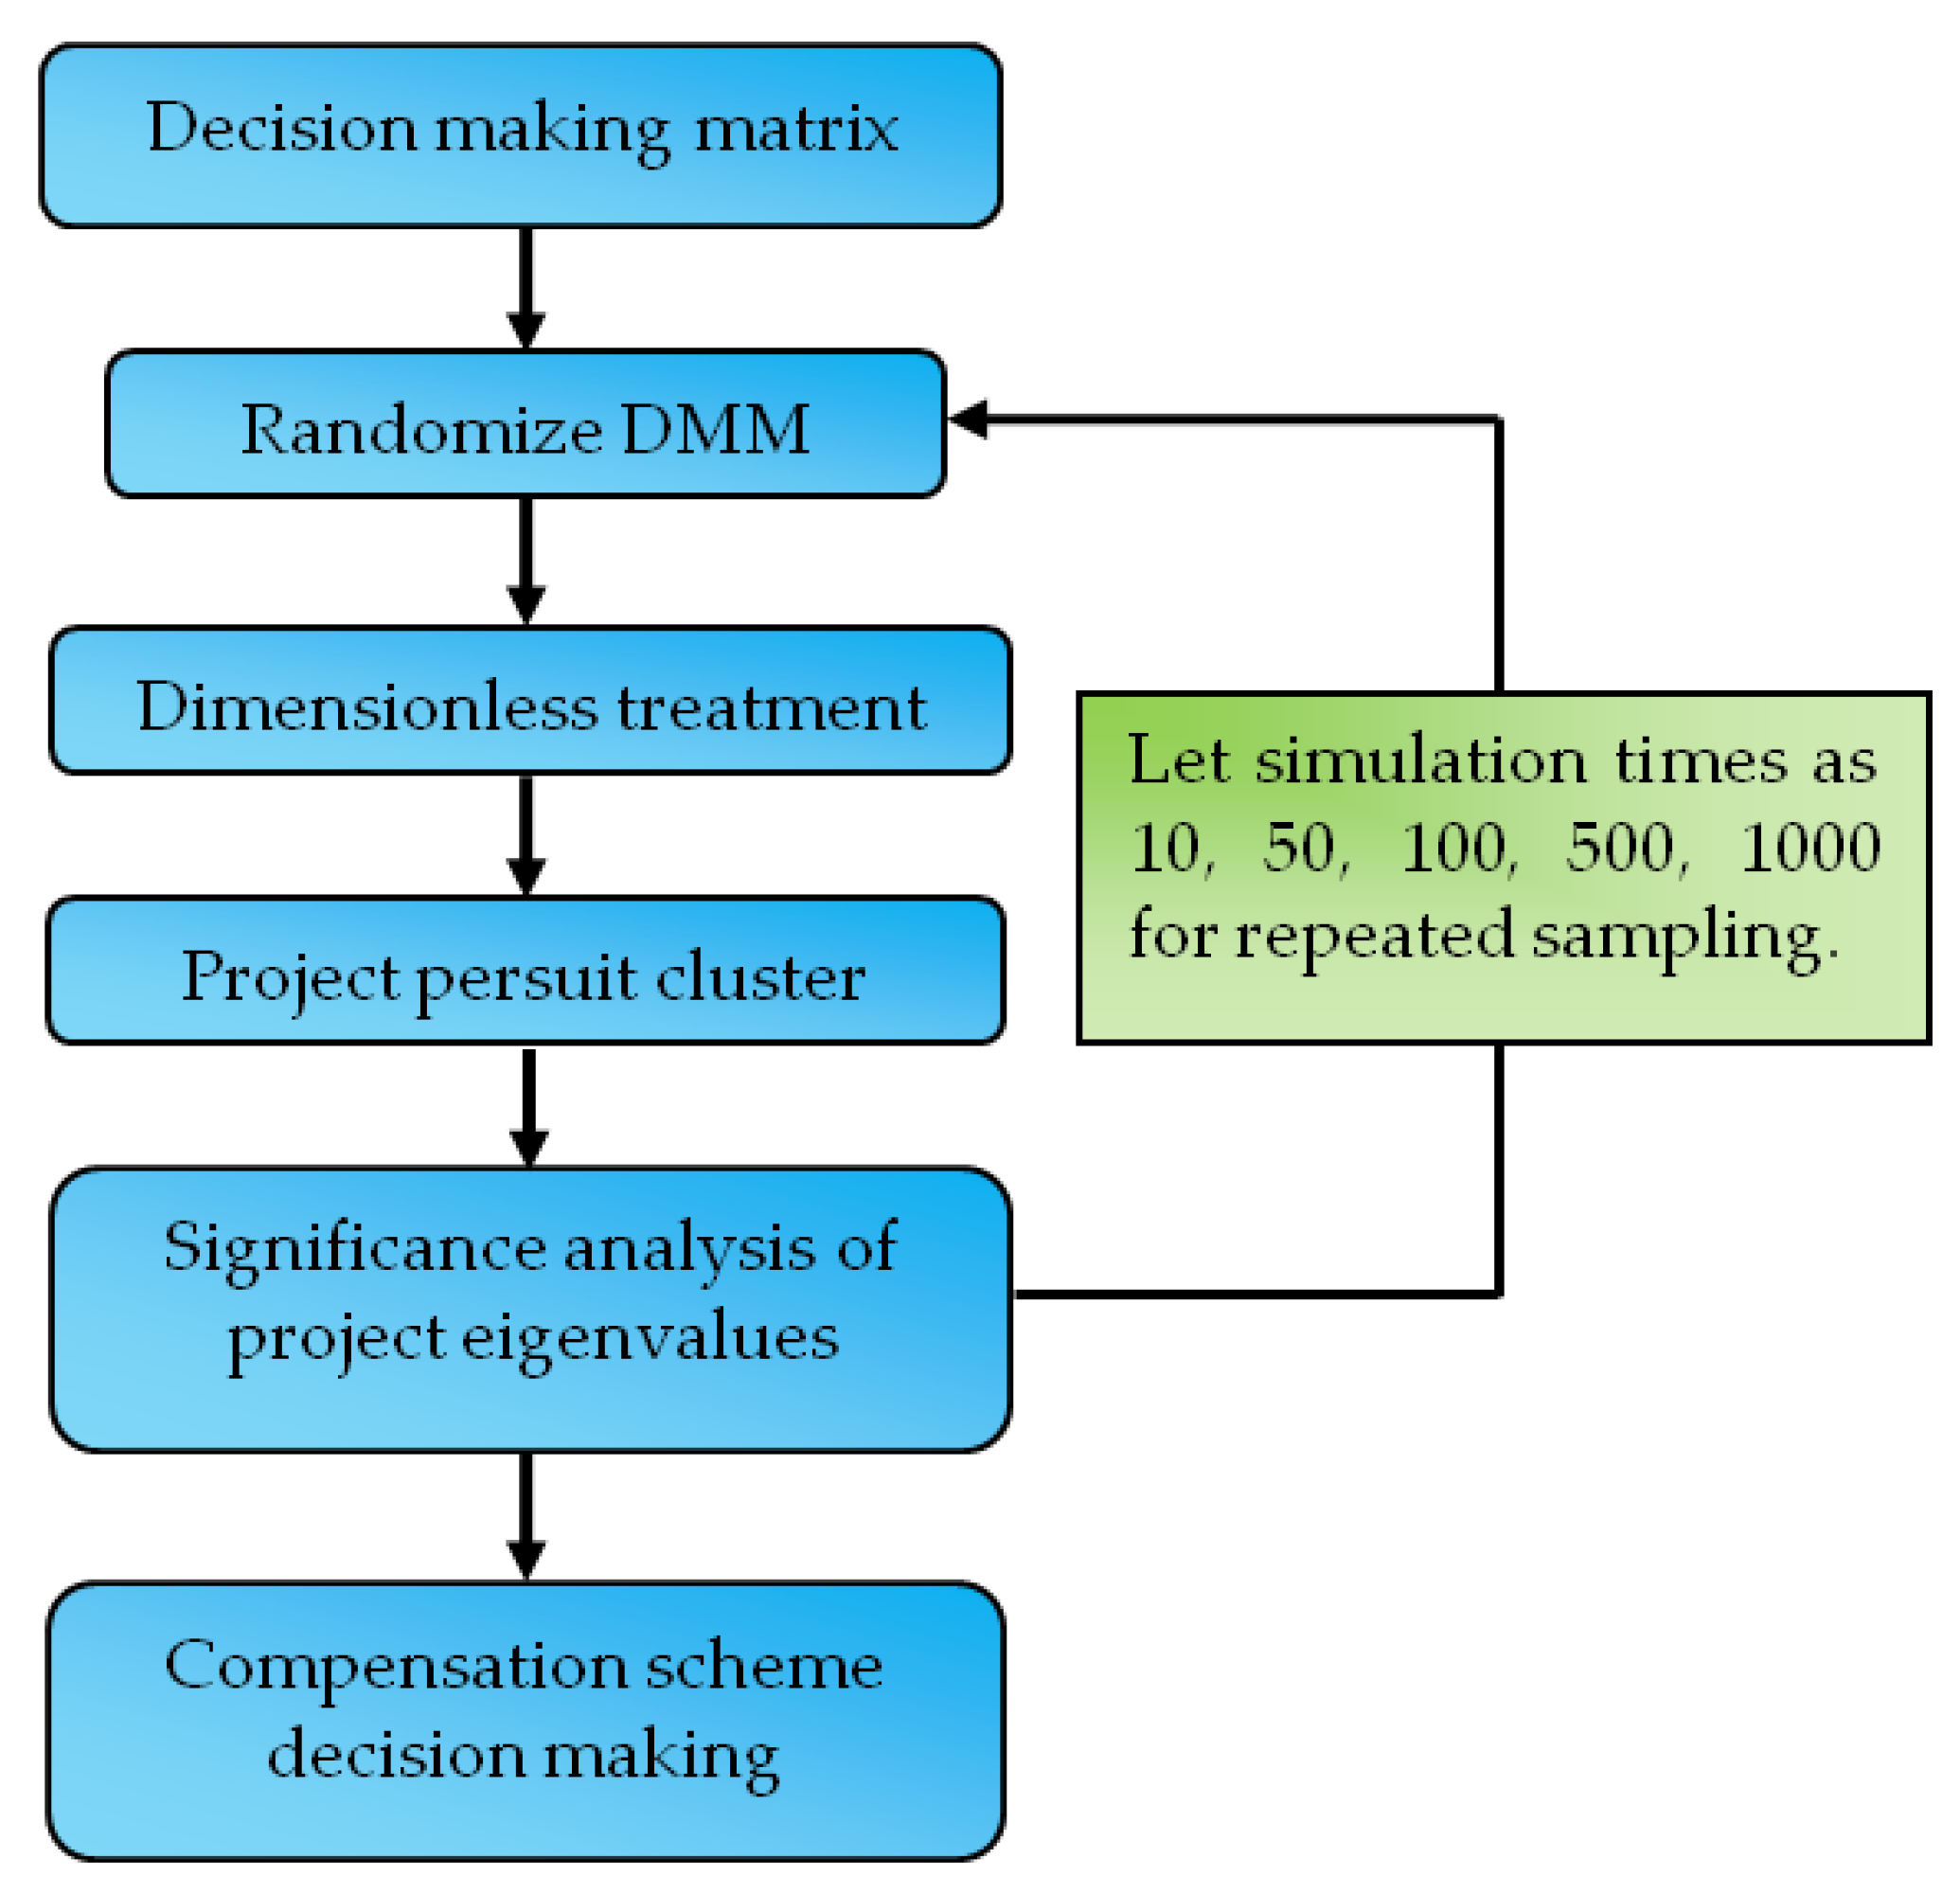
2. Materials and Methods
2.1. Randomize Decision-Making Matrix
2.2. Dimensionless Data Treatment
2.3. Projection Pursuit Cluster
2.4. Compensation Scheme Decision Making
2.5. Study Area
3. Results
3.1. Random Schemes and Dimensionless Treatment
3.2. Weights of Each Index by PPC Method
3.3. Decision-Making of Each Scheme
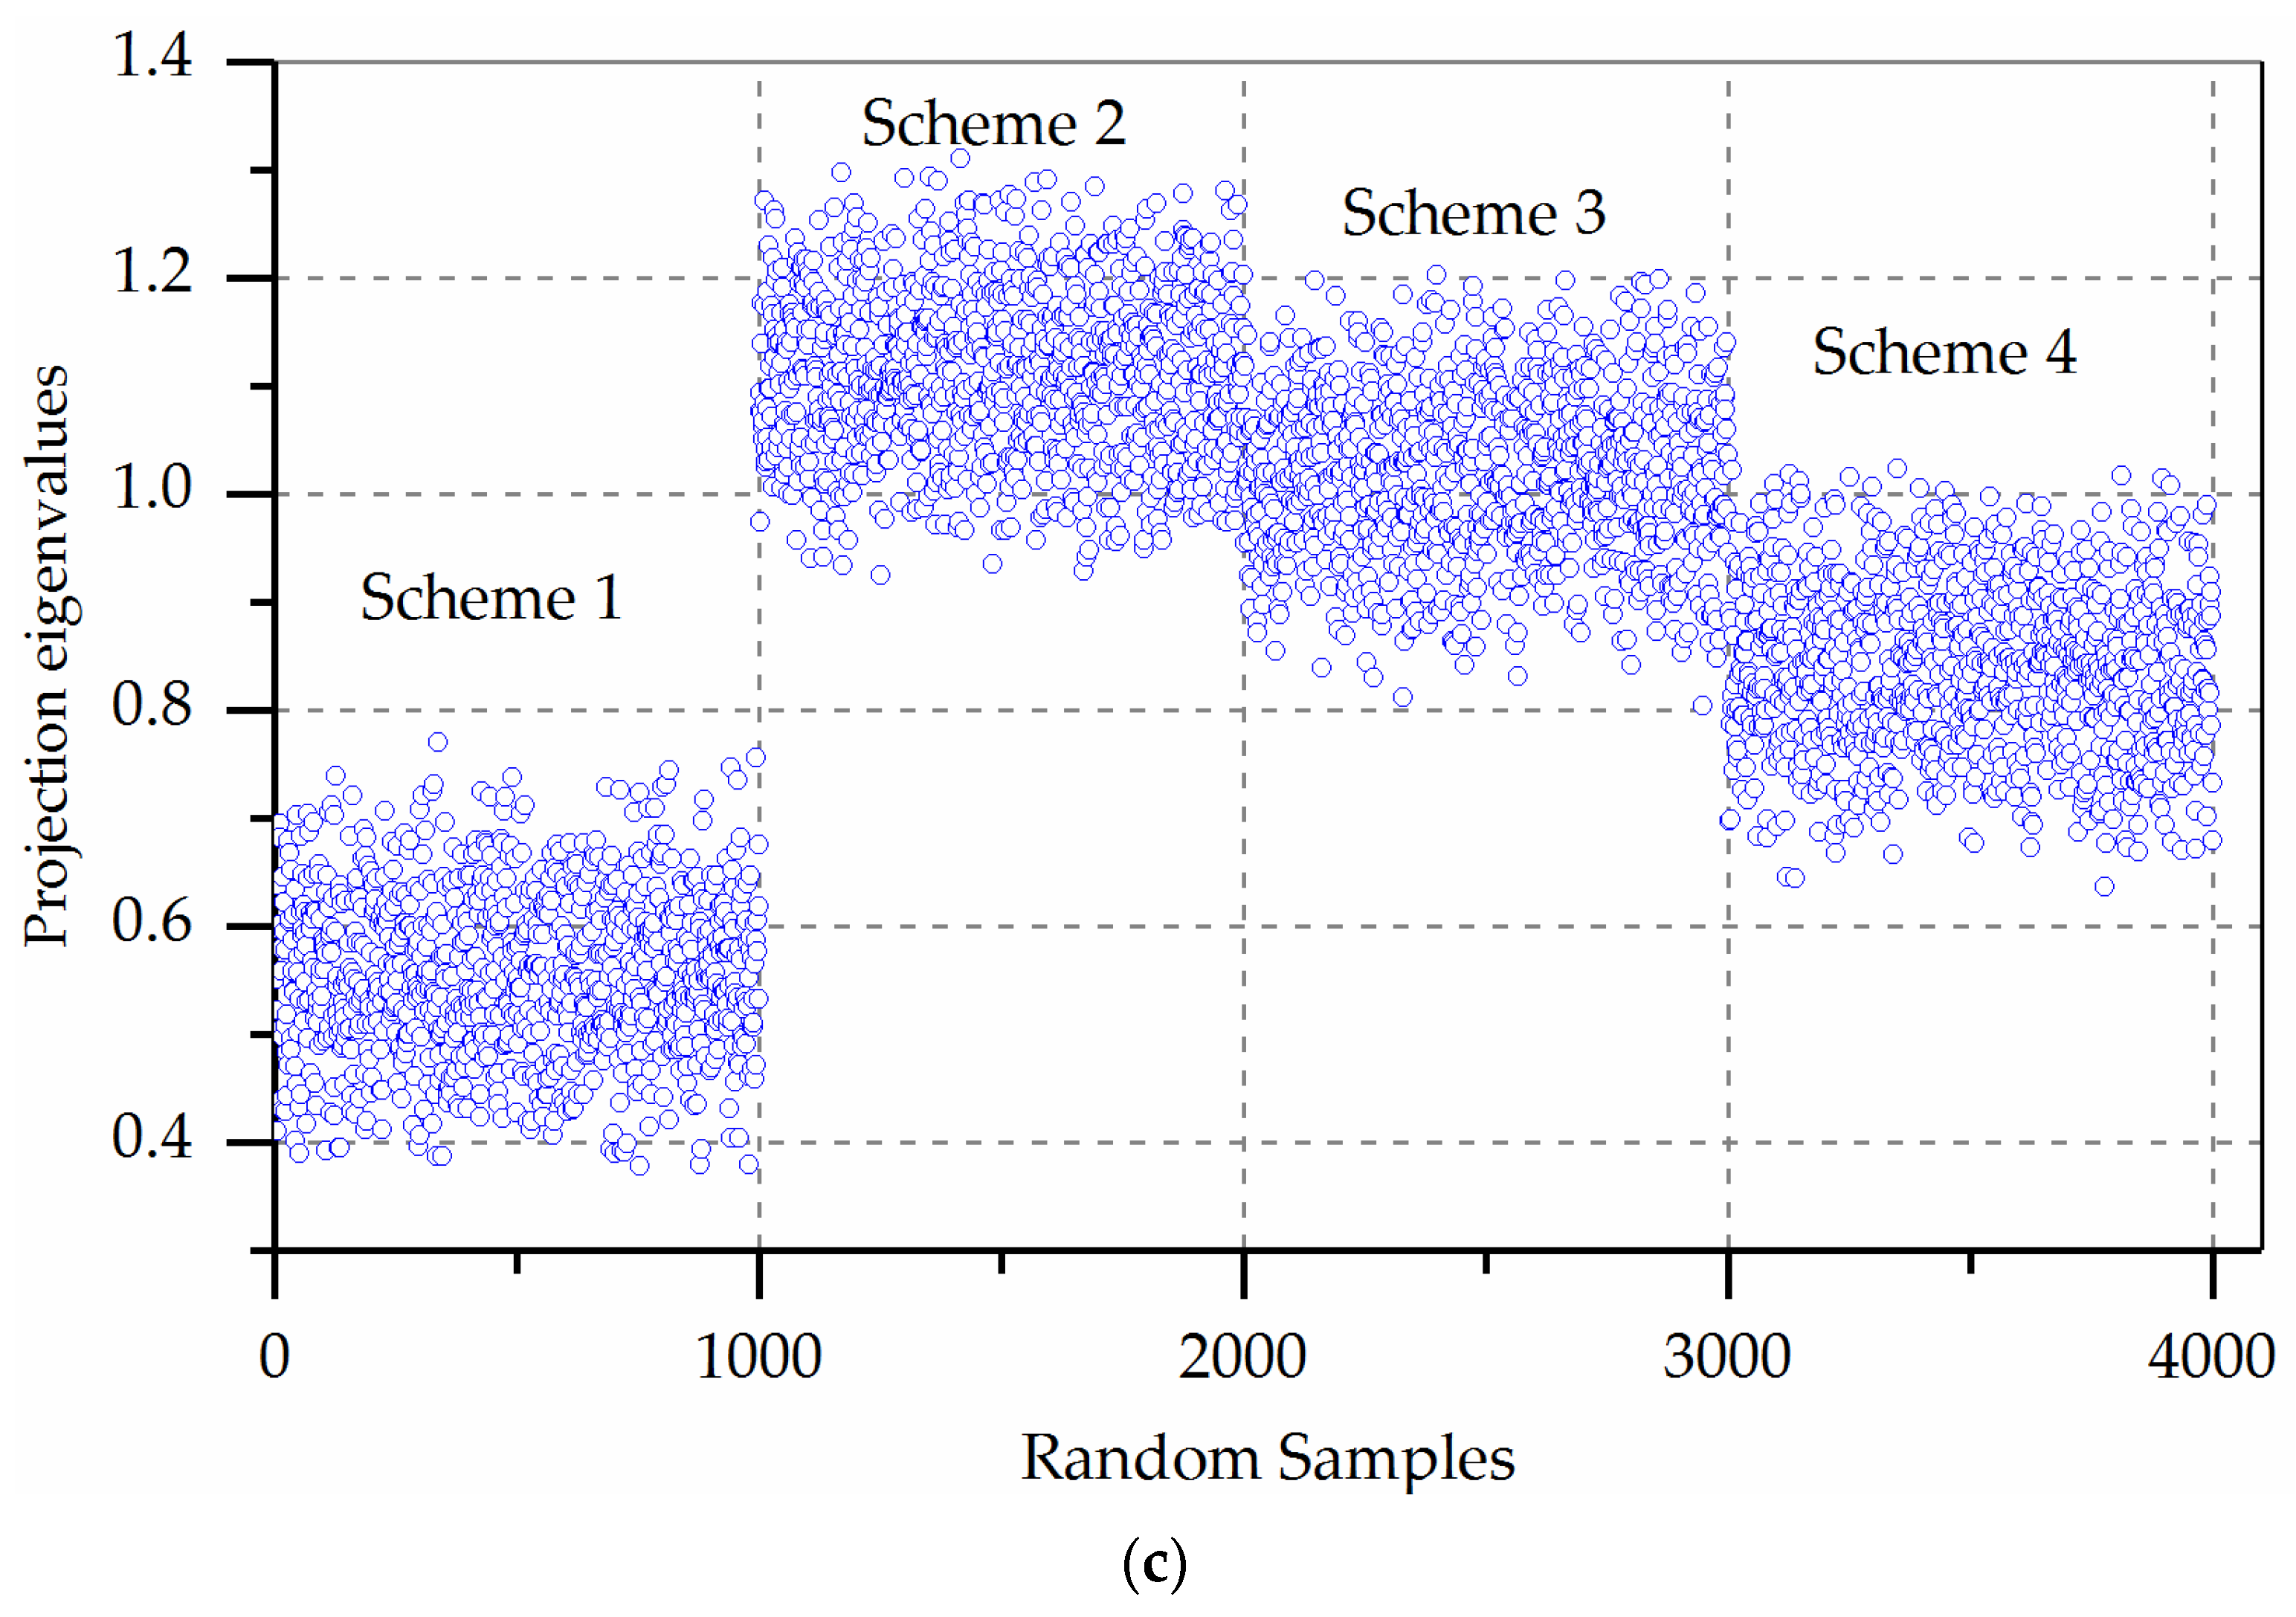
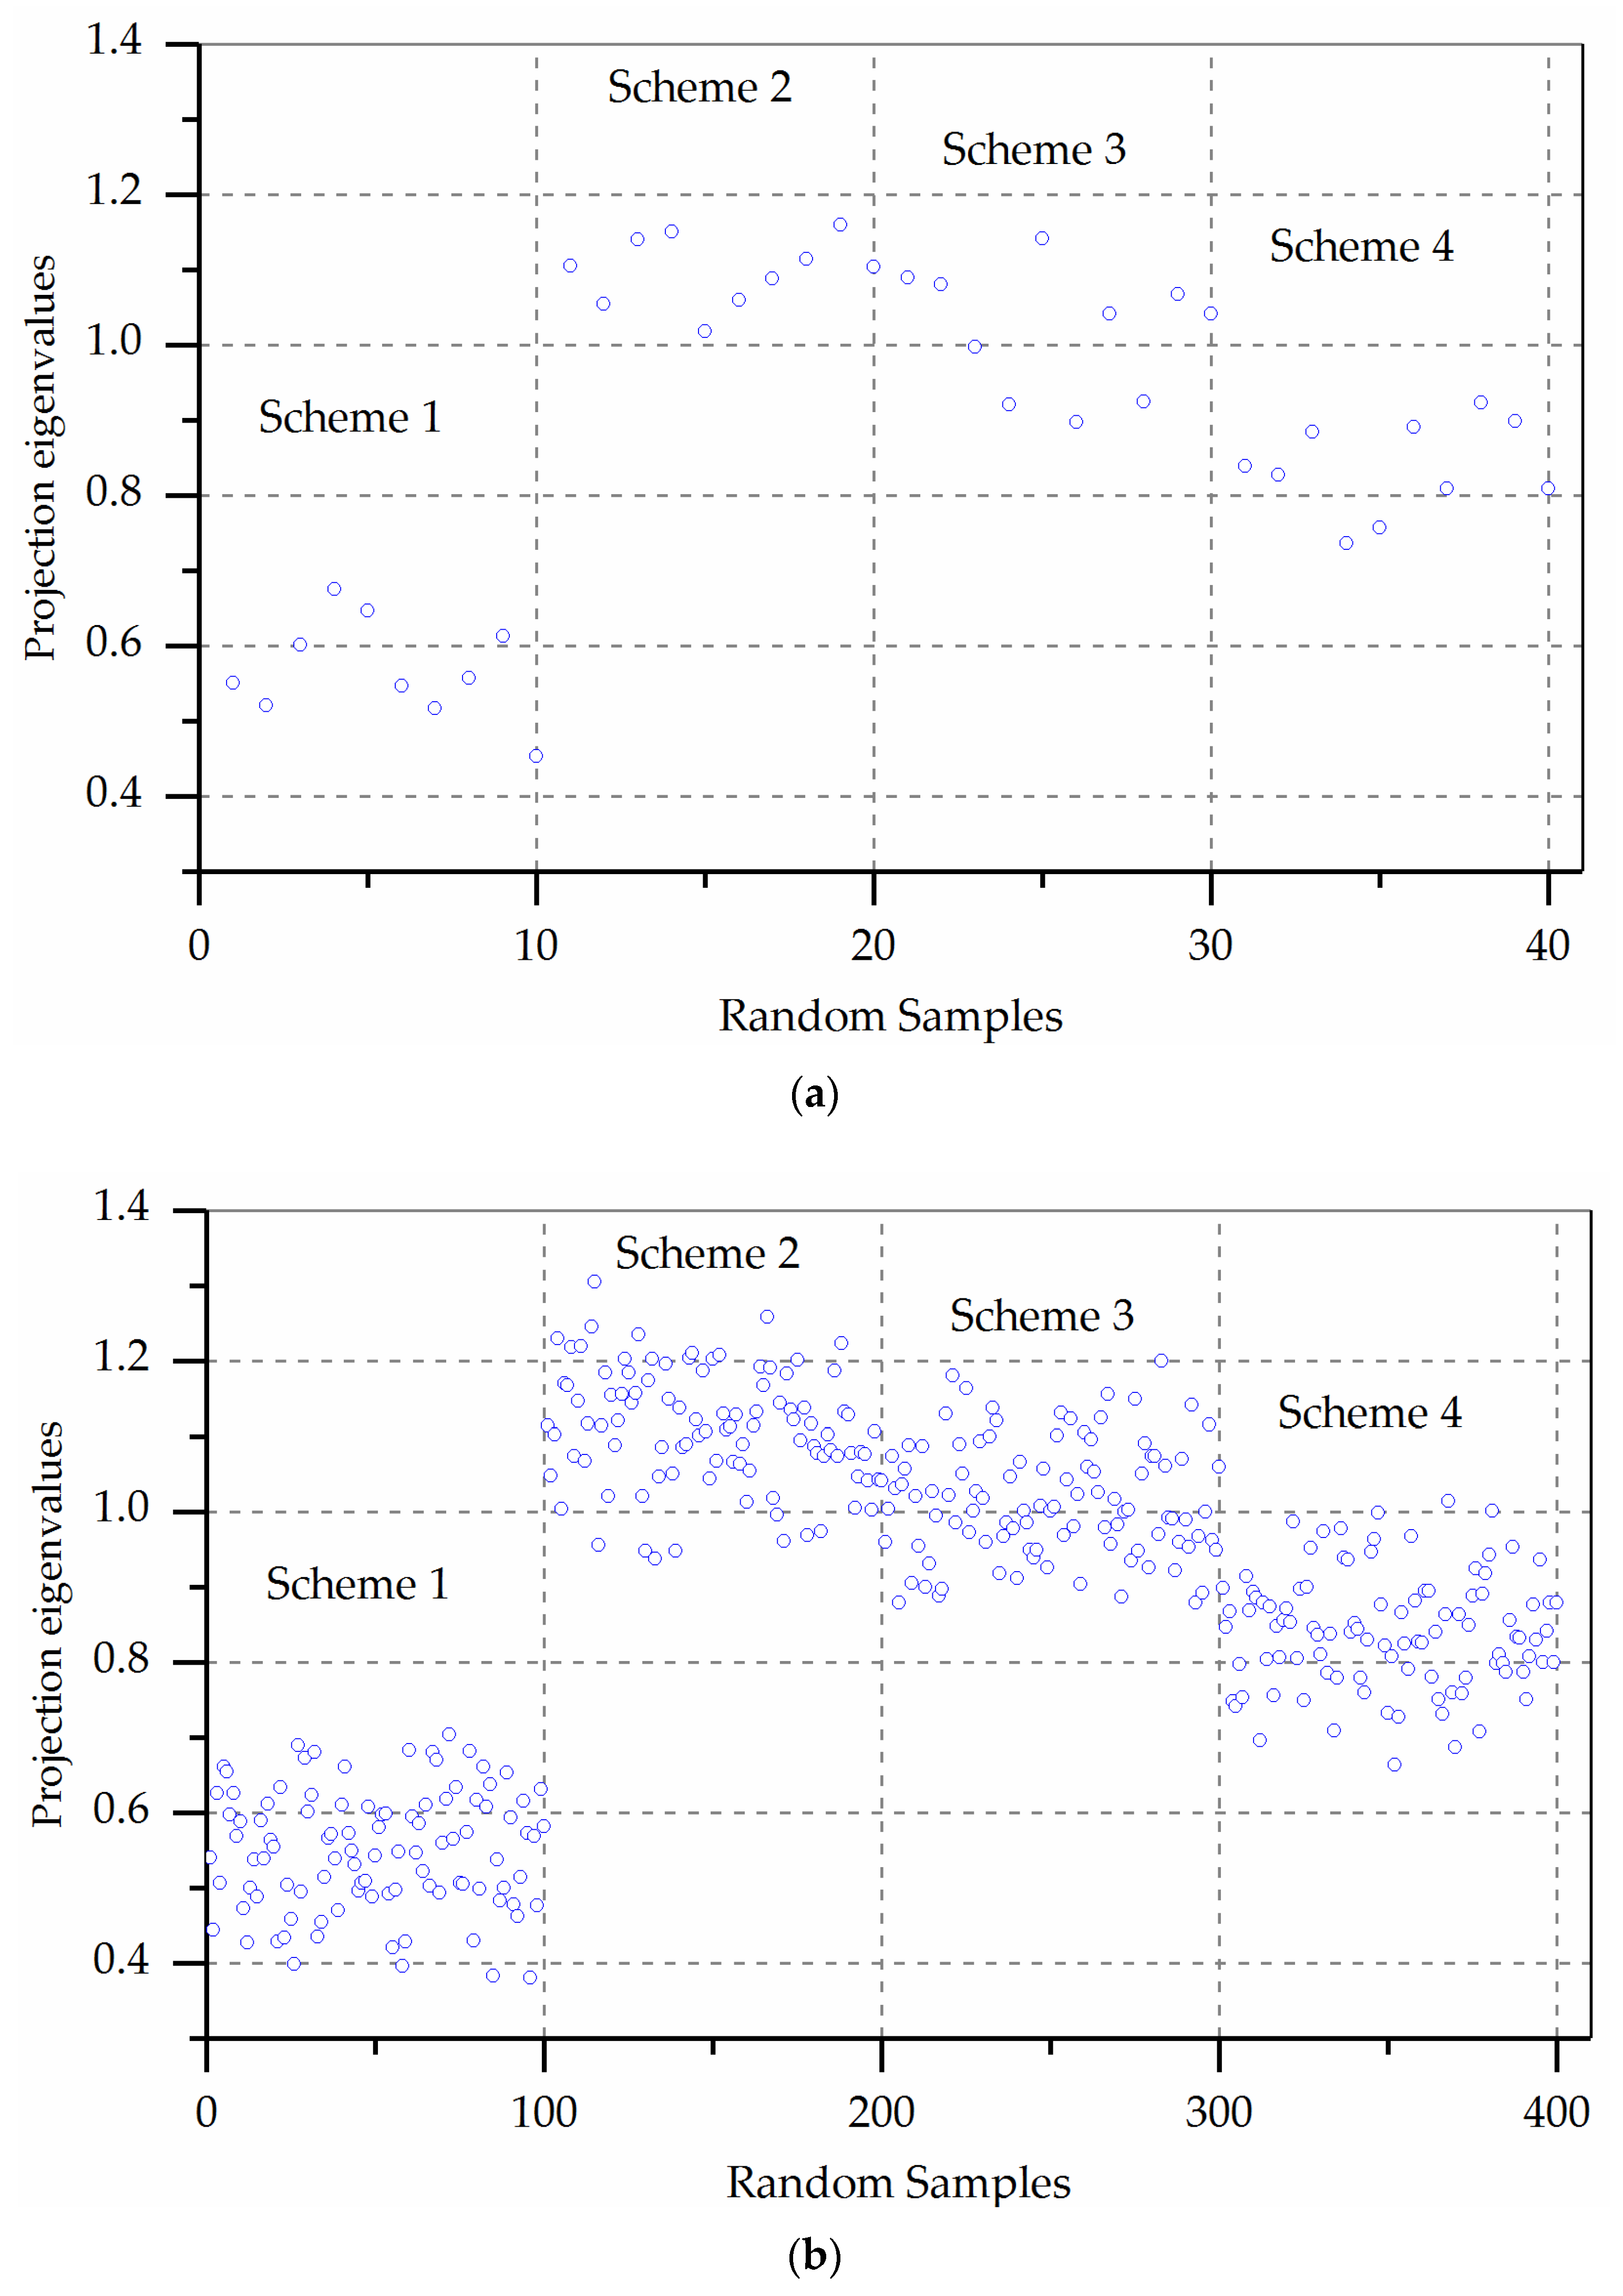
3.3.1. Scatter Plot of Each Scheme
3.3.2. Statistical Analysis of Projection Eigenvalues
3.4. Analysis of Decision-Making Results
3.4.1. Reasonableness of Decision-Making Results
3.4.2. Results of Comparison with Other Methods
4. Conclusions
- (1)
- The attribute values of the decision schemes are uncertain, and the standard deviation of the decision results is larger. This problem can be solved by simulating a large number of solutions through stochastic simulation techniques. According to the results of various numbers of random simulations, the decision of all the schemes can be analyzed significantly to improve the reliability of the decision results.
- (2)
- Using the PPC method can improve the accuracy of the decision result, especially the multi-attribute decision problem of the matrix element for entire interval number or a part. With the increase of the number of simulations, the scatter plot of each scheme demonstrates the superiority of the S2 scheme.
- (3)
- The weight of the C2 attribute is the largest, followed by the compensation mode C1 and the compensation time C3, which are consistent with subjective weight. When the number of simulations was 50, 100, 500, and 1000, S2 was significantly better than the other schemes at 0.01 significance levels. It is clear that the combination scheme of money compensation and development in different place is better than that of others, and it is worth using in the decision of ecological compensation of watershed water pollution.
Author Contributions
Funding
Acknowledgments
Conflicts of Interest
References
- Kosoy, N.; Corbera, E.; Brown, K. Participation in payments for ecosystem services: case studies from the lacandon rainforest, mexico. Geoforum 2008, 39, 2073–2083. [Google Scholar] [CrossRef]
- Costanza, R.; d’Arge, R.; de Groot, R. The value of the world’s ecosystem services and natural capital. Nature 1997, 387, 253–260. [Google Scholar] [CrossRef]
- Jansson, N.K.; Levin, S.; Lubchenco, J. The value of nature and the nature of value. Science 2000, 289, 395–396. [Google Scholar]
- Kumar, P. Payment for ecosystem services: Emerging lessons. Ecol. Econ. 2008, 16, 2–14. [Google Scholar]
- Pattanayak, S.K. Valuing watershed services: Concepts and empirics from Southeast Asia agriculture. Ecosyst. Environ. 2004, 104, 171–184. [Google Scholar] [CrossRef]
- Kosoy, N.; Martinez-Tuna, M.; Muradian, R. Payments for Environmental Services in Watersheds: Insights from a Comparative Study of Three Cases in Central America. Ecol. Econ. 2007, 61, 446–455. [Google Scholar] [CrossRef]
- Lu, T.; Dai, X.; Chen, J.; Dai, M. Pricing Industrial Discharge Quota (IDQ): A Model Reflecting Opportunity Cost of Performing Ecological Responsibility. Sustainability 2018, 10, 2032. [Google Scholar] [CrossRef]
- Wunder, S.; Enge, S.; Pagiola, S. Taking Stock: A Comparative Analysis of Payments for Environmental Services Programs in Developed and Developing Countries. Ecol. Econ. 2008, 65, 834–852. [Google Scholar] [CrossRef]
- Sand, I.; Mwangi, J.; Namirembe, S. Can payments for ecosystem services contribute to adaptation to climate change insights from a watershed in Kenya. Ecol. Soc. 2014, 19, 360–375. [Google Scholar]
- Cheng, X.; Kai, F. Research Review of Ecological Compensation Mechanism in Drainage Basin. J. North China Univ. Water Res. Electr. Power 2018, 34, 9–13. [Google Scholar]
- Liu, X.H.; Yu, X.J. Research on Standardization of Compensation for Trans-regional Water Pollution Based on Protection of Water Eco-system in River Valley: An Empirical Analysis of Tai Lake Basin. Ecol. Econ. 2007, 8, 129–135. [Google Scholar]
- Zhang, J.; Zeng, Y.Q. Multi-attribute Decision Making Model of Water Pollution Ecological Compensation Plans Based on Prospect Theory. Environ. Sci. Technol. 2015, 28, 55–59. [Google Scholar]
- Kahneman, D.; Tversky, A. Prospect Theory: An Analysis of Decision under Risk. Econometrica 1979, 47, 263–292. [Google Scholar] [CrossRef]
- Liu, S.; Liu, X.; Qin, J. Three-way group decisions based on prospect theory. J. Oper. Res. Soc. 2017, 69, 25–35. [Google Scholar] [CrossRef]
- Wu, Y.; Xu, C.; Zhang, T. Evaluation of renewable power sources using a fuzzy MCDM based on cumulative prospect theory: A case in China. Energy 2018, 147, 1227–1239. [Google Scholar] [CrossRef]
- Jin, J.L.; Wei, Y.M.; Zou, L.L.; Liu, L.; Fu, J. Risk evaluation of China’s natural disaster systems: An approach based on triangular fuzzy numbers and stochastic simulation. Nat. Hazards 2012, 62, 129–139. [Google Scholar] [CrossRef]
- Wu, S.; Lien, H.; Chang, C. Modeling risk analysis for forecasting peak discharge during flooding retention and warning operation. Stoch. Environ. Res. Risk Assess. 2013, 27, 713–723. [Google Scholar]
- Zhao, J.; Jin, J.L.; Guo, Q.Z.; Liu, L.; Chen, Y.Q.; Pan, M. Dynamic risk assessment model for flood disaster on a projection pursuit cluster and its application. Stoch. Environ. Res. Risk Assess. 2014, 28, 2175–2183. [Google Scholar] [CrossRef]
- Yang, X.H.; Yang, Z.F.; Li, J.Q. A genetic projection pursuit interpolation model for comprehensive assessment of water quality. Eng. Sci. 2004, 22, 66–71. [Google Scholar]
- Wang, S.J.; Li, Y.Q. A dynamic cluster model based on projection pursuit with its application to climate zoning. J. Appl. Meteorol. Sci. 2007, 18, 722–726. [Google Scholar]
- Zhou, R.X.; Pan, Z.W.; Jin, J.L.; Li, C.H.; Ning, S.W. Forewarning model of regional water resources carrying capacity based on combination weights and entropy principles. Entropy 2017, 19, 574. [Google Scholar] [CrossRef]
- Cui, Y.; Feng, P.; Jin, J.L.; Liu, L. Water resources carrying capacity evaluation and diagnosis based on set pair analysis and improved the entropy weight method. Entropy 2018, 20, 359. [Google Scholar] [CrossRef]
- Jin, J.L.; Cheng, J.; Wei, Y.M. Forecasting flood disasters using an accelerated genetic algorithm: Examples of two case studies for China. Nat. Hazards 2008, 44, 85–92. [Google Scholar] [CrossRef]
- Jin, J.L.; Yang, X.H.; Ding, J. Improved scheme of simple genetic algorithm accelerating genetic algorithm. Theory Pract. Syst. Eng. 2001, 21, 8–13. [Google Scholar]


| Schemes | Compensation Mode | Compensation Capital | Compensation Time |
|---|---|---|---|
| S1 | Money compensation (MC) | 300 million Yuan | 30 day after pollution occurs |
| S2 | Development in different place (DDP) and MC | 200 million Yuan for MC, and 300 million Yuan for DDP | 15 day after pollution occurs, and 60 day after making DDP compensation scheme |
| S3 | Aid project (AP) and MC | 250 million Yuan for MC, and 250 million Yuan for AP | 15 day after pollution occurs, and 60 day after making AP compensation scheme |
| S4 | AP and DDP | 500 million Yuan | 60 day after making DDP and AP compensation scheme |
| Scheme | C1 | C2 | C3 | |||
|---|---|---|---|---|---|---|
| Lower | Upper | Lower | Upper | Lower | Upper | |
| S1 | 3 | 5 | 5 | 7 | 3 | 5 |
| S2 | 7 | 9 | 8 | 10 | 2 | 4 |
| S3 | 7 | 9 | 7 | 9 | 3 | 5 |
| S4 | 8 | 10 | 2 | 4 | 7 | 9 |
| weight | 0.2 | 0.5 | 0.6 | 0.8 | 0.1 | 0.2 |
| Scheme | No. | Original Random Samples | Dimensionless Samples | ||||
|---|---|---|---|---|---|---|---|
| C1 | C2 | C3 | C1 | C2 | C3 | ||
| S1 | 1 | 3.103 | 6.496 | 4.318 | 0.015 | 0.562 | 0.331 |
| 2 | 3.490 | 5.569 | 4.980 | 0.070 | 0.446 | 0.426 | |
| 3 | 4.247 | 6.077 | 4.379 | 0.178 | 0.510 | 0.340 | |
| 4 | 4.982 | 6.708 | 3.414 | 0.283 | 0.589 | 0.202 | |
| 5 | 4.424 | 6.678 | 3.798 | 0.203 | 0.585 | 0.257 | |
| 6 | 3.781 | 6.053 | 4.034 | 0.112 | 0.507 | 0.291 | |
| 7 | 4.772 | 5.132 | 3.660 | 0.253 | 0.392 | 0.237 | |
| 8 | 3.394 | 6.093 | 4.814 | 0.056 | 0.512 | 0.402 | |
| 9 | 3.886 | 6.447 | 4.455 | 0.127 | 0.556 | 0.351 | |
| 10 | 3.305 | 5.496 | 3.974 | 0.044 | 0.437 | 0.282 | |
| S2 | 11 | 8.539 | 8.028 | 3.988 | 0.791 | 0.753 | 0.284 |
| 12 | 7.583 | 9.017 | 2.413 | 0.655 | 0.877 | 0.059 | |
| 13 | 8.895 | 8.593 | 2.956 | 0.842 | 0.824 | 0.137 | |
| 14 | 8.488 | 8.913 | 3.189 | 0.784 | 0.864 | 0.170 | |
| 15 | 7.325 | 8.553 | 3.022 | 0.618 | 0.819 | 0.146 | |
| 16 | 8.219 | 8.452 | 2.642 | 0.746 | 0.806 | 0.092 | |
| 17 | 8.488 | 8.545 | 2.608 | 0.784 | 0.818 | 0.087 | |
| 18 | 7.161 | 9.251 | 3.920 | 0.594 | 0.906 | 0.274 | |
| 19 | 8.467 | 9.230 | 2.750 | 0.781 | 0.904 | 0.107 | |
| 20 | 7.286 | 9.947 | 2.038 | 0.612 | 0.993 | 0.005 | |
| S3 | 21 | 8.847 | 8.275 | 2.616 | 0.835 | 0.784 | 0.088 |
| 22 | 8.736 | 7.933 | 3.318 | 0.819 | 0.742 | 0.188 | |
| 23 | 7.971 | 8.283 | 2.080 | 0.710 | 0.785 | 0.011 | |
| 24 | 7.027 | 8.071 | 2.424 | 0.575 | 0.759 | 0.061 | |
| 25 | 8.446 | 8.694 | 3.541 | 0.778 | 0.837 | 0.220 | |
| 26 | 7.016 | 7.505 | 3.150 | 0.574 | 0.688 | 0.164 | |
| 27 | 8.740 | 7.716 | 2.938 | 0.820 | 0.715 | 0.134 | |
| 28 | 7.421 | 7.682 | 2.676 | 0.632 | 0.710 | 0.097 | |
| 29 | 8.499 | 8.551 | 2.125 | 0.786 | 0.819 | 0.018 | |
| 30 | 8.359 | 8.145 | 2.658 | 0.766 | 0.768 | 0.094 | |
| S4 | 31 | 8.315 | 3.527 | 8.064 | 0.759 | 0.191 | 0.866 |
| 32 | 9.716 | 2.629 | 7.334 | 0.959 | 0.079 | 0.762 | |
| 33 | 8.521 | 3.911 | 7.885 | 0.789 | 0.239 | 0.841 | |
| 34 | 8.222 | 2.794 | 7.536 | 0.746 | 0.099 | 0.791 | |
| 35 | 8.607 | 2.202 | 8.576 | 0.801 | 0.025 | 0.939 | |
| 36 | 8.798 | 3.723 | 7.960 | 0.828 | 0.215 | 0.851 | |
| 37 | 9.825 | 2.481 | 7.063 | 0.975 | 0.060 | 0.723 | |
| 38 | 9.622 | 3.164 | 8.462 | 0.946 | 0.146 | 0.923 | |
| 39 | 8.808 | 3.626 | 8.296 | 0.830 | 0.203 | 0.899 | |
| 40 | 8.581 | 3.433 | 7.148 | 0.797 | 0.179 | 0.735 | |
| Random Times | Mean | Standard Deviation | ||||
|---|---|---|---|---|---|---|
| C1 | C2 | C3 | C1 | C2 | C3 | |
| 10 | 7.248 | 6.540 | 4.430 | 2.061 | 2.288 | 2.129 |
| 50 | 7.214 | 6.515 | 4.461 | 2.066 | 2.358 | 2.150 |
| 100 | 7.232 | 6.501 | 4.495 | 1.973 | 2.325 | 2.130 |
| 500 | 7.255 | 6.478 | 4.490 | 2.005 | 2.372 | 2.133 |
| 1000 | 7.259 | 6.503 | 4.487 | 2.005 | 2.367 | 2.134 |
| Random Times | Projection Vector a | Attribute Weights | H(w) | ||||
|---|---|---|---|---|---|---|---|
| C1 | C2 | C3 | C1 | C2 | C3 | ||
| 10 | 0.542 | 0.776 | 0.323 | 0.294 | 0.602 | 0.104 | 0.820 |
| 50 | 0.540 | 0.775 | 0.328 | 0.292 | 0.601 | 0.107 | 0.824 |
| 100 | 0.543 | 0.775 | 0.323 | 0.295 | 0.601 | 0.104 | 0.821 |
| 500 | 0.544 | 0.775 | 0.321 | 0.296 | 0.601 | 0.103 | 0.819 |
| 1000 | 0.544 | 0.775 | 0.321 | 0.296 | 0.601 | 0.103 | 0.819 |
| Random Times | S1 | S2 | S3 | S4 |
|---|---|---|---|---|
| 10 | 0.569 ± 0.066 dC | 1.099 ± 0.045 aA | 1.02 ± 0.082 bA | 0.838 ± 0.062 cB |
| 50 | 0.536 ± 0.083 D | 1.113 ± 0.068 A | 1.013 ± 0.073 B | 0.849 ± 0.078 C |
| 100 | 0.550 ± 0.079 D | 1.110 ± 0.077 A | 1.015 ± 0.076 B | 0.842 ± 0.076 C |
| 500 | 0.557 ± 0.075 D | 1.114 ± 0.074 A | 1.010 ± 0.074 B | 0.834 ± 0.077 C |
| 1000 | 0.557 ± 0.076 D | 1.113 ± 0.077 A | 1.018 ± 0.077 B | 0.838 ± 0.077 C |
© 2018 by the authors. Licensee MDPI, Basel, Switzerland. This article is an open access article distributed under the terms and conditions of the Creative Commons Attribution (CC BY) license (http://creativecommons.org/licenses/by/4.0/).
Share and Cite
Zhang, M.; Zhou, J.; Zhou, R. Interval Multi-Attribute Decision of Watershed Ecological Compensation Schemes Based on Projection Pursuit Cluster. Water 2018, 10, 1280. https://doi.org/10.3390/w10091280
Zhang M, Zhou J, Zhou R. Interval Multi-Attribute Decision of Watershed Ecological Compensation Schemes Based on Projection Pursuit Cluster. Water. 2018; 10(9):1280. https://doi.org/10.3390/w10091280
Chicago/Turabian StyleZhang, Ming, Jinghong Zhou, and Runjuan Zhou. 2018. "Interval Multi-Attribute Decision of Watershed Ecological Compensation Schemes Based on Projection Pursuit Cluster" Water 10, no. 9: 1280. https://doi.org/10.3390/w10091280
APA StyleZhang, M., Zhou, J., & Zhou, R. (2018). Interval Multi-Attribute Decision of Watershed Ecological Compensation Schemes Based on Projection Pursuit Cluster. Water, 10(9), 1280. https://doi.org/10.3390/w10091280