Abstract
The ecological compensation scheme of water pollution in the basin is a result of the interplay between upstream and downstream cities, which is of great significance to the guidance of regional economic development. The purpose of this paper is to propose a multi-attribute scheme decision algorithm, which is expressed in the form of interval number, to reduce the uncertainty of decision results and improve the reliability of decision results. This method first uses the Monte Carlo simulation technique to produce a large number of random samples in the various attributes of the decision matrix to construct the random decision-making matrix (DMM). Then, according to the overall dispersion and local concentration of the random DMM, the clustering method of the projection pursuit is adopted. By accelerating the genetic algorithm, the weight and the best projection eigenvalues of each scheme are optimized, and the sorting results of the decision-making cases are obtained based on the projected eigenvalues. The results of the case study show that the uncertainty of the decision results is greater when the number of random simulations is very low; as the number of random simulations increases, the result of the decision becomes more and more stable and clear, and the uncertainty decreases. The results of the Duncan test show that, scheme 2, which is composed of financial compensation and remote development, is better than other schemes, and the decision making is more reasonable. The result of this decision has certain values for the ecological compensation scheme in Suzhou and Jiaxing cities, and the proposed method can be applied in similar range multi-attribute scheme decision-making issues.
1. Introduction
Watershed ecological compensation is a form of payment for environmental services [1,2,3], in which a beneficiary or a destroyer of the ecological environment gives a certain degree of economic compensation to an environmental protector by measuring the value of ecological service to its own value in order to motivate its environmental behavior [4]. In order to reduce the occurrence of water pollution in basins, the ecological compensation mechanism is designed to force polluters to reduce emissions and compensate for damage to the ecological environment, which has become a popular topic [5].
As a result of a polluter’s willingness to pay, there would be multiple compensation schemes from which to choose in practical work. In 2007, based on questionnaires and comparative research in three American regions, Kosoy et al. found that the ecological compensation opportunity cost for upstream ecological compensation was greater than the actual payment of downstream ecological compensation. A method of ecological compensation for the basin was then proposed according to the opportunity cost [6]. Opportunity cost can be defined as the loss of potential gain from other ecological compensation schemes when one scheme is chosen [7]. Wunder et al. suggested that ecological services should be fully market-oriented, including ecological destruction of the basin and the ecological reconstruction and construction compensation of the basin, which would achieve optimal ecological compensation [8]. In 2014, Sand et al. studied the ecological compensation mechanism in rural Kenya, and proposed that ecological compensation should be embedded in a broader institutional framework and receive more financial resources to facilitate the adaptation of ecosystem services to climate change [9]. Furthermore, Cheng et al. reviewed the mature theory and scientific mechanism of ecological compensation in basins and analyzed the defects and shortcomings of the theory of ecological compensation [10], which will contribute to decisions on compensation schemes.
The reason that we are willing to pay is to elicit the problem that upstream and downstream cities are faced with various compensation plans that have been made by the experts from the ecological compensation work group, and how to make decisions on the choice of these schemes. However, most previous results were obtained by studying one aspect of the ecological compensation scheme of water pollution in a basin separately; meanwhile, the comprehensive influence of various factors is ignored in the selection of ecological compensation schemes [11], and the analysis of the main behavior of the participation of ecological compensation is lacking. Therefore, the comprehensive evaluation of multiple attributes is required.
Liu et al. and Zhang et al. suggested that the evaluation of the ecological compensation scheme of water pollution in basins was a multi-attribute decision-making problem, and that different compensation modes and compensation capitals, and the combination of compensation time could constitute alternative approaches to ecological compensation [11,12]. Accordingly, when we determine the ecological compensation scheme, we need to take into account the impact of the compensation mode, the compensation capital and the compensation time to upstream and downstream regions, and achieve the sustainable development of the whole basin.
Owing to the high degree of uncertainty in the compensation schemes, such as the pollution load, the pollution degree, the compensation capital, and the compensation mode, compensation schemes are difficult to agree on the upstream and the downstream. To address this problem, Zhang et al. proposed a method of decision making based on prospect theory to measure the uncertainty in ecological compensation schemes and improve the accuracy of the decision results [12]. Prospect theory is a theory in cognitive psychology that describes the way people choose between probabilistic alternatives that involve risk, where the probabilities of outcomes are known [13,14,15]. However, in a study by Zhang [12], small changes in the upper and lower boundary range were found to lead to a greater impact on the result of compensation schemes, and bring new uncertainty [16,17], since the method only used information on the interval and the lower boundary to make the decision.
In this study, we propose that the new uncertainty is mainly caused by the interval number algorithm, which can be overcome by improving the interval number algorithm. Therefore, we use the Monte Carlo technique to simulate random samples of a large number of decision schemes in the interval range. We are able to obtain the decision results of the various schemes, the overall distribution trend of the various schemes, and also to reduce the uncertainty of the traditional interval number algorithm.
By observing the spatial distribution of the projection eigenvalues of all schemes, the random sample projection eigenvalues have the characteristics of total dispersion and local aggregation, which are similar to the clustering problems in system engineering [18]. Projection pursuit cluster (PPC) is an important system evaluation and decision-making method that has been applied in a large number of studies in the field of water protection and utilization [18,19,20]. Therefore, we propose the sorting decision of the ecological compensation scheme by using the projection trace clustering algorithm to cluster the simulated scheme, and also to propose using the projection pursuit algorithm to cluster the simulated ecological compensation scheme.
The purpose of this paper is to propose a method to solve the problem of multi-attribute scheme in the form of interval number decision-making matrix (DMM) by the Monte Carlo method, and reduce the uncertainty of decision making. At the same time, PPC is used to make the decision of each scheme, obtain the weight of each attribute and subsequently classify the decision classification according to the projection eigenvalues, and carry out the statistical analysis. The rest of this paper is organized, as follows: Section 2 gives the methodological framework and introduces the main principles of PPC; Section 3 gives the results of a case study and a discussion, and the decision is made in the case of different random simulations; and, Section 4 summarizes the main research results of this paper, and suggests that the proposed method of decision making is more accurate and reasonable than other methods. This study is expected to provide guidance for regional socio-economic development.
2. Materials and Methods
Firstly, the interval DMM of the watershed ecological compensation schemes is obtained by using the expert rating method. Secondly, the Monte Carlo method is used to generate a number of random samples in the various attributes of decision intervals, and the processing of the dimensionless is carried out. Then, the PPC object function is constructed, the accelerating genetic algorithm is used to optimize the projection vector, and statistical analysis is carried out to determine the sorting results of each scheme quantitatively. The method is diagrammatically outlined in Figure 1.
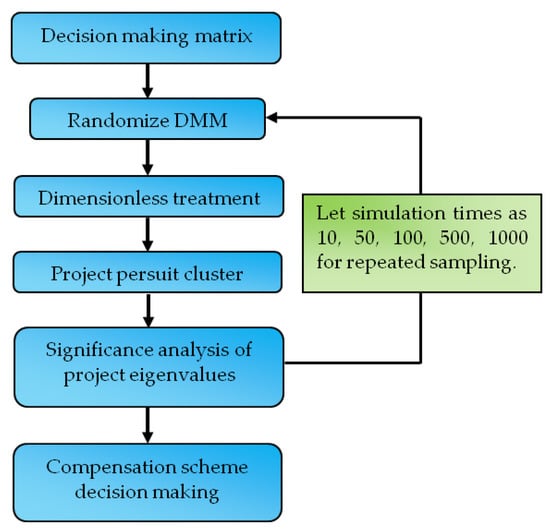
Figure 1.
Diagram of multi-attribute decision making for ecological compensation.
2.1. Randomize Decision-Making Matrix
Let and be the lower bound and upper bound of the jth attribute of the hth scheme in interval DMM, and be the jth attribute of the ith random sample, where i = 1, 2, …, k × n, j = 1, 2, …, m, h = 1, 2, …, k, n is the number of random simulations of each scheme, m is the number of attribute, and k is the scheme number of watershed water pollution decision making.
In the interval of the various attributes, the random number of the uniform distribution is generated by the use of Equation (1) below. The number of random simulations for each scheme are selected as 10, 50, 100, 500, and 1000, respectively, to make the random sampling results statistically significant.
where rand() is a function that can generate [0,1] uniform random number.
2.2. Dimensionless Data Treatment
The dimensionless formulation is given as:
where and are the maximum and minimum values of attribute j in the random samples, respectively.
2.3. Projection Pursuit Cluster
Let a (a1, a2, …, am) be the m-dimensional unit projection vector, then zi, the one dimensional projection eigenvalue of , can be shown as follows:
where, z = (z1, z2, …, zk×n) is the projection eigenvalue set. According to the projection vector, the weight of each attribute can be calculated by Equation (4).
The PPC theory requires that the distribution of the projection eigenvalue z(i) is as dense as possible, and it is best to build up a number of points; and, the overall projection dots are as scattered as possible. According to the maximum entropy principle [21,22], the attribute weight of the projection vector distribution should have the maximum entropy. The larger the entropy, the less the constraint and the assumption that people add. Based on this concept, the projection indicator function Q(a) can be constructed as:
where, Sz is the standard deviation of z(i) series, Dz is the local density of z(i), and Hw is the entropy of attribute weights. Those formulas are shown as:
where Ez is the mean of z(i) series, R = 0.1Sz denotes the windows radius of local density, rij = |z(i) − z(j)|, and u(t) is the unit step function, which is equal to 1 when t ≥ 0, and 0 when t < 0.
When the value of Q(a) reaches a maximum, it obtains the optimal projection vector and clustering results. Then the model can be described as a nonlinear optimization question whose formula is given in Equation (9) below. This study uses the accelerating genetic algorithm to answer this question [23,24].
2.4. Compensation Scheme Decision Making
The optimal projection value series is calculated according to Equation (3) by the optimal projection vector a* that is obtained by Equation (9). The mean and standard deviation of each scheme is calculated, and the Duncan significance test is carried out to compare the mean of each scheme in order to guide the practice of policy.
Statistical characteristics and significance tests are performed while using the SPSS 15.0 software (SPSS Inc., Chicago, IL, USA).
2.5. Study Area
The research area is located in the Taihu basin in China. The Taihu basin is divided into the cities of Jiangsu, Zhejiang, Shanghai, and Anhui province, and the basin flows through eight cities, Shanghai, Suzhou, Wuxi, Changzhou, Zhenjiang, Hangzhou, Jiaxing, and Huzhou. This study takes the upstream of Suzhou city and the downstream of Jiaxing city as study areas.
The water quality from Suzhou to Jiaxing is dominantly grade V and above, with an average water quality of grade V observed in 16.7%, higher than grade V in 80%, and grade IV in 3.3%. The water of Jiaxing was so polluted that there was no clean river in the city. The water quality is embodied in the characteristics of organic pollution, and it is completely impossible to meet the basic requirements of drinking water safety. According to the experts from the working group of ecological compensation, the literature [12] has proposed four alternatives to ecological compensation, as shown in Table 1. The experts were mainly concerned with the idea that the plan should be acceptable to both upstream and downstream cities, as well as with the level of economic development in both Suzhou and Jiaxing.

Table 1.
Schemes of alternative ecological compensation [12].
Table 1 describes the four schemes, include three attributes: C1, compensation mode, C2, compensation amount, and C3, compensation time.
The four alternatives (schemes) are rated by experts with a score of 1 (worst) to 10 (best); the decision matrix is given in Table 2. In order to facilitate the comparison of the PPC model with the existing model [12], the original decision matrix from [12] is adopted in this paper.
Table 2.
Interval decision-making matrix and range of index weights [12].
3. Results
3.1. Random Schemes and Dimensionless Treatment
Random schemes simulated for 10, 50, 100, 500, and 1000 times are shown in Table 3 based on Table 2 about each decision-making interval of each scheme, which was given by experts that are involved in the ecological compensation working group. Due to space limitations, Table 3 only shows the results for 10 times.
Table 3.
Random samples of each water pollution ecological compensation scheme.
A dimensionless processing of the original random samples of C1–C3 is carried out using Equation (2). The calculation results of the mean and standard deviation of the random generation schemes under each scheme are listed in Table 4.
Table 4.
Statistical characteristics of decision-making schemes under each random time.
It can be seen from Table 4 that as the number of random simulations increases, the mean and standard deviation of random sample statistics become stable. The PPC method is subsequently used to calculate the weight and the projection eigenvalues.
3.2. Weights of Each Index by PPC Method
The random samples were optimized by accelerating genetic algorithm, the projection vector of the three attributes was optimized and the attribute weight was obtained. The optimized results are shown in Table 5.
Table 5.
Weights of each attribute.
The projection vector results shown in Table 5 are positive, and the three attributes are consistent with the performance indicators. The direction of each projection is stable as the number of simulations increases. The direction of each projection vector is put into Equation (4) and the weight of each attribute is obtained. The calculated attribute weights of the 1000-times simulated samples are 0.296, 0.601, and 0.103 for C1, C2, and C3, respectively; this is consistent with the subjective weight, which showed that C2 is the most important attribute. C1 is also a matter of concern for the government.
The information entropy value obtained by the distribution of the attribute weights is listed in the last column of Table 5. The value of H(w) shows that the entropy of information decreases with the stability of the weight distribution, which indicates that the amount of information transmitted by the attribute weight distribution increases. Therefore, increasing the number of random simulations can reduce the uncertainty of the decision results.
3.3. Decision-Making of Each Scheme
3.3.1. Scatter Plot of Each Scheme
The projected eigenvalues of each scheme are calculated by using Equation (3) of the optimal projection vector. In this study, the projected eigenvalue scatter diagram is plotted (Figure 2) under each number of random simulations, and the characteristics of the clustering and dispersion of each projection eigenvalue are observed. Due to space limitations, Figure 2 only shows 10, 100, and 1000-times simulation samples.
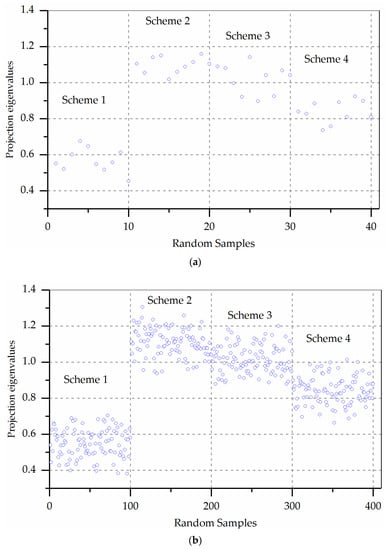
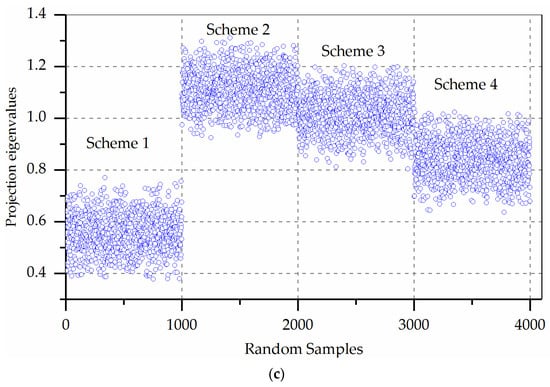
Figure 2.
Scatter plot of projection eigenvalues of random samples for each scheme. (a) 10 random times results; (b) 100 random times results; and, (c) 1000 random times results.
Figure 2 shows that all schemes display clear aggregation characteristics when the number of random simulations increases. Overall, the projection eigenvalues of the S2 are the largest, followed by S3, S4, and S1. It can also be seen from Figure 2 that S2, S3, and S4 have a lot of mixed data points. In this case, if the decision solution is made using a small number of decision data, the optimal decision results are likely to occur in S4 > S3 > S2.
However, Figure 2 is only a qualitative comparison of the pros and cons of all schemes. We additionally need to make quantitative comparisons of the schemes.
3.3.2. Statistical Analysis of Projection Eigenvalues
For each of the random simulation times, the projection eigenvalues of each scheme are analyzed and the Duncan test method is used to make a significance test, as shown in Table 6.
Table 6.
Results of statistical characters and significance analysis.
Table 6 shows that the mean and the standard deviation of random samples are stable with the increase in the number of random simulations. When the number of random simulations is 10, the statistical results showed a large difference compared to the results when 1000 simulations are performed. This indicates that the uncertainty of the decision is very large and leads to inaccurate decision results, when using a small number of data or directly using the decision matrix interval to make a decision. Therefore, we suggest making decisions by simulating the attribute values of all schemes, thereby reducing the uncertainty of the decision results.
According to the results of the Duncan test, the significance results showed that S2 is better than S3, that S3 is better than S4, and that S4 is better than S1 under the significance level of α = 0.05. When the number of random simulations is 50, 100, 500, and 1000, the decision results under the 0.01 significance level is S2 > S3 > S4 > S1, so that abcd symbols are not marked in Table 6. However, under the significance level of 0.01 and 10 simulations, S2 is less significant than S3.
In conclusion, the significance test results show that the optimal scheme is S2.
3.4. Analysis of Decision-Making Results
3.4.1. Reasonableness of Decision-Making Results
Based on the original decision matrix in Table 1, the analysis of the sorting rationality of all schemes is carried out. When compared with S4 and S1, the C1 and C3 attribute values of S4 are significantly greater than those of S1, and the C2 attribute of S4 is slightly less than that of S1. Accordingly, the result that S4 is superior to S1 is reasonable.
As compared with S2 and S3, the C1 attribute of S2 is equal to that of S3, the C2 attribute of S2 is slightly larger than that of S3 and the C3 attribute of S2 is slightly less than S3. Considering that the importance of the C3 attribute is significantly less than that of the C2 attribute, S2 can also be reasonably considered to be better than S3.
Although the C1 and C3 attribute of S4 are greater than that of S2, as compared with S2 and S4, the C2 attribute of S4 is much less than that of S2. Based on the expert opinion, S2 can also be reasonably considered to be better than S4. S3 and S4 are similar.
Based on the above analysis, the sorting result S2 > S3 > S4 > S1 is reasonable. In order to further illustrate the accuracy of the PPC results, these results are compared with other methods.
3.4.2. Results of Comparison with Other Methods
In [11], while using the recovery cost method the decision result was calculated that Suzhou should pay between 232 million and 662 million Yuan in compensation to downstream Jiaxing city. This amount of compensation money is so large that it is bad for the coordination of the upstream and downstream cities, as it does not give a specific compensation scheme that could be accepted by both cities.
In [12], Zhang et al. adopted the prospect theory method that the upstream Suzhou city tended to adopt the S1, which was only 300 million Yuan in compensation, and the compensation money was paid 30 days after the pollution loss occurred. However, the compensation money is so close to the economic loss limit for ecological pollution of 232 million Yuan that the downstream Jiaxing city may not accept that scheme. From the PPC results, the scheme S1 suggested in [12] has the worst performance, which further explained that the scheme S1 is not suitable for selection as an implementation scheme.
The S2 scheme of this paper has the best performance; each expert is inclined to choose the combination compensation, which is combined with the DDP and MC mode. The suggested compensation amount of scheme S2 is 200 million Yuan, close to the economic loss limit for ecological pollution of 232 million Yuan, indicating that the compensation amount of scheme S2 is almost in line with the economic loss that is associated with ecological pollution. Meanwhile, the S2 scheme also provides compensation for DDP with a step-by-step payment of 300 million Yuan, which is beneficial to both Suzhou and Jiaxing cities. When the upstream Suzhou city implements the DDP compensation mode, it would set up an economic development zone in the downstream Jiaxing city and provide continuous financial support (in S2, the total amount for DDP is 300 million Yuan), which could not only make the upstream Suzhou city gain economic benefits, but also drive the development of the downstream Jiaxing city. Then, the DDP mode in S2 is a kind of economic compensation with growth and sustainability, so as to achieve a “win-win” situation for economic development and ecological and environmental protection.
4. Conclusions
This paper presents a multi-attribute decision method for the ecological compensation scheme of water pollution in the Taihu basin, China. The proposed method uses Monte Carlo simulation technology to solve the interval multi-attribute decision and PPC method to cluster the projection eigenvalues of various schemes. The proposed method is verified by means of watershed water pollution ecological compensation schemes, and the following conclusions are obtained.
- (1)
- The attribute values of the decision schemes are uncertain, and the standard deviation of the decision results is larger. This problem can be solved by simulating a large number of solutions through stochastic simulation techniques. According to the results of various numbers of random simulations, the decision of all the schemes can be analyzed significantly to improve the reliability of the decision results.
- (2)
- Using the PPC method can improve the accuracy of the decision result, especially the multi-attribute decision problem of the matrix element for entire interval number or a part. With the increase of the number of simulations, the scatter plot of each scheme demonstrates the superiority of the S2 scheme.
- (3)
- The weight of the C2 attribute is the largest, followed by the compensation mode C1 and the compensation time C3, which are consistent with subjective weight. When the number of simulations was 50, 100, 500, and 1000, S2 was significantly better than the other schemes at 0.01 significance levels. It is clear that the combination scheme of money compensation and development in different place is better than that of others, and it is worth using in the decision of ecological compensation of watershed water pollution.
The upstream Suzhou city sets up the economic development zone in the downstream Jiaxing city for the DDP mode and compensates the downstream Jiaxing city for ecological pollution, which not only enables the upstream Suzhou city to gain economic benefits, but also drives the downstream Jiaxing city to develop and restore the downstream city’s ecological environment. Therefore, the combination of the DDP mode and MC mode is an ecological compensation scheme with growth and sustainability, so as to achieve a “win-win” situation for economic development and ecological and environmental protection and bring benefits to regional residents.
Further study of ecological pollution costs and compensation mechanisms should be a bigger priority in regions where environmental protection and remediation is most required.
Author Contributions
Conceptualization, M.Z.; Methodology, M.Z. and R.Z.; Validation, R.Z.; Data Curation, J.Z.; Writing-Original Draft Preparation, M.Z. All of the authors have read and approved the final manuscript.
Funding
The authors would like to thank the support of the National Natural Science Foundation of China under Grant No. 51409001, and Excellent Talents Supporting program of Higher Education of Anhui under Grant No. gxyqZD2016127, and Anhui Provincial Natural Science Foundation under Grant No 1808085QE146.
Acknowledgments
The authors would thank reviewers for their hard work.
Conflicts of Interest
The authors declare no conflict of interest.
References
- Kosoy, N.; Corbera, E.; Brown, K. Participation in payments for ecosystem services: case studies from the lacandon rainforest, mexico. Geoforum 2008, 39, 2073–2083. [Google Scholar] [CrossRef]
- Costanza, R.; d’Arge, R.; de Groot, R. The value of the world’s ecosystem services and natural capital. Nature 1997, 387, 253–260. [Google Scholar] [CrossRef]
- Jansson, N.K.; Levin, S.; Lubchenco, J. The value of nature and the nature of value. Science 2000, 289, 395–396. [Google Scholar]
- Kumar, P. Payment for ecosystem services: Emerging lessons. Ecol. Econ. 2008, 16, 2–14. [Google Scholar]
- Pattanayak, S.K. Valuing watershed services: Concepts and empirics from Southeast Asia agriculture. Ecosyst. Environ. 2004, 104, 171–184. [Google Scholar] [CrossRef]
- Kosoy, N.; Martinez-Tuna, M.; Muradian, R. Payments for Environmental Services in Watersheds: Insights from a Comparative Study of Three Cases in Central America. Ecol. Econ. 2007, 61, 446–455. [Google Scholar] [CrossRef]
- Lu, T.; Dai, X.; Chen, J.; Dai, M. Pricing Industrial Discharge Quota (IDQ): A Model Reflecting Opportunity Cost of Performing Ecological Responsibility. Sustainability 2018, 10, 2032. [Google Scholar] [CrossRef]
- Wunder, S.; Enge, S.; Pagiola, S. Taking Stock: A Comparative Analysis of Payments for Environmental Services Programs in Developed and Developing Countries. Ecol. Econ. 2008, 65, 834–852. [Google Scholar] [CrossRef]
- Sand, I.; Mwangi, J.; Namirembe, S. Can payments for ecosystem services contribute to adaptation to climate change insights from a watershed in Kenya. Ecol. Soc. 2014, 19, 360–375. [Google Scholar]
- Cheng, X.; Kai, F. Research Review of Ecological Compensation Mechanism in Drainage Basin. J. North China Univ. Water Res. Electr. Power 2018, 34, 9–13. [Google Scholar]
- Liu, X.H.; Yu, X.J. Research on Standardization of Compensation for Trans-regional Water Pollution Based on Protection of Water Eco-system in River Valley: An Empirical Analysis of Tai Lake Basin. Ecol. Econ. 2007, 8, 129–135. [Google Scholar]
- Zhang, J.; Zeng, Y.Q. Multi-attribute Decision Making Model of Water Pollution Ecological Compensation Plans Based on Prospect Theory. Environ. Sci. Technol. 2015, 28, 55–59. [Google Scholar]
- Kahneman, D.; Tversky, A. Prospect Theory: An Analysis of Decision under Risk. Econometrica 1979, 47, 263–292. [Google Scholar] [CrossRef]
- Liu, S.; Liu, X.; Qin, J. Three-way group decisions based on prospect theory. J. Oper. Res. Soc. 2017, 69, 25–35. [Google Scholar] [CrossRef]
- Wu, Y.; Xu, C.; Zhang, T. Evaluation of renewable power sources using a fuzzy MCDM based on cumulative prospect theory: A case in China. Energy 2018, 147, 1227–1239. [Google Scholar] [CrossRef]
- Jin, J.L.; Wei, Y.M.; Zou, L.L.; Liu, L.; Fu, J. Risk evaluation of China’s natural disaster systems: An approach based on triangular fuzzy numbers and stochastic simulation. Nat. Hazards 2012, 62, 129–139. [Google Scholar] [CrossRef]
- Wu, S.; Lien, H.; Chang, C. Modeling risk analysis for forecasting peak discharge during flooding retention and warning operation. Stoch. Environ. Res. Risk Assess. 2013, 27, 713–723. [Google Scholar]
- Zhao, J.; Jin, J.L.; Guo, Q.Z.; Liu, L.; Chen, Y.Q.; Pan, M. Dynamic risk assessment model for flood disaster on a projection pursuit cluster and its application. Stoch. Environ. Res. Risk Assess. 2014, 28, 2175–2183. [Google Scholar] [CrossRef]
- Yang, X.H.; Yang, Z.F.; Li, J.Q. A genetic projection pursuit interpolation model for comprehensive assessment of water quality. Eng. Sci. 2004, 22, 66–71. [Google Scholar]
- Wang, S.J.; Li, Y.Q. A dynamic cluster model based on projection pursuit with its application to climate zoning. J. Appl. Meteorol. Sci. 2007, 18, 722–726. [Google Scholar]
- Zhou, R.X.; Pan, Z.W.; Jin, J.L.; Li, C.H.; Ning, S.W. Forewarning model of regional water resources carrying capacity based on combination weights and entropy principles. Entropy 2017, 19, 574. [Google Scholar] [CrossRef]
- Cui, Y.; Feng, P.; Jin, J.L.; Liu, L. Water resources carrying capacity evaluation and diagnosis based on set pair analysis and improved the entropy weight method. Entropy 2018, 20, 359. [Google Scholar] [CrossRef]
- Jin, J.L.; Cheng, J.; Wei, Y.M. Forecasting flood disasters using an accelerated genetic algorithm: Examples of two case studies for China. Nat. Hazards 2008, 44, 85–92. [Google Scholar] [CrossRef]
- Jin, J.L.; Yang, X.H.; Ding, J. Improved scheme of simple genetic algorithm accelerating genetic algorithm. Theory Pract. Syst. Eng. 2001, 21, 8–13. [Google Scholar]
© 2018 by the authors. Licensee MDPI, Basel, Switzerland. This article is an open access article distributed under the terms and conditions of the Creative Commons Attribution (CC BY) license (http://creativecommons.org/licenses/by/4.0/).