Hydrogeochemical Characterization and Quality Assessment of Groundwater in a Long-Term Reclaimed Water Irrigation Area, North China Plain

 ,
,  ,
,  ,
,  and
and
Abstract
1. Introduction
2. Materials and Methods
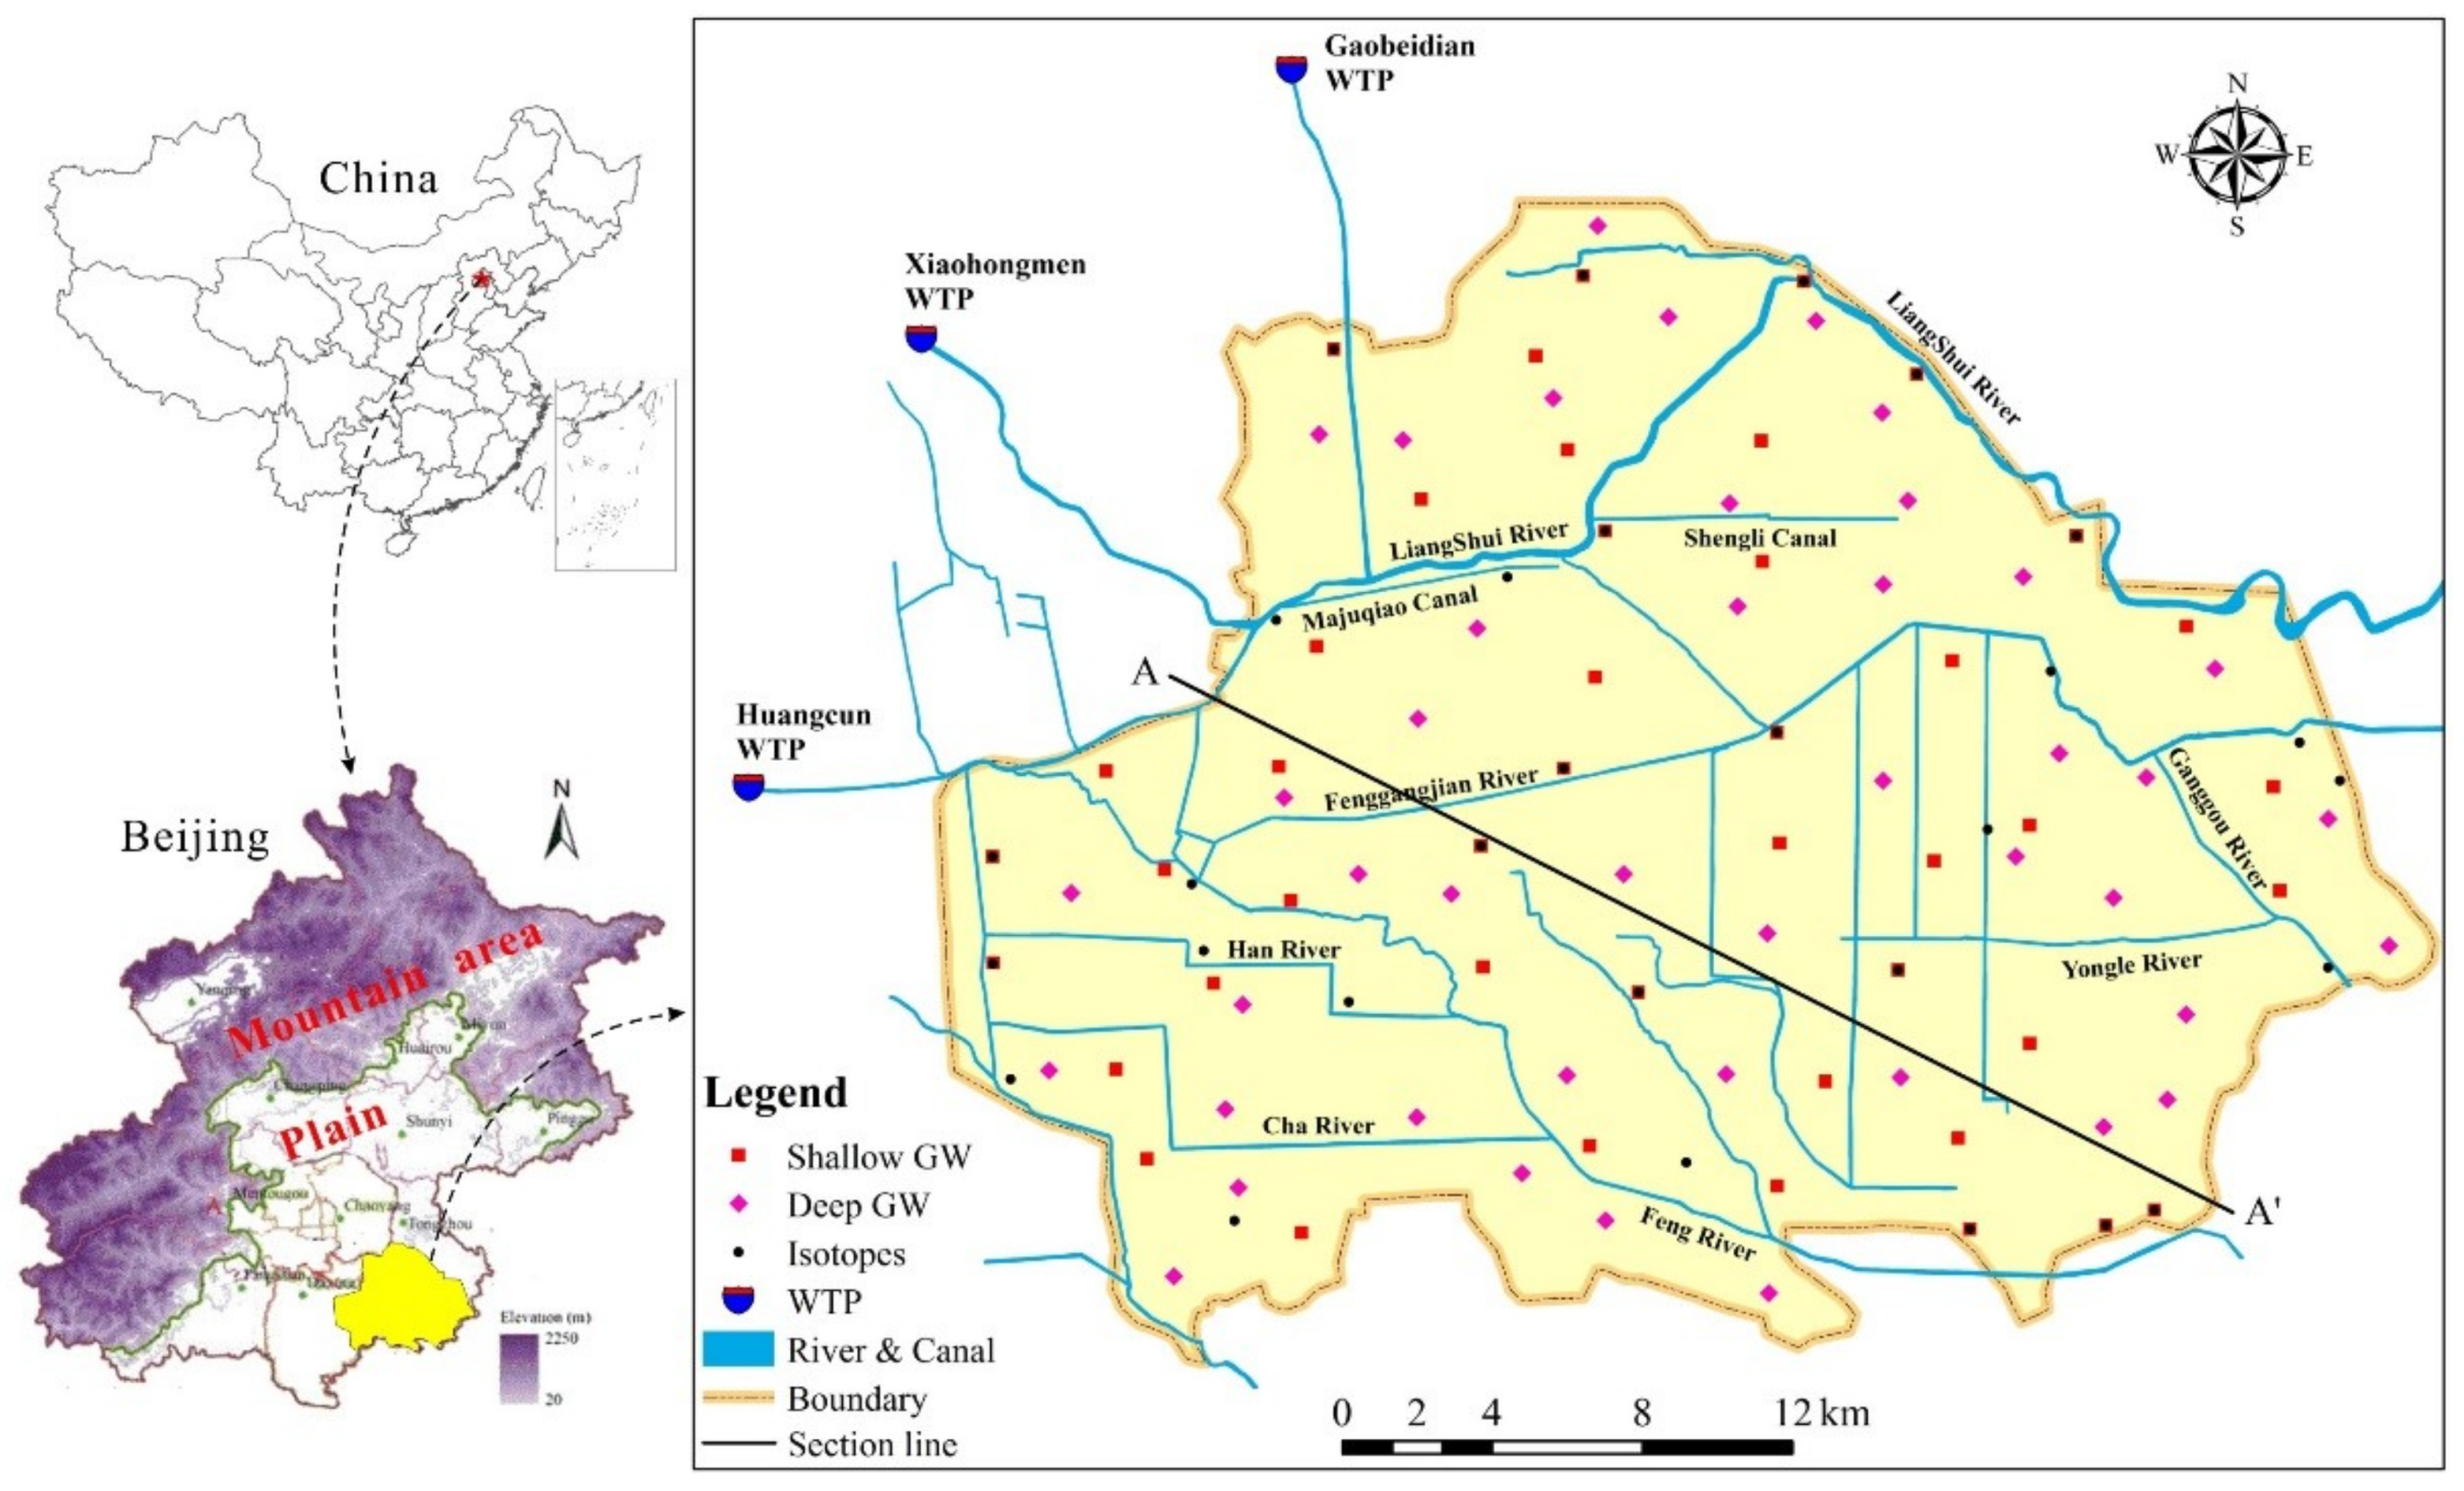
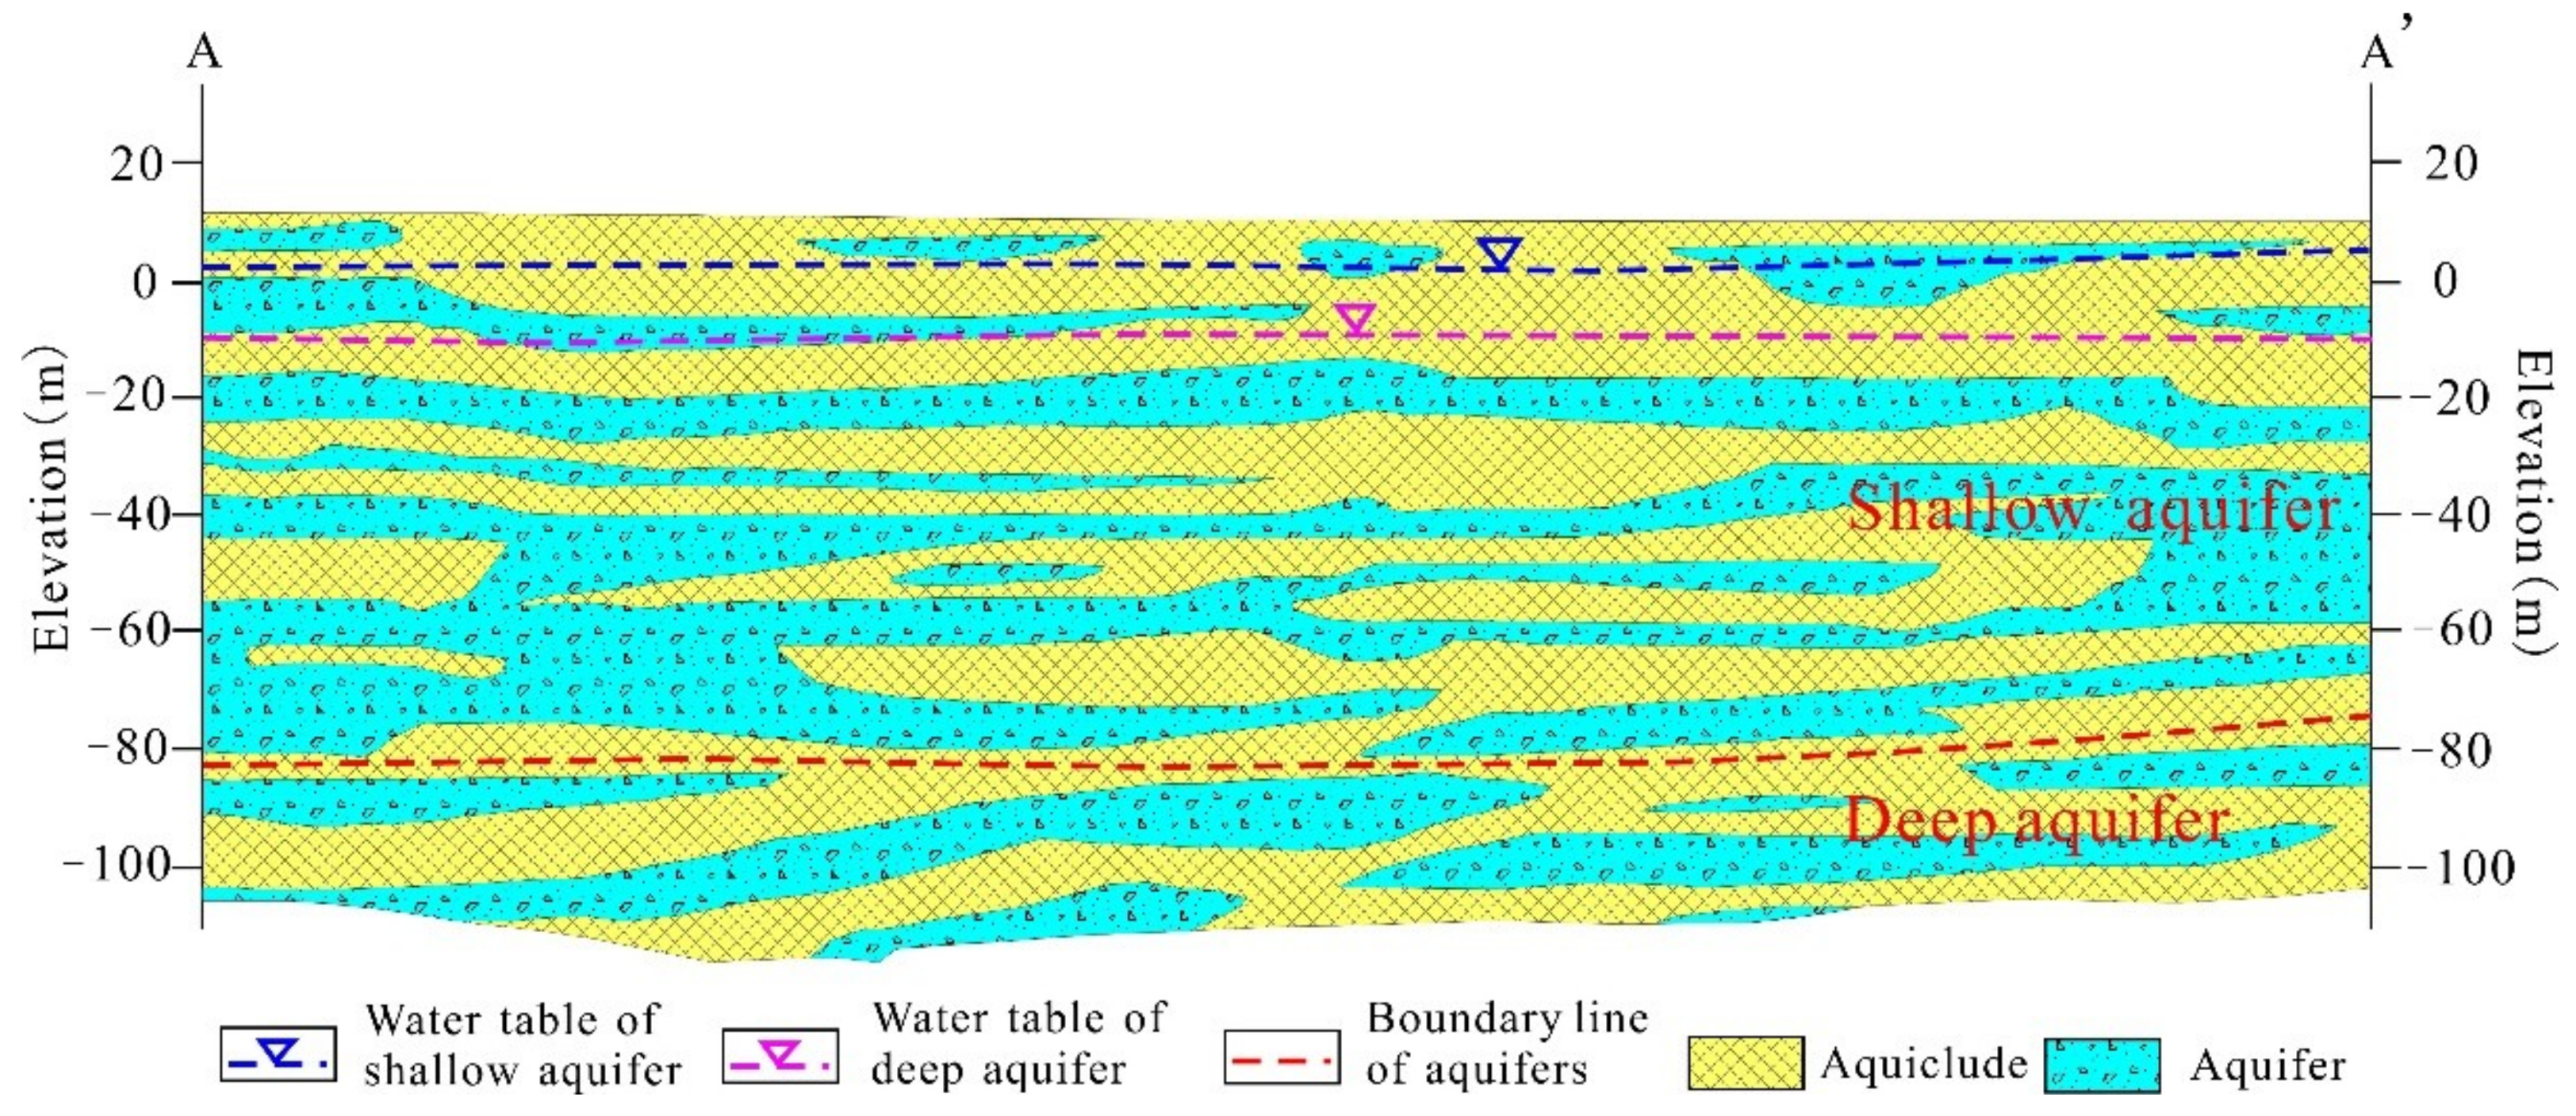
2.1. Study Area
2.2. Sample Collection and Analysis
3. Results and Discussion
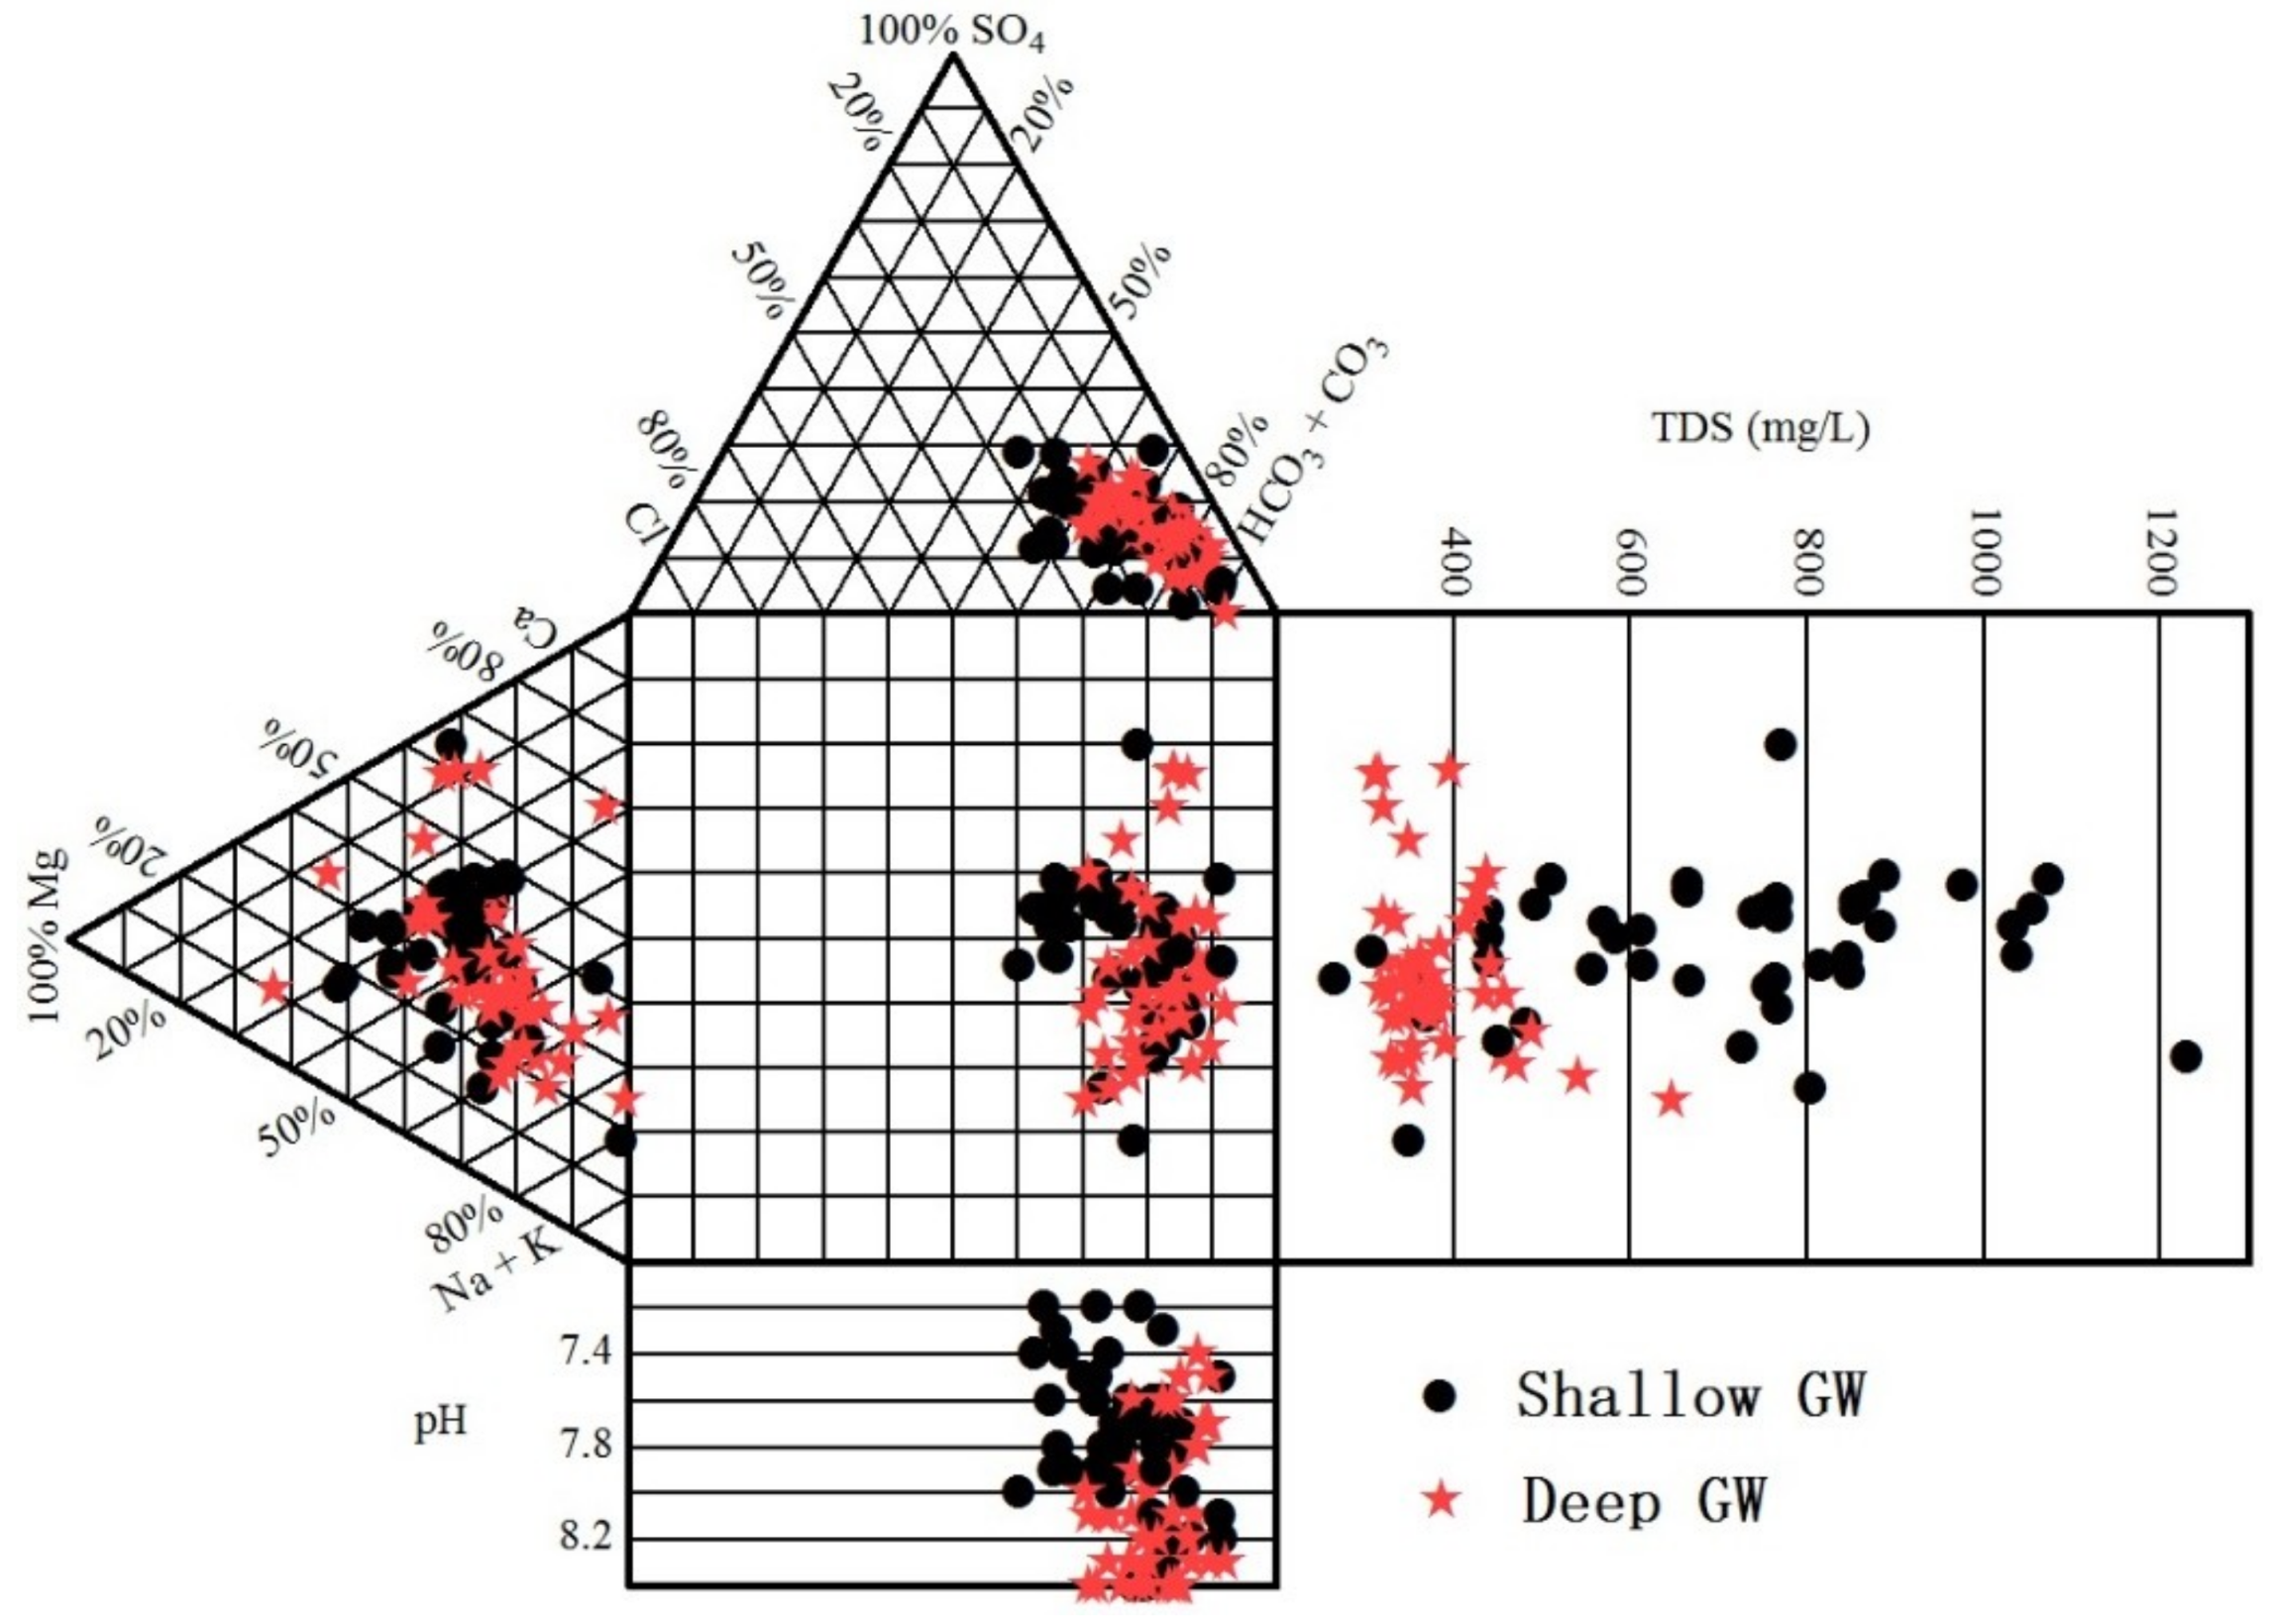
3.1. General Hydrochemical Characteristics
3.2. Factors Controlling Groundwater Chemistry
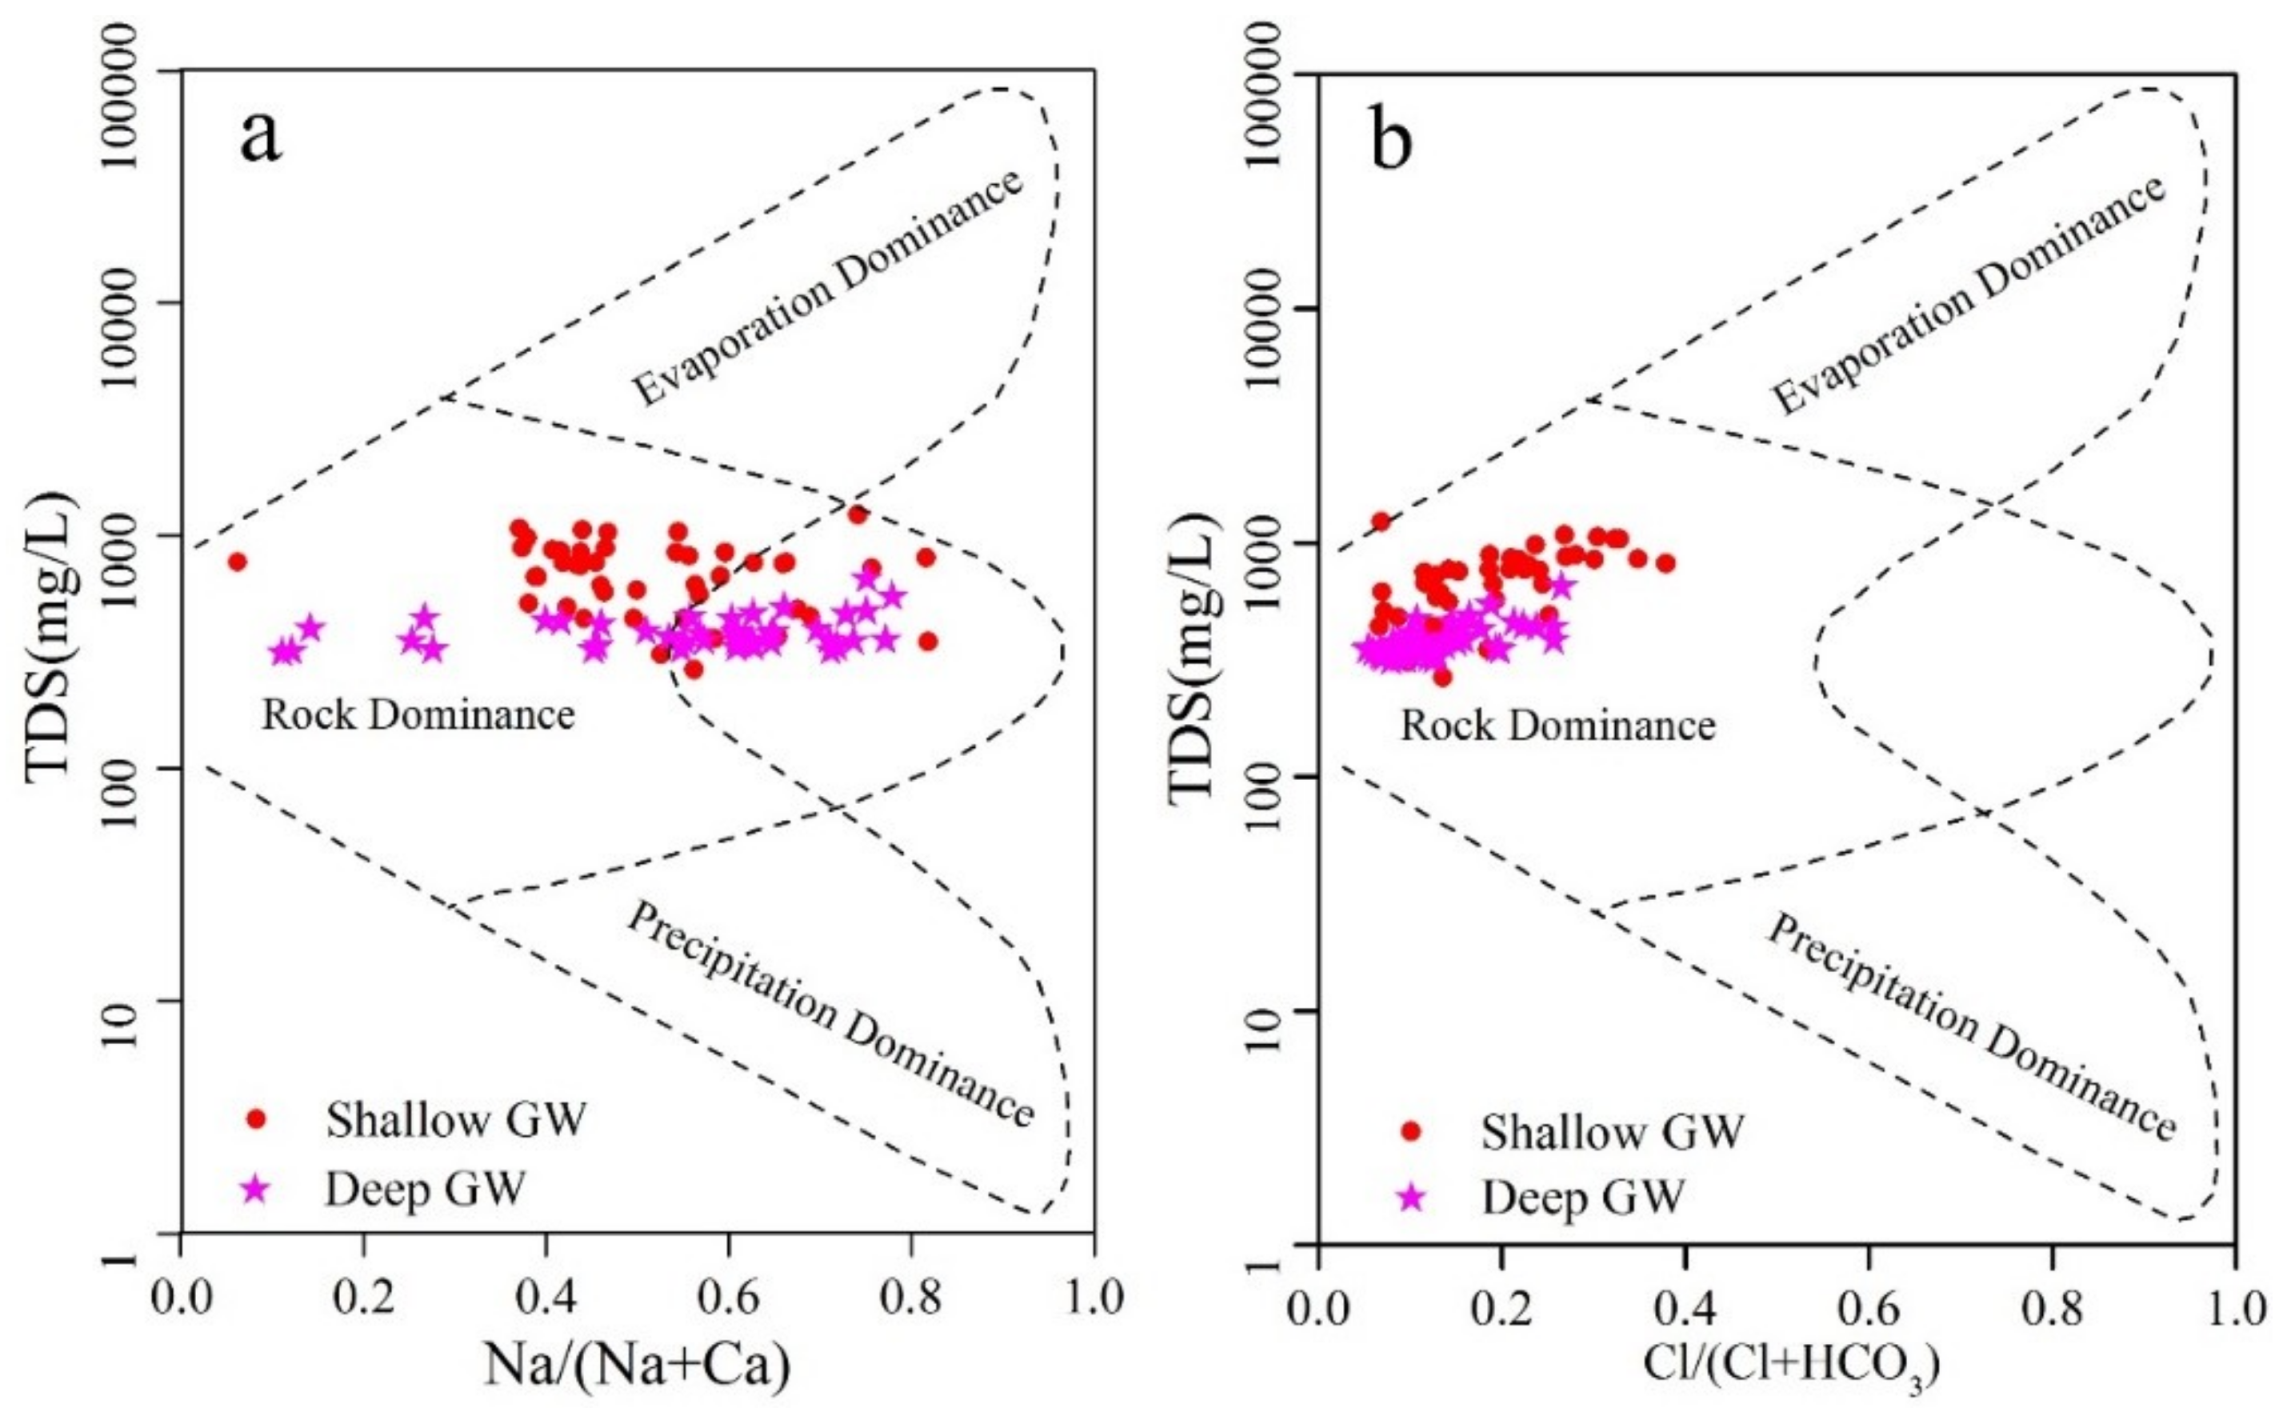
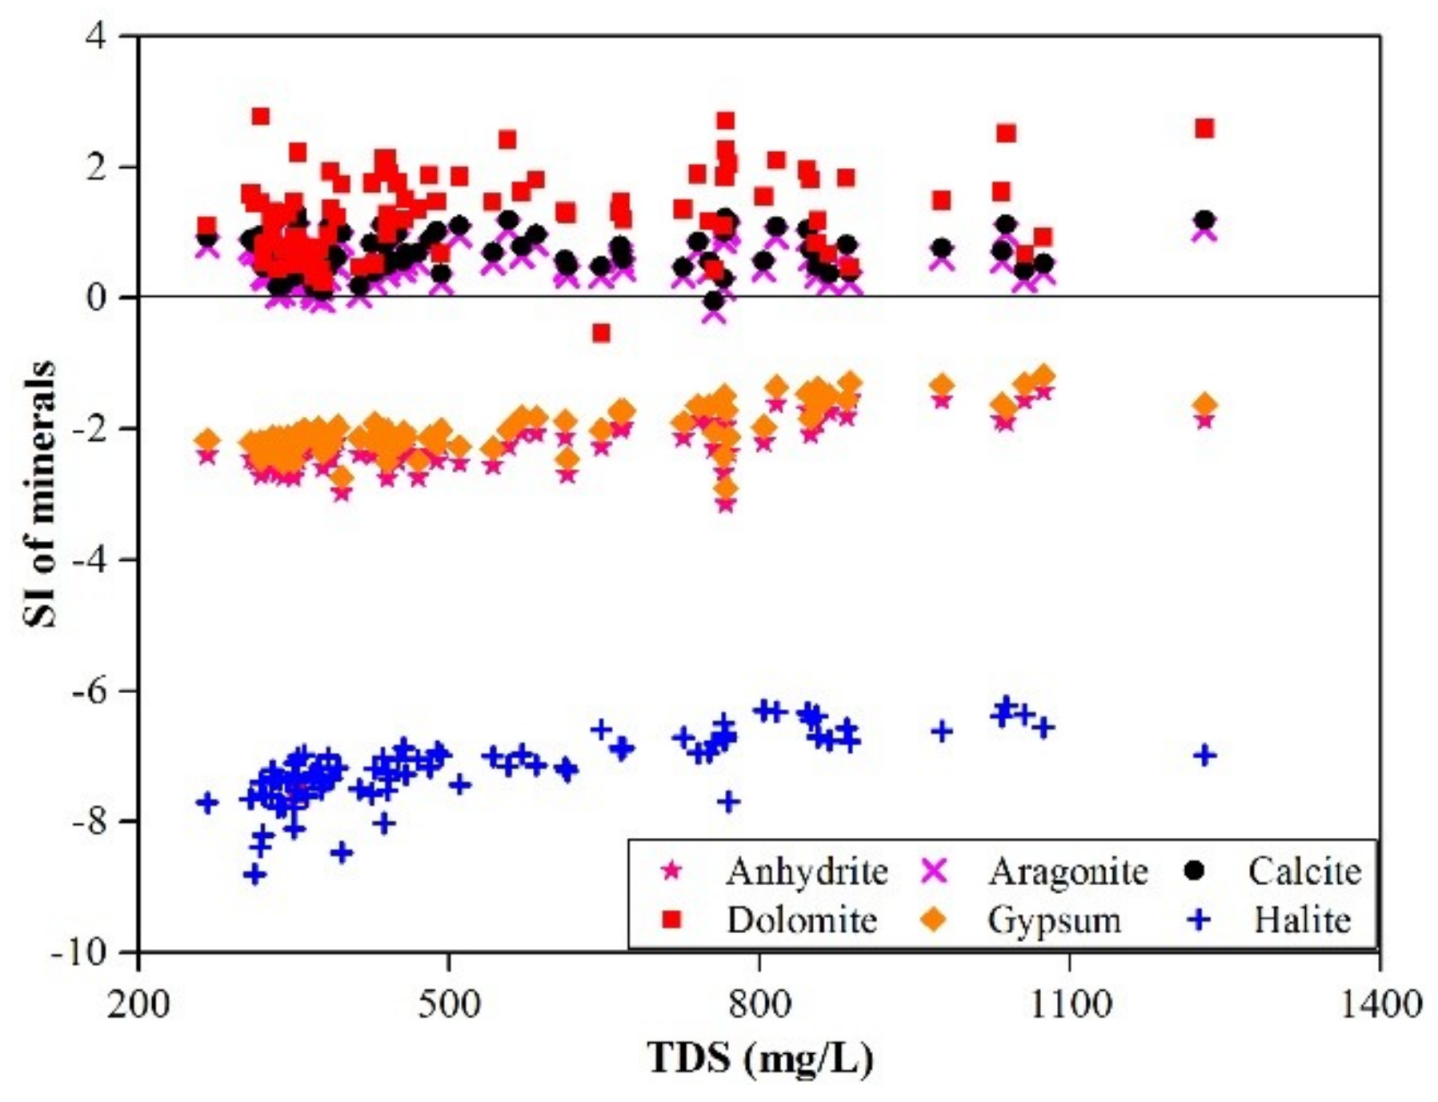
3.2.1. Rock Weathering
3.2.2. Ion Exchange
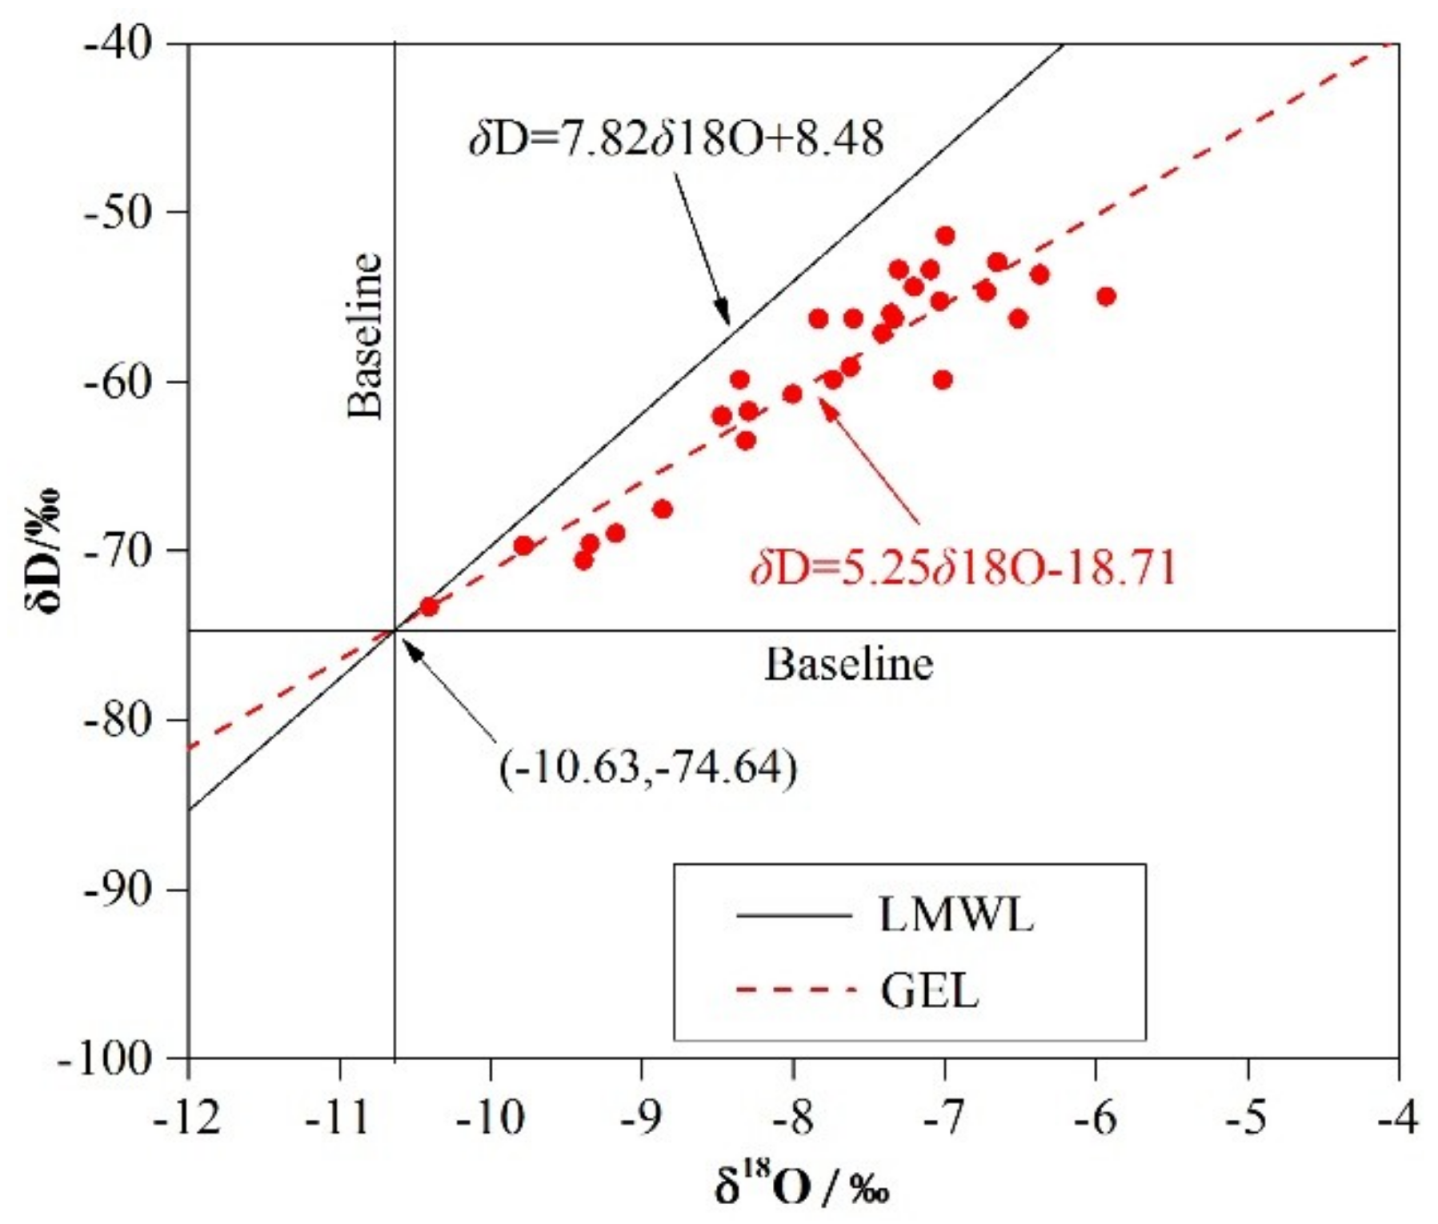
3.2.3. Evaporation
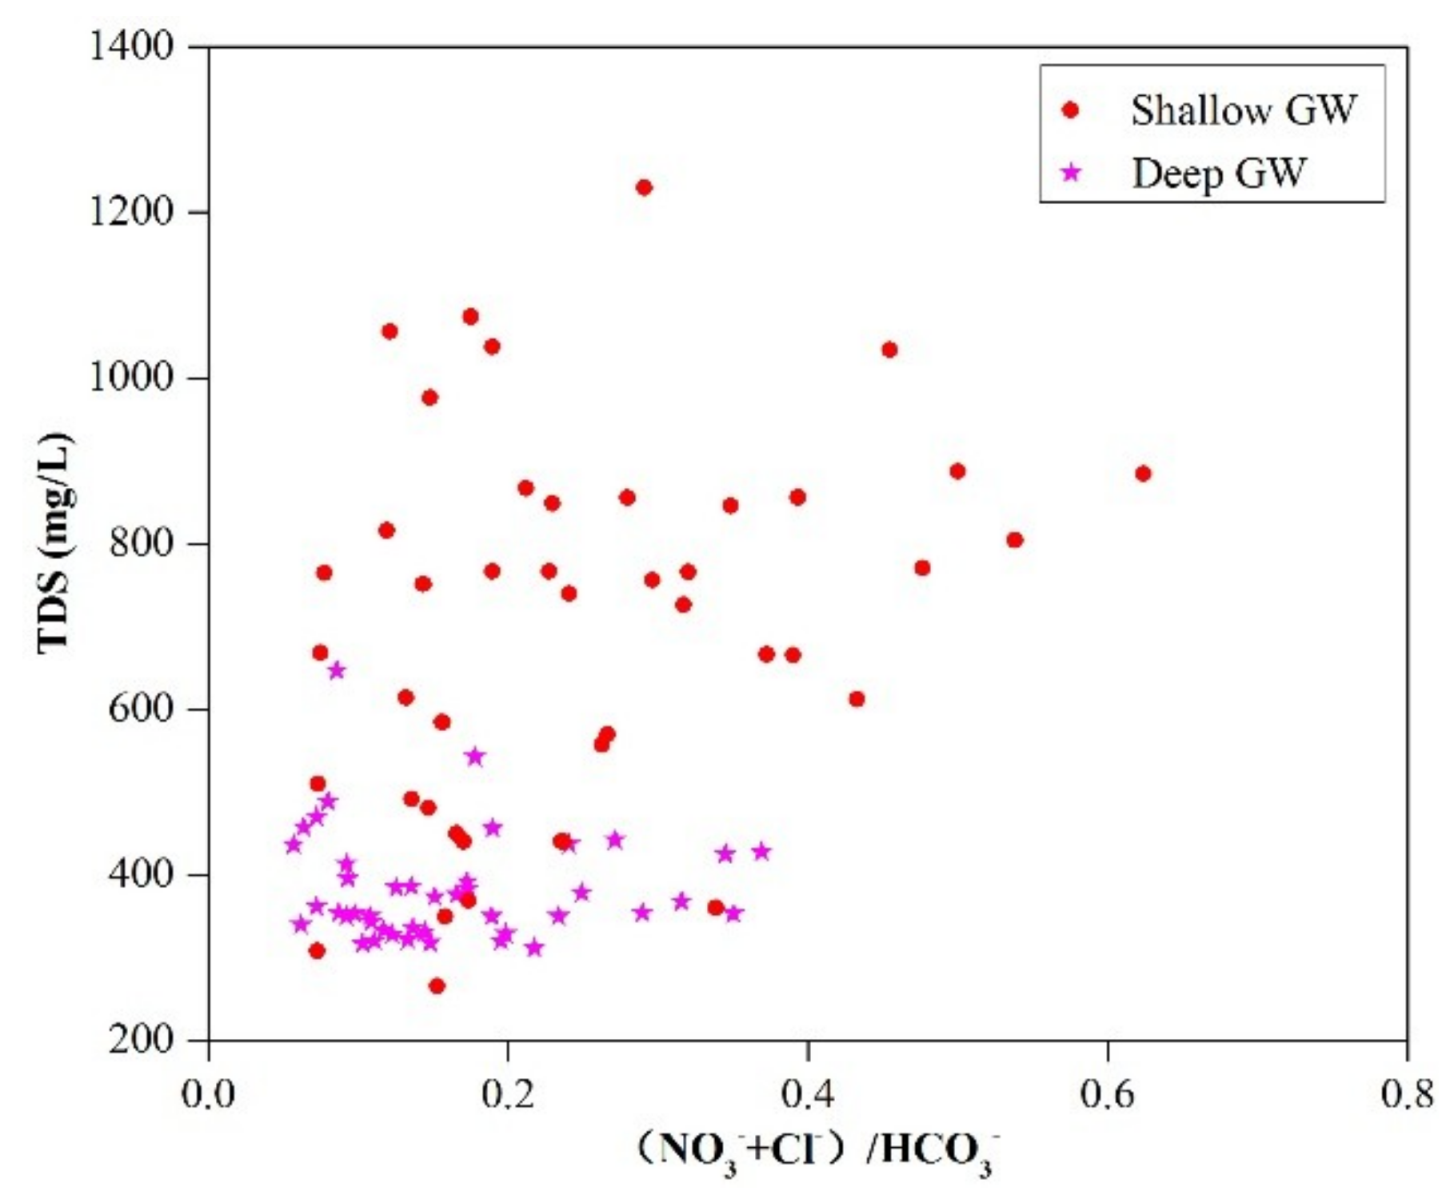
3.2.4. Human Activities
3.3. Groundwater Suitability
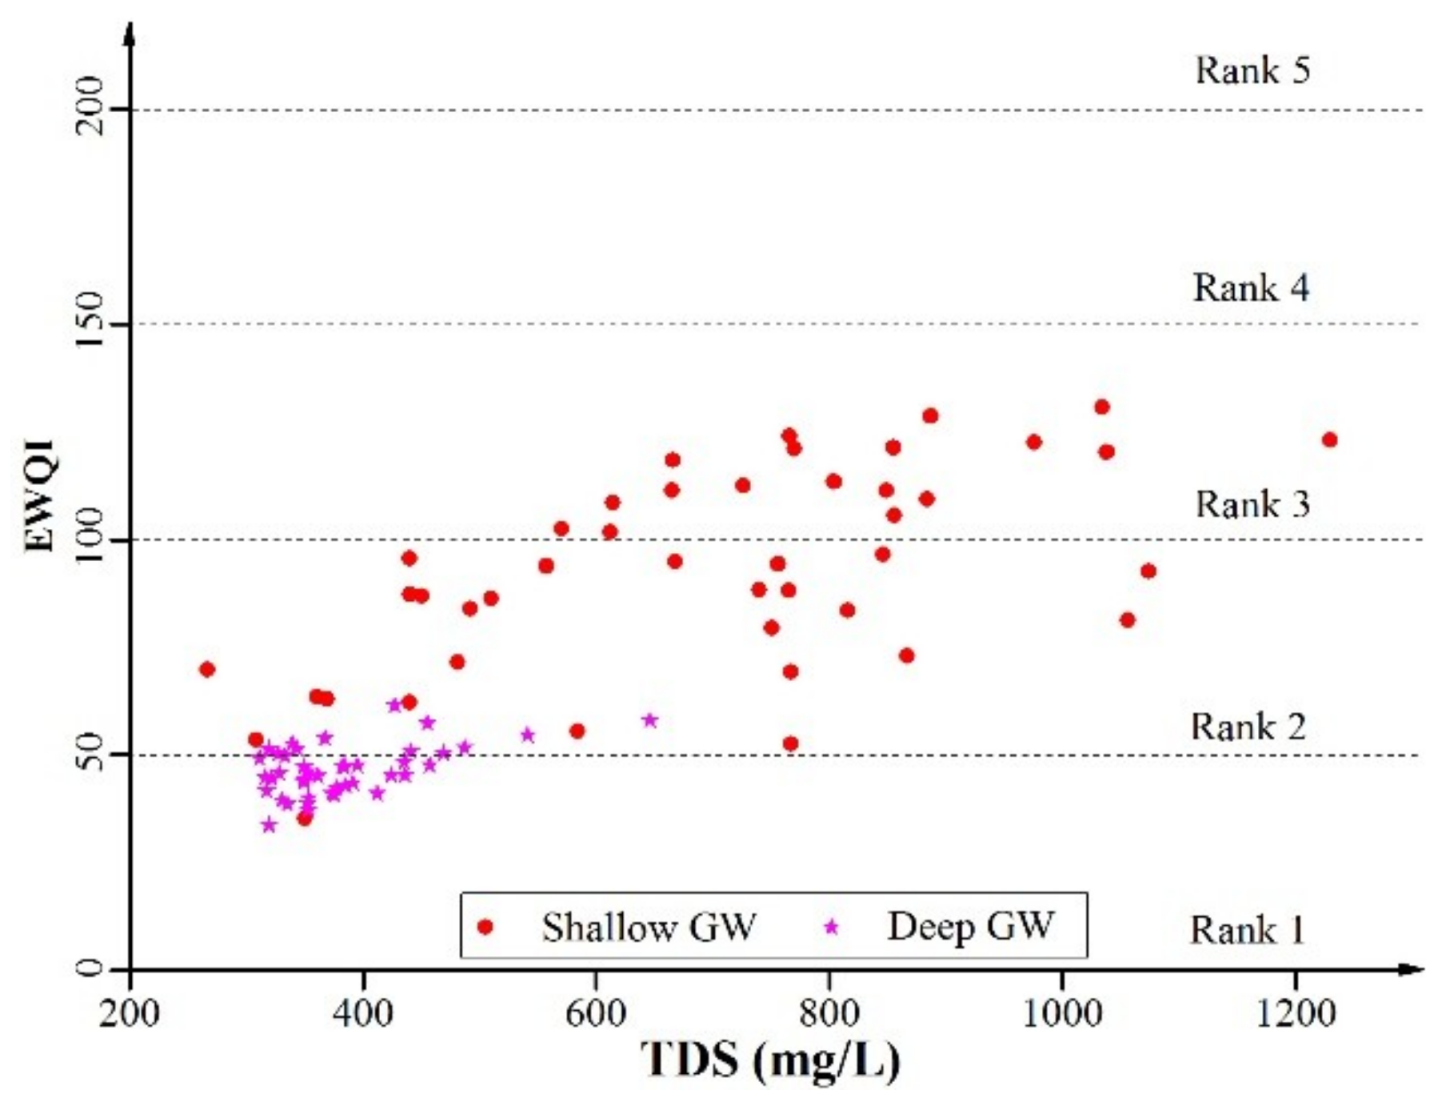
3.3.1. Drinking Purpose
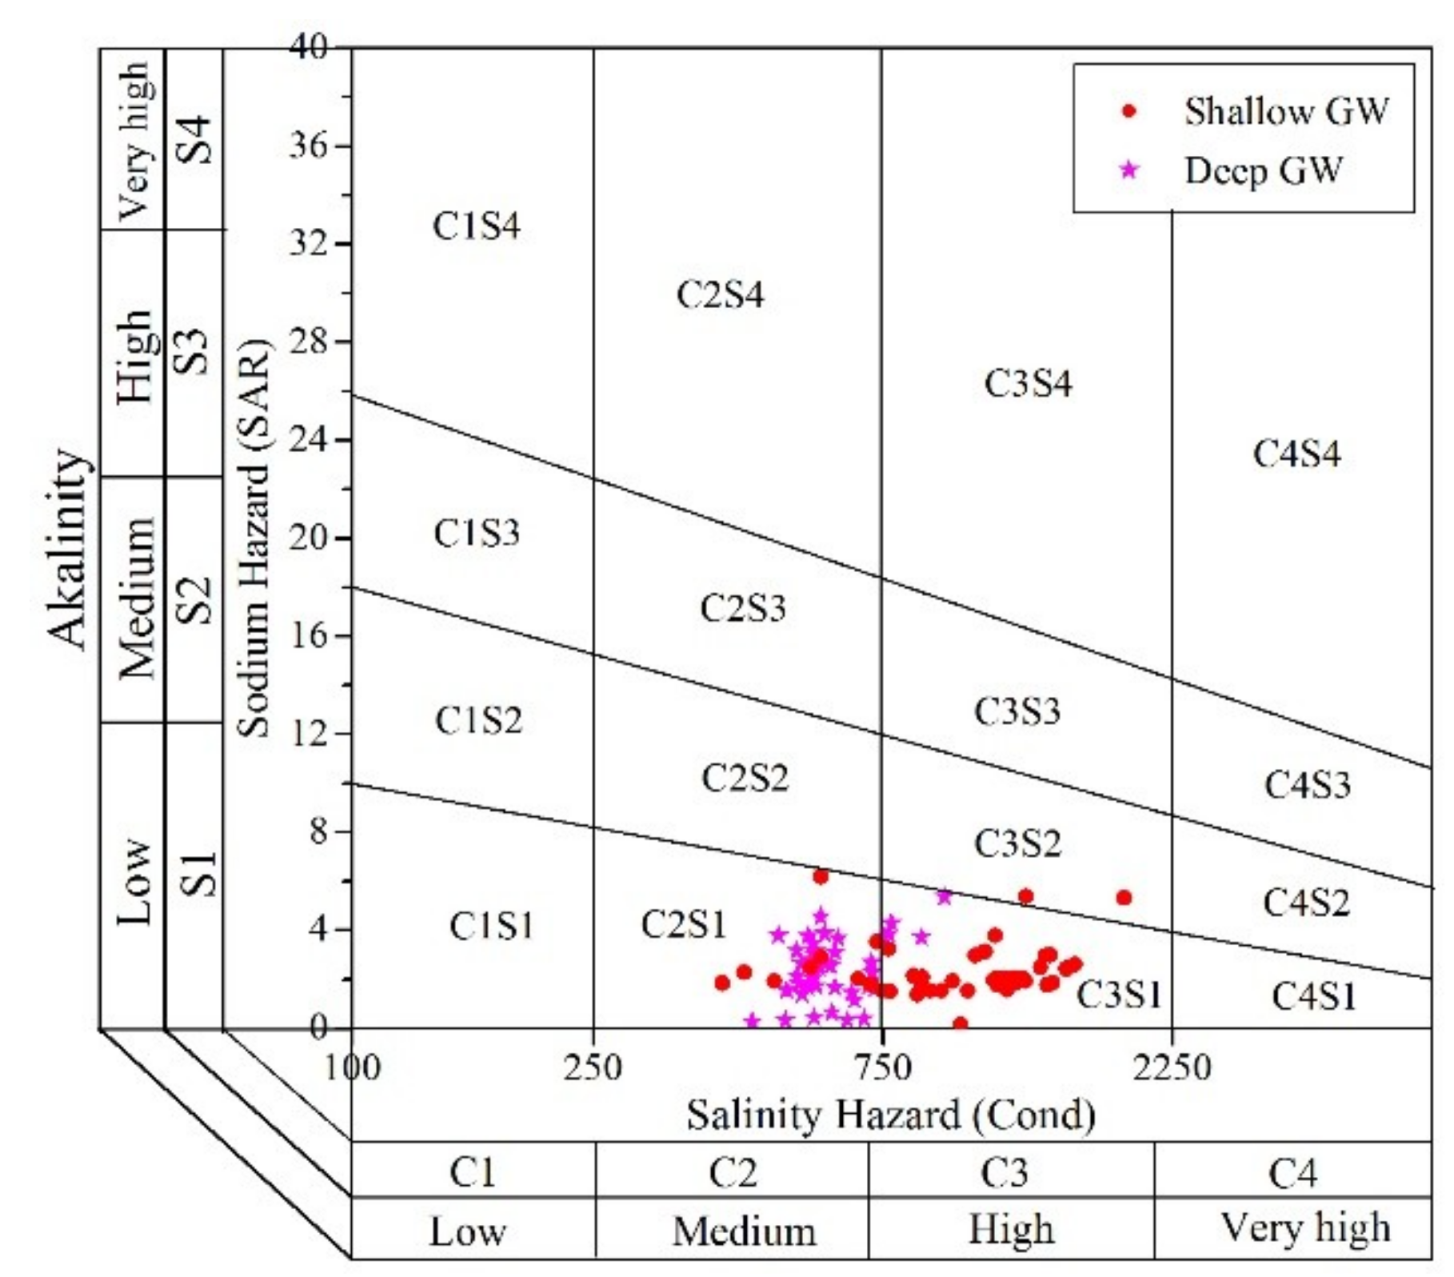
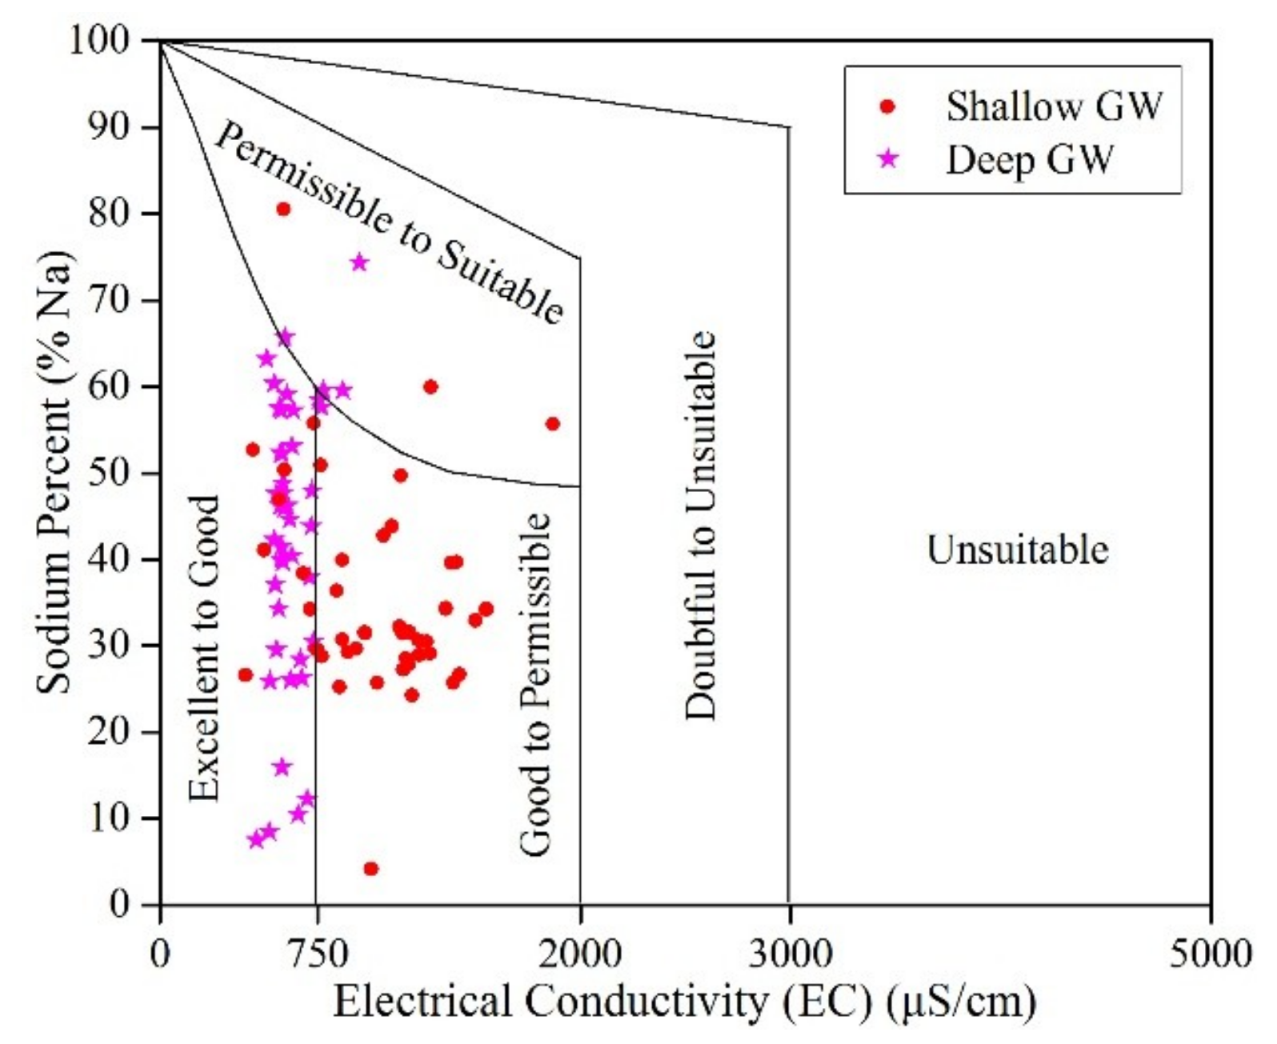
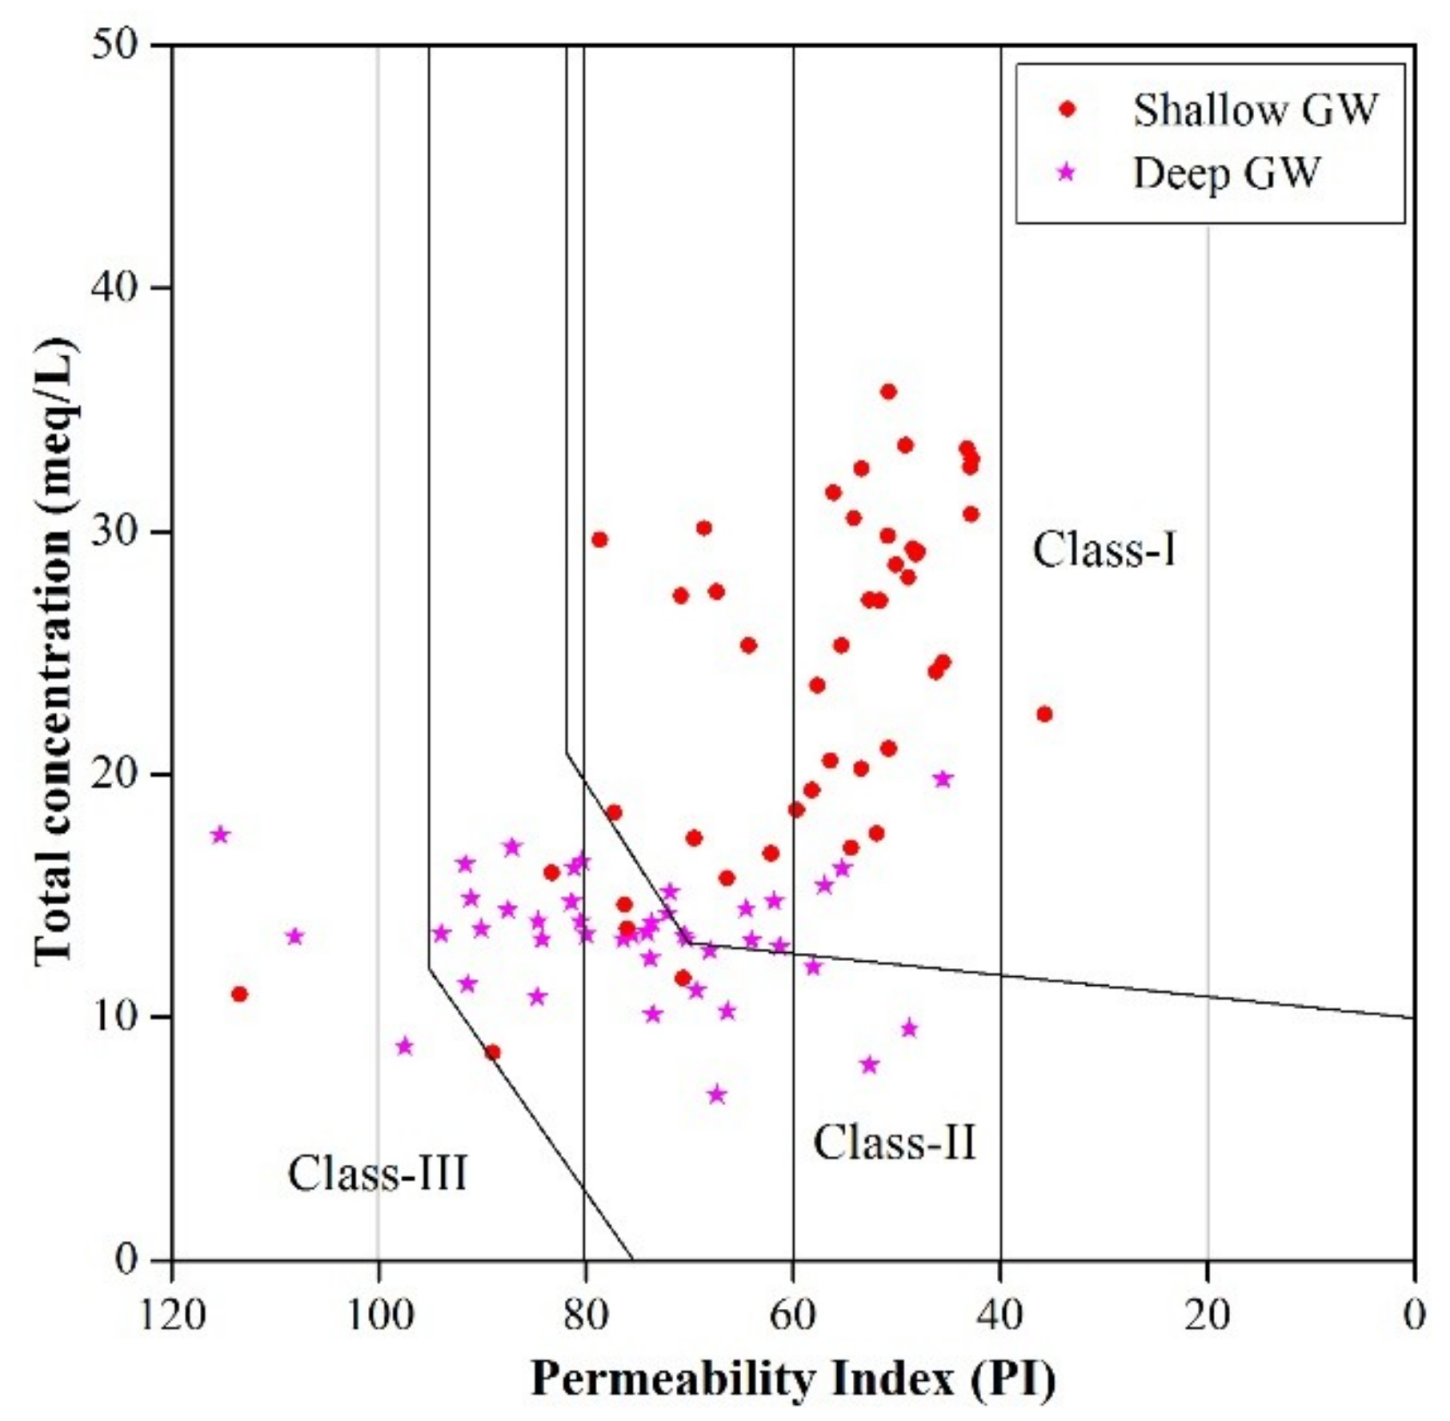
3.3.2. Irrigation Purpose
4. Conclusions
Supplementary Materials
Author Contributions
Funding
Conflicts of Interest
References
- Yu, Y.; Song, X.; Zhang, Y.; Zheng, F.; Ji, L.; Liu, L. Identifying spatio-temporal variation and controlling factors of chemistry in groundwater and river water recharged by reclaimed water at huai river, north china. Stoch. Environ. Res. Risk Assess. 2014, 28, 1135–1145. [Google Scholar] [CrossRef]
- Liang, C.P.; Jang, C.S.; Chen, C.F.; Chen, J.S. Zonal management of multi-purposes groundwater utilization based on water quality and impact on the aquifer. Environ. Monit. Assess. 2016, 188, 431. [Google Scholar] [CrossRef] [PubMed]
- Zhai, Y.; Wang, J.; Teng, Y.; Zuo, R. Hydrogeochemical and isotopic evidence of groundwater evolution and recharge in aquifers in beijing plain, china. Environ. Earth Sci. 2013, 69, 2167–2177. [Google Scholar] [CrossRef]
- Jang, C.S.; Chen, C.F.; Liang, C.P.; Chen, J.S. Combining groundwater quality analysis and a numerical flow simulation for spatially establishing utilization strategies for groundwater and surface water in the pingtung plain. J. Hydrol. 2016, 533, 541–556. [Google Scholar] [CrossRef]
- Davraz, A.; Özdemir, A. Groundwater quality assessment and its suitability in Çeltikçi plain (burdur/turkey). Environ. Earth Sci. 2014, 72, 1167–1190. [Google Scholar] [CrossRef]
- Xiao, Y.; Shao, J.; Frape, S.K.; Cui, Y.; Dang, X.; Wang, S.; Ji, Y. Groundwater origin, flow regime and geochemical evolution in arid endorheic watersheds: A case study from the qaidam basin, northwestern china. Hydrol. Earth Syst. Sci. 2018, 22, 4381–4400. [Google Scholar] [CrossRef]
- Liang, C.-P.; Wang, S.-W.; Kao, Y.-H.; Chen, J.-S. Health risk assessment of groundwater arsenic pollution in southern taiwan. Environ. Geochem. Health 2016, 38, 1271–1281. [Google Scholar] [CrossRef] [PubMed]
- Zhou, Y.; Xiao, W.; Wang, J.; Zhao, Y.; Huang, Y.; Tian, J.; Chen, Y. Evaluating spatiotemporal variation of groundwater depth/level in beijing plain, a groundwater-fed area from 2001 to 2010. Adv. Meteorol. 2016, 2016, 2714209. [Google Scholar] [CrossRef]
- Xiao, Y.; Gu, X.; Yin, S.; Pan, X.; Shao, J.; Cui, Y. Investigation of geochemical characteristics and controlling processes of groundwater in a typical long-term reclaimed water use area. Water 2017, 9, 800. [Google Scholar] [CrossRef]
- Chen, W.; Lu, S.; Jiao, W.; Wang, M.; Chang, A.C. Reclaimed water: A safe irrigation water source? Environ. Dev. 2013, 8, 74–83. [Google Scholar] [CrossRef]
- Chen, W.; Lu, S.; Pan, N.; Jiao, W. Impacts of long-term reclaimed water irrigation on soil salinity accumulation in urban green land in beijing. Water Resour. Res. 2013, 49, 7401–7410. [Google Scholar] [CrossRef]
- Chen, W.; Lu, S.; Pan, N.; Wang, Y.; Wu, L. Impact of reclaimed water irrigation on soil health in urban green areas. Chemosphere 2015, 119, 654–661. [Google Scholar] [CrossRef] [PubMed]
- Wang, F.H.; Qiao, M.; Lv, Z.E.; Guo, G.X.; Jia, Y.; Su, Y.H.; Zhu, Y.G. Impact of reclaimed water irrigation on antibiotic resistance in public parks, beijing, china. Environ. Pollut. 2013, 184C, 247–253. [Google Scholar] [CrossRef] [PubMed]
- Wu, W.; Yin, S.; Liu, H.; Niu, Y.; Bao, Z. The geostatistic-based spatial distribution variations of soil salts under long-term wastewater irrigation. Environ. Monit. Assess. 2014, 186, 6747–6756. [Google Scholar] [CrossRef] [PubMed]
- Zhao, Y.; Han, S.S.; Chen, Z.F.; Liu, J.; Hu, H.X. Comparative study of heavy metals in “soil-wheat” systems between sewage-irrigated areas and clean-water-irrigated areas in suburban beijing. J. Environ. Health 2015, 77, 28–34. [Google Scholar] [PubMed]
- Bao, Z.; Wu, W.; Liu, H.; Chen, H.; Yin, S. Impact of long-term irrigation with sewage on heavy metals in soils, crops, and groundwater—A case study in beijing. Pol. J. Environ. Stud. 2014, 23, 309–318. [Google Scholar]
- Niu, Y.; Yin, S.; Liu, H.; Wu, W.; Li, B. Use of geostatistics to determine the spatial variation of groundwater quality: A case study in beijing’s reclaimed water irrigation area. Pol. J. Environ. Stud. 2015, 24, 611–618. [Google Scholar]
- Wang, S.; Wu, W.; Liu, F.; Yin, S.; Bao, Z.; Liu, H. Spatial distribution and migration of nonylphenol in groundwater following long-term wastewater irrigation. J. Contam. Hydrol. 2015, s177–s178, 85–92. [Google Scholar] [CrossRef] [PubMed]
- Bao, Z.; Wu, W.; Liu, H.; Yin, S.; Chen, H. Geostatistical analyses of spatial distribution and origin of soil nutrients in long-term wastewater-irrigated area in Beijing, China. Acta Agric. Scand. Sect. B Soil Plant Sci. 2014, 64, 235–243. [Google Scholar] [CrossRef]
- Huang, G.; Chen, Z.; Liu, F.; Sun, J.; Wang, J. Impact of human activity and natural processes on groundwater arsenic in an urbanized area (South China) using multivariate statistical techniques. Environ. Sci. Pollut. Res. 2014, 21, 13043–13054. [Google Scholar] [CrossRef] [PubMed]
- Liu, J.; Chen, Z.; Zhang, Y.; Li, Z.; Zhang, L.; Liu, F. Stable isotope evidences on sources and mechanisms of groundwater recharge in hohhot basin, China. Environ. Earth Sci. 2016, 75, 410. [Google Scholar] [CrossRef]
- Wu, W. Research on Groundwater Vulnerability Experiment of Reclaimed Wastewater District and Irrigation Allocation; China University of Geosciences: Beijing, China, 2009. [Google Scholar]
- Li, P.; Wu, J.; Qian, H.; Zhang, Y.; Yang, N.; Jing, L.; Yu, P. Hydrogeochemical characterization of groundwater in and around a wastewater irrigated forest in the southeastern edge of the tengger desert, Northwest China. Expo. Health 2016, 8, 331–348. [Google Scholar] [CrossRef]
- Esmaeili, A.; Moore, F.; Keshavarzi, B. Nitrate contamination in irrigation groundwater, Isfahan, Iran. Environ. Earth Sci. 2014, 72, 2511–2522. [Google Scholar] [CrossRef]
- Vikas, C.; Kushwaha, R.; Ahmad, W.; Prasannakumar, V.; Dhanya, P.V.; Reghunath, R. Hydrochemical appraisal and geochemical evolution of groundwater with special reference to nitrate contamination in aquifers of a semi-arid terrain of NW India. Water Qual. Expo. Health 2014, 7, 347–361. [Google Scholar] [CrossRef]
- Zhang, Q.Q.; Sun, J.C.; Liu, J.T.; Huang, G.X.; Lu, C.; Zhang, Y.X. Driving mechanism and sources of groundwater nitrate contamination in the rapidly urbanized region of south china. J. Contam. Hydrol. 2015, 182, 221–230. [Google Scholar] [CrossRef] [PubMed]
- Karagüzel, R.; Irlayici, A. Groundwater pollution in the isparta plain, Turkey. Environ. Geol. 1998, 34, 303–308. [Google Scholar] [CrossRef]
- WHO. Guidelines for Drinking-Water Quality, 4th ed.; World Health Organization: Geneva, Switzerland, 2011. [Google Scholar]
- Gibbs, R.J. Mechanisms controlling world water chemistry. Science 1970, 170, 1088–1090. [Google Scholar] [CrossRef] [PubMed]
- Farid, I.; Zouari, K.; Rigane, A.; Beji, R. Origin of the groundwater salinity and geochemical processes in detrital and carbonate aquifers: Case of chougafiya basin (Central Tunisia). J. Hydrol. 2015, 530, 508–532. [Google Scholar] [CrossRef]
- Chung, S.Y.; Venkatramanan, S.; Kim, T.H.; Kim, D.S.; Ramkumar, T. Influence of hydrogeochemical processes and assessment of suitability for groundwater uses in busan city, Korea. Environ. Dev. Sustain. 2015, 17, 423–441. [Google Scholar] [CrossRef]
- Schoeller, H. Qualitative evaluation of groundwater resources. In Methods and Techniques of Groundwater Investigations and Development; UNESCO: Paris, France, 1965; pp. 54–83. [Google Scholar]
- Song, X.; Liu, X.; Xia, J.; Jingjie, Y.U.; Tang, C. A study of interaction between surface water and groundwater using environmental isotope in huaisha river basin. Sci. China 2006, 49, 1299–1310. [Google Scholar] [CrossRef]
- Jalali, M. Geochemistry characterization of groundwater in an agricultural area of razan, hamadan, Iran. Environ. Geol. 2009, 56, 1479–1488. [Google Scholar] [CrossRef]
- Marghade, D.; Malpe, D.B.; Zade, A.B. Major ion chemistry of shallow groundwater of a fast growing city of central india. Environ. Monit. Assess. 2012, 184, 2405–2418. [Google Scholar] [CrossRef] [PubMed]
- Gu, X.; Xiao, Y.; Yin, S.; Pan, X.; Niu, Y.; Shao, J.; Cui, Y.; Zhang, Q.; Hao, Q. Natural and anthropogenic factors affecting the shallow groundwater quality in a typical irrigation area with reclaimed water, North China plain. Environ. Monit. Assess. 2017, 189, 514. [Google Scholar] [CrossRef] [PubMed]
- Vasanthavigar, M.; Srinivasamoorthy, K.; Vijayaragavan, K.; Ganthi, R.R.; Chidambaram, S.; Anandhan, P.; Manivannan, R.; Vasudevan, S. Application of water quality index for groundwater quality assessment: Thirumanimuttar sub-basin, tamilnadu, india. Environ. Monit. Assess. 2010, 171, 595–609. [Google Scholar] [CrossRef] [PubMed]
- Amiri, V.; Rezaei, M.; Sohrabi, N. Groundwater quality assessment using entropy weighted water quality index (EWQI) in Lenjanat, Iran. Environ. Earth Sci. 2014, 72, 3479–3490. [Google Scholar] [CrossRef]
- Rao, N.S.; Subrahmanyam, A.; Kumar, S.R.; Srinivasulu, N.; Rao, G.B.; Rao, P.S.; Reddy, G.V. Geochemistry and quality of groundwater of gummanampadu sub-basin, guntur district, andhra pradesh, India. Environ. Earth Sci. 2012, 67, 1451–1471. [Google Scholar]
- Patel, P.; Raju, N.J.; Reddy, B.C.S.R.; Suresh, U.; Gossel, W.; Wycisk, P. Geochemical processes and multivariate statistical analysis for the assessment of groundwater quality in the swarnamukhi river basin, andhra pradesh, India. Environ. Earth Sci. 2016, 75, 611. [Google Scholar] [CrossRef]
- United States Salinity Laboratory. Diagnosis and Improvement of Salinity and Alkaline Soil; USDA Hand Book: Washington, DC, USA, 1954.
- Nematollahi, M.J.; Ebrahimi, P.; Razmara, M.; Ghasemi, A. Hydrogeochemical investigations and groundwater quality assessment of torbat-zaveh plain, khorasan razavi, Iran. Environ. Monit. Assess. 2015, 188, 2. [Google Scholar] [CrossRef] [PubMed]


| Index | Unit | Sample No. | Min | Max | Mean | SD | WHO Guideline (2011) [28] | |
|---|---|---|---|---|---|---|---|---|
| Shallow GW | Ca | mg/L | 44 | 20.20 | 161.00 | 85.19 | 35.28 | 75 |
| Mg | mg/L | 44 | 0.96 | 97.10 | 48.88 | 23.42 | 50 | |
| Na | mg/L | 44 | 9.30 | 257.00 | 104.67 | 43.07 | 50 | |
| K | mg/L | 44 | 0.27 | 9.93 | 1.94 | 1.82 | -- | |
| HCO3 | mg/L | 44 | 155.00 | 694.00 | 470.34 | 131.39 | 500 | |
| SO4 | mg/L | 44 | 9.00 | 197.00 | 80.91 | 47.65 | 250 | |
| Cl | mg/L | 44 | 12.30 | 167.00 | 65.08 | 41.73 | 250 | |
| TDS | mg/L | 44 | 266.00 | 1230.00 | 698.23 | 228.46 | 500 | |
| EC | μS/cm | 44 | 408.00 | 1869.00 | 1034.16 | 326.74 | 500 | |
| pH | -- | 44 | 7.20 | 8.40 | 7.77 | 0.33 | 6.5–8.5 | |
| NH4-N | mg/L | 44 | 0.02 | 4.11 | 0.25 | 0.71 | -- | |
| NO2-N | mg/L | 44 | 0.00 | 1.21 | 0.03 | 0.18 | 3 | |
| NO3-N | mg/L | 44 | 0.15 | 19.30 | 3.84 | 4.90 | 45 | |
| Deep GW | Ca | mg/L | 43 | 22.20 | 82.60 | 42.08 | 11.99 | 75 |
| Mg | mg/L | 43 | 0.58 | 93.00 | 20.73 | 14.05 | 50 | |
| Na | mg/L | 43 | 6.40 | 139.00 | 72.93 | 35.12 | 50 | |
| K | mg/L | 43 | 0.24 | 5.14 | 1.37 | 0.84 | -- | |
| HCO3 | mg/L | 43 | 164.00 | 436.00 | 283.19 | 67.60 | 500 | |
| SO4 | mg/L | 43 | 5.00 | 91.00 | 45.59 | 19.17 | 250 | |
| Cl | mg/L | 43 | 8.80 | 86.20 | 24.27 | 14.41 | 250 | |
| TDS | mg/L | 43 | 312.00 | 647.00 | 383.88 | 67.12 | 500 | |
| EC | μS/cm | 43 | 456.00 | 945.00 | 622.37 | 97.10 | 500 | |
| pH | -- | 43 | 7.40 | 8.40 | 8.07 | 0.30 | 6.5–8.5 | |
| NH4-N | mg/L | 43 | 0.02 | 0.50 | 0.07 | 0.12 | -- | |
| NO2-N | mg/L | 43 | 0.00 | 0.09 | 0.01 | 0.01 | 3 | |
| NO3-N | mg/L | 43 | 0.20 | 3.83 | 0.91 | 0.88 | 45 |
| EWQI | Rank | Water Quality |
|---|---|---|
| <50 | 1 | Excellent |
| 50–100 | 2 | Good |
| 100–150 | 3 | Medium |
| 150–200 | 4 | Poor |
| >200 | 5 | Extremely poor |
| EC | SAR | Irrigation Water Quality | %Na | Irrigation Water Quality |
|---|---|---|---|---|
| <250 | <10 | Excellent | <30 | Suitable |
| 250–750 | 10–18 | Good | 30–60 | Marginally suitable |
| 750–2250 | 18–26 | Acceptable | >60 | Unsuitable |
| >2250 | >26 | Unacceptable |
© 2018 by the authors. Licensee MDPI, Basel, Switzerland. This article is an open access article distributed under the terms and conditions of the Creative Commons Attribution (CC BY) license (http://creativecommons.org/licenses/by/4.0/).
Share and Cite
Gu, X.; Xiao, Y.; Yin, S.; Hao, Q.; Liu, H.; Hao, Z.; Meng, G.; Pei, Q.; Yan, H. Hydrogeochemical Characterization and Quality Assessment of Groundwater in a Long-Term Reclaimed Water Irrigation Area, North China Plain. Water 2018, 10, 1209. https://doi.org/10.3390/w10091209
Gu X, Xiao Y, Yin S, Hao Q, Liu H, Hao Z, Meng G, Pei Q, Yan H. Hydrogeochemical Characterization and Quality Assessment of Groundwater in a Long-Term Reclaimed Water Irrigation Area, North China Plain. Water. 2018; 10(9):1209. https://doi.org/10.3390/w10091209
Chicago/Turabian StyleGu, Xiaomin, Yong Xiao, Shiyang Yin, Qichen Hao, Honglu Liu, Zhongyong Hao, Geping Meng, Qiuming Pei, and Huijun Yan. 2018. "Hydrogeochemical Characterization and Quality Assessment of Groundwater in a Long-Term Reclaimed Water Irrigation Area, North China Plain" Water 10, no. 9: 1209. https://doi.org/10.3390/w10091209
APA StyleGu, X., Xiao, Y., Yin, S., Hao, Q., Liu, H., Hao, Z., Meng, G., Pei, Q., & Yan, H. (2018). Hydrogeochemical Characterization and Quality Assessment of Groundwater in a Long-Term Reclaimed Water Irrigation Area, North China Plain. Water, 10(9), 1209. https://doi.org/10.3390/w10091209