Article

Study on the Water Resource Carrying Capacity in the Middle Reaches of the Heihe River Based on Water Resource Allocation

1
Department of Environmental Engineering, College of Urban and Environmental Science, Northwest University, Xi’an 710127, China
2
Key Laboratory of Surface System and Environmental Carrying Capacity, Xi’an 710127, China
*
Author to whom correspondence should be addressed.
Water 2018, 10(9), 1203; https://doi.org/10.3390/w10091203
Submission received: 12 July 2018 / Revised: 2 September 2018 / Accepted: 4 September 2018 / Published: 6 September 2018
(This article belongs to the Section Water Resources Management, Policy and Governance)

Abstract

:
The study of water resource carrying capacity (WRCC) is significant for rational water resource utilization and promotion of the coordinated development of a regional economy, society, and ecology, especially in arid regions. In this paper, using different scenarios, a fuzzy comprehensive evaluation model based on water resource allocation is constructed to obtain the WRCC in the middle reaches of the Heihe River. The results show that the current development of water resources has a certain scale, and the carrying capacity is relatively low. Compared with the current water resource scheme, various scenario schemes have higher evaluation indexes. Among the schemes, scheme 7 is the optimal plan for the recent planning year, and scheme 13 is the best for the long-term planning year. Based on a subsystems analysis, the social subsystem has the highest score, which is followed by the economic subsystem, water resource subsystem, and ecological subsystem, and the evaluation index of the economic subsystem shows the largest increase. The main factors affecting the WRCC are the water-saving level and crop irrigation quota. Therefore, the WRCC should be improved by raising the level of agricultural water use, restricting the irrigation area, and adjusting the local industrial structure.

1. Introduction

Water plays an extremely important role in human survival and regional socioeconomic development, particularly in arid and semi-arid areas [1]. With rapid population growth and constant economic development, contradictions between the environment, population, and social development have become increasingly prominent [2]. Therefore, alleviating these contradictions has become a key, hot issue in water resource studies. Water resource carrying capacity (WRCC) is the ability of a water resource to bear the economic, social, and ecological environment [3], and a study of WRCC is the foundation of sustainable development and water security strategy [4,5].
In 1989, the concept of WRCC was first put forward by the Xinjiang Water Resources Soft Science Project Team [6]. Since the late 1990s, more thorough research has been conducted on the carrying capacity of water resources. However, due to the regionality and complexity of influencing factors, the concept of WRCC at home and abroad has not been expressed in a unified way [7]. Several studies explained WRCC from the perspective of the maximum supporting capacity of water resources [3,8]. Other studies have considered the WRCC to be the size of the population, economy, and environment that water resources could sustain and support [9]. In fact, the WRCC is not simply a concept that contains both natural and social attributes; the meaning of WRCC is more extensive [10]. Various calculation methods have emerged to quantify WRCC, such as the conventional trend method, which was first used by Shi and Qu (1992) to study the Urumqi River Basin WRCC, as well as the principal component analysis [11,12,13], ecological footprint method [14,15], system dynamics model [10,16], multi-objective computation model [17], artificial neural networks model [18], fuzzy comprehensive assessment model [19,20,21], entropy weight method [22,23], and the pressure-state-response framework of dynamic successive assessment [24]. Among these methods, the fuzzy comprehensive evaluation model is the most commonly used and can be used to evaluate and predict the future carrying capacity of water resources in the study area by analyzing influencing factors.
The northwest arid region is one of the greatest water shortage areas in China. The shortage of water resources and the destruction of the ecological environment caused by unreasonable use of water resources has become a bottleneck of sustainable development. Moreover, there is a problem of groundwater overload in arid areas with poor water resources, which will cause many problems [25]. Carrying out water resources management will help alleviate water conflicts and promote harmonious development of society [26,27]. Therefore, research on WRCC has important significance for the scientific and rational utilization of water resources in arid and semi-arid regions of northwestern China, directly influences the sustainable development of the local social economy [28], and provides a certain decision-making basis for water resources management in the Northwest. The Heihe River Basin is the second largest inland river in China and has many issues related to water resources and the ecological environment. The fundamental reason is that the WRCC cannot meet current socioeconomic development or the needs of the ecosystem protection target. Therefore, research on the WRCC based on the rational allocation of water resources is of great significance to the sustainable development of arid and semi-arid areas.
The Heihe River is the second largest inland river in China, and the water resources of this river have been extensively studied. Since the beginning of the 20th century, research on water resource allocation has focused on proposing a complete set of theories and methods for the deployment of water resources in the basin, and on this basis, a set of operational water resource allocation and management information systems were established for the Heihe River Basin [29,30], and some water-saving measures and ecological protection policies were proposed [31]. Many studies have concentrated on the Heihe River’s WRCC, the sustainable utilization of water resources [32,33,34], and the research on WRCC from the perspective of ecological economics [35]. However, few studies have considered the allocation of water resources and their impact on WRCC. In this paper, based on rational water resource allocation, a fuzzy comprehensive evaluation model of WRCC was built to compare WRCCs under different water resource allocation plans to provide the decision-making basis for future water development and utilization, social and economic development, and ecological environmental protection programs.

2. Materials and Methods

2.1. Study Area and Data Sources
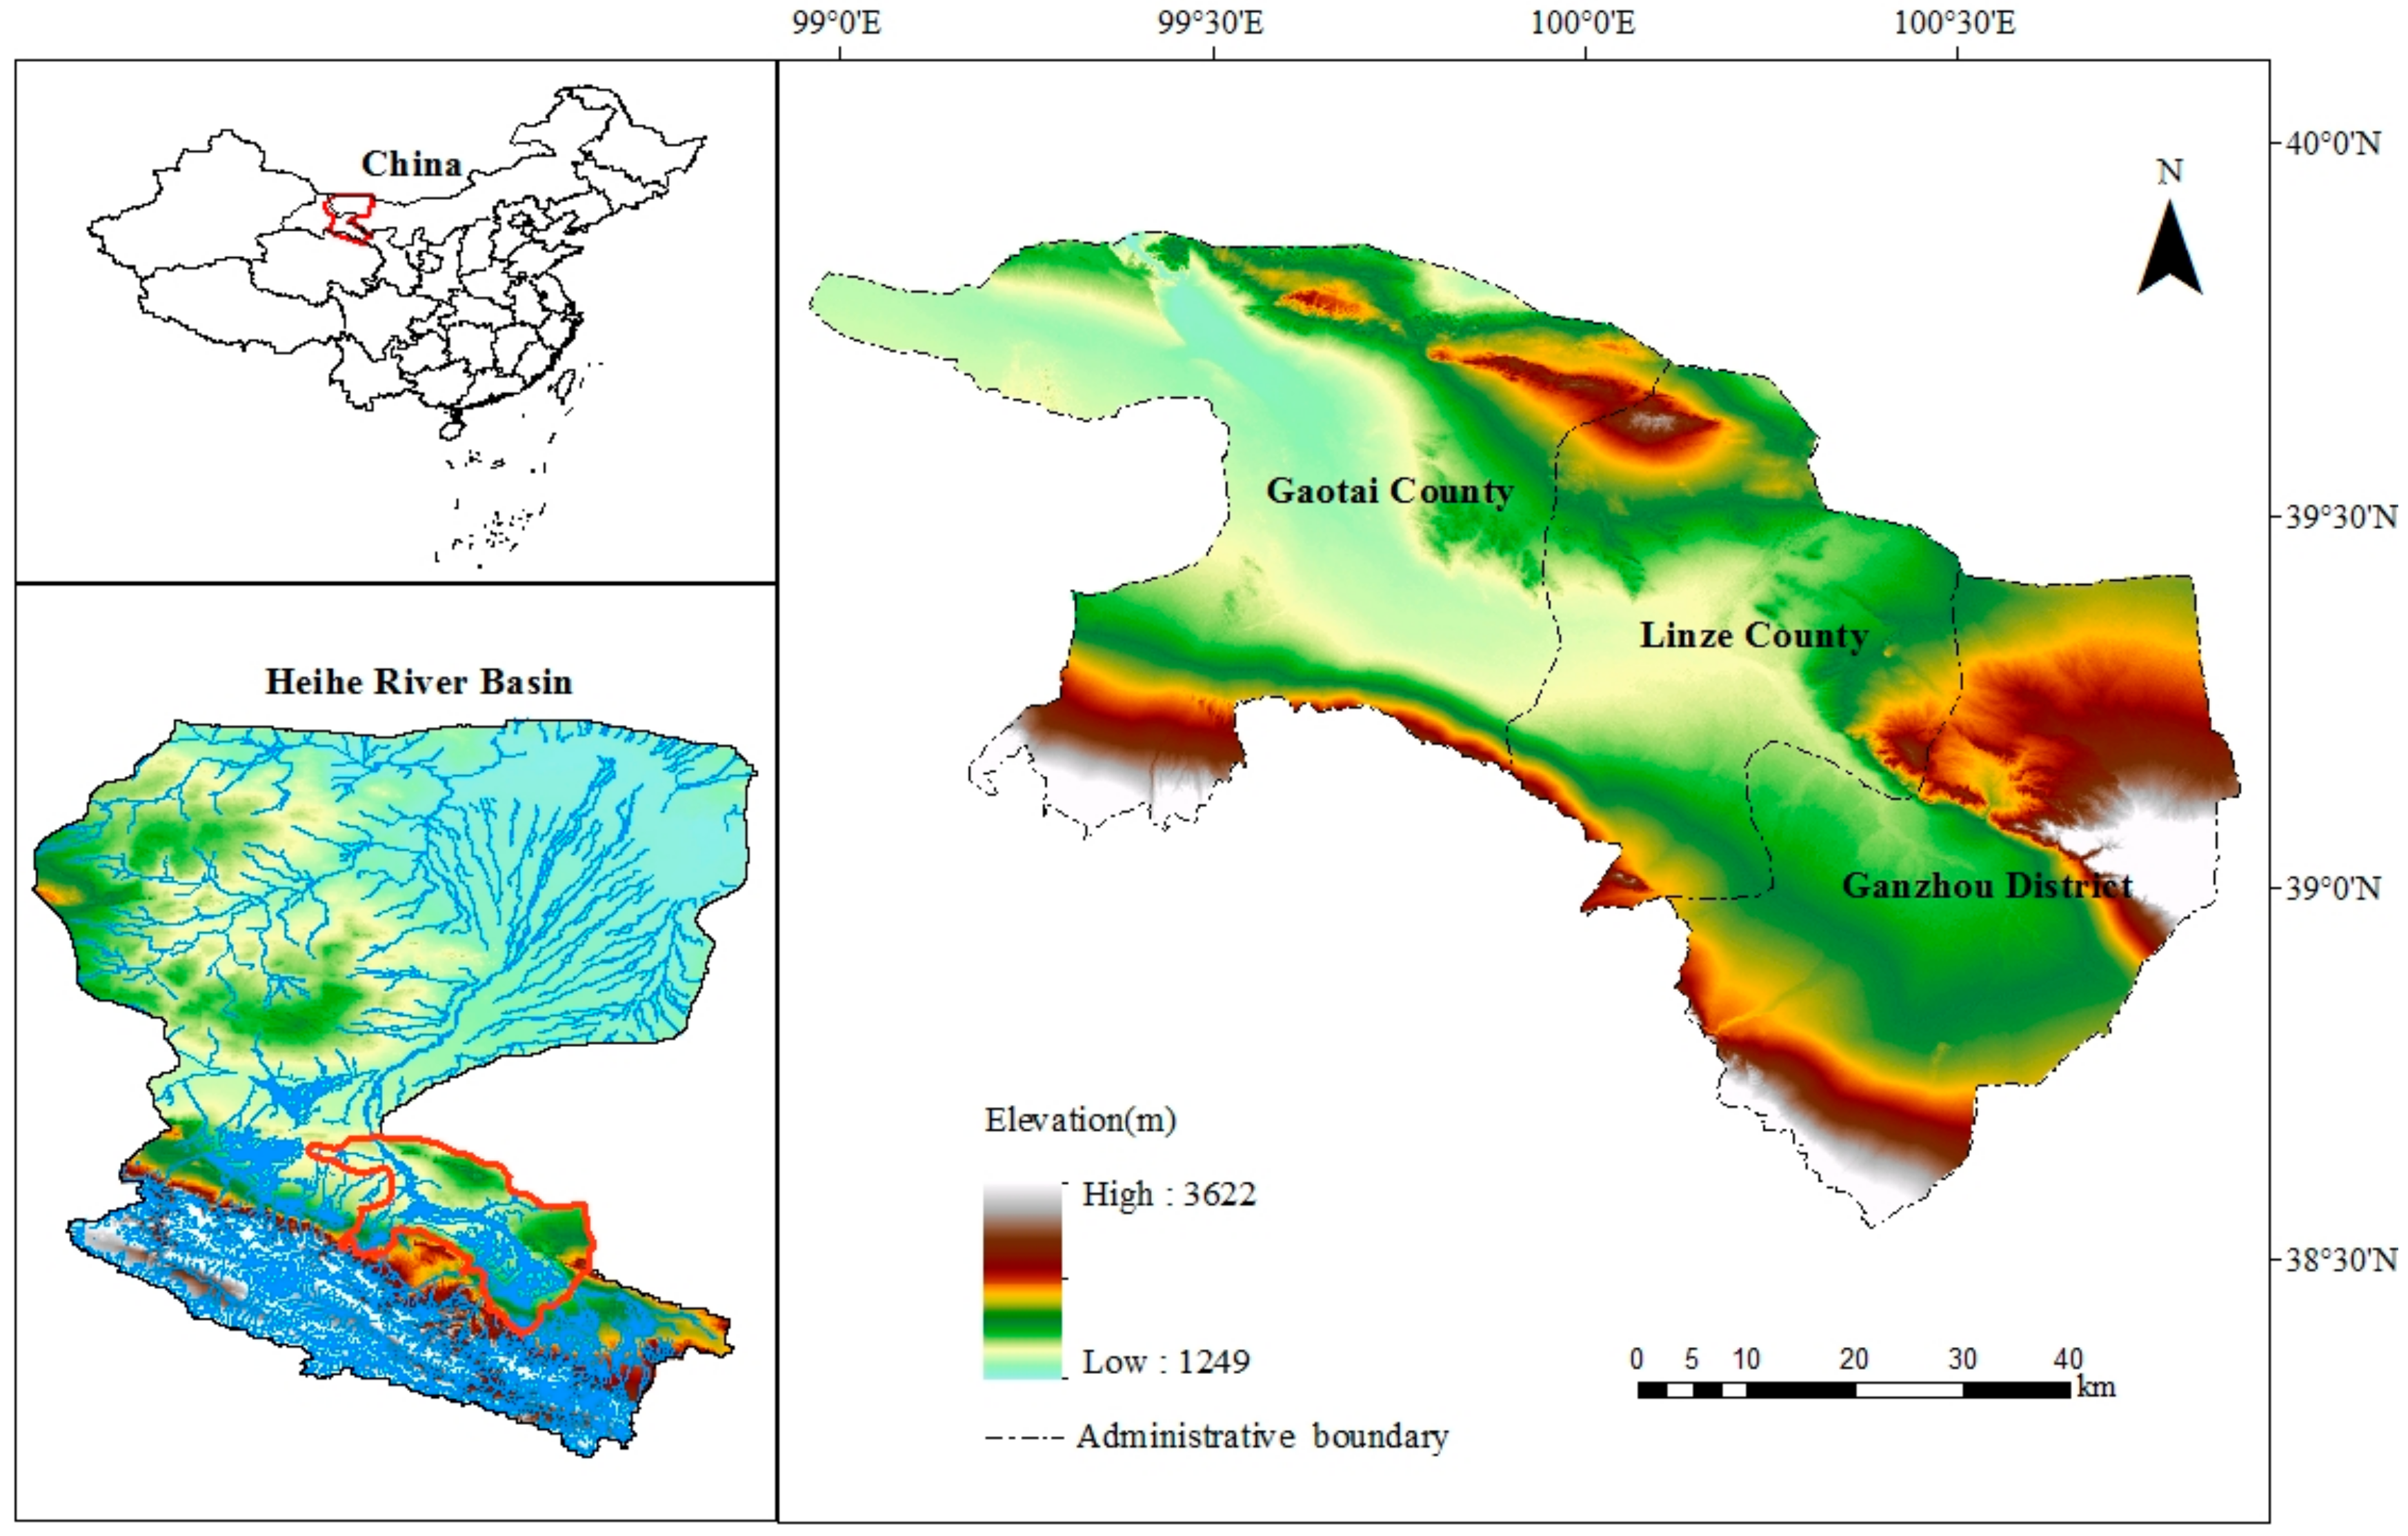
2.1.1. Study Area

The Heihe River Basin originates in the northern foot of Qilian Mountain and flows through Qinghai, Gansu and Inner Mongolia. The total length of the main stream is 821 km, and the basin area is approximately 142,900 km2 [24,34]. The Heihe River Basin is divided into three major reaches: upstream, middle, and downstream. The upstream reach is the water source area and has relatively sufficient water resources. Conversely, water resources are scarce in the other two areas, especially downstream. The midstream is composed of broad, flat plains suitable for irrigated agriculture. In contrast, the downstream reaches mostly consist of deserts [36]. Economic activities are concentrated in the midstream, where water consumption for human living, economic output, and agricultural irrigation together account for over 90% of the total water consumption quantities for the entire basin [37].
The water supply in the middle reaches of the Heihe River Basin is mainly from the upstream runoff, local precipitation, and groundwater, and this water supply is principally used for residential life and economic development [38]. The unreasonable exploitation of water resources in the middle reaches has led to a series of ecological and environmental issues in the downstream reaches [39]. Thus, the State decided to implement unified management and dispatch of water resources in the Heihe River Basin. Through recent governance planning of the watershed, the efficiency of water utilization has been effectively improved, and the amount of water entering the downstream reaches has significantly increased. However, there is a gap between the discharge volume of the downstream Zhengyixia section and the requirements of the State Council’s water distribution plan, and the water consumption of the middle reaches is still high [40]. Therefore, the correct evaluation of the water carrying capacity under different deployment schemes is conducive to the subsequent rational allocation of water resources for the Heihe River.
Considering the availability of data, we select the status year (2012), the recent programming year (2020), and the long-term programming year (2030) to be evaluation years for analyzing the WRCC in the Heihe River Basin. Meanwhile, in this paper, three counties in Zhangye in the midstream reaches are chosen as the study area, including Ganzhou, Gaotai, and Linze (Figure 1), which are the main agricultural production regions. The study area is 1.14 × 10⁴ m2, accounting for 7.98% of the Heihe River Basin. In addition, the data are derived from the results of the scheme set for water resource allocation.

2.1.2. Data Sources

The data used in this paper were collected from many reports such as Review of the Optimal Allocation of Surface Water and Groundwater in the Middle Reaches of the Heihe River, Compilation of Technical Plan for Optimal Allocation of Surface Water and Groundwater in the Middle Reaches of the Heihe River Basin. There are also some statistics, such as the Zhangye Statistical Yearbook 2012, which includes basic information about population, land area, average annual precipitation, total water resources, and so on. The values of evaluation factors were calculated from the original data. In addition, the indices of the gradation of each evaluation factor were determined by consulting other evaluation standards of water resources [37,38].

2.2. Water Resource Allocation Model and Scheme Set

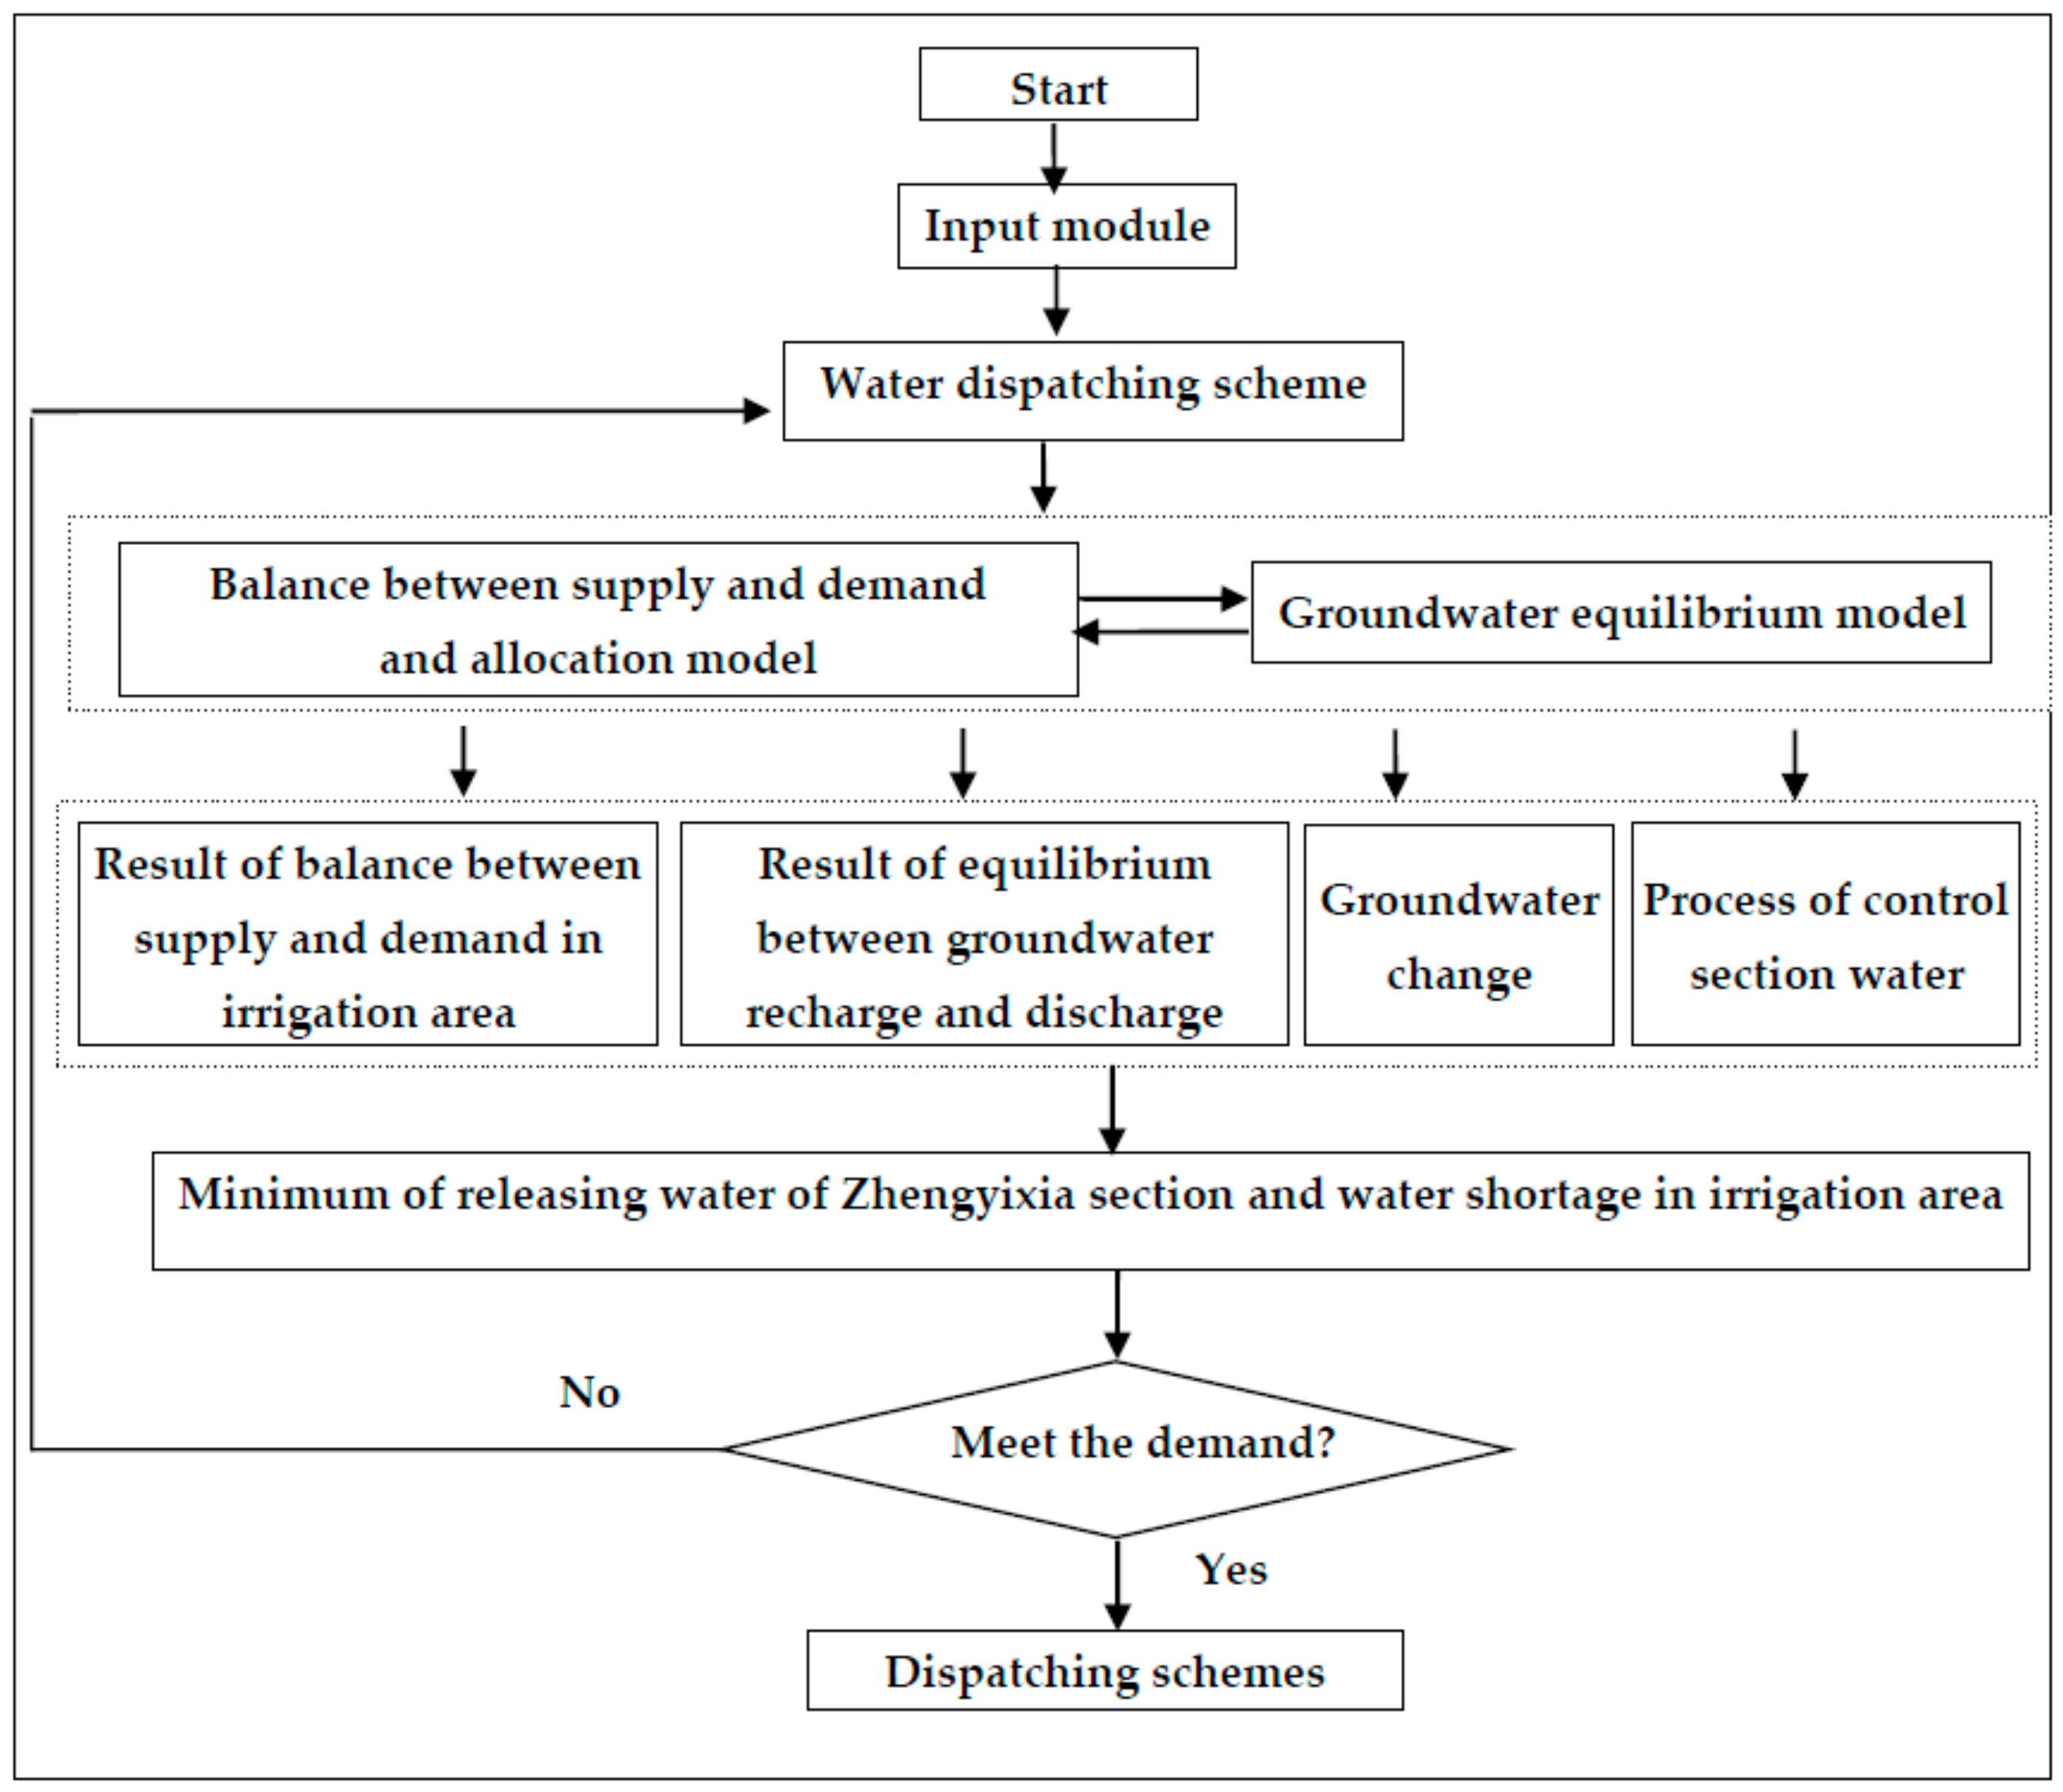
2.2.1. Construction of the Model

The water resource system of the Heihe River Basin is complex and complete, consisting of surface water and ground water sources such as rivers, reservoirs, and spring water. Therefore, the water transformation characteristics of the Heihe River Basin middle reaches and water balance factors such as river course seepage, spring water discharge, phreatic water evaporation, and canal system field infiltration should be reflected in the Heihe River water resource allocation model to calculate the water balance under different inflow and water consumption scenarios. According to the long series years of the Yingluoxia section inflow on the Heihe River main stream and considering the actual water demand of the middle reaches irrigation area, the runoff process characteristics of the flood season from July to October are combined and several gate closed water transfer schemes of the Heihe River main stream are proposed. Subsequently, taking the water releases in the Zhengyixia section as the control condition and assuming a minimum water shortage in the middle reaches irrigation area, a reasonable water allocation scheme was determined via analysis of the multi-scheme simulation. The water allocation models on the Heihe River main stream primarily included the groundwater equilibrium model of the irrigation area in the Heihe River middle reaches, the water resource balance model between supply and demand and the water resource allocation model. The groundwater equilibrium model was mainly used to calculate groundwater replenishment in different water resource allocation schemes and the release balance. The water resource balance model between supply and demand and water resource allocation model were mainly used to analyze water demand, supply, and shortage in the irrigation area and to calculate water resources. The framework of the water resource model is shown in Figure 2.

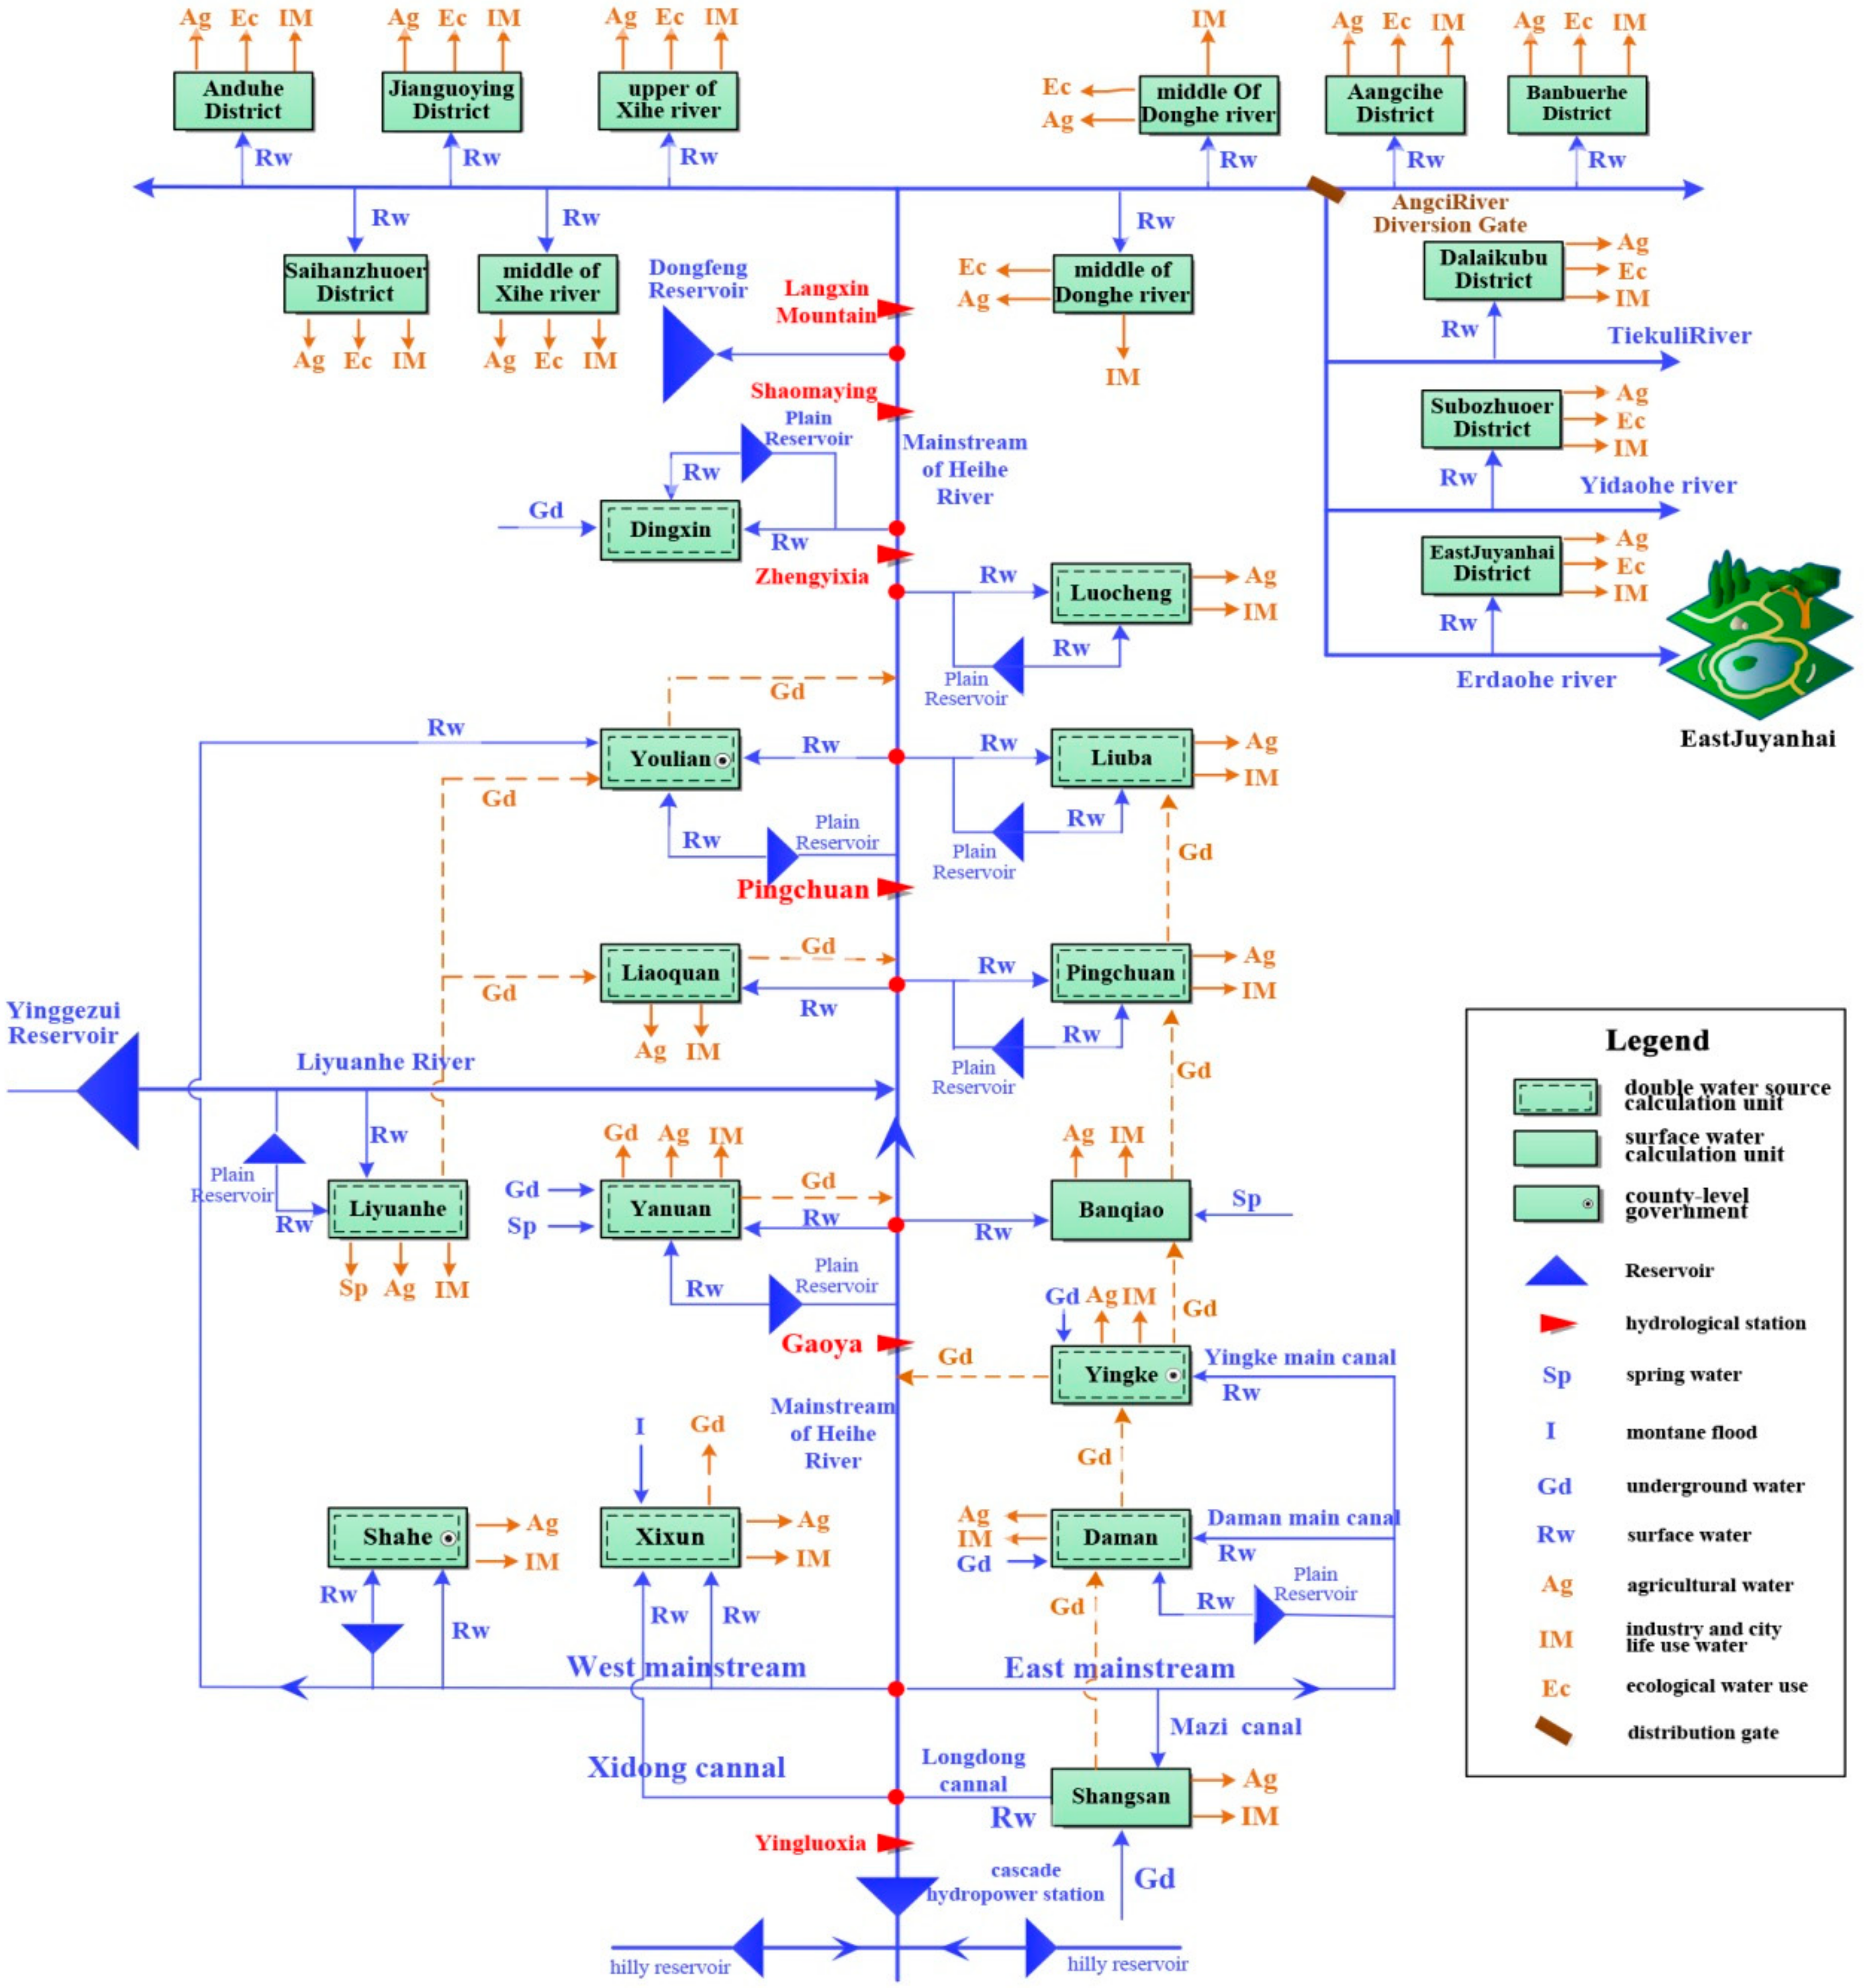
2.2.2. Generalization of the Heihe River Water Resource System

The principle of water resource system generalization considers the water distribution unit to be the center and the Heihe River is the main line, which is based on the entire basin, different calculation units, administrative regions (inter-provincial, inter-county), and the water diversion (combined) entrance for each calculation unit. The Heihe River water control section was considered to be a water quantity control node. Traditionally, the Heihe River was divided into the upper, middle, and lower reach control sections by Yingluoxia and Zhengyixia, including tributaries (such as the Liyuan River) with hydraulic connections to the Heihe River surface water, and thus, areas can be assigned to water through several measures. Calculation units were divided according to administrative divisions, which will not break the irrigation divisions. In these calculation units, all kinds of water balances and unified deployment constraints are reflected in the reservoir, canal node, computing unit, and water balance equation between the two calculation units. Most of these units were mixed water supply units, and there was a pure surface water supply unit and groundwater supply unit. According to many years of actual operation of specific circumstances and administrative subordination relations, irrigation areas of the middle reaches, river trends of the lower reaches, and the national defense scientific research base and ecological oasis, the calculation units of the Heihe River water rational allocation are divided into 24 units. Thus, statistical results can be conveniently obtained according to each administrative region in the Heihe River. The corresponding relationships between the calculation units and administrative regions within the research area are shown in Table 1.
Based on the water resource rational allocation requirements, to reflect the internal relations among the main factors affecting the supply and demand analysis, the framework of the water resource system in the Heihe River Basin, which is shown in Figure 3, was abstractly simplified by calculating the spatial relationship and hydraulic connections among units, such as surface drainage, groundwater, and large and medium-sized key hydraulic engineering structures.

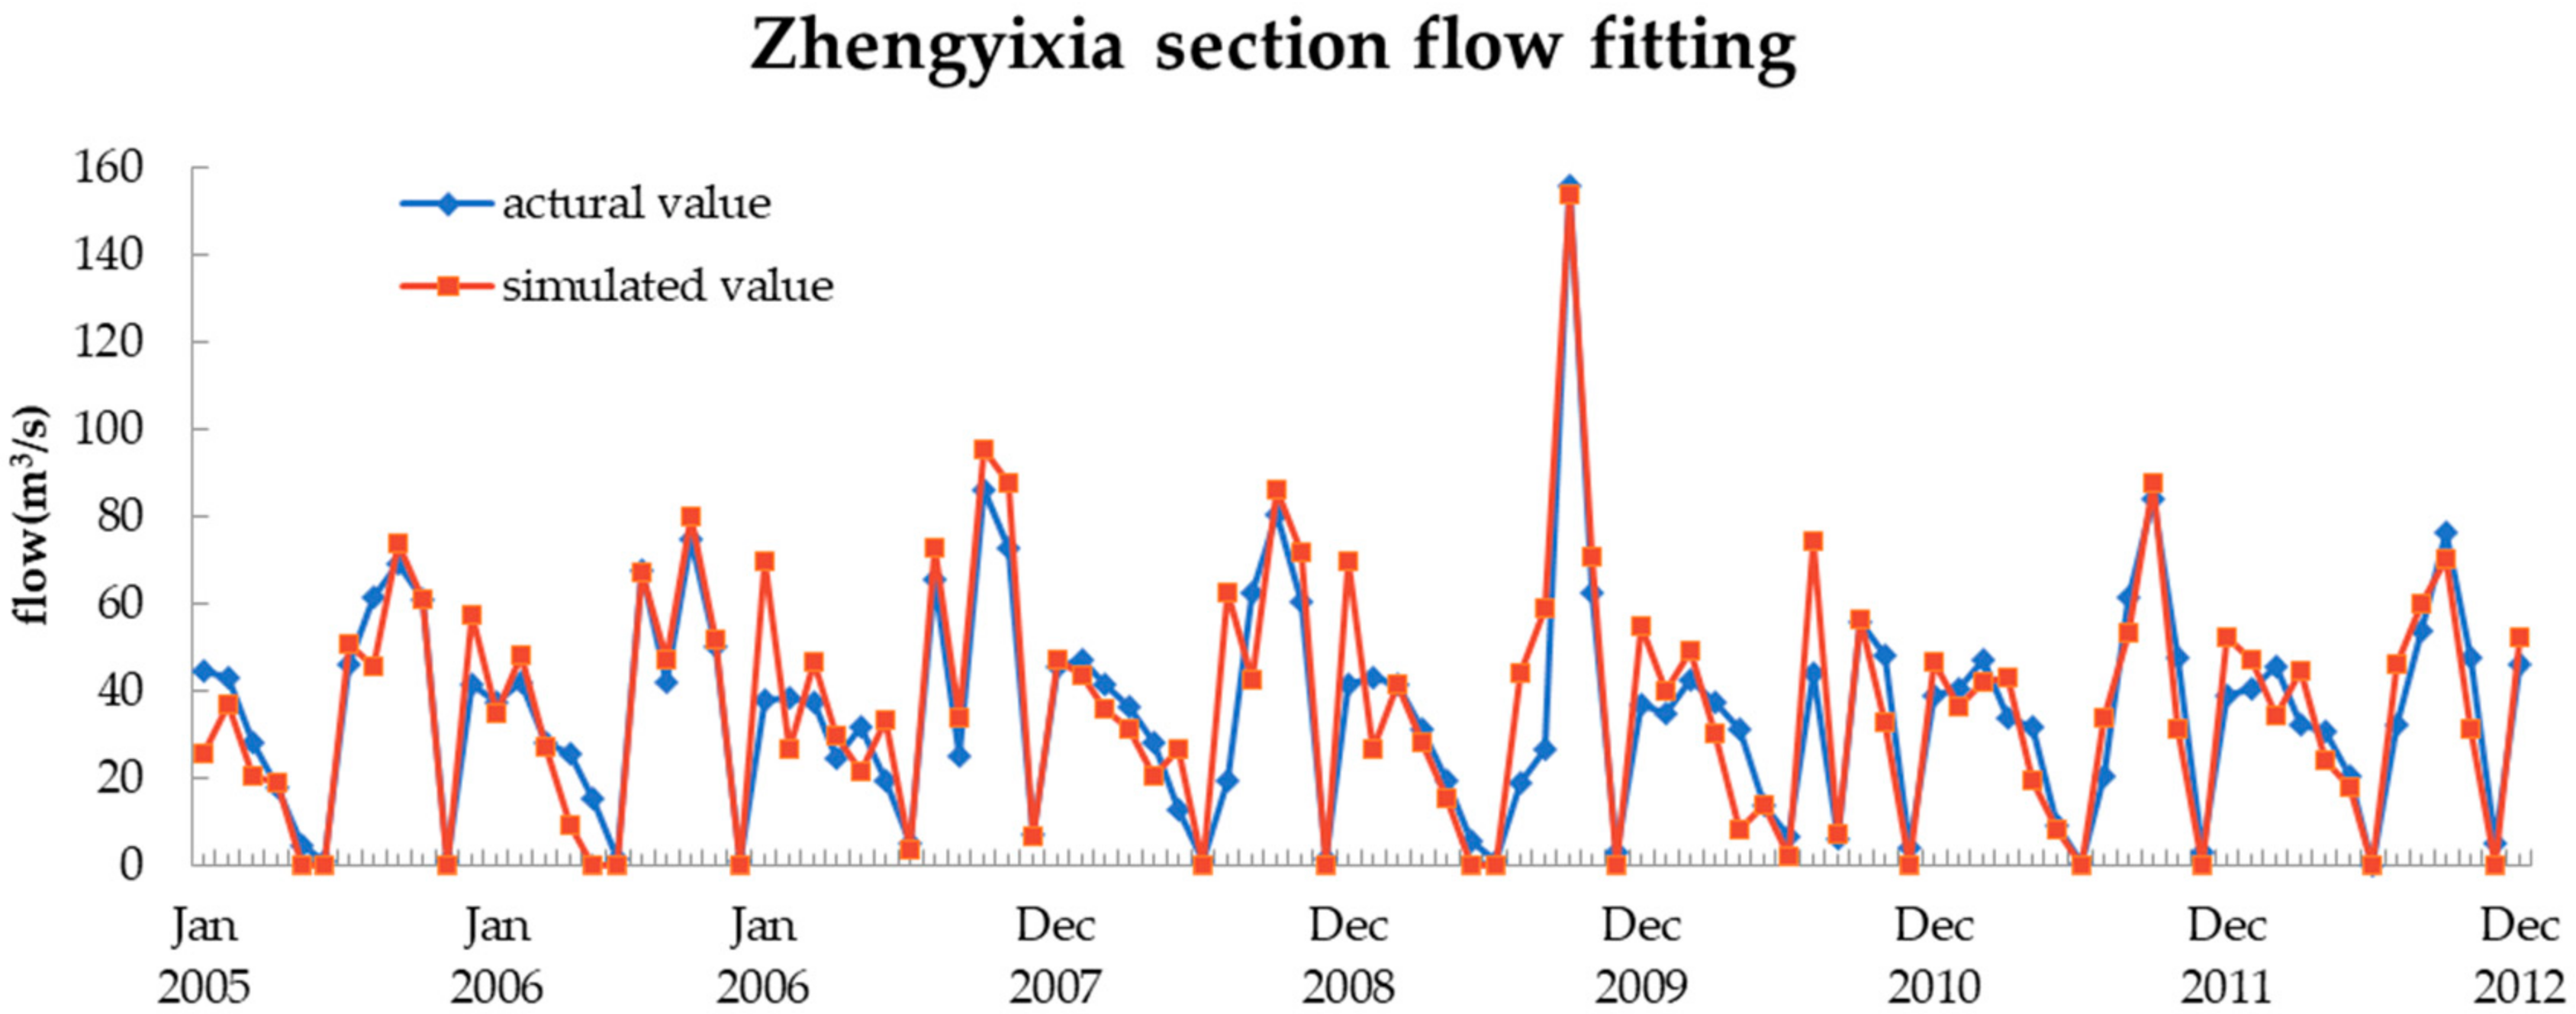
2.2.3. Model Verification

To examine the rationality of this model, the groundwater level of each irrigation area and stream flow of each river section for the period of 2005 to 2010 were simulated. Additionally, the equilibrium relationships among groundwater replenishment capacity, total water discharge, and groundwater storage variable for each irrigation area were analyzed. The simulation results of the irrigation area’s groundwater equilibrium and stream flow of the river cross-section are shown in Table 2 and Figure 4. According to the “Supplementary Details of Groundwater Resource Amount and Allowable Groundwater Withdrawal”, the absolute value of the relatively balanced error should be less than 10% for groundwater balance computational accuracy in a flat area. This model can efficiently fit the water balance in the irrigation area based on the verification table of the irrigation area water balance. According to the fitting chart of the main cross-section stream flow shown in Figure 4, the imitative effects of the cross-section stream flow were obviously better.

2.2.4. Setup of the Scheme Set

The water resource allocation system of the river basin includes two aspects: water supply and demand. The water supply aspect refers to the water source project and transport route, and the water demand aspect covers urban life, industrial production, agricultural irrigation, ecological maintenance, hydroelectric power generation, and so on.
According to the development situation in the current level year (2012), recent planning level year (2020), and long-term planning level year (2020), the water supply and demand states are determined. In accordance with the principle and basis for formulating the water resource allocation plan in the Heihe River Basin, 13 schemes were set up based on the following five aspects: water source project, irrigation area, irrigation water-saving level, socioeconomic development level, and ecological water demand level, as shown in Table 3.
(1) Current level year (2012)
In Scheme 1, the Huangzang Temple Reservoir regulates the water from the upper reaches of the Heihe River, and the plain reservoir takes the water supply task of the irrigation district; the Ying-Hong Cascade Reservoir adopts the short-term operation mode; the irrigated area maintains the current area of 282.38 × 10⁴ mu, the irrigation water-saving intensity is the current level, and the irrigation water utilization coefficient is 0.53; Social and economic development is the status quo.
(2) Recent planning level year (2020)
In Schemes 2–7, there is the Huangzang Temple Reservoir to regulate the upstream water, the abandoned plain reservoir, and the Ying-Hong Cascade Reservoir uses the short-term operation mode.
Scheme 2: the irrigated area is restored to the 2000 level of 239.75 × 10⁴ mu, and the irrigation water-saving intensity is low, and the irrigation water utilization coefficient is 0.58; the level of socioeconomic development is low.
Scheme 3: the irrigated area is restored to the 2000 level of 239.75 × 10⁴ mu, and the irrigation water-saving intensity is medium, and the irrigation water utilization coefficient is 0.61; social and economic development is at a medium level.
Scheme 4: the irrigated area is restored to the 2000 level of 239.75 × 10⁴ mu and the irrigation water-saving intensity is high, and the irrigation water utilization coefficient is 0.63; the socioeconomic development is at a high level.
Scheme 5: the irrigated area is restored to 219.48 × 10⁴ mu as required by the Recent Management Plan, and the irrigation water-saving intensity is low, and the irrigation water utilization coefficient is 0.58; the level of socioeconomic development is low.
Scheme 6: the irrigated area is restored to 219.48 × 10⁴ mu as required by the Recent Management Plan, and the irrigation water-saving intensity is medium, and the irrigation water utilization coefficient is 0.61; social and economic development is at a medium level.
Scheme 7: the irrigated area is restored to 219.48 × 10⁴ mu as required by the Recent Management Plan, and the irrigation water-saving intensity is high, and the irrigation water utilization coefficient is 0.63; the socioeconomic development is at a high level.
(3) Long-term planning level year (2030)
In Scheme 8–13, there is the Huangzang Temple Reservoir to regulate the upstream water, the abandoned plain reservoir, and the Ying-Hong Cascade Reservoir uses the long-term operation mode.
Scheme 8: the irrigated area is restored to the 2000 level of 239.75 × 10⁴ mu, and the irrigation water-saving intensity is low, and the irrigation water utilization coefficient is 0.58; the level of socioeconomic development is low.
Scheme 9: the irrigated area is restored to the 2000 level of 239.75 × 10⁴ mu, and the irrigation water-saving intensity is medium, and the irrigation water utilization coefficient is 0.61; social and economic development is at a medium level.
Scheme 10: the irrigated area is restored to the 2000 level of 239.75 × 10⁴ mu and the irrigation water-saving intensity is high, and the irrigation water utilization coefficient is 0.63; the socioeconomic development is at a high level.
Scheme 11: the irrigated area is restored to 219.48 × 10⁴ mu as required by the Recent Management Plan, and the irrigation water-saving intensity is low, and the irrigation water utilization coefficient is 0.58; the level of socioeconomic development is low.
Scheme 12: the irrigated area is restored to 219.48 × 10⁴ mu as required by the Recent Management Plan, and the irrigation water-saving intensity is medium, and the irrigation water utilization coefficient is 0.61; social and economic development is at a medium level.
Scheme 13: the irrigated area is restored to 219.48 × 10⁴ mu as required by the Recent Management Plan, and the irrigation water-saving intensity is high, and the irrigation water utilization coefficient is 0.63; the socioeconomic development is at a high level.

2.3. Construction of WRCC Evaluation System and Gradation of Evaluation Factors

It is crucial to establish an evaluation index system for the WRCC. The carrying capacity of water resources in arid areas is affected by many factors, and there are different selection results according to various research objectives [19,20]. Under operable, regional, systematic, sufficient, and data availability principles, the index system can be selected by considering the characteristics of the water and water consumption in the Heihe River middle reaches. Thus, the WRCC system is divided into four subsystems of water resources, economy, society, and ecological environment. A total of 12 evaluation indexes are selected, and the WRCC evaluation system is constructed (Table 4).
In addition, based on relevant research results, the impact of the above WRCC evaluation factors are divided into three levels: v1, v2, and v3 [40,41,42], and the corresponding grading of each evaluation factor is formulated (Table 4). v1 represents a good situation, meaning the regional WRCC is at a relatively high level and the water supply amount is much higher than the water demand. v3 represents a bad situation, meaning the regional WRCC is low, and more water exploitation may easily lead to water shortages and restrict social and economic development. v2 is between v1 and v3, indicating that water resources have been used at a large scale, but there is still the potential for exploitation and utilization.

2.4. Evaluation of WRCC by Fuzzy Comprehensive Evaluation Model Based on Entropy Weight Method

2.4.1. Determination of the Weight Coefficient by Entropy Weight Method

The entropy method can be used to determine the weight based on the data dispersion, which avoids subjective human interference. The impacts of different evaluation factors on the water resource bearing capacity are different, where the greater the variation of an indicator in the evaluation process, the greater the impact on the WRCC. Therefore, to ensure objective and truthful evaluation results, the entropy method is used in this paper to determine the weight coefficient, and the specific steps of this method are as follows:
First, a data matrix M =   ( x i j ) m n is constructed, which has m evaluation objects and n evaluation factors (i = 1, 2, …, n; j = 1, 2, …, m).
Second, non-negative processing is completed for each evaluation factor. The following processing is performed to avoid a meaningless logarithm of entropy:
  Z i j = x i j min ( x i j ) max ( x i j ) min ( x i j ) + 1  
where Z i j is the data after non-negative; x i j is the data of the j-th evaluation factor in the i-th scheme of the data matrix.
Third, the entropy of the j-th evaluation factor is calculated as follows:
  e j = [ 1 ln ( n ) i = 1 n P i j ln ( P i j ) ]  
  P i j = Z i j i = 1 n Z i j  
where e j is the entropy of the j-th evaluation factor, P i j is the proportion of the j-th evaluation factor in the i-th scheme accounts for the sum of j-th evaluation factor for all schemes.
Last, the weight of each factor in the subsystem ( w j ) can be obtained from the following formula:
  w j = 1 e j m j = 1 m e j ( 0 w j 1 : j = 1 m w j = 1 )  
where w j is the entropy weight of the j-th evaluation factor.

2.4.2. Fuzzy Comprehensive Evaluation Model

The fuzzy comprehensive evaluation model can be used to evaluate the WRCC in a multi-level and multi-factor manner and more fully reflect the status of regional water resources. The basic principle is as follows: given two finite groups U   =   { u 1 ,   u 2 , ,   u n } ,   V   =   { v 1 ,   v 2 , ,   v m } , U is the evaluation index set composed of all evaluation indexes; V is the review set; rij is the membership degree of the evaluation index ui to vj, and thus, the fuzzy relation matrix R is as follows [36] (Meng et al., 2009):
  R = ( r 11 r 12 r 1 m r 21 r 22 r 2 m r n 1 r n 1 r nm )  
Then, the fuzzy relation matrix is multiplied by the weight of each index, and the result will be an evaluation grade. Assuming the weight coefficient of each index is W   =   { w 1 , w 2 , , w n } (W is a fuzzy subset of U, 0 wi≤ 0 is w i= 1), the comprehensive judgment matrix B is shown as follows:
  B = W R = ( w 1 , w 2 , , w n ) ( r 11 r 12 r 1 m r 21 r 22 r 2 m r n 1 r n 1 r nm ) = ( B 1 , B 2 , , B n )  

2.4.3. Determination of Membership Degree Stands.

The membership degree rij in fuzzy relation matrix R can be calculated by comparing the actual value of the evaluation factor with the classification index of the corresponding factor (Table 4). To eliminate the jump phenomenon caused by a slight difference between levels, the membership function must be established in a fuzzy method, allowing all grades to transit smoothly [43]. v2 is for the middle interval, and the membership degree of the interval midpoint is 1. The membership degree of the edge points on both sides is 0.5, and the value decrements linearly from the midpoint to both sides. For v1 and v3, the further away from the critical value, the greater the membership degree for both sides. The membership degree of the critical value on both edges is 0.5. According to the above assumptions, the formula for the membership function of each evaluation level can be constructed. The critical value of both v1 and v2 is k1, the critical value of both v2 and v3 is k3, and the value of v2 is k2, where k2 = (k1 + k3)/2.
For positive indicators u2, u3, u4, u7, u8, and u10, the equations of each membership function ( μ v j ) are denoted as follows:
  μ v 1 = { 0.5 ( 1 + k 1 u i k 2 u i )                   u i k 1   0.5 ( 1 u i     k 1 k 2   k 1 )       u i u i < k 1     0                                                                       u i   K 2  
  μ v 2 = { 0.5 ( 1 k 1 u i k 2 u i )                           u i   k 1 0.5 ( 1 + u i k 1 k 2 k 1 )               k 2 u i < k 1 0.5 ( 1 + k 3 u i k 3 k 2 )             k 3 u i < k 2 0.5 ( 1 k 3 u i k 3 u i )                         u i   k 3  
          μ v 3 = { 0.5 ( 1 + k 3 u i k 2 u i i )                   u i   k 3   0.5 ( 1 u i k 3 k 2 k 3 )               k 2 u i < k 3 0                                                                   u i   k 2    
where μ v 1 , μ v 2 , and μ v 3 are the membership degrees of index value in each scheme to v1, v2, and v3, respectively. And u i is the value of the i factor in each scheme.
When calculating u1, u5, u6, u11 and u12, it is necessary to change “≥” into “≤” and “<” into “>” in Equations (7)–(9).
Through the above formulas, we can calculate the membership degree of each evaluation factor corresponding to each level, ri1 = μv1, ri2 = μv2, ri3 = μv3, that is, the fuzzy relation matrix R is obtained.

2.4.4. Calculate the Evaluation Index of Each Subsystem

Comprehensive judgment matrix B = W·R, where b j = i   =   1 n w i r i j , (j = 1, 2, …, m), assignment of 3 levels in the review set (v1, v2, v3) is wj = {0.95, 0.5, 0.05}. According to the weighted average principle, the evaluation index of 4 subsystems ( u * ) is calculated as follows:
  u * = j = 1 3   μ v j w j j = 1 3   μ v j  
where V j stands for the different evaluation levels and w j   stands for the value of each level.

2.4.5. Calculate the Comprehensive Evaluation Index

The comprehensive evaluation index L of the WRCC is calculated by the weighted average principle according to Equation (10), and this index is a comprehensive evaluation of the subsystem evaluation index obtained in the previous step. Index L is a comprehensive indicator used to measure the WRCC. The higher the evaluation index, the better the WRCC, and the grading standard is given in Table 5.

3. Results and Discussion

According to the simulation results of water resource allocation, the values of 12 factors for all schemes during different years are calculated (Table 6), the weight coefficients of each index are calculated using Equations (1)–(4), and the weight vectors are W = (0.1443, 0.0705, 0.0711, 0.0998, 0.0561, 0.0827, 0.0783, 0.1352, 0.1046, 0.0516, 0.0402, and 0.0657). The fuzzy relation matrix R is calculated from Table 5 and Equations (7)–(9), and the WRCC evaluation result is obtained using Equations (6) and (10).
Based on Figure 5, compared with the current year level, the evaluation indexes of each subsystem in the 12 schemes show different degrees of improvement, and the rationality of water resource allocation is further explained.
The social subsystem has the highest evaluation indexes, all of which are greater than 0.7, indicating that the coordination degree of the water resources and social subsystem is good. However, an increasing trend is not apparent, this is attributable to the population density increase of 8.7%, and further advancement of the urbanization process in the planning level years, which leads to great pressure on water resource support. Even if water resources are properly dispatched, the water resource situations in arid and semi-arid areas cannot be completely changed, and the scale of social progress under limited water resources will also be restricted. Therefore, transformation of residential life patterns and reinforcement of water-saving awareness are profoundly significant.
In the economic subsystem, the evaluation index showed the largest increase, from 0.3902 to 0.6384, which was from an unbearable to bearable state. This increase indicates that it is helpful to improve the coordination of water resources and economic subsystems by adjusting the industrial structure, increasing the tertiary industry share, and improving the level of water-saving irrigation practices. The rising trend seen in the water resource subsystem indexes is primarily due to the completion of the Huangzang Temple Water Control Project and enhancement of water resource management capabilities in the Heihe River Basin.
In the water resource subsystem, the evaluation index has gradually increased, and the index of scheme 7 reaches a maximum of 0.4092. This shows that the water resources required for social and economic development are guaranteed and the region still has the potential for development and utilization. The evaluation indexes of water subsystems have declined at the long-term planning level, which is mainly because of the increase in water resource consumption resulting from rapid economic and social development.
In the ecological system, the current year evaluation index is 0.3043, which is a relatively low level. This is mainly because the midstream region was dominated by the agricultural economy, where more farmland led to ecological water occupation. The gradual increase in the evaluation indexes of the ecological subsystem occurred during the planning level year, which shows that the industrial structure adjustment, returning farmland to forest, and construction of forest and grass cover are meaningful for sound ecological environmental development in the Heihe River middle reaches.
The comprehensive evaluation results of the 13 schemes are all between 0.4 and 0.6. Additionally, all results are in a bearable state, indicating that the development and utilization of water resources in the middle reaches irrigation area has a certain scale and meets the socioeconomic development requirements. However, under current conditions, the evaluation index of scheme 1 is 0.4470, which is in a bearable state but not adequately stable, whereas the downstream water resource is required to maintain the ecological environment. Therefore, the reasonable allocation of water resources is particularly important. At the planning level, the comprehensive WRCC evaluation index is increasing, and the upward trend of the comprehensive index is similar to the rising tendencies of the water resources and economic subsystems. This shows that the main constraining factors affecting the WRCC are the water resources and economic systems.
In the recent planning year, the comprehensive WRCC indexes of Schemes 2–7 show few differences, which is due to various measures of socioeconomic development and ecological environmental protection being comprehensively considered in all schemes. Schemes 2–4 and 5–7 show upward trends, indicating that with an increase in water-saving irrigation and economic levels, the WRCC has continuously improved. Simultaneously, comparing the comprehensive indexes of Scheme 2 and Scheme 5, with the decrease of irrigated area, the comprehensive evaluation value increases, indicating that under the same conditions of water saving and socio-economic development, reducing agricultural water has a positive impact on the WRCC in the middle reaches. The results of comparison Scheme 3 and Scheme 6, Scheme 4 and Scheme 7 are similar. The largest comprehensive index is scheme 7, reaching 0.5561, it shows that the improvement of water resources carrying capacity is most effective in reducing irrigation area, increasing irrigation water saving level and social and economic development level.
In the long-term planning year, the WRCC of Schemes 8–10 and 11–13 present the same pattern as the recent planning schemes. Moreover, the evaluation indexes of the long-term planning schemes are higher than those of the recent planning level except for Schemes 8 and 11, which is likely due to population pressure, lower irrigation levels and water conservation. The comprehensive evaluation index of Scheme 13 is 0.5629; it is the largest in the long-term planning and also among all planning schemes, indicating that when adopting certain ecological environmental remediation measures, a plan with high level of water-saving irrigation, higher economic growth rates and irrigation area control can achieve the most comprehensive WRCC effect. This will also provide a more coordinated and balanced development of society, economy, and ecology.
As seen in Table 7, significantly more comprehensive index schemes are members of v2 than of v3 and v1, which is part of the bearing state. The membership degree of Scheme 1 to v2 is 0.5987, this shows that the utilization of water resources in the middle reaches irrigation area has reached a certain scale and can ensure regional development. Meanwhile, the membership degree of Schemes 2–13 to v2 are greater than 0.6, but the membership degree to v1 is greater than v3. This indicates that the development and utilization of water resources has a considerable scale during the planning level years, but there is still potential. Thus, focus should be placed on the coordinated development of water resource utilization and social, economic, and ecological environments. Simultaneously, the evaluation membership degree for v1 shows an increasing trend, while the membership degree of v3 is the opposite. This indicates that the WRCC is in good condition and the potential for development and utilization remain.

4. Conclusions

In this paper, the WRCC of the Heihe River middle reaches is obtained using the fuzzy comprehensive evaluation method, based on various allocation schemes of water resources in different years. The main conclusions are as follows:
(1)
The evaluation indexes of the four subsystems have different degrees of upward trend. Among them, the evaluation index of the economic subsystem has the largest increase, followed by the water resources subsystem, and the ecological subsystem. The social subsystem has the smallest increase, but it has the highest score in the four subsystems.
(2)
The evaluation index of the 12 water resource allocation plans in planning level years have increased compared with the current situation, and all values are above 0.45, this indicates that a reasonable allocation of water resources is of great significance to the improvement of the WRCC, and the development and utilization of water resources in the middle reaches acquires a certain scale and meets the socioeconomic development requirements.
(3)
The comprehensive index of scheme 7 is the largest in the recent planning year at 0.5561, and the index of scheme 13 is the largest in the long-term planning level at 0.5629. This shows that the water-saving irrigation level, socioeconomic development level and irrigated area have a greater impact on WRCC.
(4)
The membership degree of Schemes 2–13 to v2 are greater than 0.6, and the membership degree to v1 shows an increasing trend. This shows that the development and utilization of water resources has a considerable scale during the planning level years, but there is still potential.
Based on the above results, there are several suggestions for improving the WRCC in the middle reaches of the Heihe River:
(1)
In pursuit of economic development, attention should be paid to the ecological environment in the middle reaches. The construction of a water-saving society should continue to be comprehensively promoted, more available water resources should be provided for the ecosystem, the coverage of forest and grass should be increased.
(2)
While attaching importance to social and economic development, increasing the investment in agricultural irrigation facilities, changing the extensive irrigation model, improving the utilization rate of agricultural water, and restricting agricultural irrigation area are conducive to ensuring the sustainable development of water resources.
(3)
In view of the developed agricultural economic advantages of Zhangye City, considering the development of light industry with agricultural products as raw materials, constantly adjusting the industrial structure, and strictly limiting the development of high-water-consuming industries and serious polluting industries to achieve sustainable use of water resources.

Author Contributions

Conceptualization, R.J., X.J.; Investigation, X.S., C.W.; Writing-Original Draft Preparation, R.J.; Writing-Review & Editing, R.J., X.S.; Supervision and Project Administration, X.J. All authors have read and approved the final manuscript.

Funding

This research received no external funding.

Acknowledgments

This research was supported by the National Natural Science Fund Major Research Plan (91325201), the National Natural Science Fund (51779209), and the National key research and development plan (2017YFC0404303).

Conflicts of Interest

The authors declare no conflict of interest.

References

  1. Ren, C.; Guo, P.; Li, M.; Li, R. An Innovative Method for Water Resources Carrying Capacity Research—Metabolic Theory of Regional Water Resources. J. Environ. Manag. 2015, 167, 139. [Google Scholar] [CrossRef] [PubMed]
  2. Mei, H.; Liu, Y.; Du, H.; Yang, X. Advances in Study on Water Resources Carrying Capacity in China. Procedia Environ. Sci. 2010, 2, 894–903. [Google Scholar] [CrossRef]
  3. Shi, Y.F.; Qu, Y.G. The Water Resources Carrying Capacity and Rational Utilization of Urumqi River Basin; Science Press: Beijing, China, 1992; pp. 94–111. [Google Scholar]
  4. Si, X.Q.; Zhang, Y.; Su, X.L. Comprehensive Evaluation of Water Resources Carrying Capacity Based on Entropy Weight. Water Sci. Eng. Technol. 2013, 2, 1–4. [Google Scholar]
  5. Cheng, G. Evolution of the Concept of Carrying Capacity and the Analysis Framework of Water Resources Carrying Capacity in Northwest of China. J. Glaciol. Geocryol. 2002, 24, 361–367. [Google Scholar]
  6. Song, X.M.; Kong, F.Z.; Zhan, C.S. Assessment of Water Resources Carrying Capacity in Tianjin City of China. Water Resour. Manag. 2011, 25, 857–873. [Google Scholar] [CrossRef]
  7. Liang, F.; Zhang, X.; Liu, J.M. Sustainable Use of Water Resources in the Region and Evaluation Index System. Northwest Univ. Agric. Sci. Technol. 2002, 20, 119–122. [Google Scholar]
  8. Hui, Y.H.; Jiang, X.H.; Huang, Q.; Xue, X.J. On System Dynamic Simulation Model of Water Resources Bearing Capacity in Duality Mode. Geogr. Res. 2001, 20, 191–198. [Google Scholar]
  9. Xia, J.; Zhu, Y.Z. The Measurement of Water Resources Security: A Study and Challenge on Water Resources Carrying Capacity. J. Nat. Resour. 2002, 17, 262–269. [Google Scholar]
  10. Feng, L.H.; Huang, C.F. A Risk Assessment Model of Water Shortage Based on Information Diffusion Technology and Its Application in Analyzing Carrying Capacity of Water Resources. Water Resor. Manag. 2008, 22, 621. [Google Scholar] [CrossRef]
  11. Wang, D. The Influent Factors Study on Water Resources Carrying Capacity in Jiangxi Province with Principal Component Analysis. In Proceedings of the 2007 International Conference on Agriculture Engineering, Baoding, China, 20 October 2007; pp. 101–105. [Google Scholar]
  12. Xu, Y.Y.; Zhao, Q.L. Water Resources Carrying Capacity Based on Principal Component Analysis. In Proceedings of the International Conference on Geo informatics, Kaifeng, China, 20–22 June 2013; pp. 1–5. [Google Scholar]
  13. Fu, X.; Ji, C.M. A Comprehensive Evaluation of the Regional Water Resource Carrying Capacity—Application of Main Component Analysis Method. Resour. Environ. Yangtza Basin 1999, 8, 168–172. [Google Scholar]
  14. Wackernagel, M.; Onisto, L.; Bello, P.; Callejas Linares, A.; Susana López Falfán, I.; Méndez Garcı́a, J.; Isabel Suárez Guerrero, A.; Guadalupe Suárez Guerrero, M. National Natural Capital Accounting with the Ecological Footprint Concept. Ecol. Econ. 1999, 29, 375–390. [Google Scholar] [CrossRef]
  15. Stöglehner, G. Ecological Footprint—A Tool for Assessing Sustainable Energy Supplies. J. Clean. Prod. 2003, 11, 267–277. [Google Scholar] [CrossRef]
  16. Feng, H.; Zhang, X.; Li, G.; Naijun, M.; Jin, C. A System Dynamic Model and Simulation for Water Resources Carrying Capacity in Beijing. J. China Agric. Univ. 2006, 11, 106–110. [Google Scholar]
  17. Fang, G.H.; Hu, Y.G.; Xu, Y.X. Research on the Multi-objective Evaluation Model of Regional Water Resources Carrying Capacity and Its Application. Water Resour. Prot. 2006, 22, 9–13. [Google Scholar]
  18. Liu, S.F.; Chen, J.H. Water Resources Carrying Capacity Based on the Theory of Ann. Resour. Sci. 2007, 29, 99–105. [Google Scholar]
  19. Wang, Y.J.; Yang, G.; Xu, H.L. Evaluation of Water Resources Carrying Capacity Based on Fuzzy Comprehensive Evaluation on River Basin in Arid Zone. Adv. Mater. Res. 2010, 113–116, 488–494. [Google Scholar] [CrossRef]
  20. Gong, L.; Jin, C. Fuzzy Comprehensive Evaluation for Carrying Capacity of Regional Water Resources. Water Resour. Manag. 2009, 23, 2505–2513. [Google Scholar] [CrossRef]
  21. Gao, Y.; Zhang, S.; Xu, G.W.; Su, H.M.; Zhang, Y. Study on Water Resources Carrying Capacity in Hefei City. Adv. Mater. Res. 2013, 610–613, 2701–2704. [Google Scholar] [CrossRef]
  22. Xiong, H.G.; Fu, J.H.; Wang, K.L. Evaluation of Water Resource Carrying Capacity of Qitai Oasis in Xinjiang By Entropy Method. Chin. J. Eco-Agric. 2012, 20, 1382–1387. [Google Scholar] [CrossRef]
  23. Ma, L.; Zhao, J.H.; Hong, M.; Chen, L.L. Application of Set Pair Analysis Model Based on Entropy Weight for Comprehensive Evaluation of Water Resources Carrying Capacity. Appl. Mech Mater. 2012, 195–196, 764–769. [Google Scholar] [CrossRef]
  24. Wang, T.; Xu, S. Dynamic Successive Assessment Method of Water Environment Carrying Capacity and Its Application. Ecol. Indic. 2015, 52, 134–146. [Google Scholar] [CrossRef]
  25. Jing, J.H.; Sun, J.C.; Han, S.P.; Wang, S. Distribution of Groundwater Resources and the State of Development and Utilization in the Northwestern Area. South-To-North Water Transf. Water Sci. Technol. 2007, 5, 54–56. [Google Scholar]
  26. Apollonio, C.; D’Agostino, D.; Giordano, R.; Milella, P.; Portoghese, I.; Vurro, M.; Lamaddalena, N.; Scardigno, A.; Scardigno, A.; Piccinni, A.F. An Innovative Monitoring System for Sustainable Management of Groundwater Resources: Objectives Stakeholder Acceptability and Implementation Strategy. Environ. Energy Struct. Monit. Syst. 2010, 32–37. [Google Scholar] [CrossRef]
  27. Giordano, R.; D’agostino, D.; Apollonio, C.; Lamaddalena, N.; Vurro, M. Bayesian Belief Network to Support Conflict Analysis for Groundwater Protection: The Case of the Apulia Region. J. Environ. Manag. 2013, 115, 136–146. [Google Scholar] [CrossRef] [PubMed]
  28. Dong, W.; Liu, Z.H. Study on Comprehensive Evaluation of Water Resources Carrying Capacity Based on Fahp Principle—A Case Study of Bortala River Basin and Jing-river Basin in Xinjiang. J. Arid. Land Resour. Environ. 2008, 22, 7–10. [Google Scholar]
  29. Qu, G.Y.; Fan, S.Y. Water Resources Capacity and Developing Strategies in Heihe River Basin. J. Desert Res. 2000, 1, 2–9. [Google Scholar]
  30. Ning, B.Y.; He, Y.; He, X.; Li, Z.X. Advances on Water Resources Research in Heihe River Basin. J. Desert Res. 2008, 28, 1180–1185. [Google Scholar]
  31. Wang, Z.; Yang, J.; Deng, X.; Lan, X. Optimal Water Resources Allocation under the Constraint of Land Use in the Heihe River Basin of China. Sustainability 2015, 7, 1558–1575. [Google Scholar] [CrossRef] [Green Version]
  32. Nian, Y.; Zhou, J.; Li, X. Impact of Land Use Change on Water Resource Allocation in the Middle Reaches of the Heihe River Basin in Northwestern China. J. Arid. Land. 2014, 6, 273–286. [Google Scholar] [CrossRef]
  33. Deng, X.; Zhao, C. Identification of Water Scarcity and Providing Solutions for Adapting to Climate Changes in the Heihe River Basin of China. Adv. Meteorol. 2014, 2014, 279173. [Google Scholar] [CrossRef]
  34. Wu, F.; Zhan, J.; Güneralp, İ. Present and Future of Urban Water Balance in the Rapidly Urbanizing Heihe River Basin, Northwest China. Ecol. Model. 2015, 318, 254–264. [Google Scholar] [CrossRef]
  35. SU, Z.Y.; XU, Z.M.; Zhang, Z.; Chen, D.J.; Long, A.H.; Zhang, B. Fundamental Ecological Economics Study on the Carrying Capacity of Water Resources in Heihe River Watershed. J. Glaciol. Geocryol. 2002, 24, 400–406. [Google Scholar]
  36. Sun, T.; Wang, J.; Huang, Q.; Li, Y. Assessment of Water Rights and Irrigation Pricing Reforms in Heihe River Basin in China. Water 2016, 8, 333. [Google Scholar] [CrossRef]
  37. Zhang, Q.; Liu, B.; Zhang, W.; Jin, G.; Li, Z. Assessing the Regional Spatio-temporal Pattern of Water Stress: A Case Study in Zhangye City of China. Phys. Chem. Earth 2015, 1, 2–9. [Google Scholar] [CrossRef]
  38. Li, Z.; Shao, Q.; Xu, Z.; Cai, X. Analysis of Parameter Uncertainty in Semi-distributed Hydrological Models Using Bootstrap Method: A Case Study of Swat Model Applied to Yingluoxia Watershed in Northwest China. J. Hydrol. 2010, 385, 76–83. [Google Scholar] [CrossRef]
  39. Cheng, G.D.; Zhao, W.Z. Green Water and Its Research Progresses. Adv. Earth Sci. 2006, 21, 221–227. [Google Scholar]
  40. Gu, H.M.; Li, J.; Jiang, X.H.; Dong, G.T. Evaluation of Water Resources Bearing Capacity Based on Entropy-weight and Matter-element Assessment Methods in Midstream of Heihe River. J. Irrig. Drain. 2016, 35, 87–92. [Google Scholar]
  41. Zhu, Y.Z.; Xia, J. Measurement and Evaluation of Water Resources Carrying Capacity of Northwest China. Resour. Sci. 2003, 25, 43–48. [Google Scholar]
  42. Xu, Z.M.; Cheng, G.D. A Study on the Water Resources Carrying Capacity by Using the Method of Multiobjective Optimization Model—Taking the Heihe River as an Example. J. Lanzhou Univ. 2000, 36, 122–132. [Google Scholar]
  43. Meng, L.H.; Chen, Y.N.; Li, W.H.; Zhao, R. Fuzzy Comprehensive Evaluation Model for Water Resources Carrying Capacity in Tarim River Basin, Xinjiang, China. Chin. Geogr. Sci. 2009, 19, 89–95. [Google Scholar] [CrossRef]
Figure 1. Map of the study area location.
Water 10 01203 g001
Figure 2. Framework of the water resource allocation model.
Water 10 01203 g002
Figure 3. Framework of the water resource system in the Heihe River Basin.
Water 10 01203 g003
Figure 4. Flow fitting figure in the mainstream of Zhengyixia section.
Water 10 01203 g004
Figure 5. Evaluation indexes of various schemes.
Water 10 01203 g005
Table 1. Corresponding relationships between computational units and districts.
Position of BasinDistrictsCompute UnitsControl Sections
upper Yingluoxia
middleGanzhouDaman, Shangsan, Xijun, YingkeGaoya
LinzePingchuan, Banqiao, Liaoquan, Yanuan, Shahe, LiyuanhePingchuan
GaotaiYoulian, Liuba, LuochengZhengyixia
lowerJintaDingxinShaomaying
DongfengchangDongfeng ReservoirLangxinshan
Ejina QiUpper and Middle of West River, Jianguoying, Zhongge Oasis, Upper of East River, Tiekuli Ecology, Dongdahe, East Juyanhai, Angcihe Ecology, BanbuerheAngcihe River turn-out Gate, Estuary of East Juyanhai
Table 2. Verification table of the groundwater equilibrium in the irrigation area; unit: 104 m3.
Irrigation AreaShangsanYingkeDamanXijunShaheLiyuanheYanuanBanqiaoLiaoquanPingchuanLiubaYoulianLuocheng
Replenishment
Reservoir infiltration00510575625341033512365353
Canal infiltration455774115556842611725202214939791982242581373071569
Field infiltration41314811146136923513792664023334113172068329
Precipitation infiltration282948902101116468423624822411365339116
Lateral supplies17510,94934642086319013,54424,18512,08614,0037988557311,6884009
River replenishment18617,597629410,891000000000
Drainage
Potential evaporation00060654359313668275975618771981
Lateral outflow518527,35710,92716,7833542693225,77916,40014,6603803223712,7382617
Spring outflow000000290275347719210719
Mining of groundwater0706456934819812674532709471048177510,1061050
Lateral inflow00000015,519937599692541223773942617
Leakage to watercourse2018956781173000000000
Total supplies561438,38617,41323,782481920,86526,86216,74916,64610,972678021,7686377
Total outflow520536,31717,29822,781435420,22026,72816,41316,55011,087668924,7216367
Initial water level1473144614681435141914111395139213681380133713501297
Final water level1475145014681436142014121396139213691380133713471297
Water storage variation5142147−21480432812382272008026945−1808278
Absolute equilibrium differential−106−77329197136−594−9313615−38446−1145−268
Relative equilibrium differential (%)1.880.201.890.832.822.840.350.810.093.500.675.264.20
Table 3. The scheme set for water resource allocation in the Heihe River Basin.
Planning Level YearSchemeWater SupplyWater Demand
ABCDEFG
A1A2B1B2C1C2D1D2E1E2E3F1F2F3
Current1 StatusStatusStatus
Recent2
3
4
5
6
7
Long-term8
9
10
11
12
13
Notes: A, B and C represent different water source projects. A stands for Plain Reservoir, where A1 and A2 represent use and discard, respectively; B stands for the upstream Huangzang Temple Water Control Project that will be completed in 2020, where B1 and B2, respectively represent uncompleted and commissioned; C stands for the Ying-Hong Cascade Reservoir in the middle reaches, where the operating modes are C1 (short-term), C2 (long-term); D represents the irrigated areas, D1 is the area of cultivated land restored to the level of 2000 and D2 is the area required for the Recent Management Plan of the Heihe River Basin; E and F represent the level of water-saving irrigation and socioeconomic development, respectively, which are divided into three levels: low, medium, and high. Scheme 1 indicates the status of the current year, so D, E, and F are all expressed by Status. G represents the level of ecological water demand in 2008. ★ represents different water source projects, irrigation areas, irrigation water saving levels, and socio-economic development levels for each scheme.
Table 4. The evaluation system and grading standard of water resource carrying capacity (WRCC).
Target LevelGuideline Layer IndexGrading Standards
v1v2v3
Comprehensive evaluation index system of water resourceWater subsystemu1Per capita water resources (m3/PER)>40004000~1700<1700
u2Water supply module (104 m3/km2)<55~15>15
u3Groundwater multi-year average degree of exploitation<0.50.5~1.2>1.2
Economic subsystemu4Crop irrigation quota (m3/mu **)<200200~500>500
u5Irrigation water use factor>0.650.65~0.5<0.5
u6Tertiary industry as a share of GDP (%)>6060~30<30
u710,000 yuan industrial output value of water demand (104 m3)<5050~100>100
Social subsystemu8Population density (104 PER/km2)<100100~150>150
u9Level of urbanization (%)>7070~20<20
u10Domestic water quota (L/PER·day)<100100~150>150
Ecosystem subsystemu11Ecological water demand rate (%)>4040~20<20
u12Forest and grass coverage (%)>6060~15<15
Scores0.950.500.05
Note: ** 1 km2 = 1500 mu.
Table 5. Evaluation index grading standard for the WRCC.
LStateDescription of State Meaning
[0~0.4]UnbearableContradiction between the water supply and demand is outstanding, and the water supply cannot meet production and life needs.
[0.4~0.6]BearableContradiction between the supply and demand of water resources is eased, and regional water-saving measures are relatively complete. Water resources can meet the needs of production and living.
[0.6~1.0]Ideal bearingWater resources become the dominant resource for regional development, which is coordinated with the ecology, economy and society.
Table 6. Statistics of the evaluation factors based on the water resource allocation scheme set.
FactorAllocation Scheme Set
12345678910111213
u11892.641852.311852.311852.311852.311852.311852.311743.241743.241743.241743.241743.241743.24
u211.6810.729.859.2710.079.278.7310.309.499.439.708.968.93
u31.521.181.000.981.071.000.931.040.981.000.990.960.99
u4416.18416.18376.18346.18416.18376.18346.18376.18333.52313.52376.18333.52313.52
u50.530.580.610.630.580.610.630.610.660.680.610.660.68
u637.7143.9643.8544.5643.9643.8544.5639.2340.7540.7139.2340.7540.71
u786583930583930352318352318
u869717171717171757575757575
u939424242424242484848484848
u1081888888888888929292929292
u1121.3527.3428.3828.8027.5928.6629.1029.5630.7629.6629.9031.1129.96
u1222.8327.2227.2227.2231.4931.4931.4927.2227.2227.2231.4931.4931.49
Table 7. Comprehensive evaluation of WRCC in the middle reaches of Heihe River.
Schemev1v2v3α
10.14180.59870.25950.4470
20.16670.66970.16360.5014
30.20350.67050.12600.5349
40.22180.66570.11250.5491
50.16670.69180.14150.5114
60.20760.67330.11910.5398
70.22560.67350.10090.5561
80.20580.65110.14300.5283
90.23880.64050.12070.5531
100.25230.62380.12400.5577
110.20800.66270.12930.5354
120.24260.64570.11170.5589
130.25580.62810.11610.5629

