Predicting Lake Eutrophication Responses to Multiple Scenarios of Lake Restoration: A Three-Dimensional Modeling Approach


Abstract
1. Introduction
2. Methods
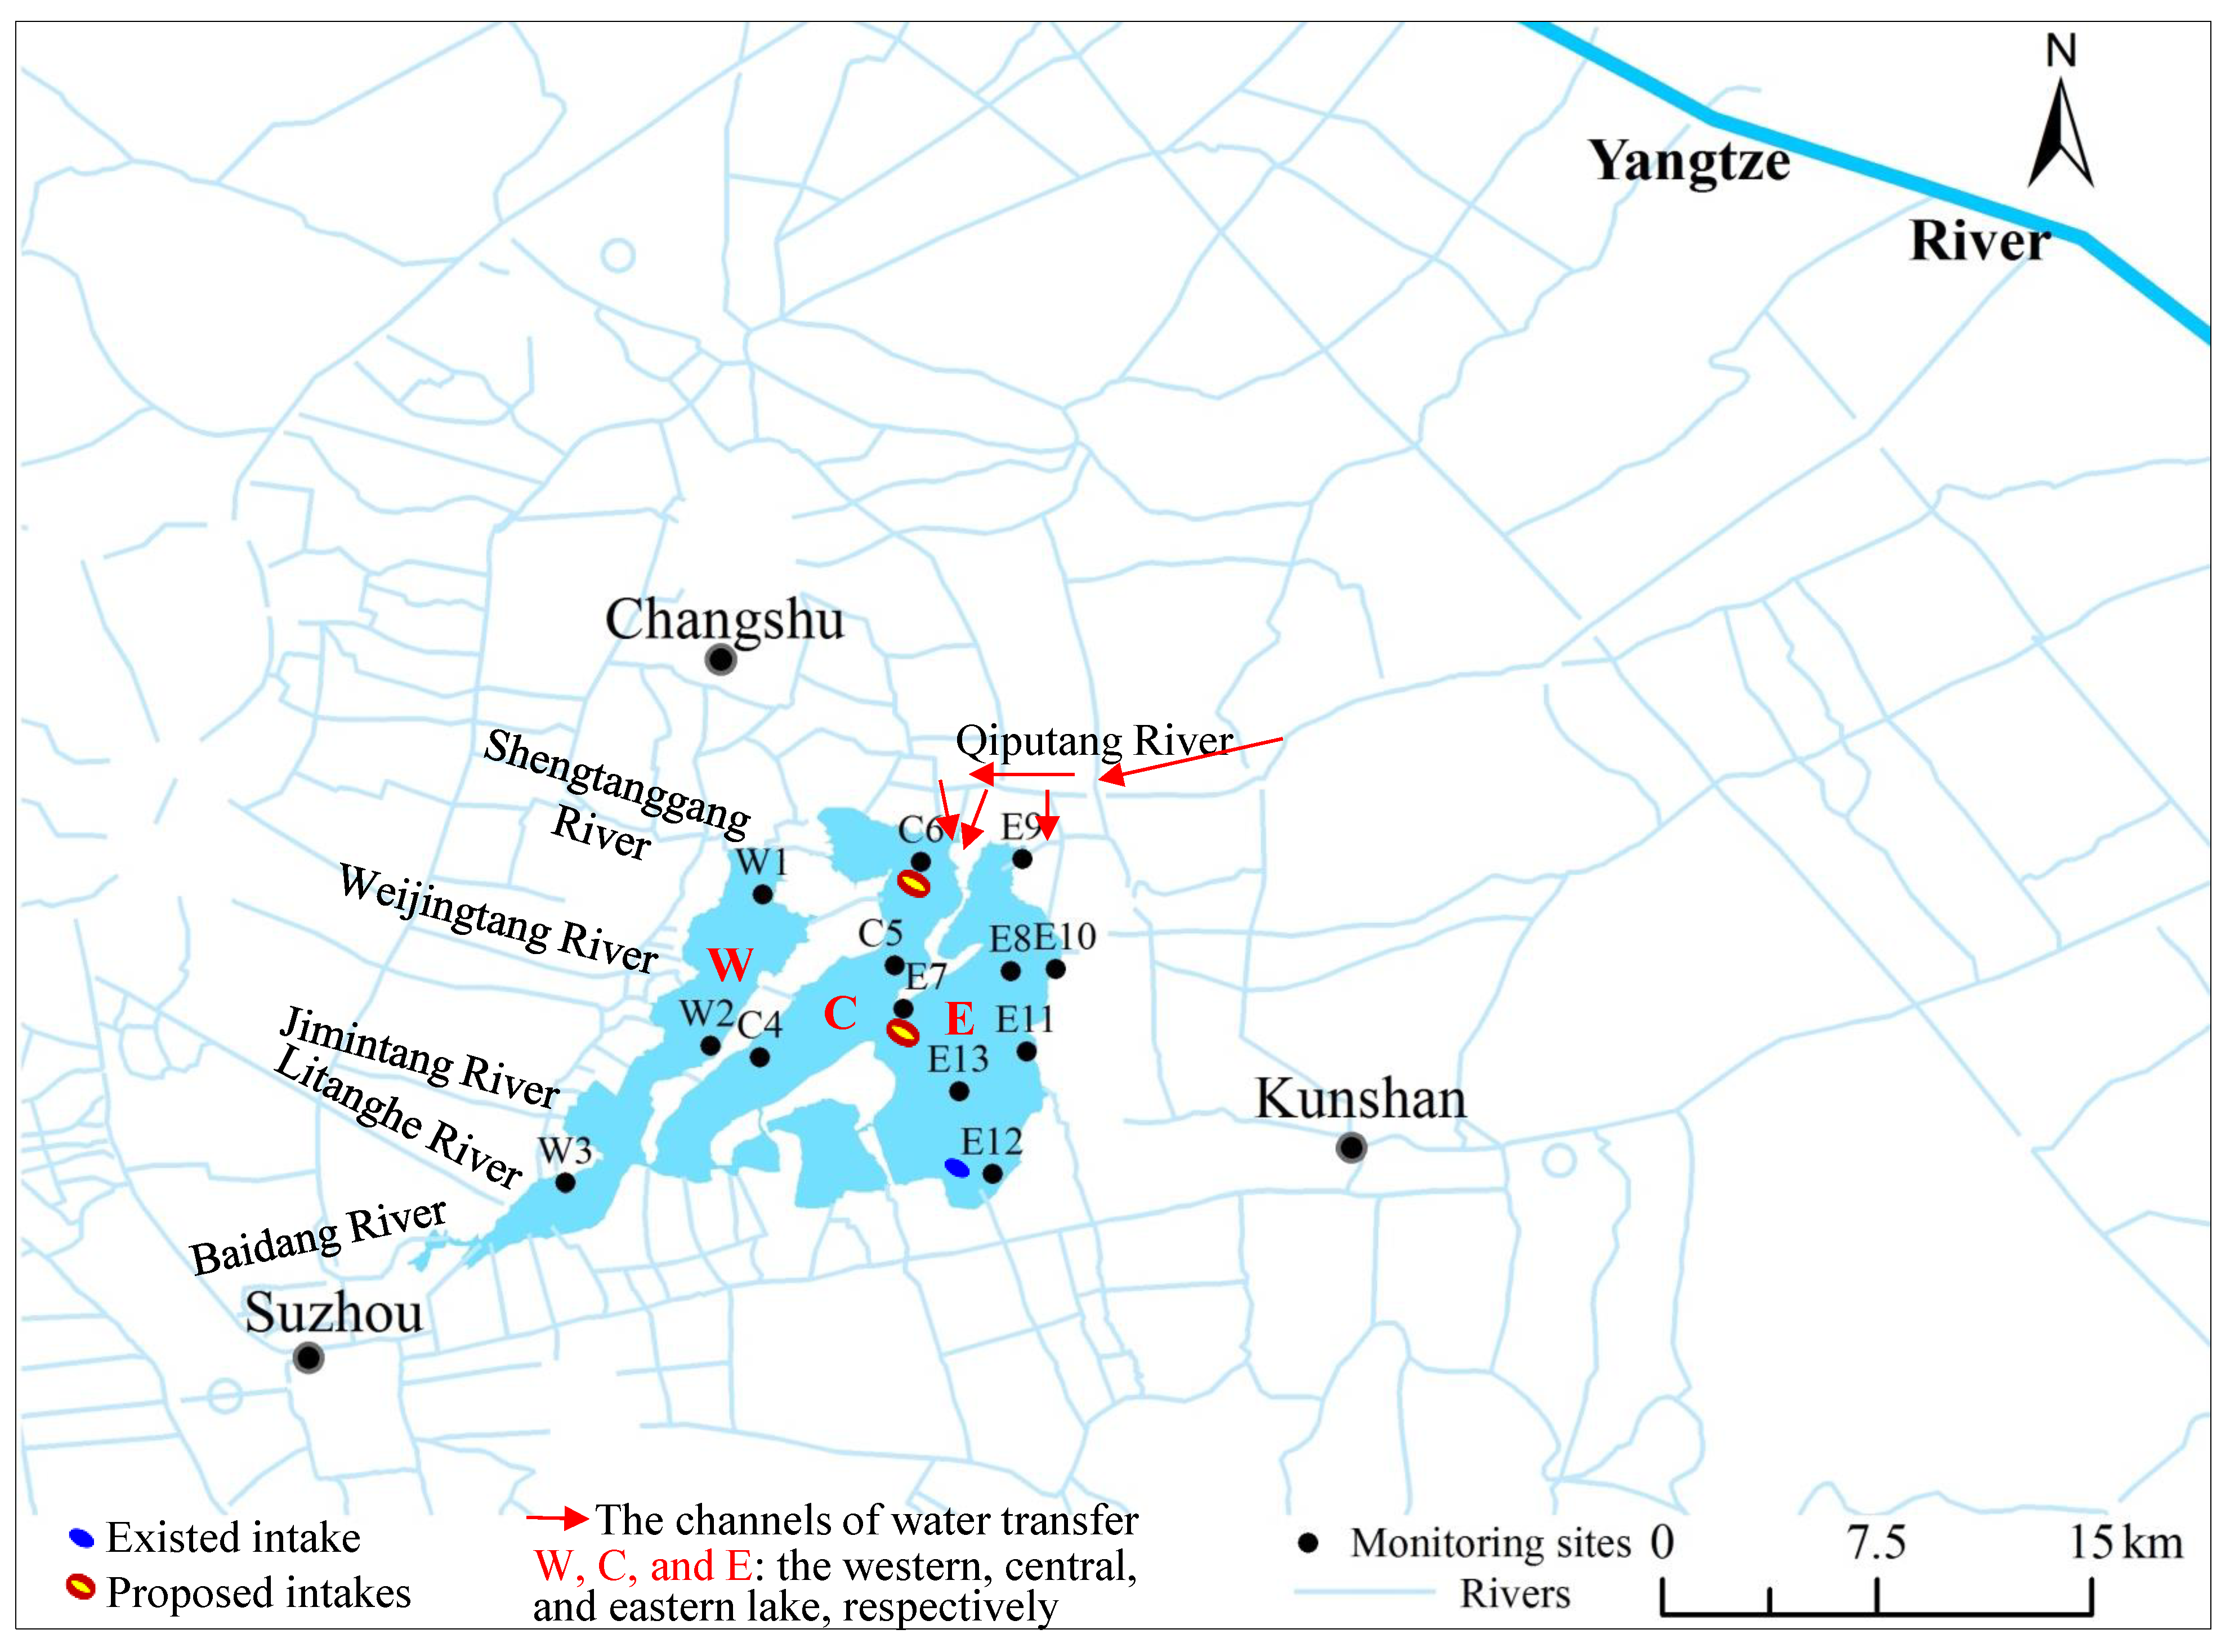
2.1. Study Area
2.2. Water Sample and Meteorological Data Collection
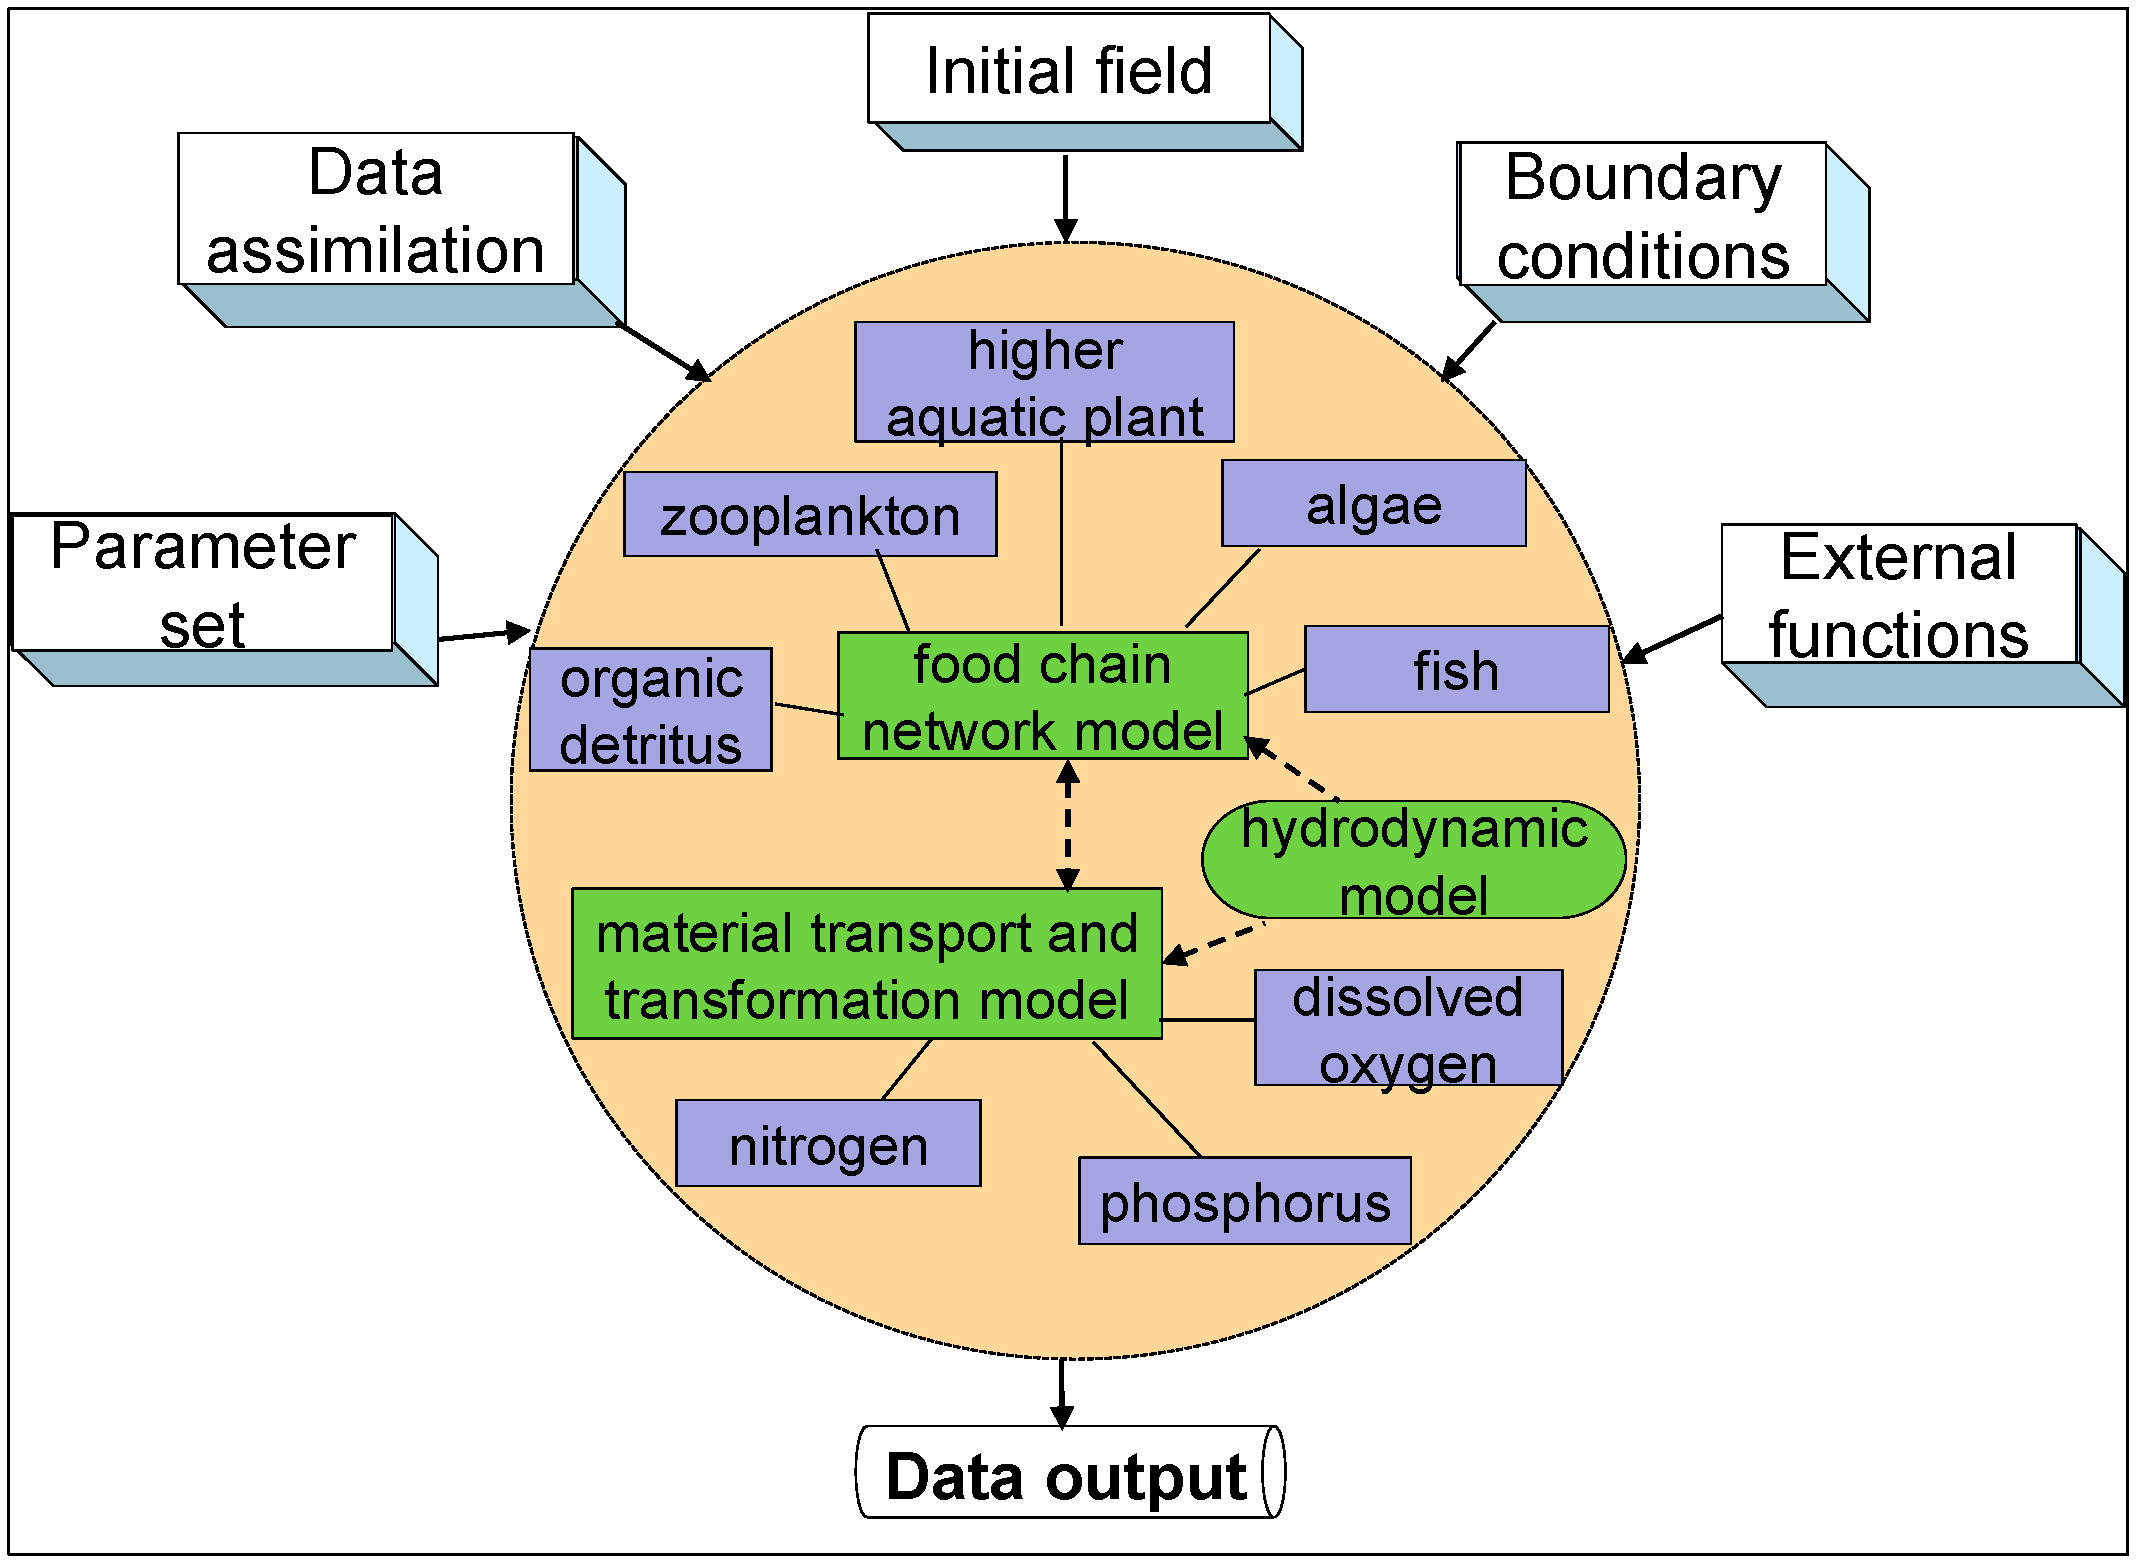
2.3. Model Description
2.4. Scenarios Design
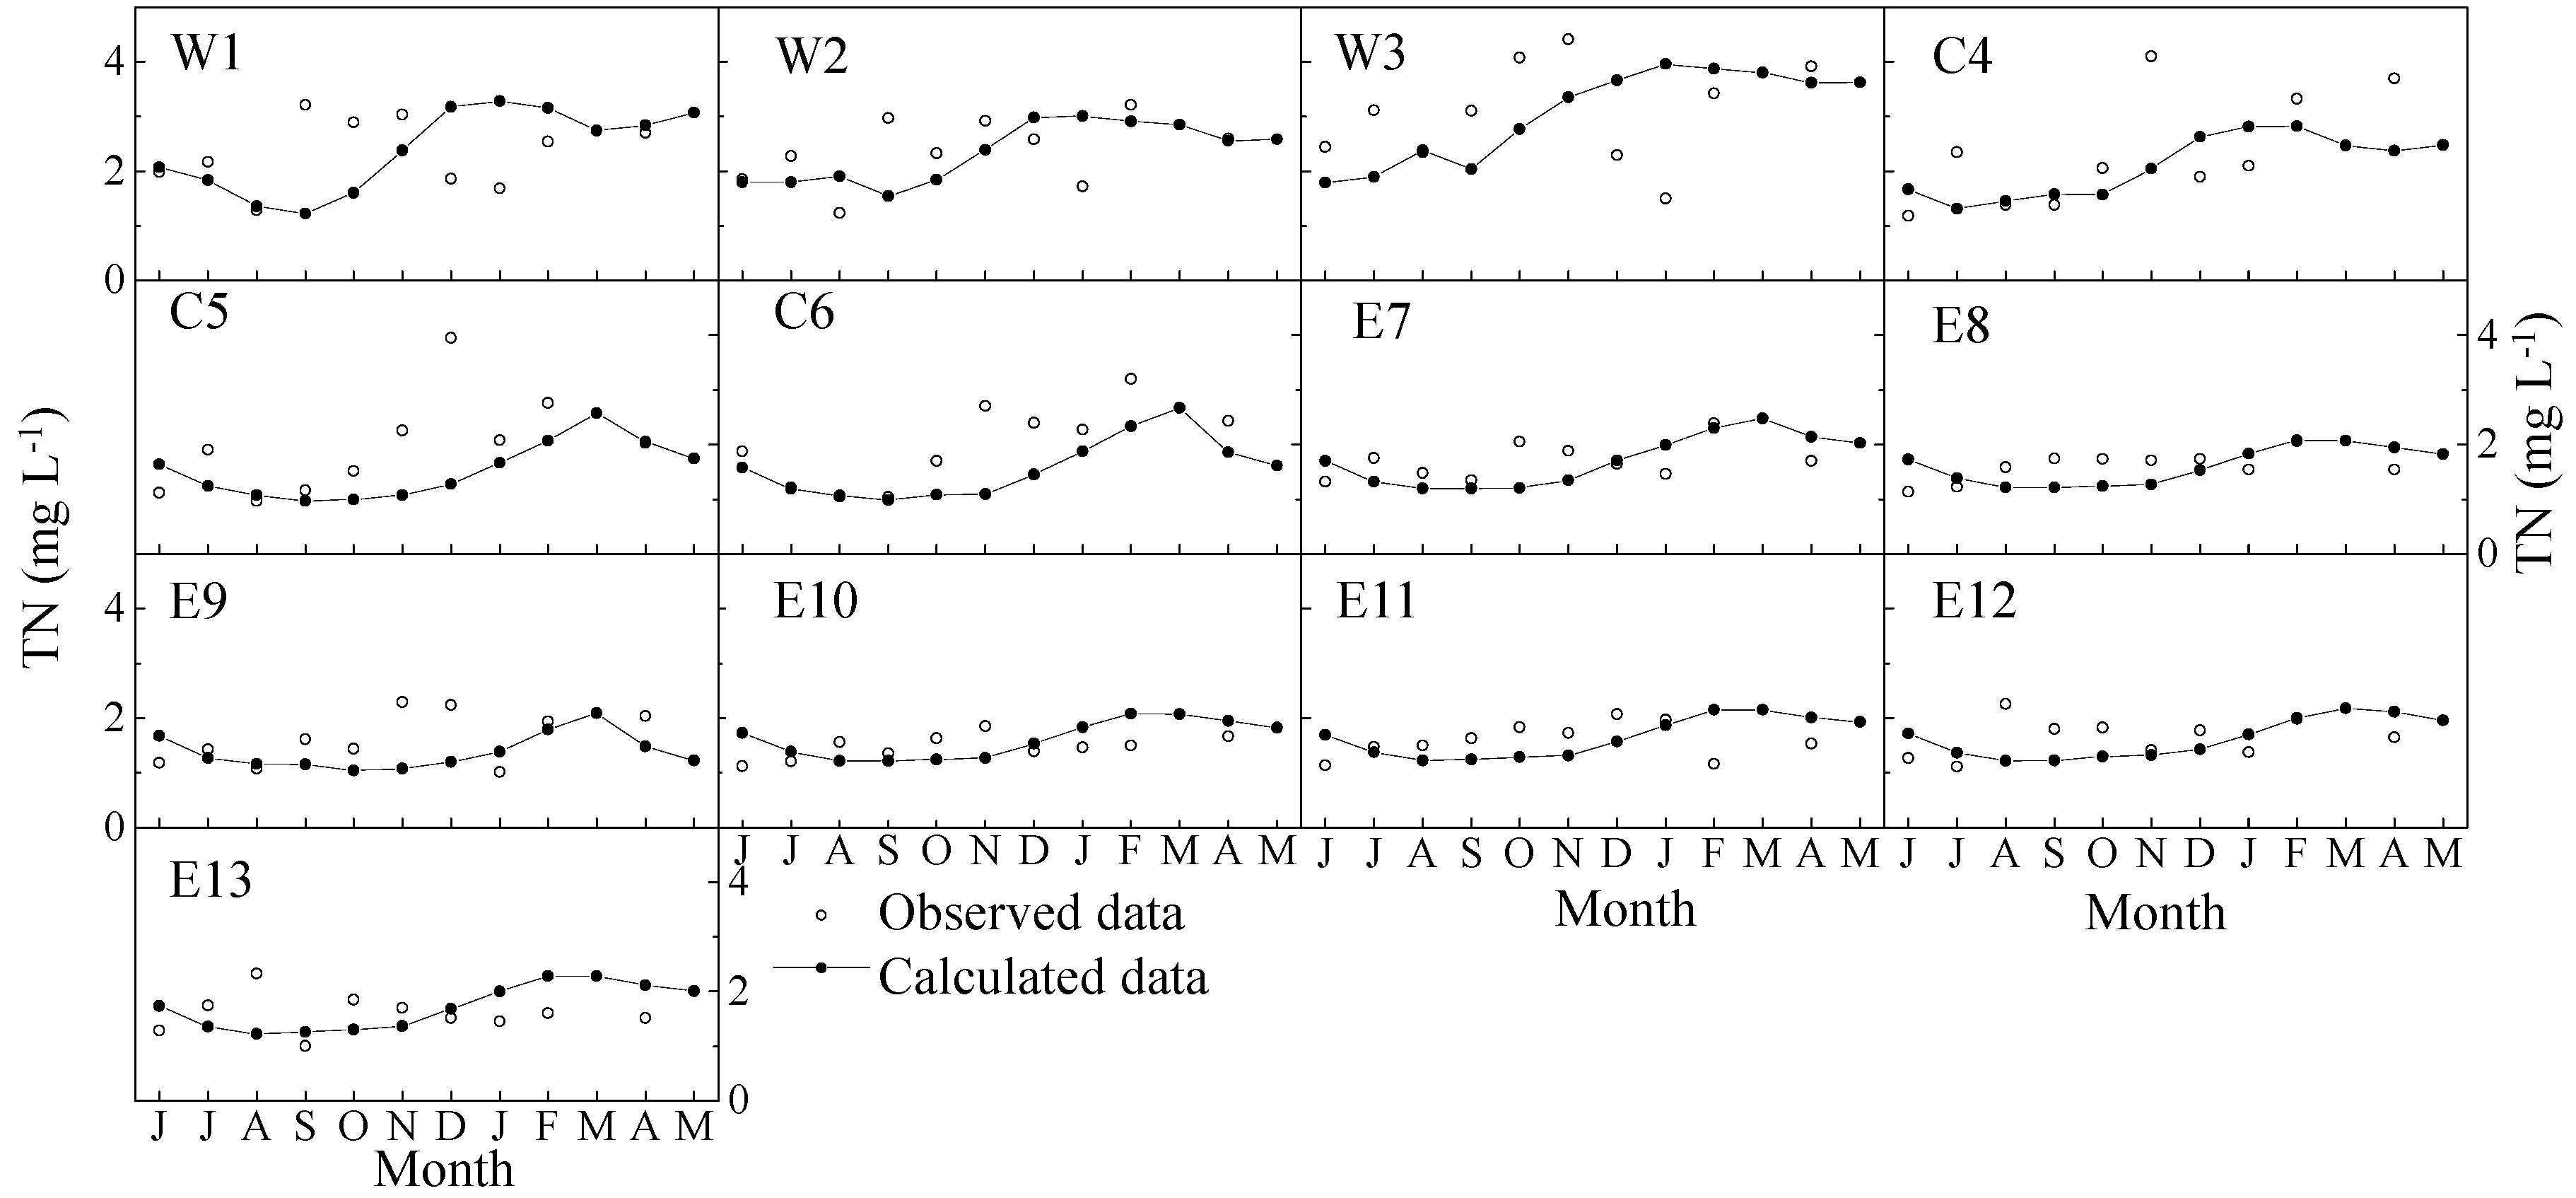
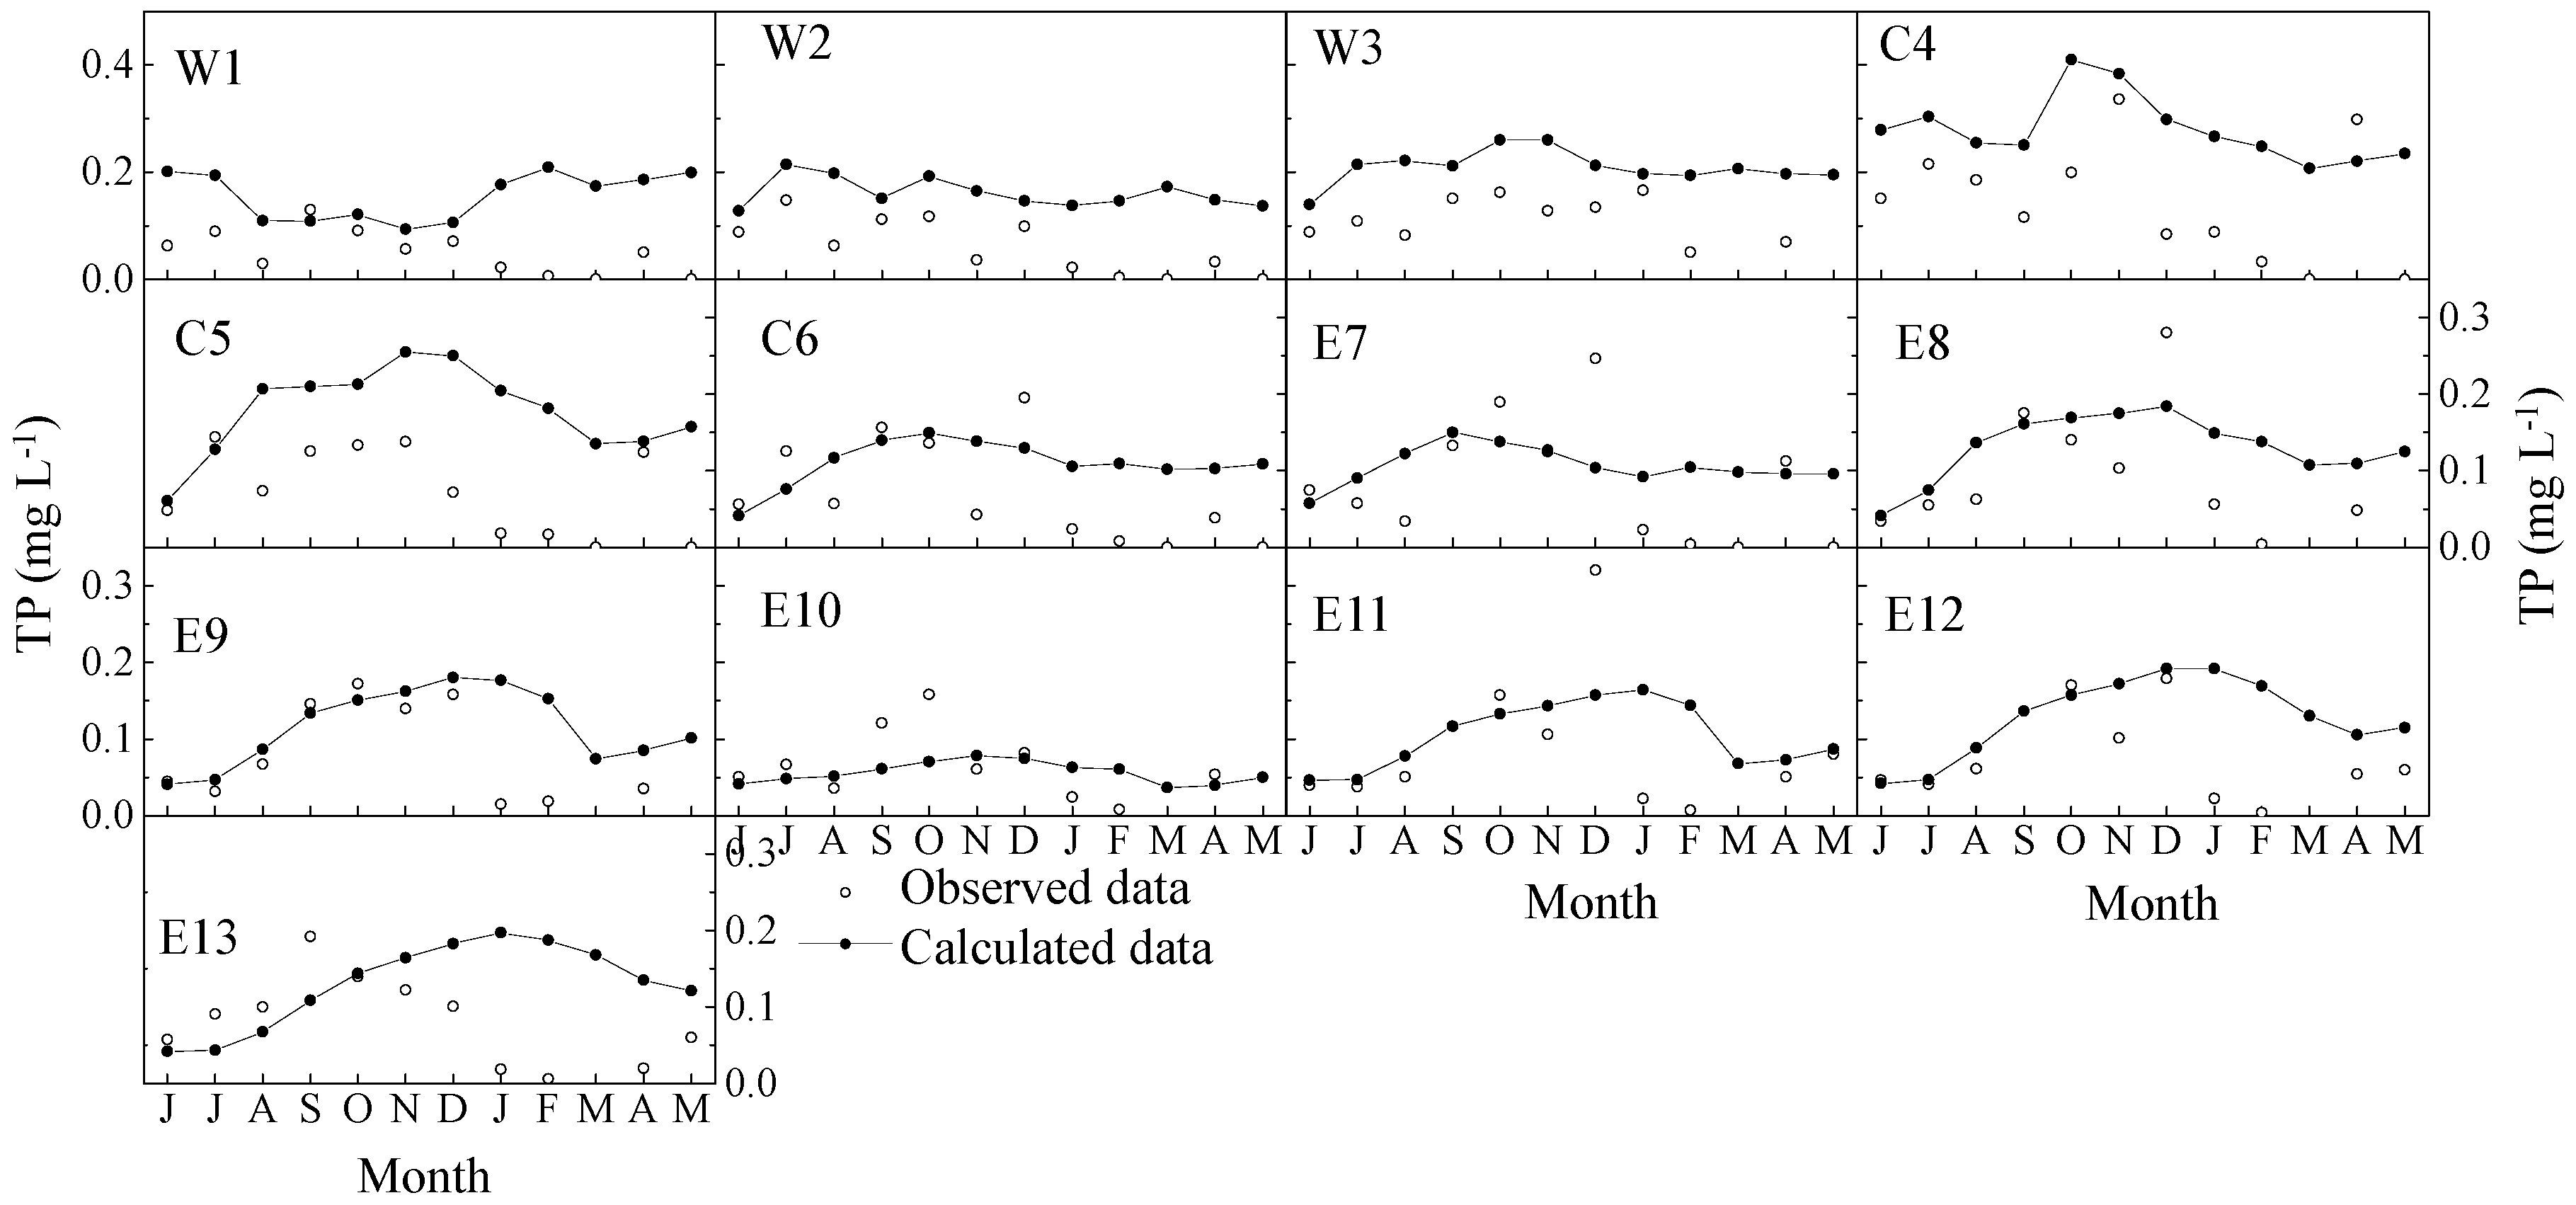
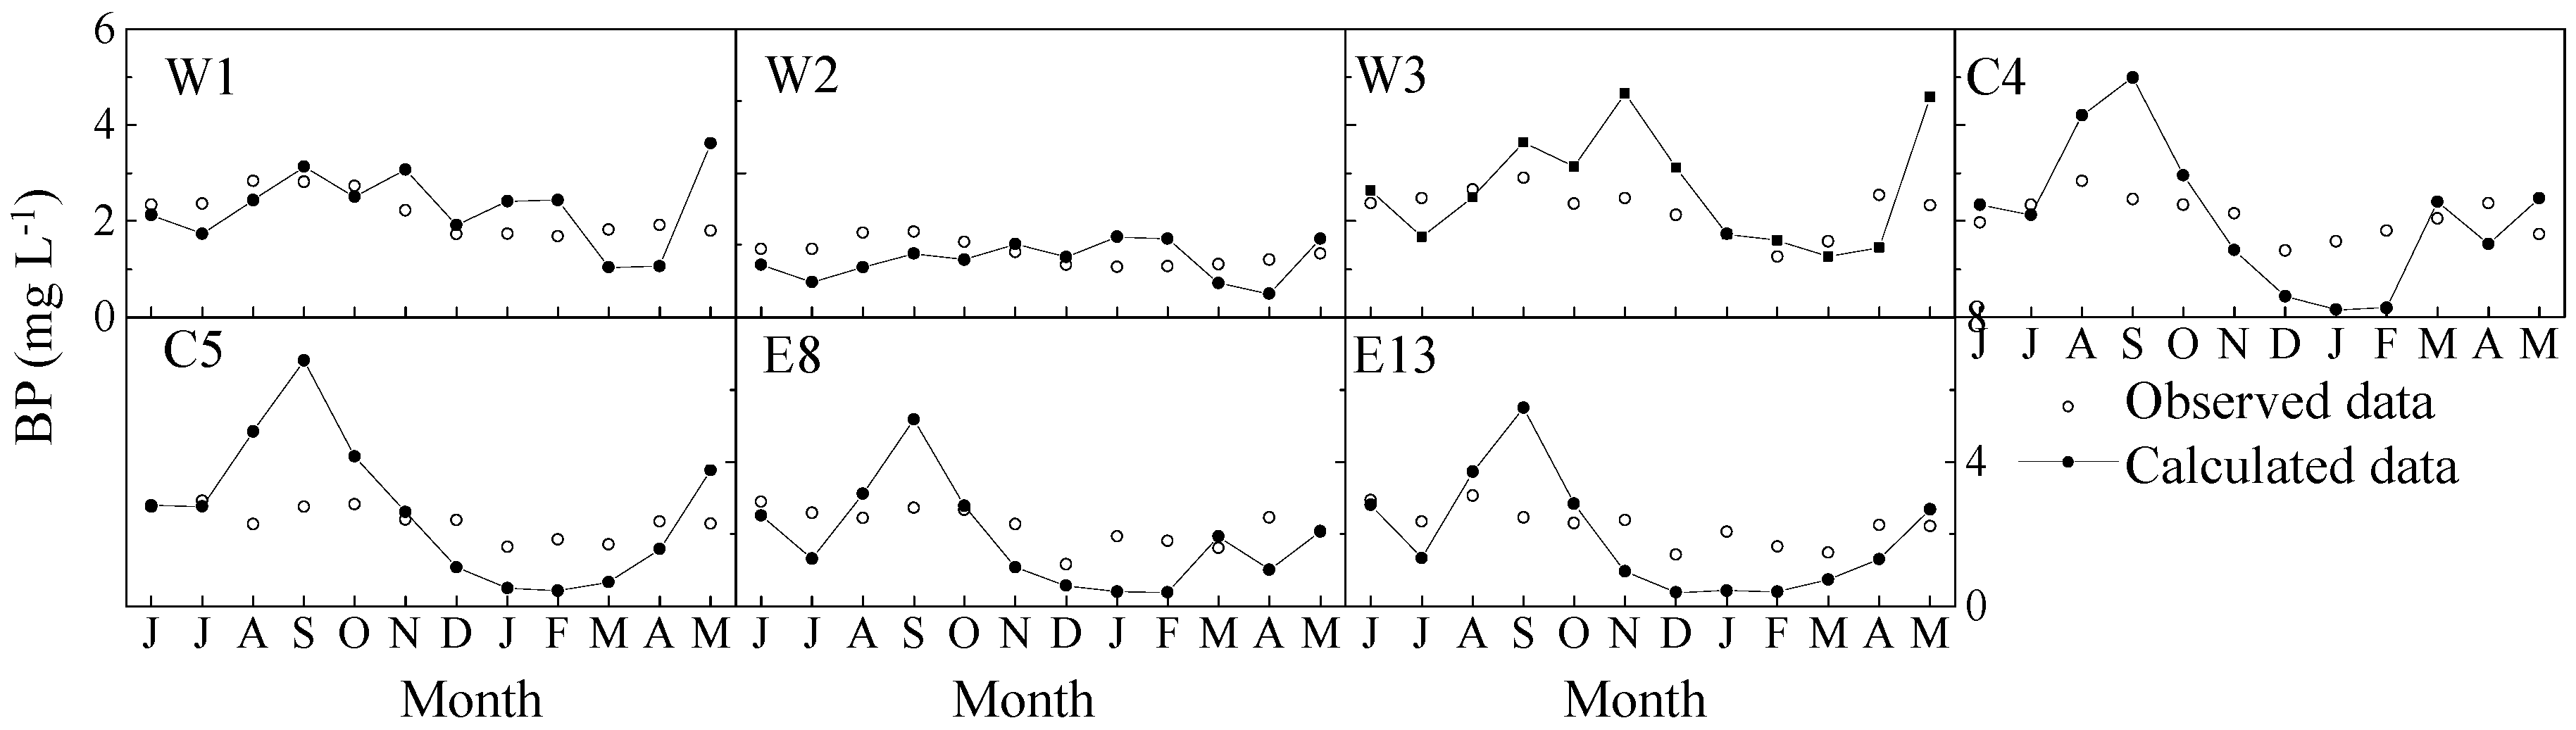
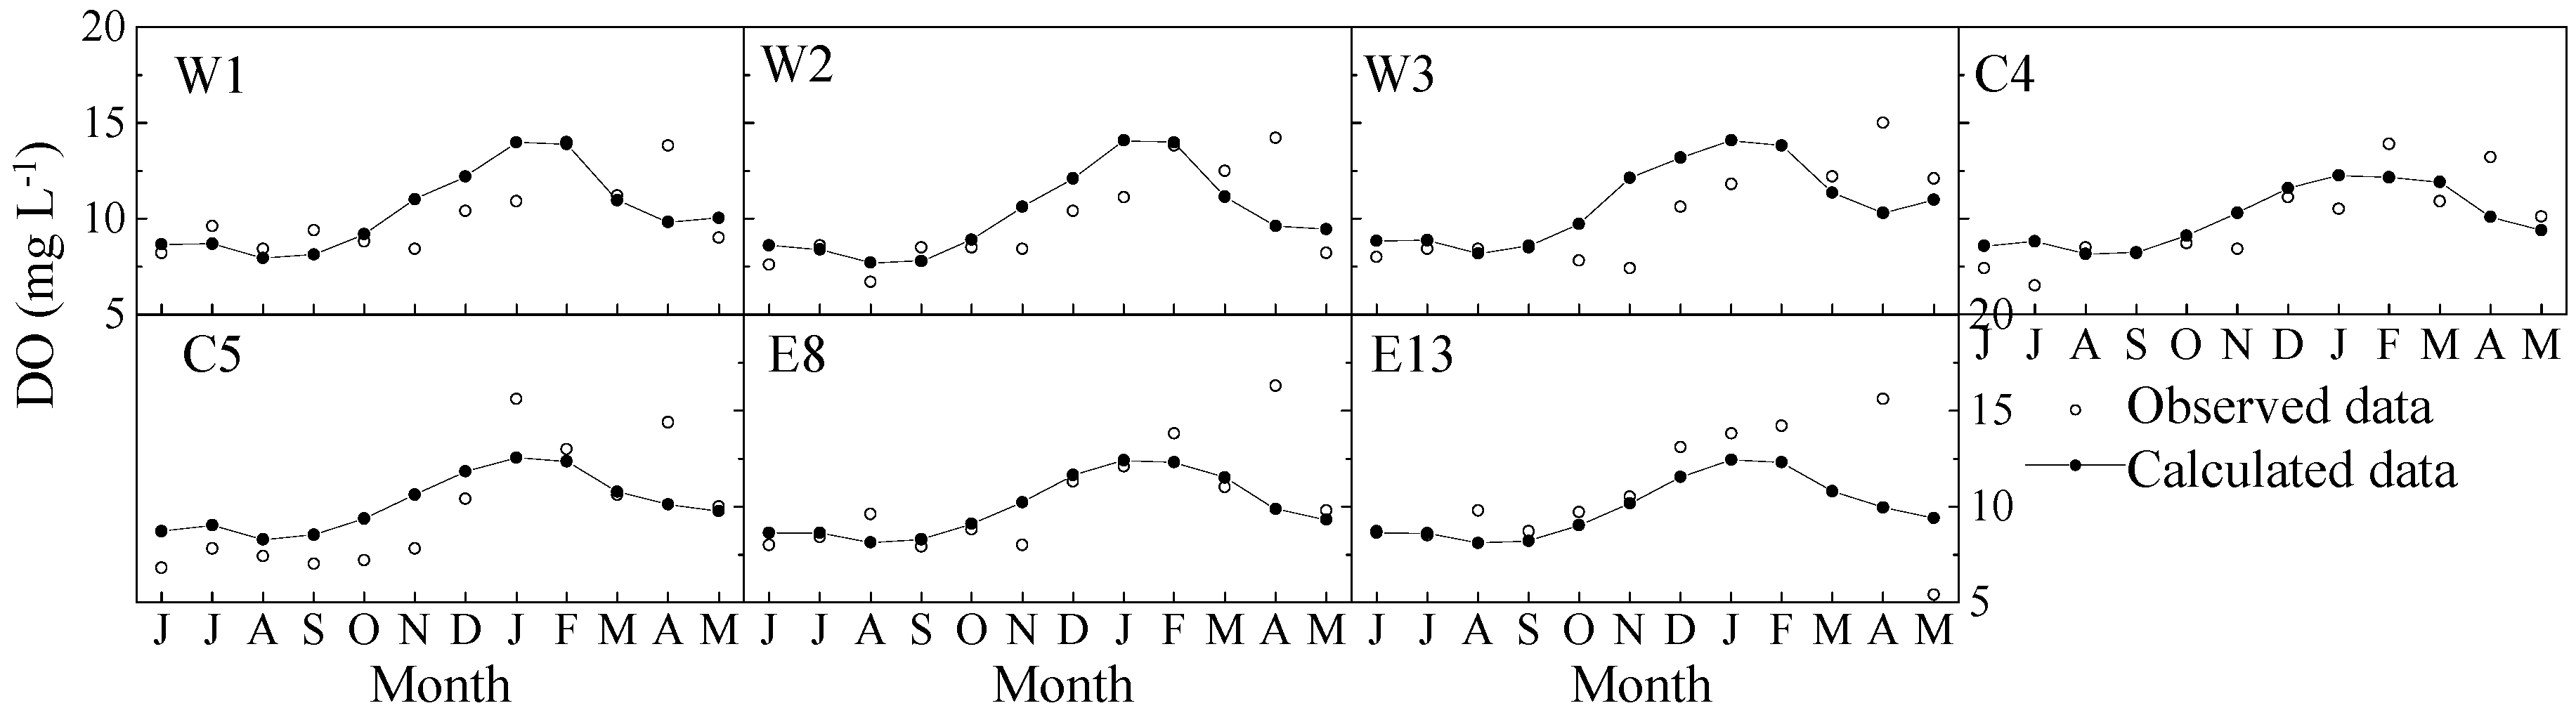
3. Model Calibration
4. Results and Discussion
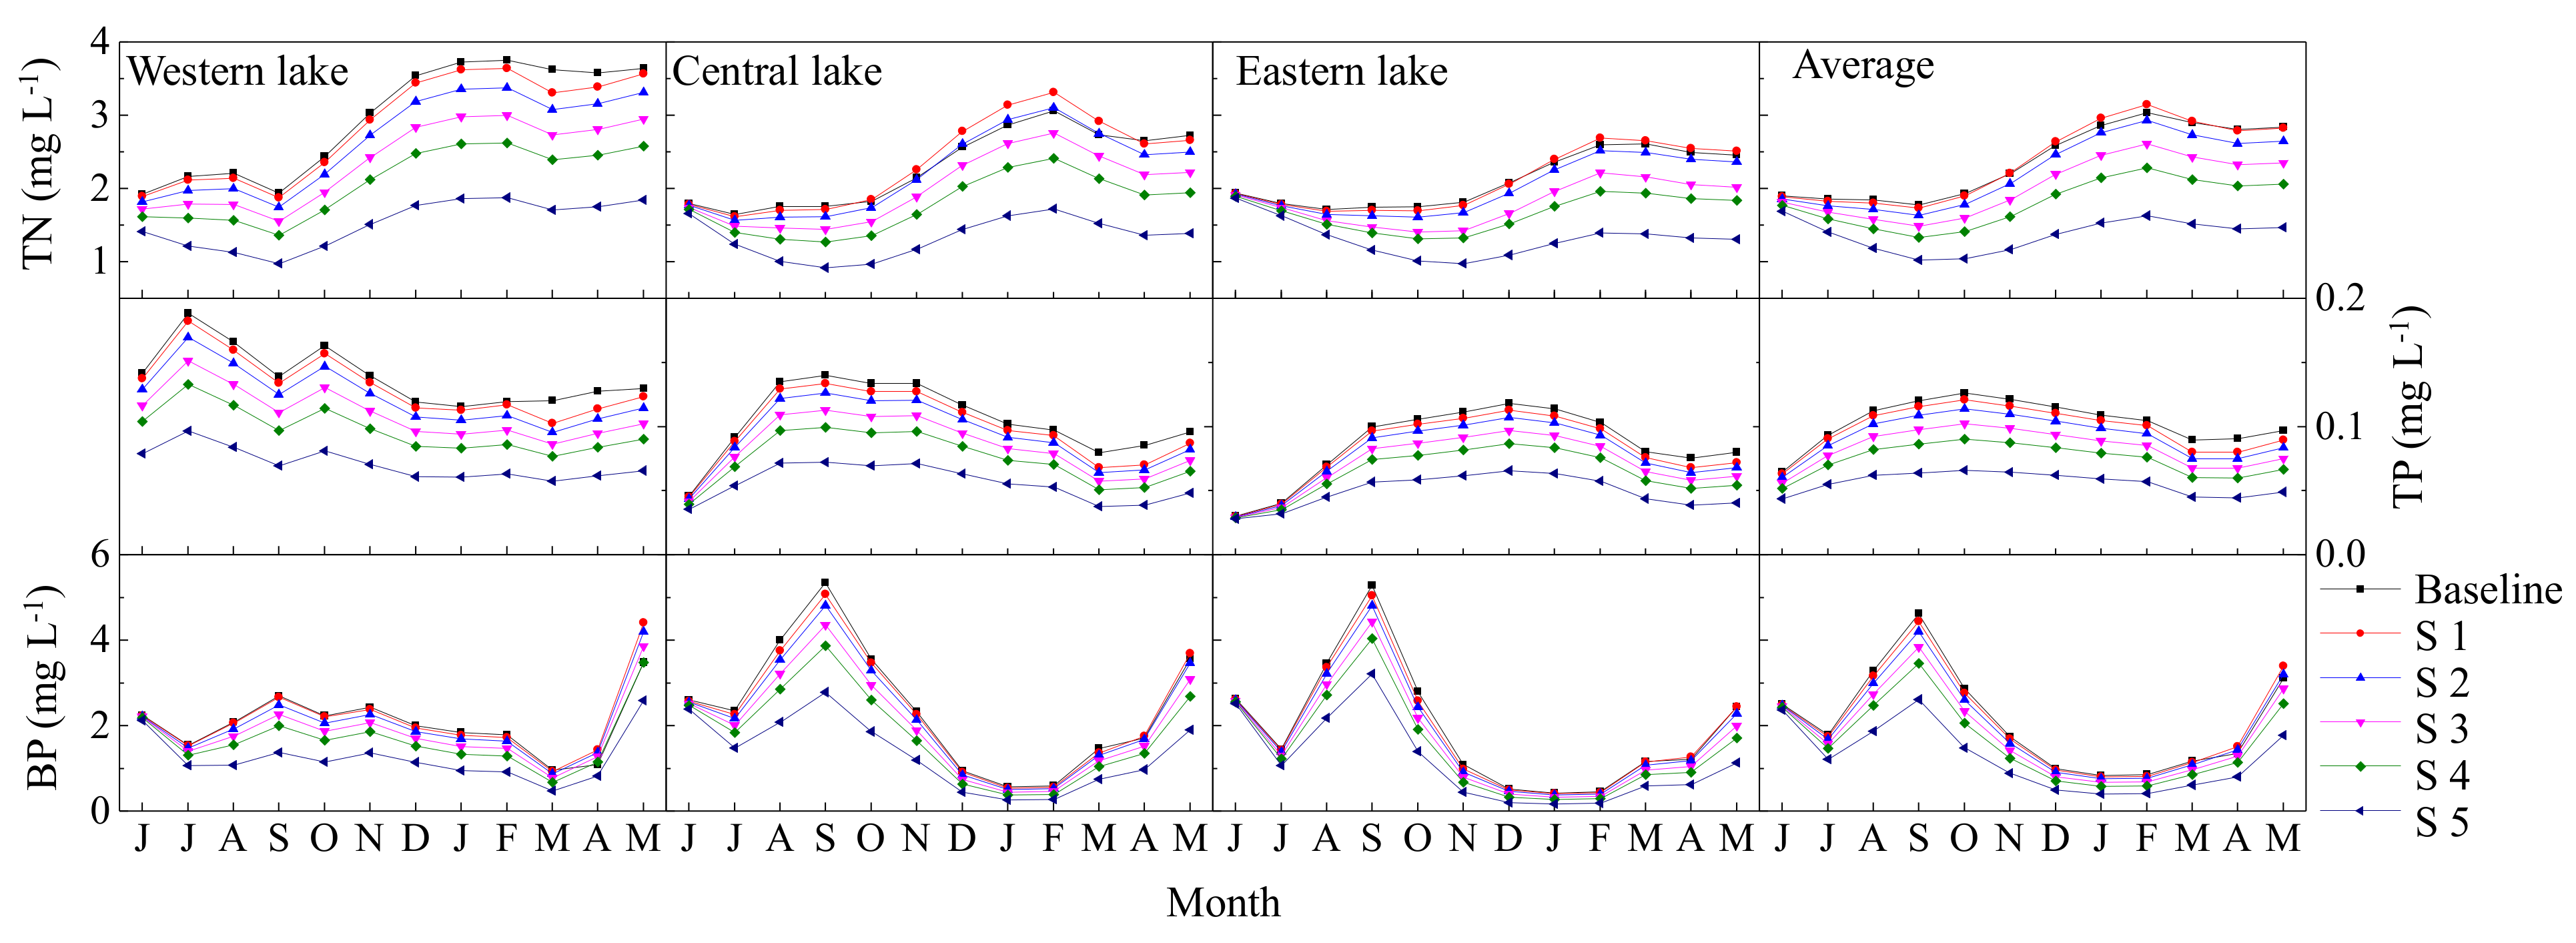
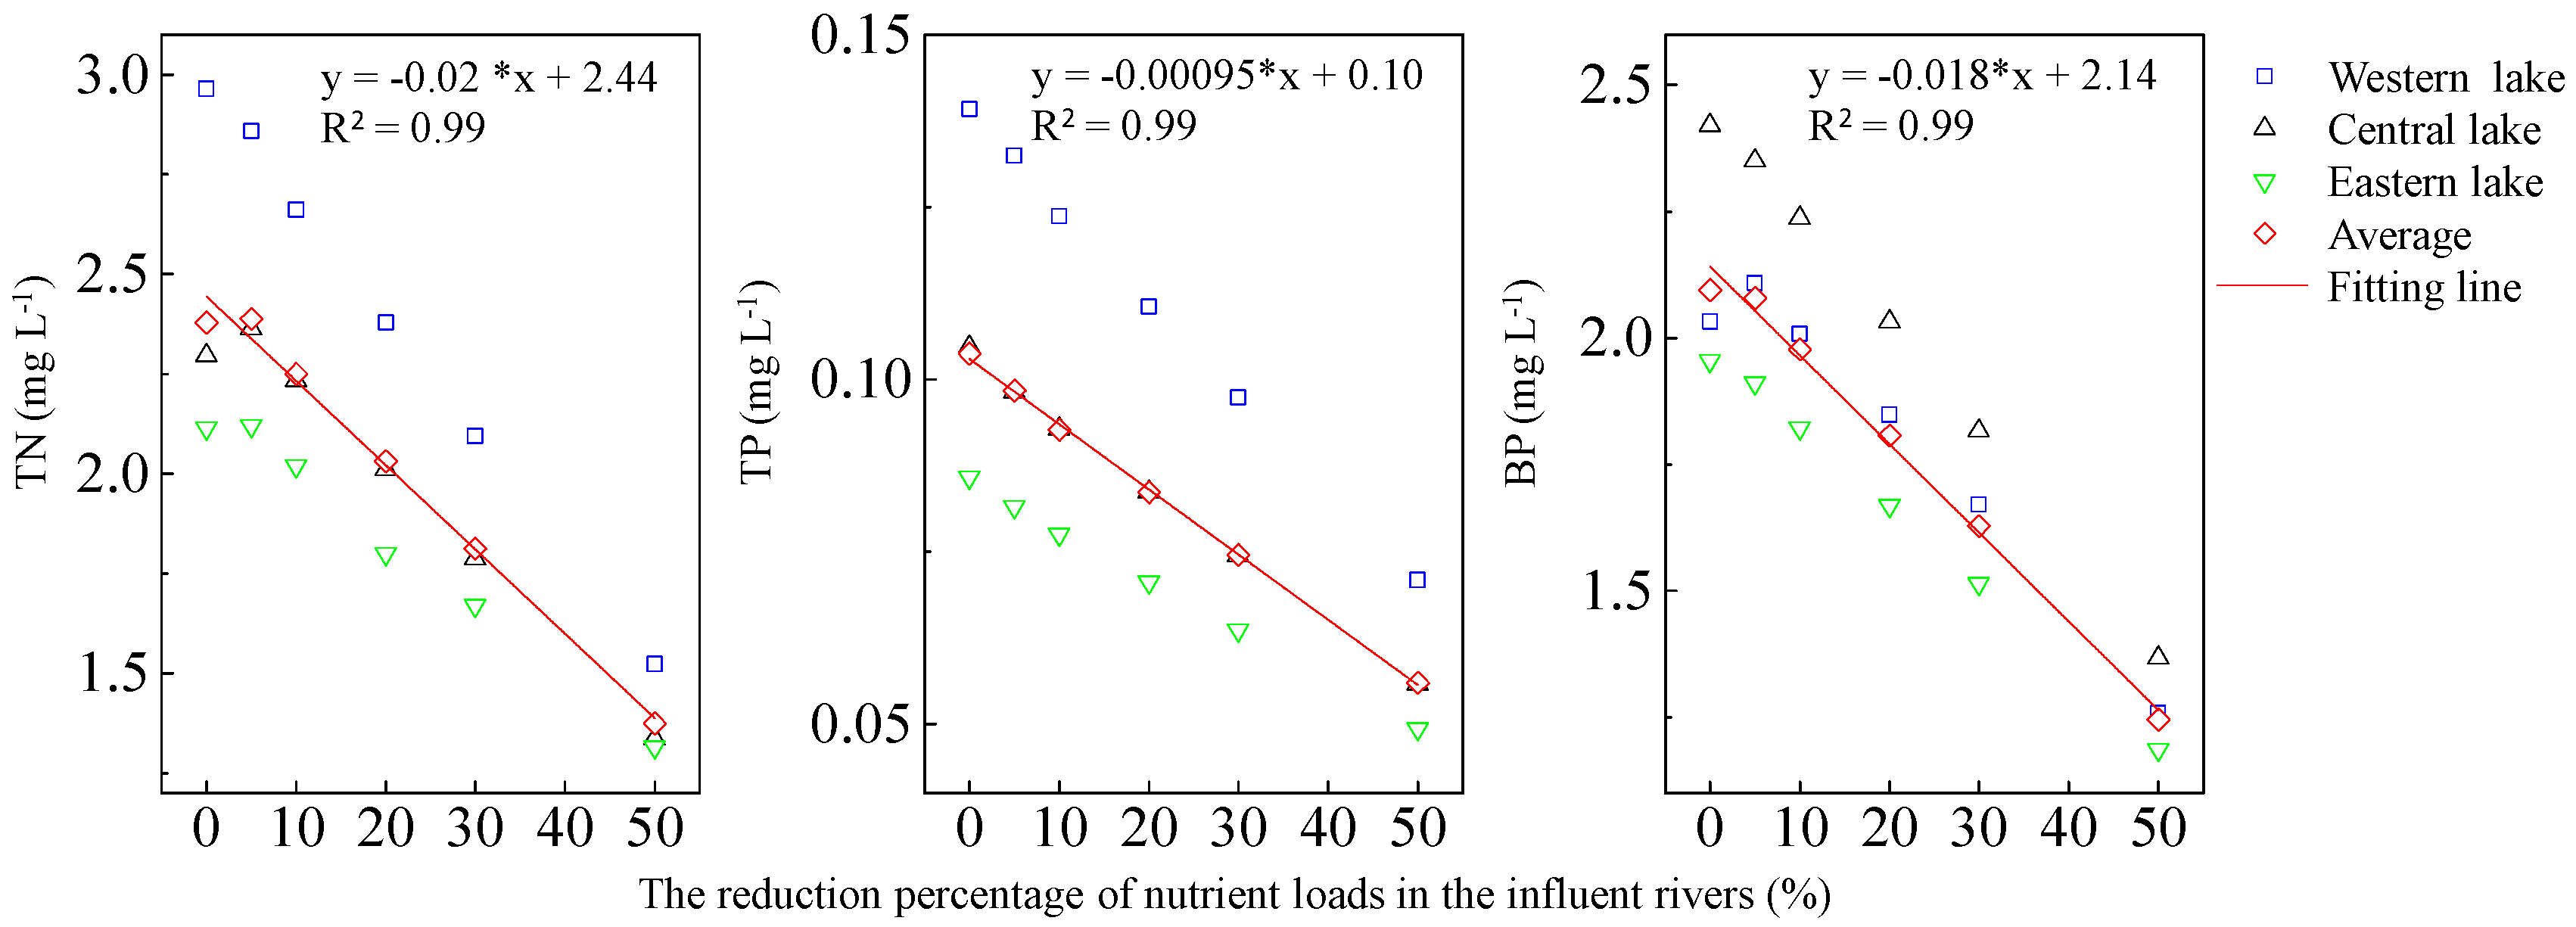
4.1. Loading Reduction
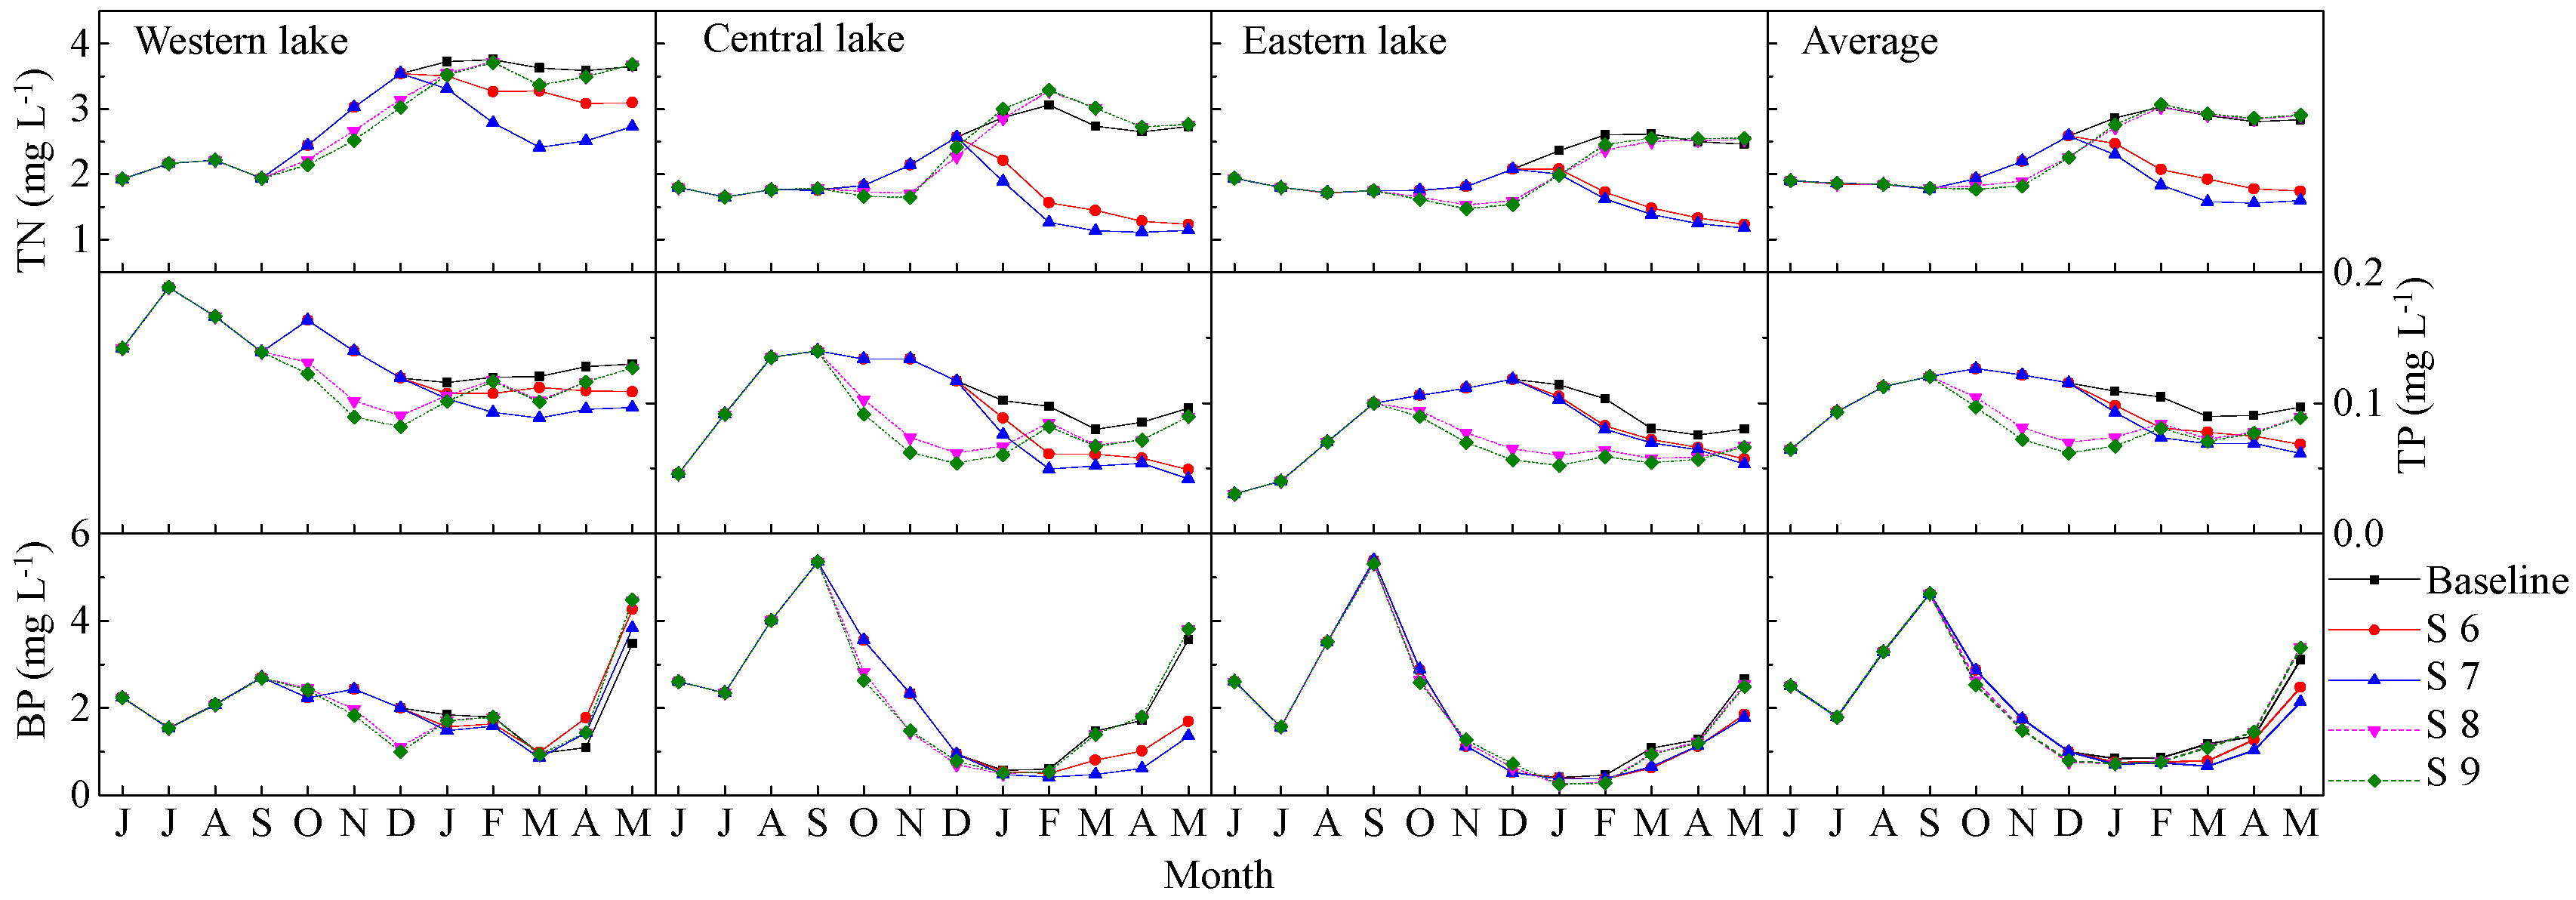
4.2. Water Transfer
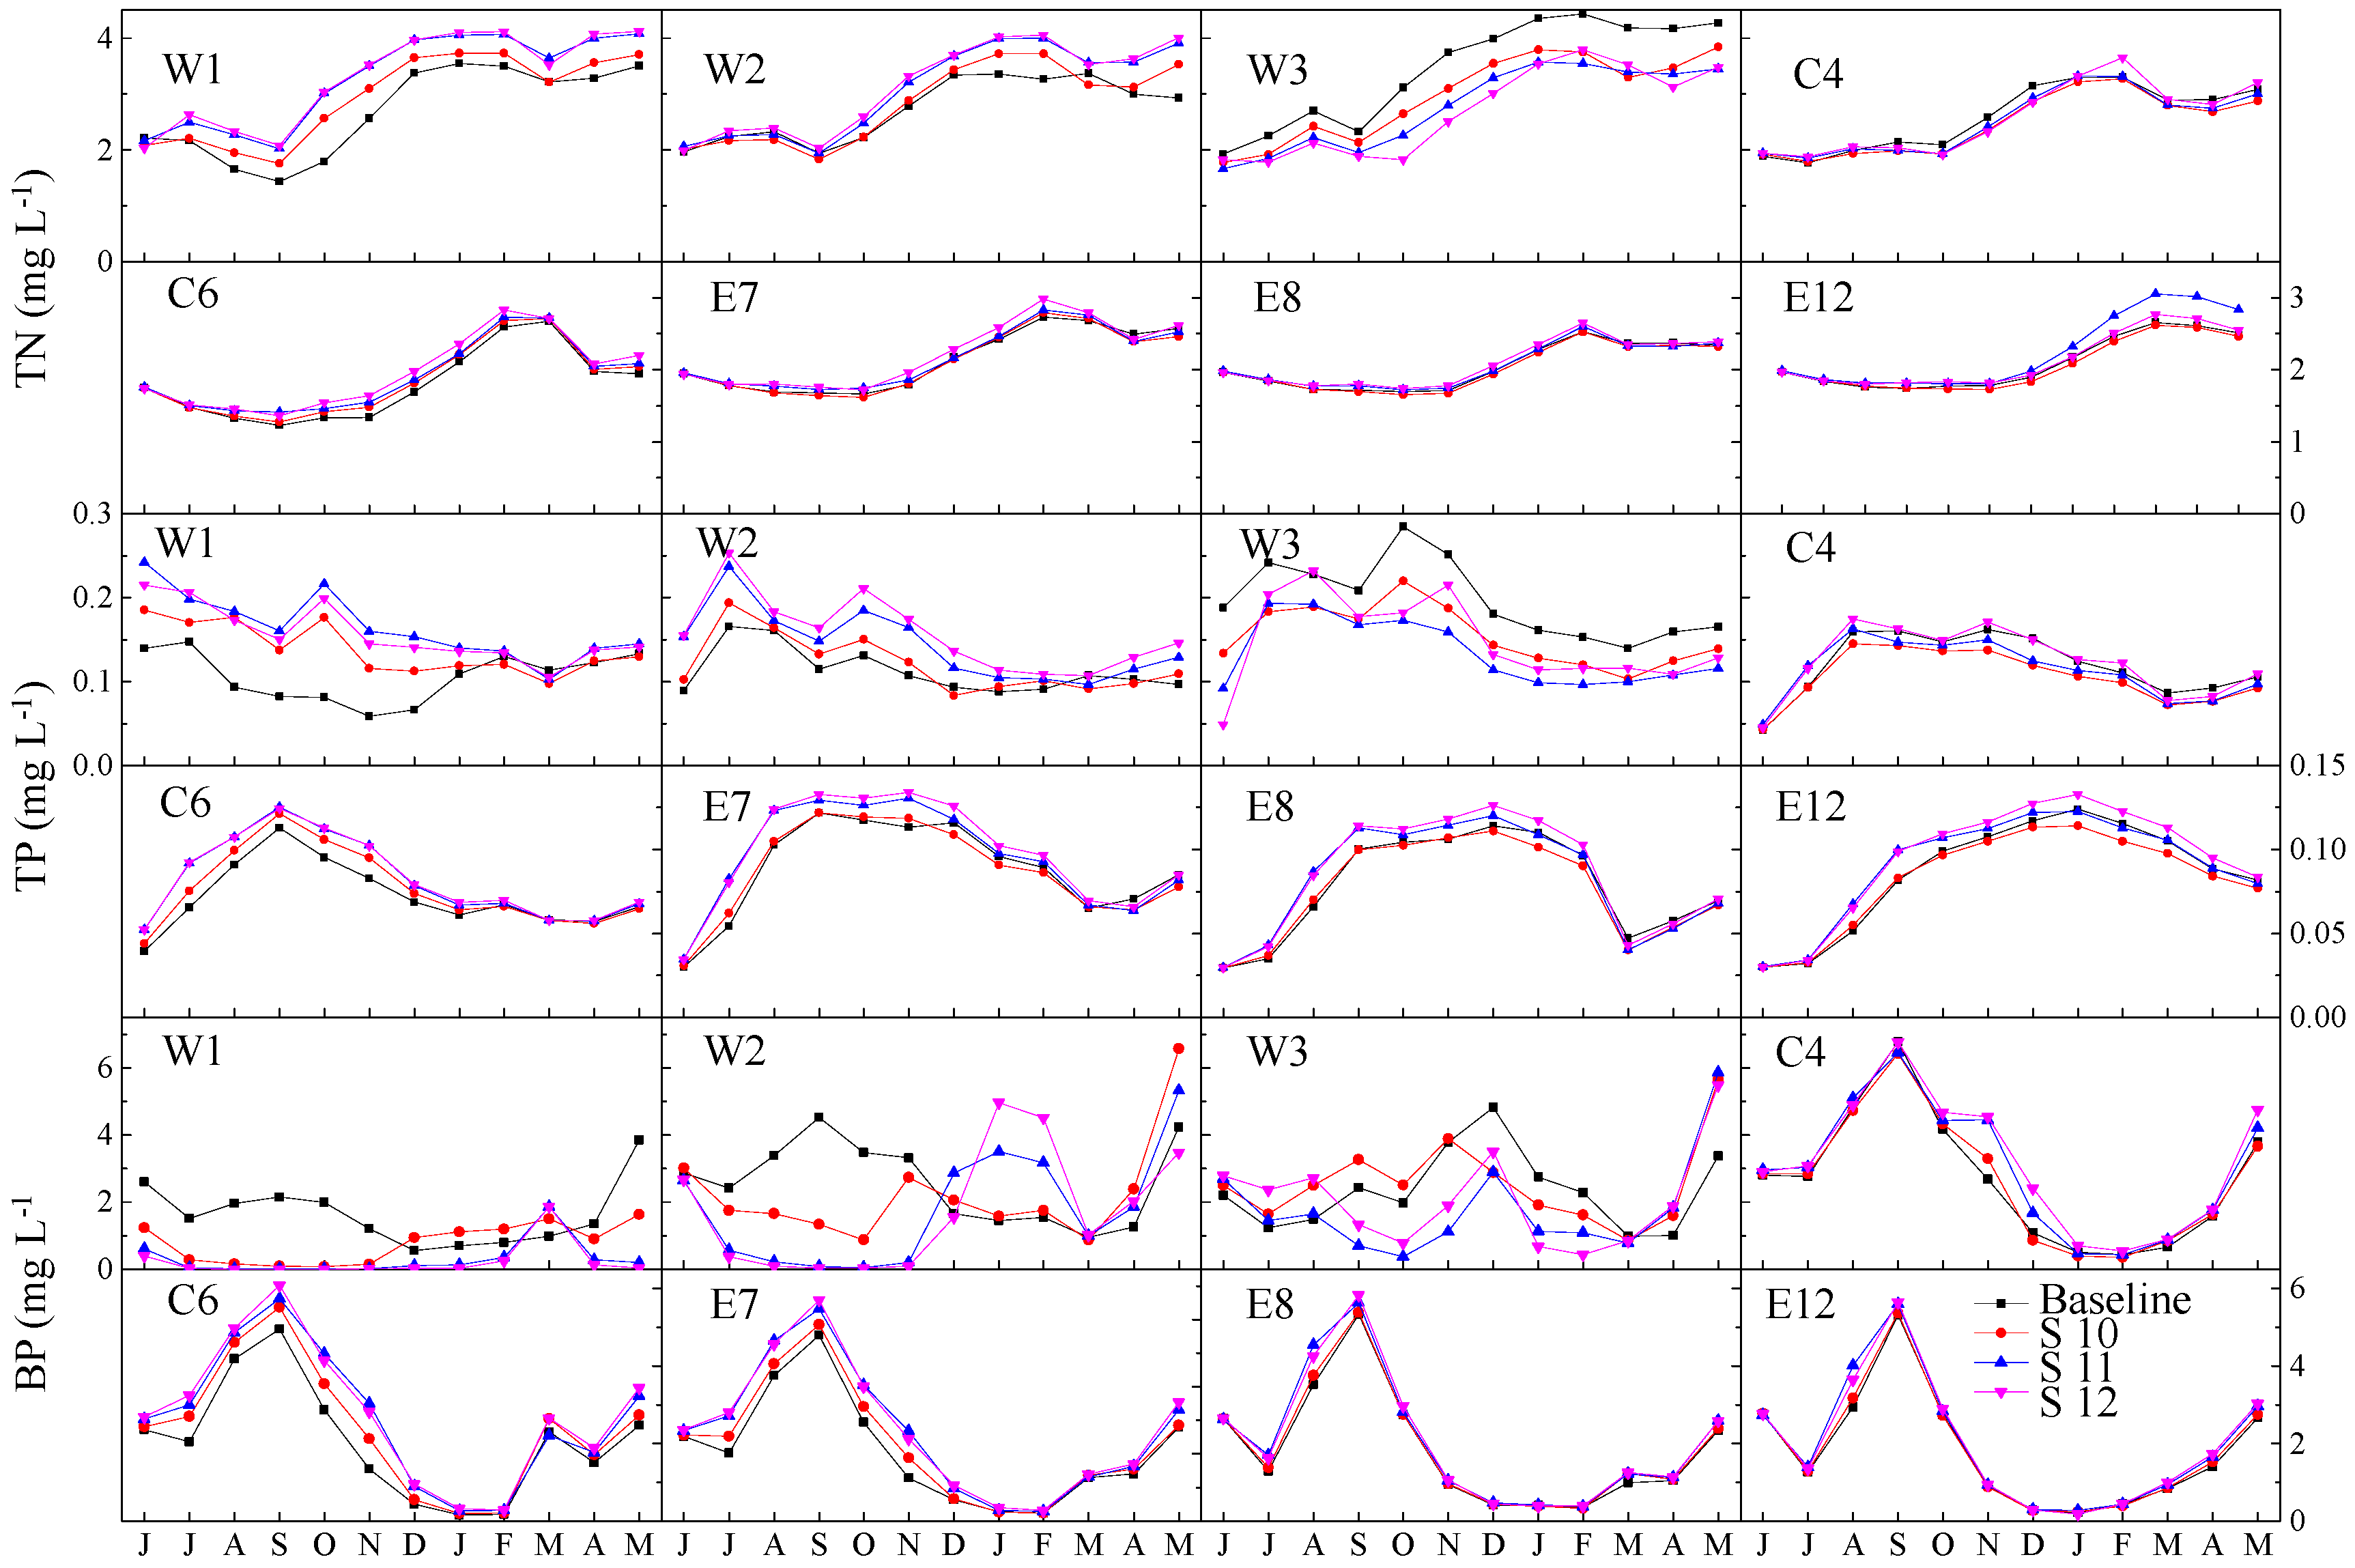
4.3. Entrances Adjustment of Tributaries
4.4. Water Quality Response Comparisons between Restoration Measures
4.5. Possibities and Limitations of Using the EcoTaihu Model
5. Summary and Conclusions
Author Contributions
Funding
Acknowledgments
Conflicts of Interest
References
- Conley, D.J.; Paerl, H.W.; Howarth, R.W.; Boesch, D.F.; Seitzinger, S.P.; Havens, K.E.; Lancelot, C.; Likens, G.E. Controlling eutrophication: Nitrogen and phosphorus. Science 2009, 323, 1014–1015. [Google Scholar] [CrossRef] [PubMed]
- Xu, H.; Paerl, H.W.; Qin, B.Q.; Zhu, G.W.; Gao, G. Nitrogen and phosphorus inputs control phytoplankton growth in eutrophic Lake Taihu, China. Limnol. Oceanogr. 2010, 55, 420–432. [Google Scholar] [CrossRef]
- Wang, X.L.; Zhang, M.; Yin, J. Composition and influential factors of phytoplankton function groups in Lake Chaohu. J. Lake Sci. 2018, 30, 431–440. (In Chinese) [Google Scholar]
- Conley, D.J.; Paerl, H.W.; Howarth, R.W.; Boesch, D.F.; Seitzinger, S.P.; Havens, K.E.; Lancelot, C.; Likens, G.E.; Jacoby, C.A.; Frazer, T.K. Eutrophication: Time to adjust expectations [with Response]. Science 2009, 324, 723. [Google Scholar] [CrossRef]
- Mallin, M.A.; Mciver, M.R.; Wells, H.A.; Parsons, D.C.; Johnson, V.L. Reversal of eutrophication following sewage treatment upgrades in the new river estuary, North Carolina. Estuaries Coasts 2005, 28, 750–760. [Google Scholar] [CrossRef]
- Jeppesen, E.; Søndergaard, M.; Meerhoff, M.; Lauridsen, T.L.; Jensen, J.P. Shallow lake restoration by nutrient loading reduction—Some recent findings and challenges ahead. Hydrobiology 2007, 584, 239–252. [Google Scholar] [CrossRef]
- Roberta, F.; Antenucci, J.P. The impact of transfers on water quality and the disturbance regime in a reservoir. Water Res. 2011, 45, 5873–5885. [Google Scholar]
- Hu, L.; Hu, W.; Zhai, S. Effects on water quality following water transfer in Lake Taihu, China. Ecol. Eng. 2010, 36, 471–481. [Google Scholar] [CrossRef]
- Amano, Y.; Sakai, Y.; Sekiya, T.; Takeya, K.; Taki, K.; Machida, M. Effect of phosphorus fluctuation caused by river water dilution in eutrophic lake on competition between blue-green alga Microcystis aeruginosa and diatom Cyclotella sp. J. Environ. Sci. 2010, 22, 1666–1673. [Google Scholar] [CrossRef]
- Jensen, H.S.; Reitzel, K.; Egemose, S. Evaluation of aluminum treatment efficiency on water quality and internal phosphorus cycling in six Danish lakes. Hydrobiology 2015, 751, 189–199. [Google Scholar] [CrossRef]
- Spears, B.M.; Lürling, M.; Yasseri, S.; Castro-Castellon, A.T.; Gibbs, M.; Meis, S.; Mcdonald, C.; Mcintosh, J.; Sleep, D.; Van, O.F. Lake responses following lanthanum-modified bentonite clay (Phoslock®) application: An analysis of water column lanthanum data from 16 case study lakes. Water Res. 2013, 47, 5930–5942. [Google Scholar] [CrossRef] [PubMed]
- Spears, B.M.; Dudley, B.; Reitzel, K.; Rydin, E. Geo-engineering in lakes-a call for consensus. Environ. Sci. Technol. 2013, 47, 3953–3954. [Google Scholar] [CrossRef] [PubMed]
- Xu, D.; Ding, S.; Sun, Q.; Zhong, J.; Wu, W.; Jia, F. Evaluation of in situ capping with clean soils to control phosphate release from sediments. Sci. Total Environ. 2012, 438, 334–341. [Google Scholar] [CrossRef] [PubMed]
- Jing, L.D.; Wu, C.X.; Liu, J.T.; Wang, H.G.; Ao, H.Y. The effects of dredging on nitrogen balance in sediment-water microcosms and implications to dredging projects. Ecol. Eng. 2013, 52, 167–174. [Google Scholar] [CrossRef]
- Yenilmez, F.; Aksoy, A. Comparison of phosphorus reduction alternatives in control of nutrient concentrations in Lake Uluabat (Bursa, Turkey): Partial versus full sediment dredging. Limnol.-Ecol. Manag. Inland Waters 2013, 43, 1–9. [Google Scholar] [CrossRef]
- Ciurli, A.; Zuccarini, P.; Alpi, A. Growth and nutrient absorption of two submerged aquatic macrophytes in mesocosms, for reinsertion in a eutrophicated shallow lake. Wetlands Ecol. Manag. 2009, 17, 107–115. [Google Scholar] [CrossRef]
- Benndorf, J.; Böing, W.; Koop, J.; Neubauer, I. Top-down control of phytoplankton: The role of time scale, lake depth and trophic state. Freshw. Biol. 2002, 47, 2282–2295. [Google Scholar] [CrossRef]
- Rucinski, D.K.; Depinto, J.V.; Beletsky, D.; Scavia, D. Modeling hypoxia in the central basin of Lake Erie under potential phosphorus load reduction scenarios. J. Great Lakes Res. 2016, 42, 1206–1211. [Google Scholar] [CrossRef]
- Zhang, W.T.; Rao, Y.R. Application of a eutrophication model for assessing water quality in Lake Winnipeg. J. Great Lakes Res. 2012, 38, 158–173. [Google Scholar] [CrossRef]
- Verhamme, E.M.; Redder, T.M.; Schlea, D.A.; Grush, J.; Bratton, J.F.; Depinto, J.V. Development of the Western Lake Erie Ecosystem Model (WLEEM): Application to connect phosphorus loads to cyanobacteria biomass. J. Great Lakes Res. 2016, 42, 1193–1205. [Google Scholar] [CrossRef]
- Zhai, S.J.; Hu, W.P.; Zhu, Z.C. Ecological impacts of water transfers on Lake Taihu from the Yangtze River, China. Ecol. Eng. 2010, 36, 406–420. [Google Scholar] [CrossRef]
- Chu, M.M. The countermeasures of water quality protection of Lake Yangchenghu. Jiangsu Water Conservancy 2004, 36–37. (In Chinese) [Google Scholar]
- Liang, C.; Li, X.; Ran, X. The eutrophication process and trend of Lake Yangchenghu based on spati-temporal distribution. J. Jinan Univ. (Nat. Sci. Med. Ed.) 2015, 36, 443–447. (In Chinese) [Google Scholar]
- Liu, C.W.; Zhang, L.J.; Zhao, Z.Q. Research on numerical simulation of improving water environment for yangcheng lake. J. Water Resour. Water Eng. 2015, 26, 86–90. (In Chinese) [Google Scholar]
- Jiang, Y.; Wu, Z.S.; Zhao, Z.H.; Wang, X.L.; Liu, X.; Li, Q.Y.; Cai, Y.J. Spatial distribution and pollution assessment of nitrogen, phosphorus and heavy metals in surface sediments of Lake Yangcheng, Jiangsu Province, China. Res. Environ. Sci. 2016, 29, 1590–1599. (In Chinese) [Google Scholar]
- Zhao, L.; Weng, J. Research of Phytoplankton Status in Yangcheng Lake and Evaluation of Its Eutrophication. Adm. Tech. Environ. Monit. 2013, 25, 27–29. (In Chinese) [Google Scholar]
- Yang, H.; Chen, J.; Tan, J.H. Analysis of water quality change and pollutant flux of river channels into Yangcheng Lake. Water Res. Prot. 2016, 32, 129–132. (In Chinese) [Google Scholar]
- Shen, G.H.; Zhang, R.Q.; Gao, X.P. The trend analysis of water quality change in Lake Yangchenghu. J. Water Resour. Res. 2014, 35, 41–43. (In Chinese) [Google Scholar]
- Vollenweider, R.A. Scientific Fundamentals of the Eutrophication of Lakes and Flowing Waters, with Particular Reference to Nitrogen and Phosphorus as Factors in Eutrophication. Technical Report (DAS/CSI/68.27); OECD: Paris, France, 1970. [Google Scholar]
- Song, X.H.; Gu, H.D.; Bing, X.W.; Yang, C.G. Correlation of Three Water Quality Parameters—PI, BOD5 and TOC in Yangcheng Lake. Environ. Sci. Technol. 2011, 34, 109–113. (In Chinese) [Google Scholar]
- Jørgensen, S.E. A review of recent developments in lake modelling. Ecol. Model. 2010, 221, 689–692. [Google Scholar] [CrossRef]
- Jørgensen, S.E. Models as instruments for combination of ecological theory and environmental practice. Ecol. Model. 1994, 75, 5–20. [Google Scholar] [CrossRef]
- Zhang, L.; Lin, W.; Li, K.; Sheng, J.; Wei, A.; Luo, F.; Wang, Y.; Wang, X.; Zhang, L. Three-dimensional water quality model based on FVCOM for total load control management in Guan River Estuary, Northern Jiangsu Province. J. Ocean Univ. Chin. 2016, 15, 261–270. [Google Scholar] [CrossRef]
- Feng, T.; Wang, C.; Hou, J.; Wang, P.; Liu, Y.; Dai, Q.; Yang, Y.; You, G. Effect of inter-basin water transfer on water quality in an urban lake: A combined water quality index algorithm and biophysical modelling approach. Ecol. Indic. 2017, 92, 61–71. [Google Scholar] [CrossRef]
- Yin, Z.; Seo, D. Analysis of optimum grid determination of water quality model with 3-D hydrodynamic model using environmental fluid dynamics code (EFDC). Environ. Eng. Res. 2016, 21, 171–179. [Google Scholar] [CrossRef]
- Gong, R.; Xu, L.; Wang, D.G.; Li, H.Y.; Xu, J. Water Quality Modeling for a Typical Urban. Lake Based on the EFDC Model. Environ. Model. Assess. 2016, 21, 643–655. [Google Scholar] [CrossRef]
- Wang, Z.; Zou, R.; Zhu, X.; He, B.; Yuan, G.; Zhao, L.; Liu, Y. Predicting lake water quality responses to load reduction: A three-dimensional modeling approach for total maximum daily load. Int. J. Environ. Sci. Technol. 2013, 11, 423–436. [Google Scholar] [CrossRef]
- Wu, G.Z.; Xu, Z.X. Prediction of algal blooming using EFDC model: Case study in the Daoxiang Lake. Ecol. Model. 2011, 222, 1245–1252. [Google Scholar] [CrossRef]
- Liu, Y.; Wang, Y.; Hu, S.; Dong, F.; Zou, R.; Zhao, L.; Guo, H.; Zhu, X.; He, B. Quantitative evaluation of lake eutrophication responses under alternative water diversion scenarios: A water quality modeling-based statistical analysis approach. Sci. Total Environ. 2014, 468, 219–227. [Google Scholar] [CrossRef] [PubMed]
- Mellios, N.; Kofinas, D.; Laspidou, C.; Papadimitriou, T. Mathematical modeling of trophic state and nutrient flows of Lake Karla using the PCLake model. Environ. Processes 2015, 2, 85–100. [Google Scholar] [CrossRef]
- Janse, J.H.; Scheffer, M.; Lijklema, L.; Liere, L.V.; Sloot, J.S.; Mooij, W.M.; Jørgensen, S.E. Estimating the critical phosphorus loading of shallow lakes with the ecosystem model PCLake: Sensitivity, calibration and uncertainty. Ecol. Model. 2010, 221, 654–665. [Google Scholar] [CrossRef]
- Akkoyunlu, A.; Karaaslan, Y. Assessment of improvement scenario for water quality in Mogan Lake by using the AQUATOX Model. Environ. Sci. Pollut. Res. 2015, 22, 14349–14357. [Google Scholar] [CrossRef] [PubMed]
- Zhu, Y.Q. Application of ecosystem model in studying eutrophication control measures for Dianshan Lake. Environ. Sci. Technol. 2011, 24, 12–18. (In Chinese) [Google Scholar]
- Wang, X.D.; Zhang, S.S.; Liu, S.L.; Chen, J.W. A two-dimensional numerical model for eutrophication in Baiyangdian Lake. Front. Environ. Sci. Eng. 2012, 6, 815–824. [Google Scholar] [CrossRef]
- Pei, H.; Wang, Y. Eutrophication research of West Lake, Hangzhou, China: Modeling under uncertainty. Water Res. 2003, 37, 416–428. [Google Scholar]
- Chen, Q.W.; Zhang, C.C.; Recknagel, F.; Guo, J.; Blanckaert, K. Adaptation and multiple parameter optimization of the simulation model SALMO as prerequisite for scenario analysis on a shallow eutrophic Lake. Ecol. Model. 2014, 273, 109–116. [Google Scholar] [CrossRef]
- Hu, W.P.; Zhai, S.J.; Zhu, Z.C.; Han, H.J. Impacts of the Yangtze River water transfer on the restoration of Lake Taihu. Ecol. Eng. 2008, 34, 30–49. [Google Scholar] [CrossRef]
- Hu, W.P.; Jørgensen, S.E.; Zhang, F.B. A vertical-compressed three-dimensional ecological model in Lake Taihu, China. Ecol. Model. 2006, 190, 367–398. [Google Scholar] [CrossRef]
- Hu, W.P.; Jørgensen, S.E.; Fabing, Z.; Chen, Y.G.; Hu, Z.; Yang, L. A model on the carbon cycling in Lake Taihu, China. Ecol. Model. 2011, 222, 2973–2991. [Google Scholar]
- Han, T.; Zhang, H.J.; Hu, W.P.; Deng, J.C.; Li, Q.Q.; Zhu, G. Research on self-purification capacity of Lake Taihu. Environ. Sci. Pollut. Res. 2015, 22, 8201–8215. [Google Scholar] [CrossRef] [PubMed]
- Pápista, É.; Ács, É.; Böddi, B. Chlorophyll-a determination with ethanol–A critical test. Hydrobiology 2002, 485, 191–198. [Google Scholar] [CrossRef]
- Jin, X.C.; Tu, Q.Y. The Standard Methods for Observation and Analysis in Lake Eutrophication; Chinese Environmental Science Press: Beijing, China, 1990. (In Chinese) [Google Scholar]
- Jørgensen, S.E.; De Bernardi, R. The use of structural dynamic models to explain successes and failures of biomanipulation. Hydrobiology 1998, 379, 147–158. [Google Scholar]
- Hu, W.P. A review of the models for Lake Taihu and their application in lake environmental management. Ecol. Model. 2016, 319, 9–20. [Google Scholar] [CrossRef]
- Zhang, H.J.; Hu, W.P.; Gu, K.; Li, Q.Q.; Zheng, D.L.; Zhai, S.H. An improved ecological model and software for short-term algal bloom forecasting. Environ. Model. Softw. 2013, 48, 152–162. [Google Scholar] [CrossRef]
- Li, Q.Q.; Hu, W.P.; Zhai, S.H. Integrative Indicator for Assessing the Alert Levels of Algal Bloom in Lakes: Lake Taihu as a Case Study. J. Environ. Manag. 2015, 57, 237–250. [Google Scholar] [CrossRef] [PubMed]
- Zhang, J.J.; Jørgensen, S.E.; Tan, C.O.; Beklioglu, M. A structurally dynamic modelling—Lake Mogan, Turkey as a case study. Ecol. Model. 2003, 164, 103–120. [Google Scholar] [CrossRef]
- Kong, X.Z.; Jørgensen, S.E.; He, W.; Qin, N.; Xu, F.L. Predicting the restoration effects by a structural dynamic approach in Lake Chaohu, China. Ecol. Model. 2013, 266, 73–85. [Google Scholar] [CrossRef]
- Jørgensen, S.E.; Ray, S.; Berec, L.; Straskraba, M. Improved calibration of a eutrophication model by use of the size variation due to succession. Ecol. Model. 2002, 153, 269–277. [Google Scholar] [CrossRef]
- Gui, Z.F.; Xue, B.; Yao, S.C.; Wei, W.J. Water Quality Status and Influencing Factors of Yangcheng Lake, China. Sci. Geogr. Sin. 2011, 31, 1487–1492. (In Chinese) [Google Scholar]
- Zou, R.; Zhang, X.; Liu, Y.; Chen, X.; Zhao, L.; Zhu, X.; He, B.; Guo, H. Uncertainty-based analysis on water quality response to water diversions for Lake Chenghai: A multiple-pattern inverse modeling approach. J. Hydrol. 2014, 514, 1–14. [Google Scholar] [CrossRef]
- Welch, E.B.; Patmont, C.R. Lake restoration by dilution: Moses lake, Washington. Water Res. 1980, 14, 1317–1325. [Google Scholar] [CrossRef]
- Welch, E.B.; Weiher, E.R. Improvement in Moses Lake quality from dilution and sewage diversion. Lake Reserv. Manag. 1987, 3, 58–65. [Google Scholar] [CrossRef]
- Li, Y.; Acharya, K.; Yu, Z. Modeling impacts of Yangtze River water transfer on water ages in Lake Taihu, China. Ecol. Eng. 2011, 37, 325–334. [Google Scholar] [CrossRef]
- Mehner, T.; Diekmann, M.; Gonsiorczyk, T.; Kasprzak, P.; Koschel, R.; Krienitz, L.; Rumpf, M.; Schulz, M.; Wauer, G. Rapid Recovery from Eutrophication of a Stratified Lake by Disruption of Internal Nutrient Load. Ecosystem 2008, 11, 1142–1156. [Google Scholar] [CrossRef]
- Wichelen, J.V.; Declerck, S.; Muylaert, K.; Hoste, I.; Geenens, V.; Vandekerkhove, J.; Michels, E.; Pauw, N.D.; Hoffmann, M.; Meester, L.D. The importance of drawdown and sediment removal for the restoration of the eutrophied shallow Lake Kraenepoel (Belgium). Hydrobiology 2007, 584, 291–303. [Google Scholar] [CrossRef]
- Liu, H.; Benoit, G.; Liu, T.; Liu, Y.; Guo, H. An integrated system dynamics model developed for managing lake water quality at the watershed scale. J. Environ. Manag. 2015, 155, 11–23. [Google Scholar] [CrossRef] [PubMed]
- Chen, M.; Ding, S.; Liu, L.; Xu, D.; Han, C.; Zhang, C. Iron-coupled inactivation of phosphorus in sediments by macrozoobenthos (chironomid larvae) bioturbation: Evidences from high-resolution dynamic measurements. Environ. Pollut. 2015, 204, 241–247. [Google Scholar] [CrossRef] [PubMed]


| Criterion | Parameter Value |
|---|---|
| Lake surface (km2) | 117 |
| Mean depth (m) | 2.43 |
| Volume (108 m3) | 2.36 |
| Discharge (108 m3 y1) | 6.14 |
| Water residence time (year) | 0.38 a (June 2015–May 2016) |
| External TN loading (g N m−2 y−1) | 17.34 a (—) |
| External TP loading (g P m−2 y−1) | 1.39 a (—) |
| Internal total NH4+-N loading (g N m−2 y−1) | 3.29 a (—) |
| Internal TP loading (g P m−2 y−1) | 0.26 a (—) |
| TN retention (%) * | 63 a (—) |
| TP retention (%) * | 32a (—) |
| Mean organic matter (mg L−1) | 6.94 a (February 2016); 5.38 (January 2009) b |
| Mean total suspended solids (mg L−1) | 14.20 a (March 2016) |
| Annual averaged pH | 7.47 a (—) |
| Model Scenarios | Features | Period of Time | Duration (Days) |
|---|---|---|---|
| S1 | 5% reduction of total nutrient loads (5% TNL) | 1 June 2015–31 May 2016 | 366 |
| S2 | 10% TNL | — | 366 |
| S3 | 20% TNL | — | 366 |
| S4 | 30% TNL | — | 366 |
| S5 | 50% TNL | — | 366 |
| S6 | 40 m3 s−1 flow rate of water transfer in winter–spring (40 WTWS) | 1 January 2016–31 May 2016 (total volume: 5.18 × 10⁸ m3) | 150 |
| S7 | 60 WTWS | (total volume: 7.78 × 10⁸ m3) | 150 |
| S8 | 40 m3 s−1 flow rate of water transfer in autumn–winter (40 WTAW) | 1 October 2015–31 December 2015 (total volume: 3.18 × 10⁸ m3) | 92 |
| S9 | 60 WTAW | — (total volume: 4.77 × 10⁸ m3) | 92 |
| S10 | Water inflow of Baidang River added to Shengtanggang River | 1 June 2015–31 May 2016 | 366 |
| S11 | Water inflow of Baidang, Litanghe, Jiminting River added to Shengtanggang River | — | 366 |
| S12 | Water inflow of all other rivers added to Shengtanggang River | — | 366 |
| Parameters | h | |
|---|---|---|
| TN | 0.30 | 25.73 |
| TP | 0.36 | 48.00 |
| BP | 0.24 | 21.40 |
| DO | 0.10 | 7.99 |
| Parameter | Value | Unit |
|---|---|---|
| Maximum growth rate of submerged plants | 1.8 | d−1 |
| Maximum growth rate of phytoplankton | 1.1 | d−1 |
| Settling velocity of detritus | 0.001 | m d−1 |
| Oxidation rate of ammonia nitrogen at 20 °C | 0.2 | d−1 |
| Releasing velocity of dissolved phosphorus from sediments | 0.0025 | d−1 |
| Oxidation rate of nitrate nitrogen at 20 °C | 0.6 | d−1 |
| TN | TP | BP | ||||
|---|---|---|---|---|---|---|
| Mean Change (%) | Annual Average (mg L−1) | Mean Change (%) | Annual Average (mg L−1) | Mean Change (%) | Annual Average (mg L−1) | |
| Baseline | N/A | 2.38 | N/A | 0.104 | N/A | 2.10 |
| S1 | 0.39 | 2.39 | −5.12 | 0.098 | −0.79 | 2.08 |
| S2 | −5.44 | 2.25 | −10.62 | 0.093 | −5.61 | 1.98 |
| S3 | −14.60 | 2.03 | −19.37 | 0.084 | −13.76 | 1.81 |
| S4 | −23.79 | 1.81 | −28.17 | 0.075 | −22.29 | 1.63 |
| S5 | −42.26 | 1.37 | −45.99 | 0.056 | −40.59 | 1.24 |
| S6 | −15.60 | 2.01 | −7.34 | 0.096 | −5.17 | 1.99 |
| S7 | −19.54 | 1.91 | −10.13 | 0.093 | −8.11 | 1.93 |
| S8 | −2.77 | 2.31 | −16.26 | 0.087 | −2.37 | 2.05 |
| S9 | −2.80 | 2.31 | −19.25 | 0.084 | −2.86 | 2.04 |
| S10 | −1.56 | 2.34 | −3.44 | 0.100 | 0.92 | 2.11 |
| S11 | 1.99 | 2.43 | 3.73 | 0.108 | 1.15 | 2.12 |
| S12 | 2.06 | 2.43 | 9.90 | 0.114 | 1.90 | 2.13 |
© 2018 by the authors. Licensee MDPI, Basel, Switzerland. This article is an open access article distributed under the terms and conditions of the Creative Commons Attribution (CC BY) license (http://creativecommons.org/licenses/by/4.0/).
Share and Cite
Wang, Y.; Hu, W.; Peng, Z.; Zeng, Y.; Rinke, K. Predicting Lake Eutrophication Responses to Multiple Scenarios of Lake Restoration: A Three-Dimensional Modeling Approach. Water 2018, 10, 994. https://doi.org/10.3390/w10080994
Wang Y, Hu W, Peng Z, Zeng Y, Rinke K. Predicting Lake Eutrophication Responses to Multiple Scenarios of Lake Restoration: A Three-Dimensional Modeling Approach. Water. 2018; 10(8):994. https://doi.org/10.3390/w10080994
Chicago/Turabian StyleWang, Yanping, Weiping Hu, Zhaoliang Peng, Ye Zeng, and Karsten Rinke. 2018. "Predicting Lake Eutrophication Responses to Multiple Scenarios of Lake Restoration: A Three-Dimensional Modeling Approach" Water 10, no. 8: 994. https://doi.org/10.3390/w10080994
APA StyleWang, Y., Hu, W., Peng, Z., Zeng, Y., & Rinke, K. (2018). Predicting Lake Eutrophication Responses to Multiple Scenarios of Lake Restoration: A Three-Dimensional Modeling Approach. Water, 10(8), 994. https://doi.org/10.3390/w10080994