Comprehensive Evaluation of Water Resource Security: Case Study from Luoyang City, China
Abstract
1. Introduction
2. Materials and Methods
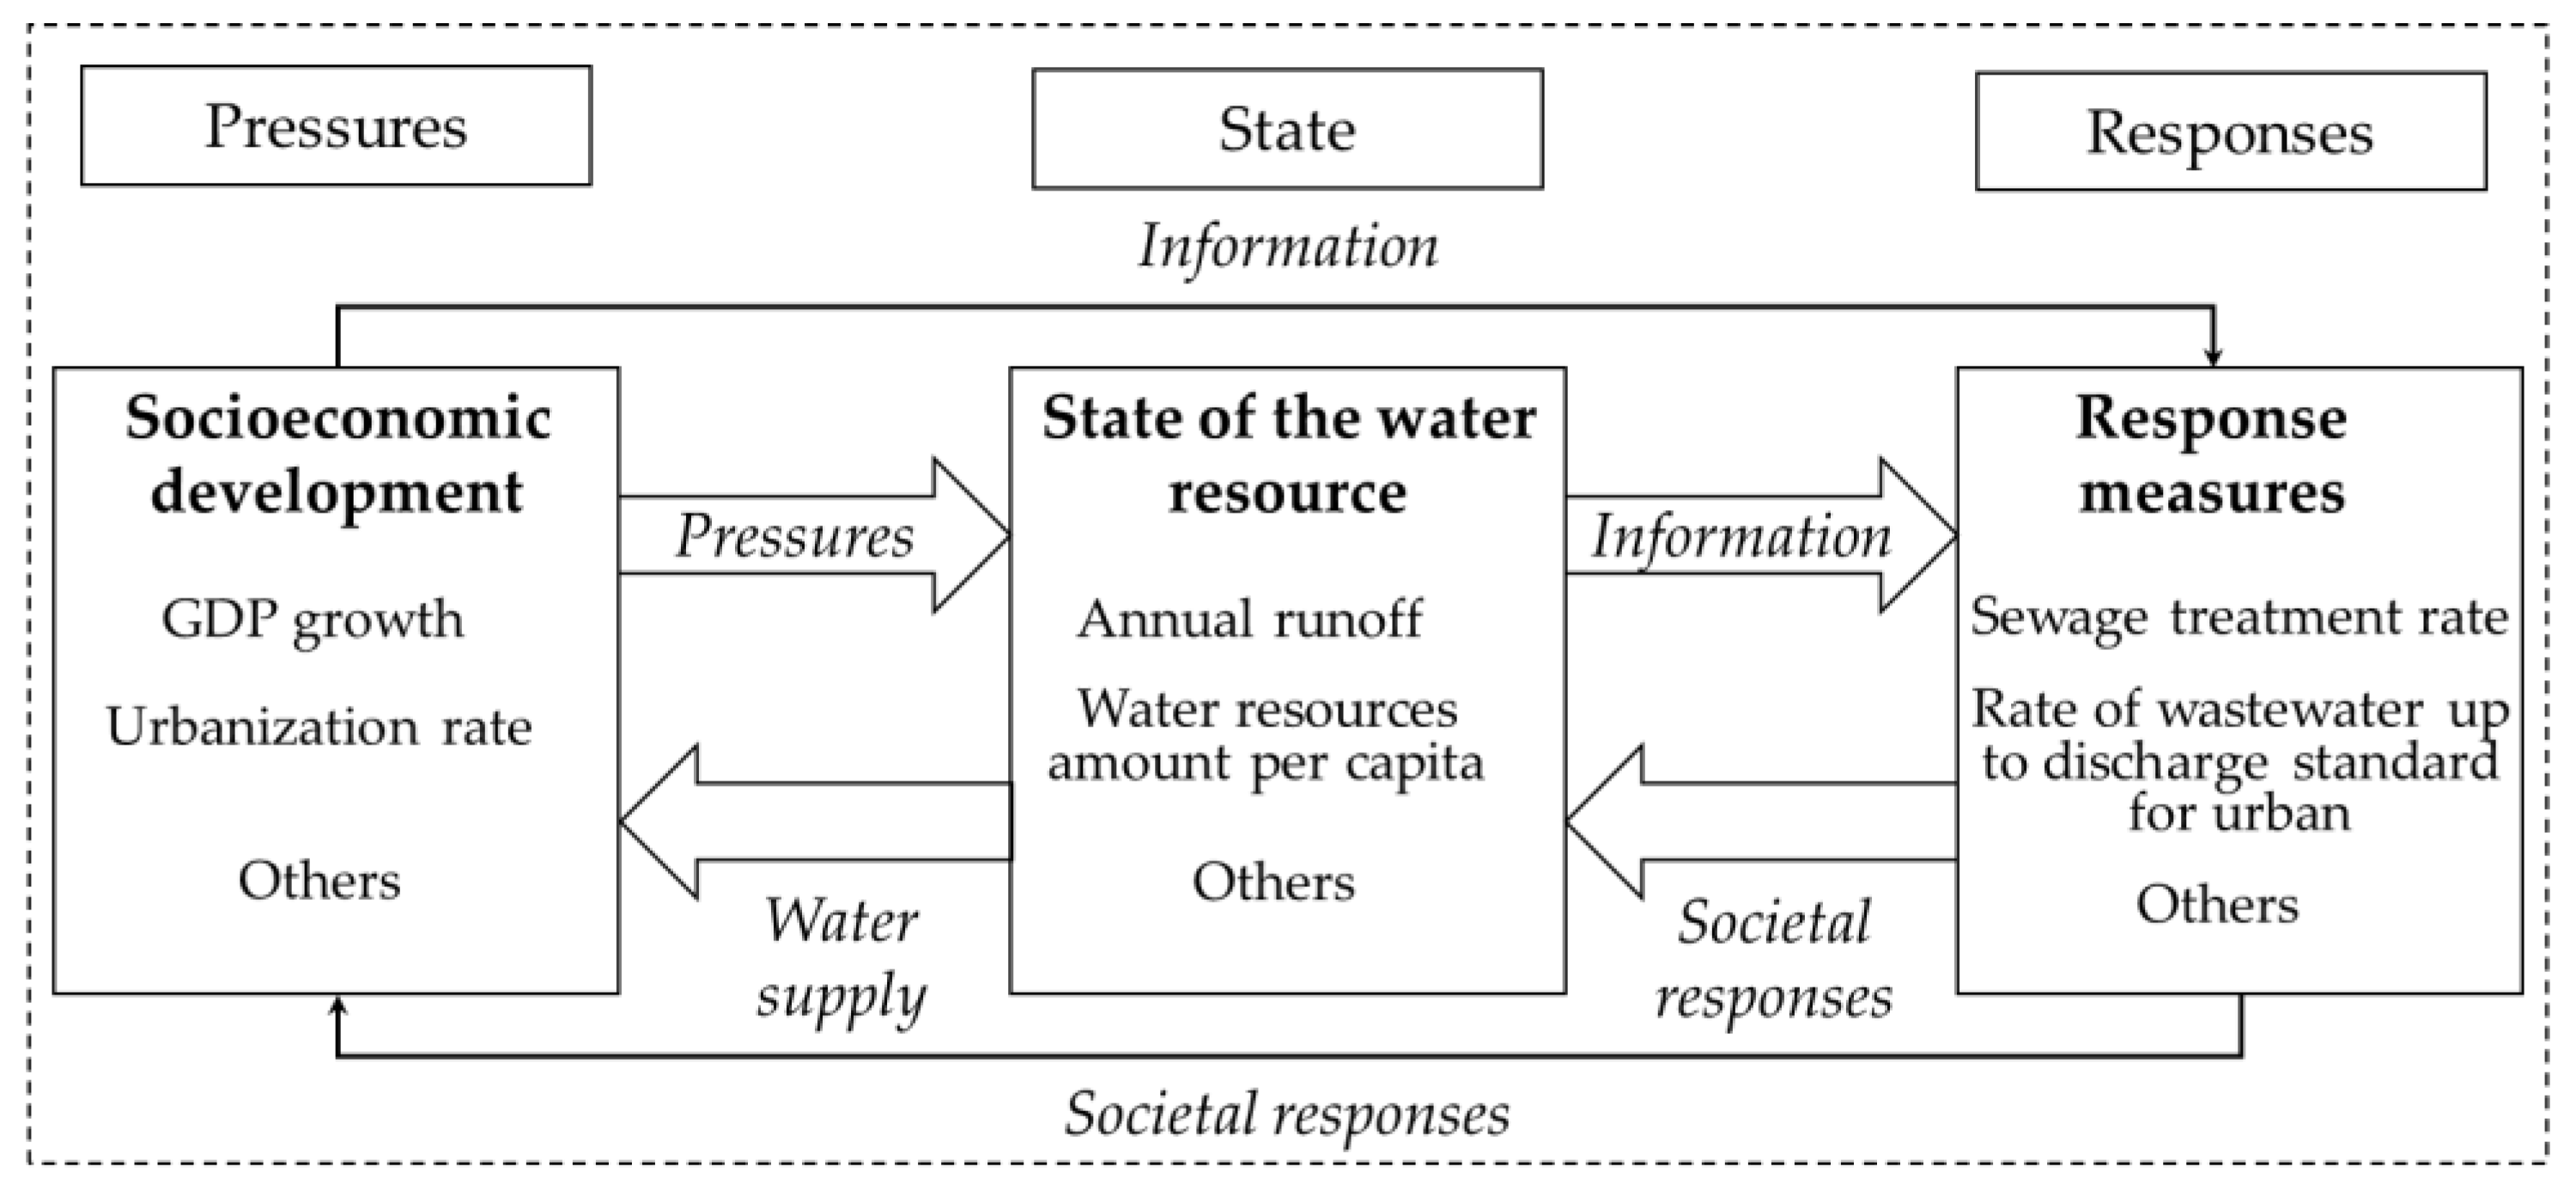
2.1. The PSR Framework
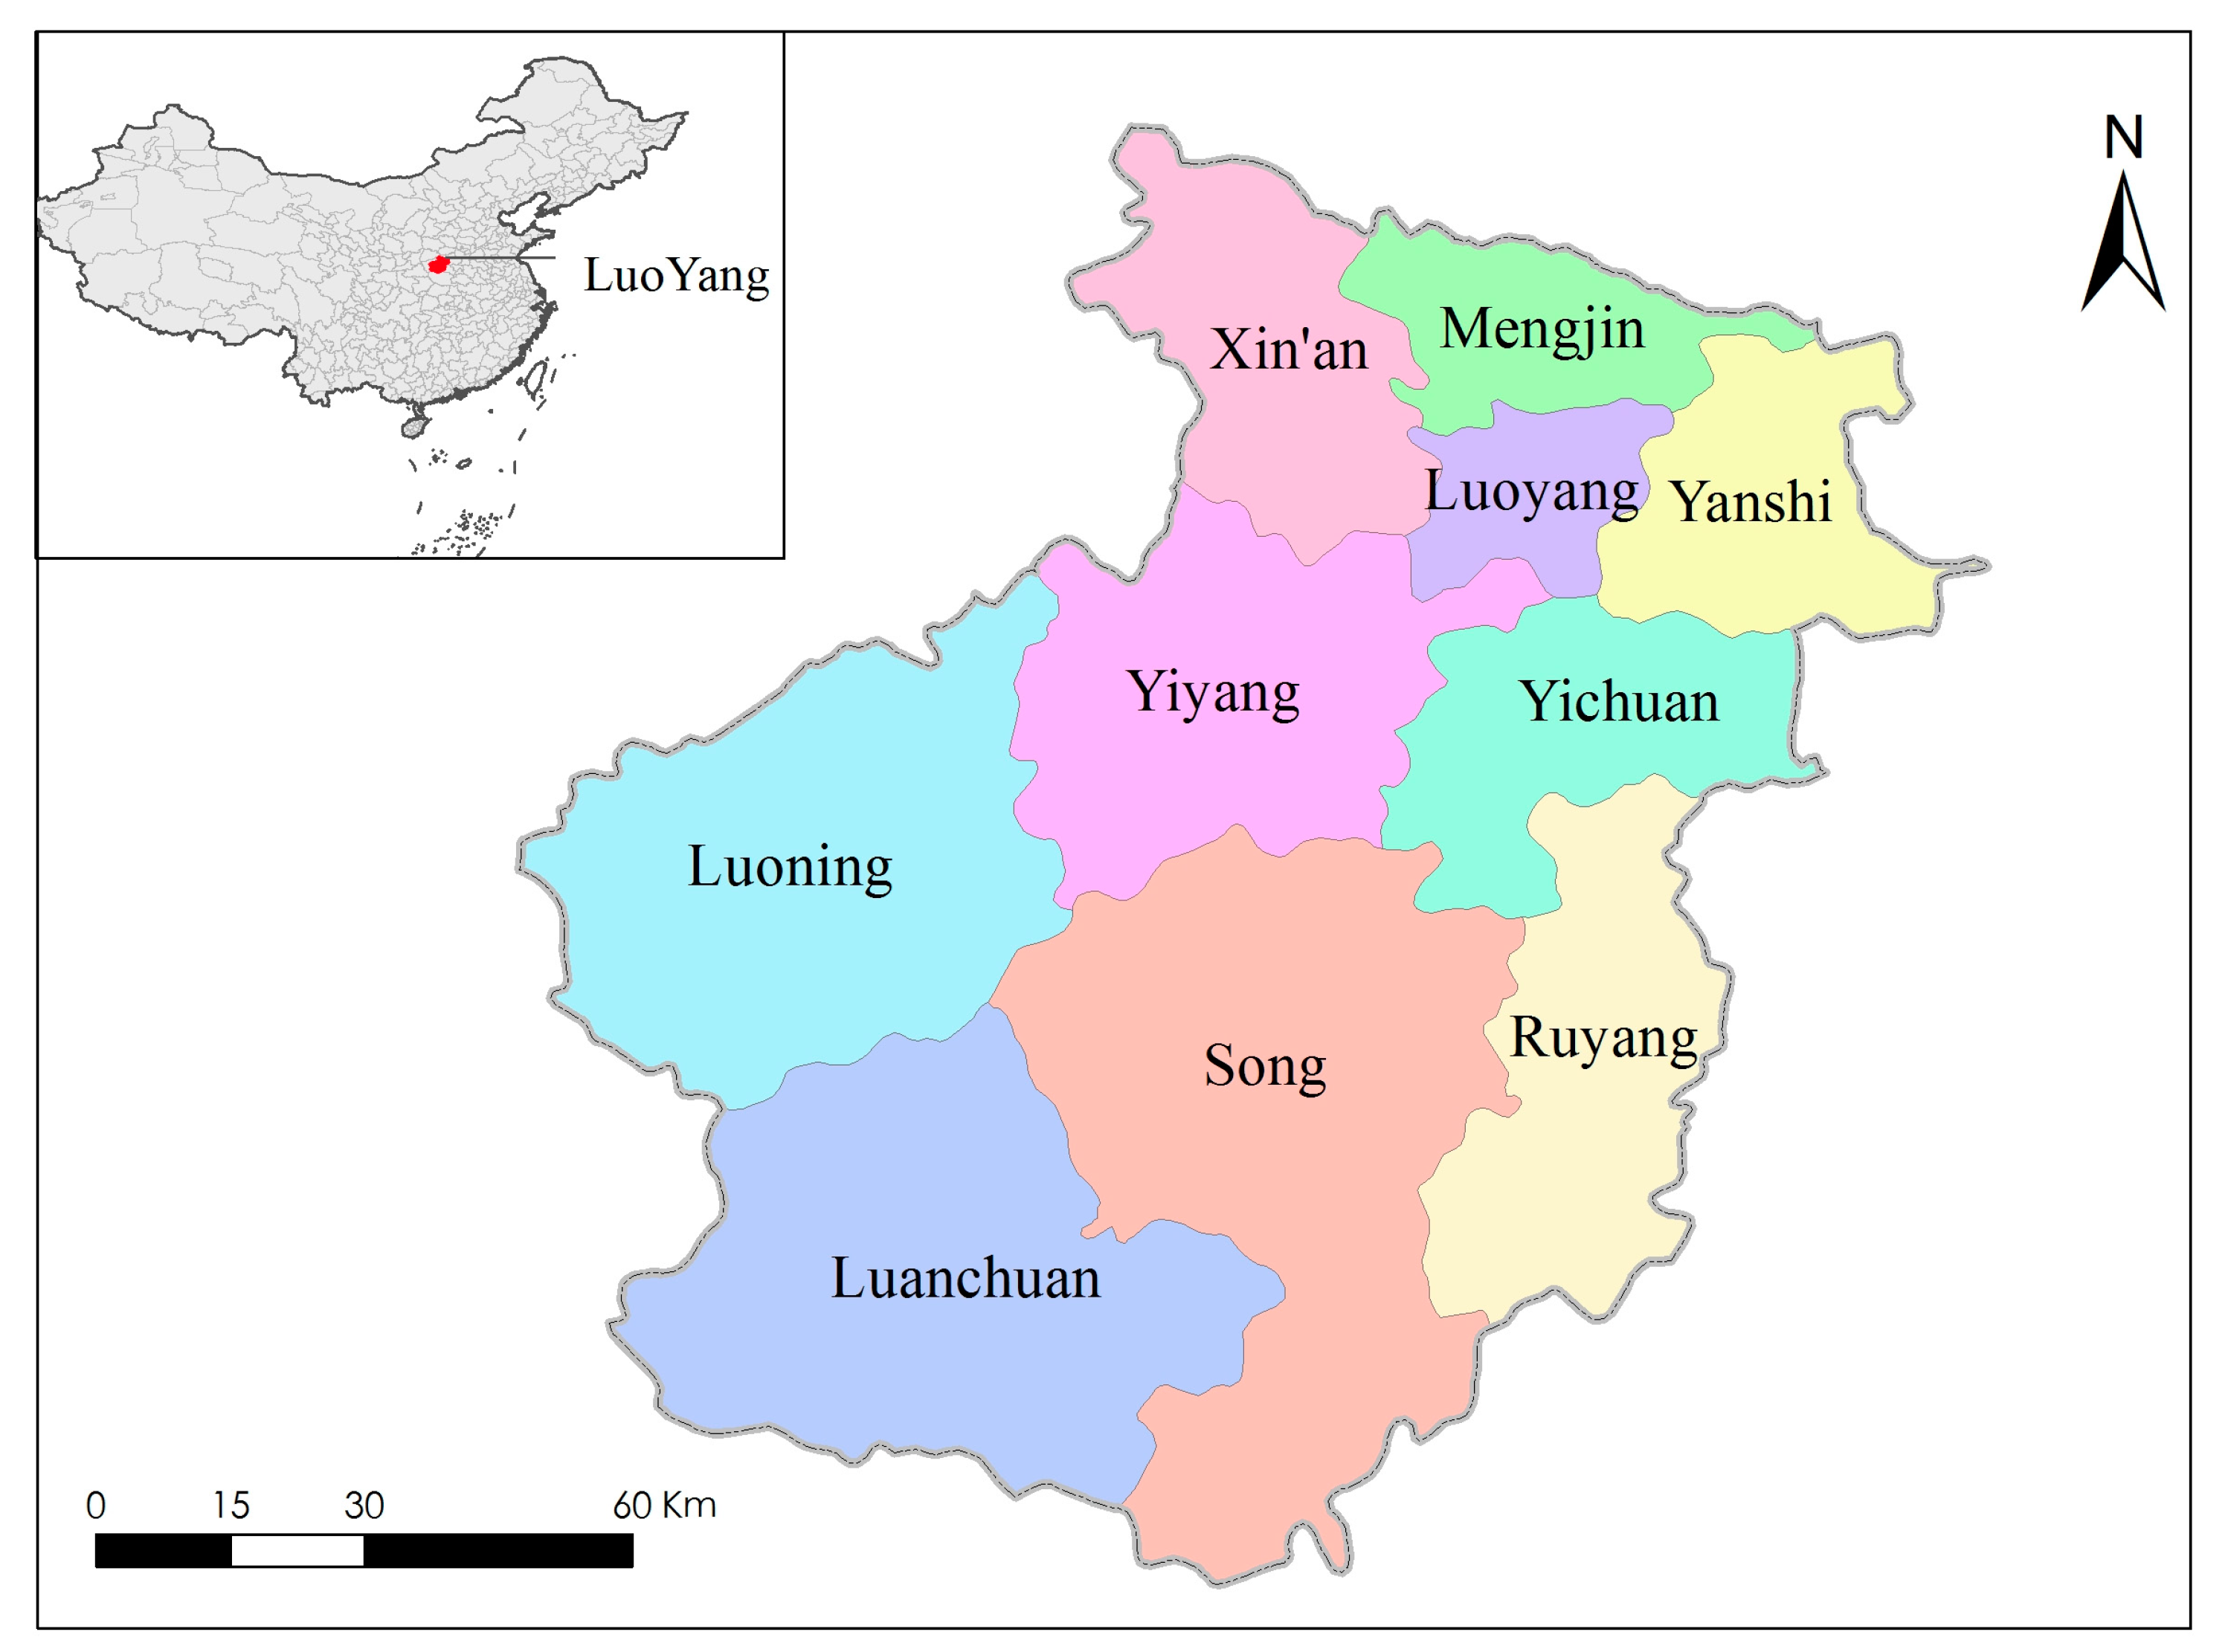
2.2. Description of Study Area
2.3. Data Source
2.4. Methods
2.4.1. Comprehensive Weights
- (1)
- Construct the judgment matrix. With n evaluation objects of sample set x, each sample has r indexes, which are composed of the original data matrix. The expression is:
- (2)
- Standardize the original data matrix. Due to the fact that the contestant indexes have different properties and dimensions, before evaluation, the dimensionless treatment of the positive index (Equation (2)) and negative index (Equation (3)) is carried out, in order to ensure that the actual value of each index becomes the standard value on the interval [0, 1].where is the survey maximum value, is the survey minimum value.
- (3)
- Calculate the entropy and weight of the indicator. When the system is in r different states, the probability of each state is , and the entropy of the system is E (Equation (4)). When is equal, the conditional entropy is the largest (extremum property), namely , then, the entropy (Equation (5)) and weight (Equation (6)) of the evaluation index to the evaluation object can be determined.where , = 1, , , and . Simultaneously assume that when , .We combine the advantages of the AHP and entropy weight methods and compute the comprehensive weights (the average of the AHP and entropy weights) as:
2.4.2. SPA Model
- (1)
- The construction of the set pair: When the SPA method is applied to the evaluation of water resource security, it is to form a set pair (H) comprised of urban water resource security evaluation index set (A) and evaluation standard set (B). By comparing the value of each index in set A with the evaluation standard value in set B, we can evaluate regional water resource security. As a whole system, the water resources system is divided into the following security levels: Security (Grade 1), Moderate Security (Grade 2), Critical Security (Grade 3), Insecurity (Grade 4), and Absolute Insecurity (Grade 5).
- (2)
- Calculate the connection degree. Since the standard boundary has fuzziness, the connection degree () is calculated using the fuzzy analysis method. The expression is:For the positive index, the connection degree between and its first-grade standard is:where .For the negative index, the connection degree between and its first-grade standard is:where .
- (3)
- Calculate the total connection degree and determine the security grade.
3. Results and Discussion
3.1. Results of Comprehensive Weights
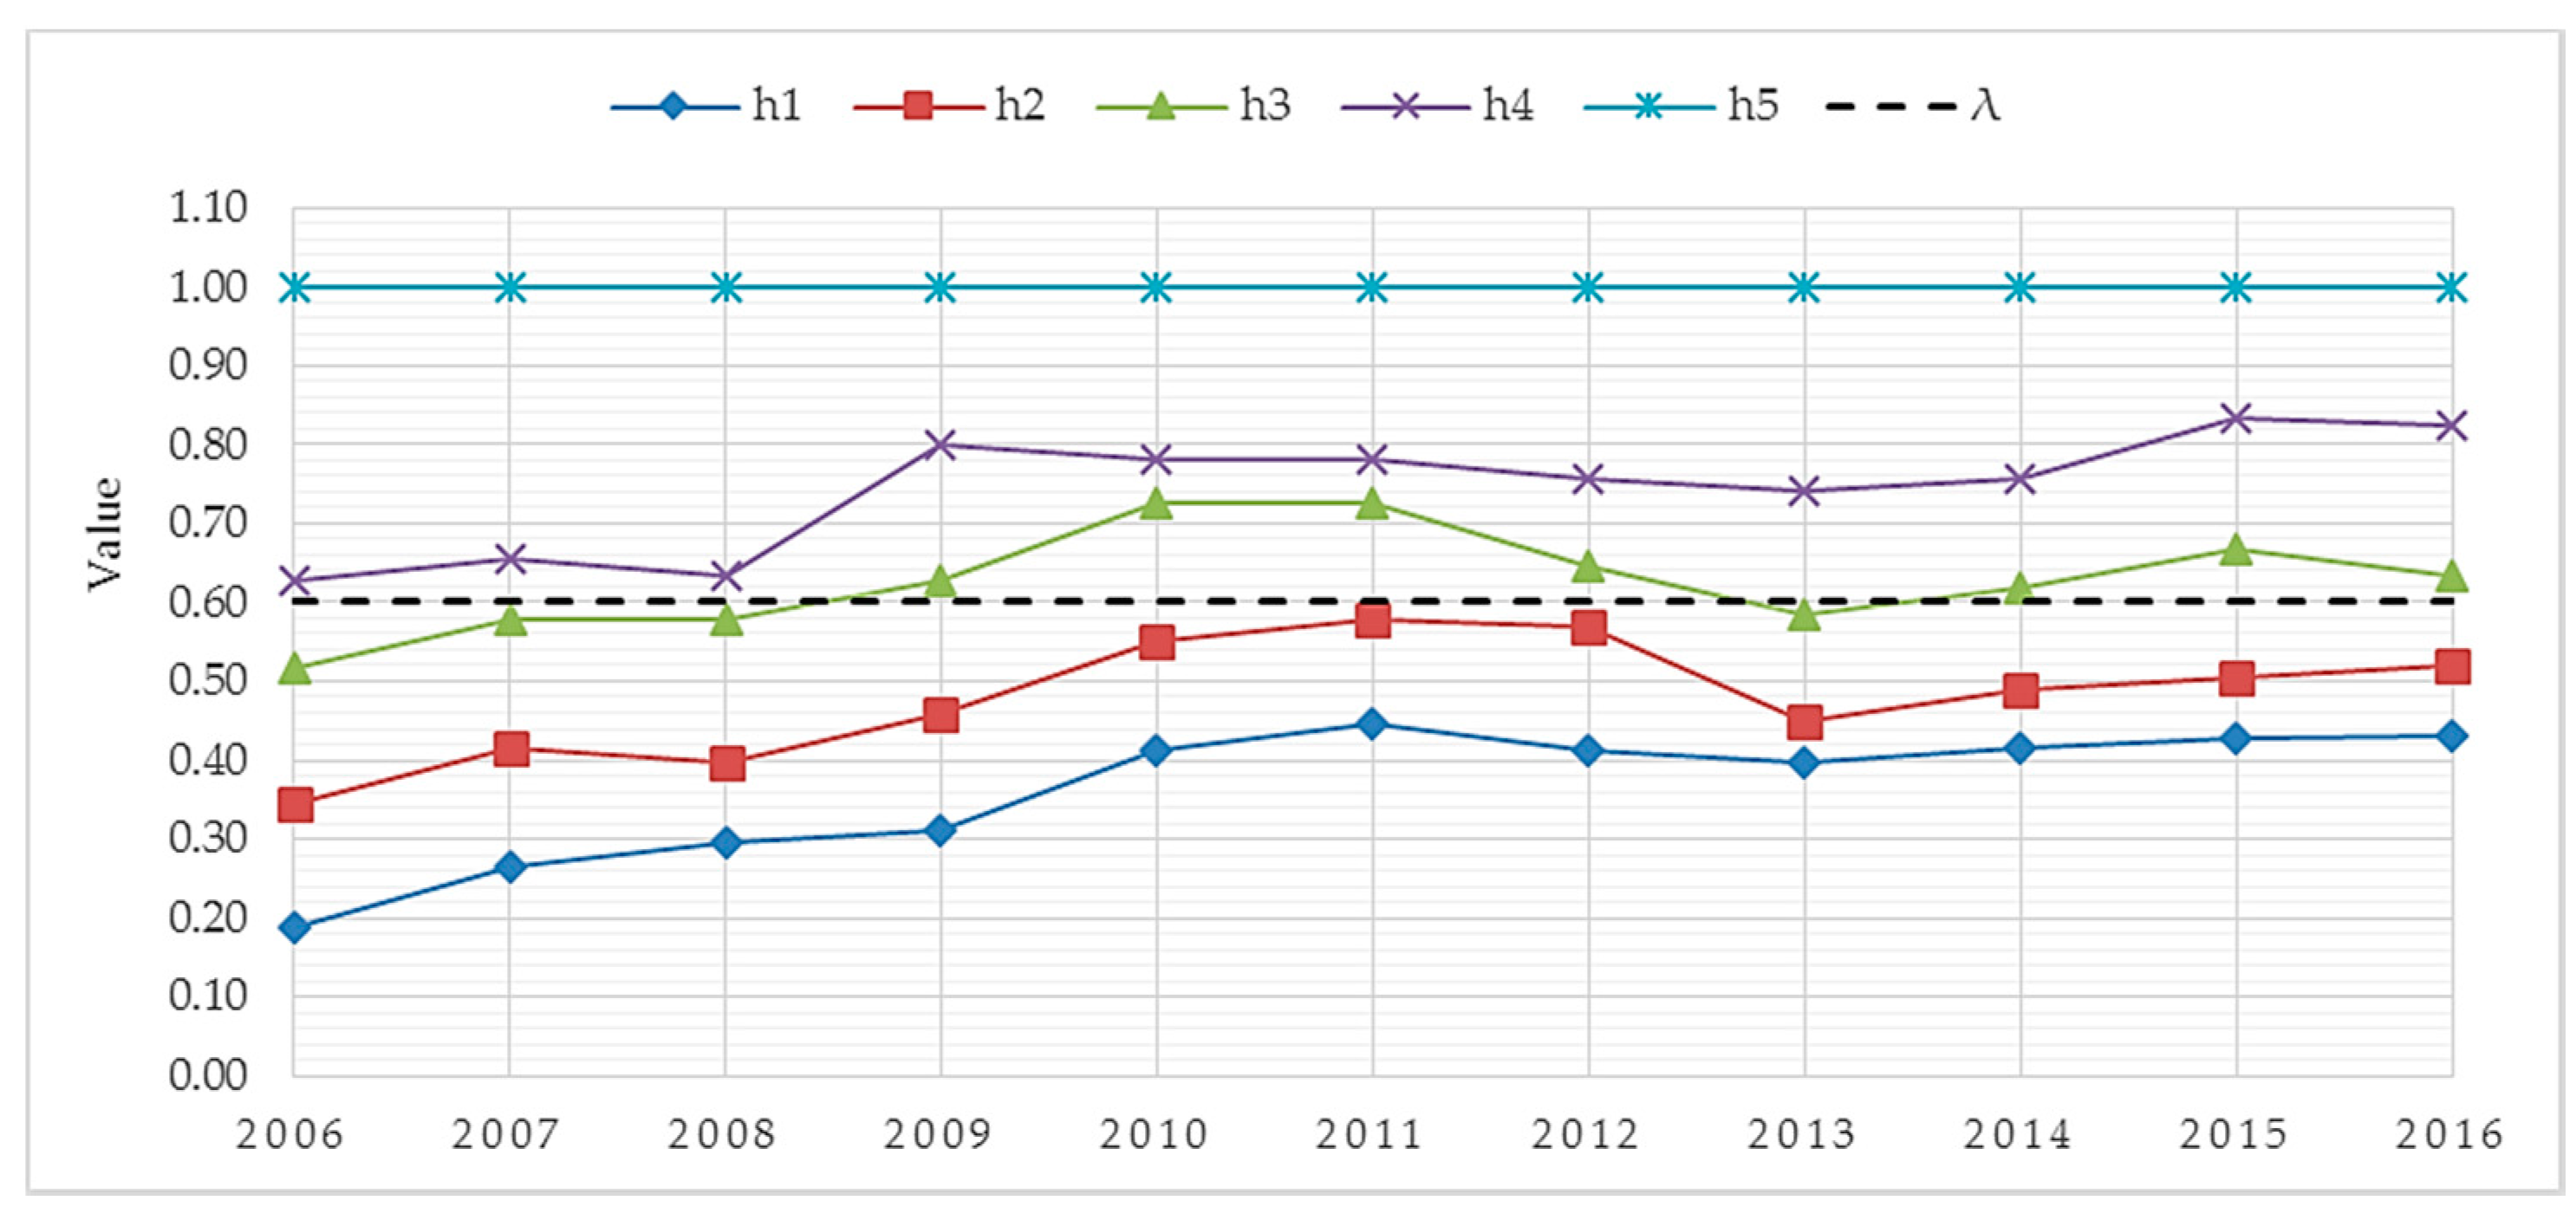
3.2. Comprehensive Evaluation of Water Resource Security in Luoyang
3.3. Evaluation of Every Subsystem
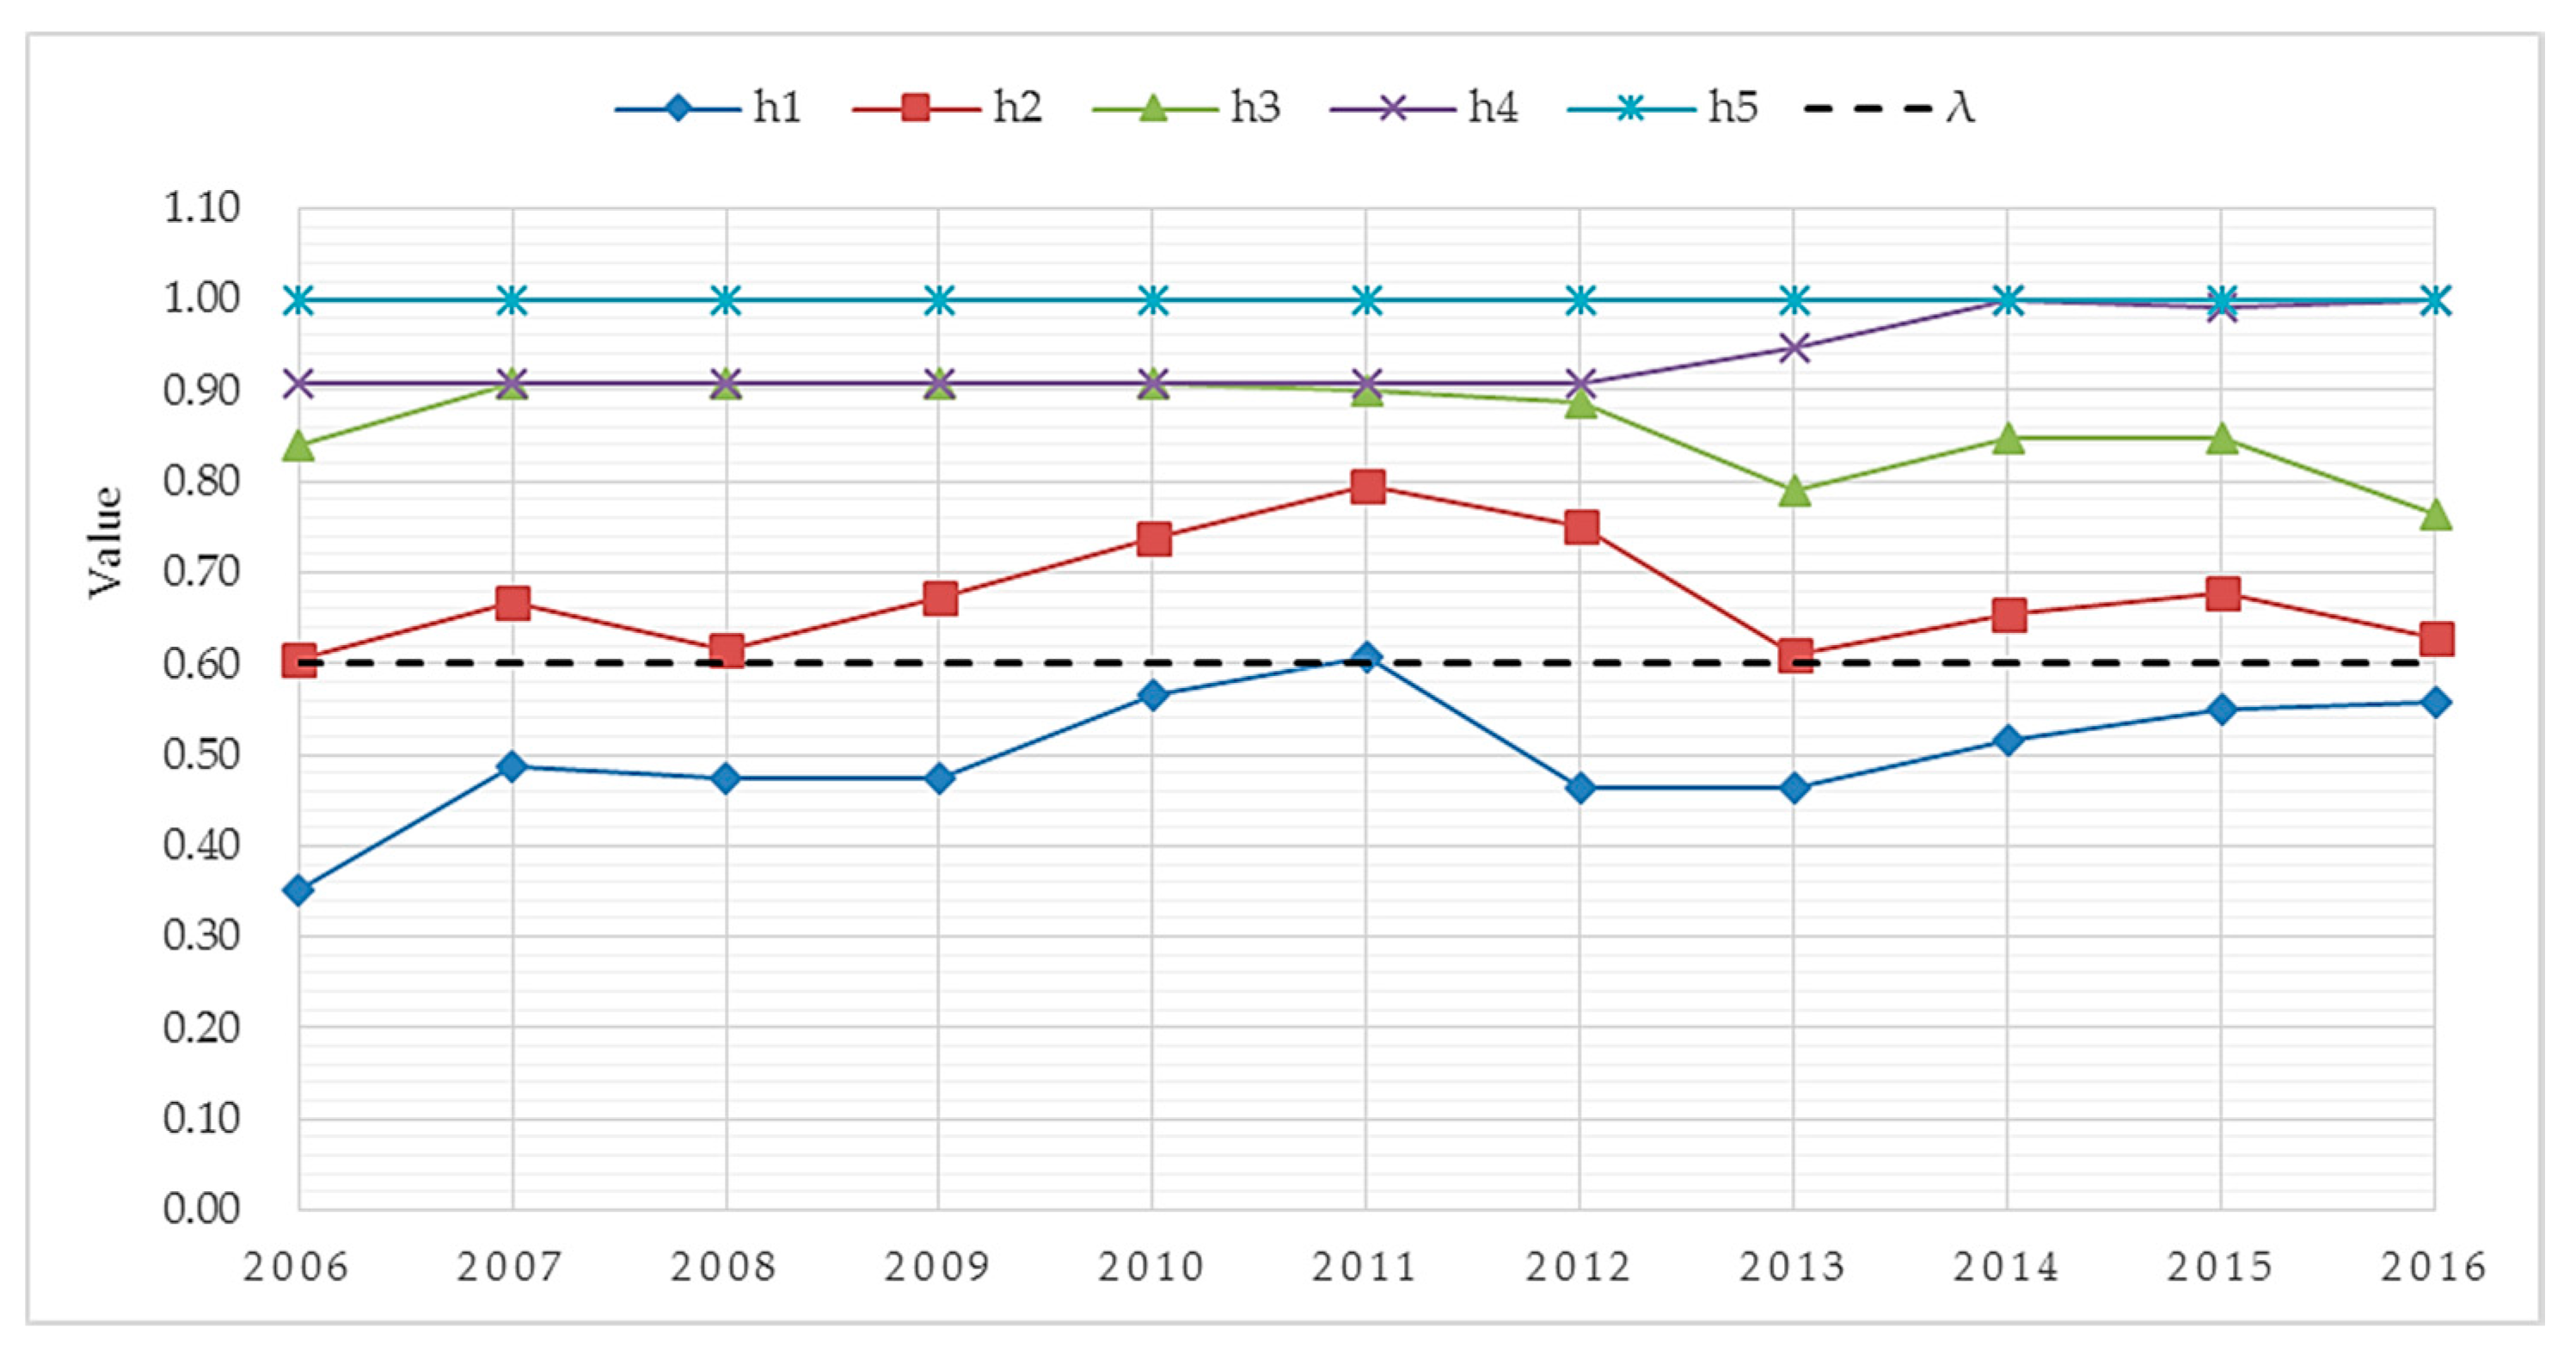
3.3.1. Evaluation of Pressure Subsystem
3.3.2. Evaluation of State Subsystem
3.3.3. Evaluation of Response Subsystem
4. Conclusions
- (1)
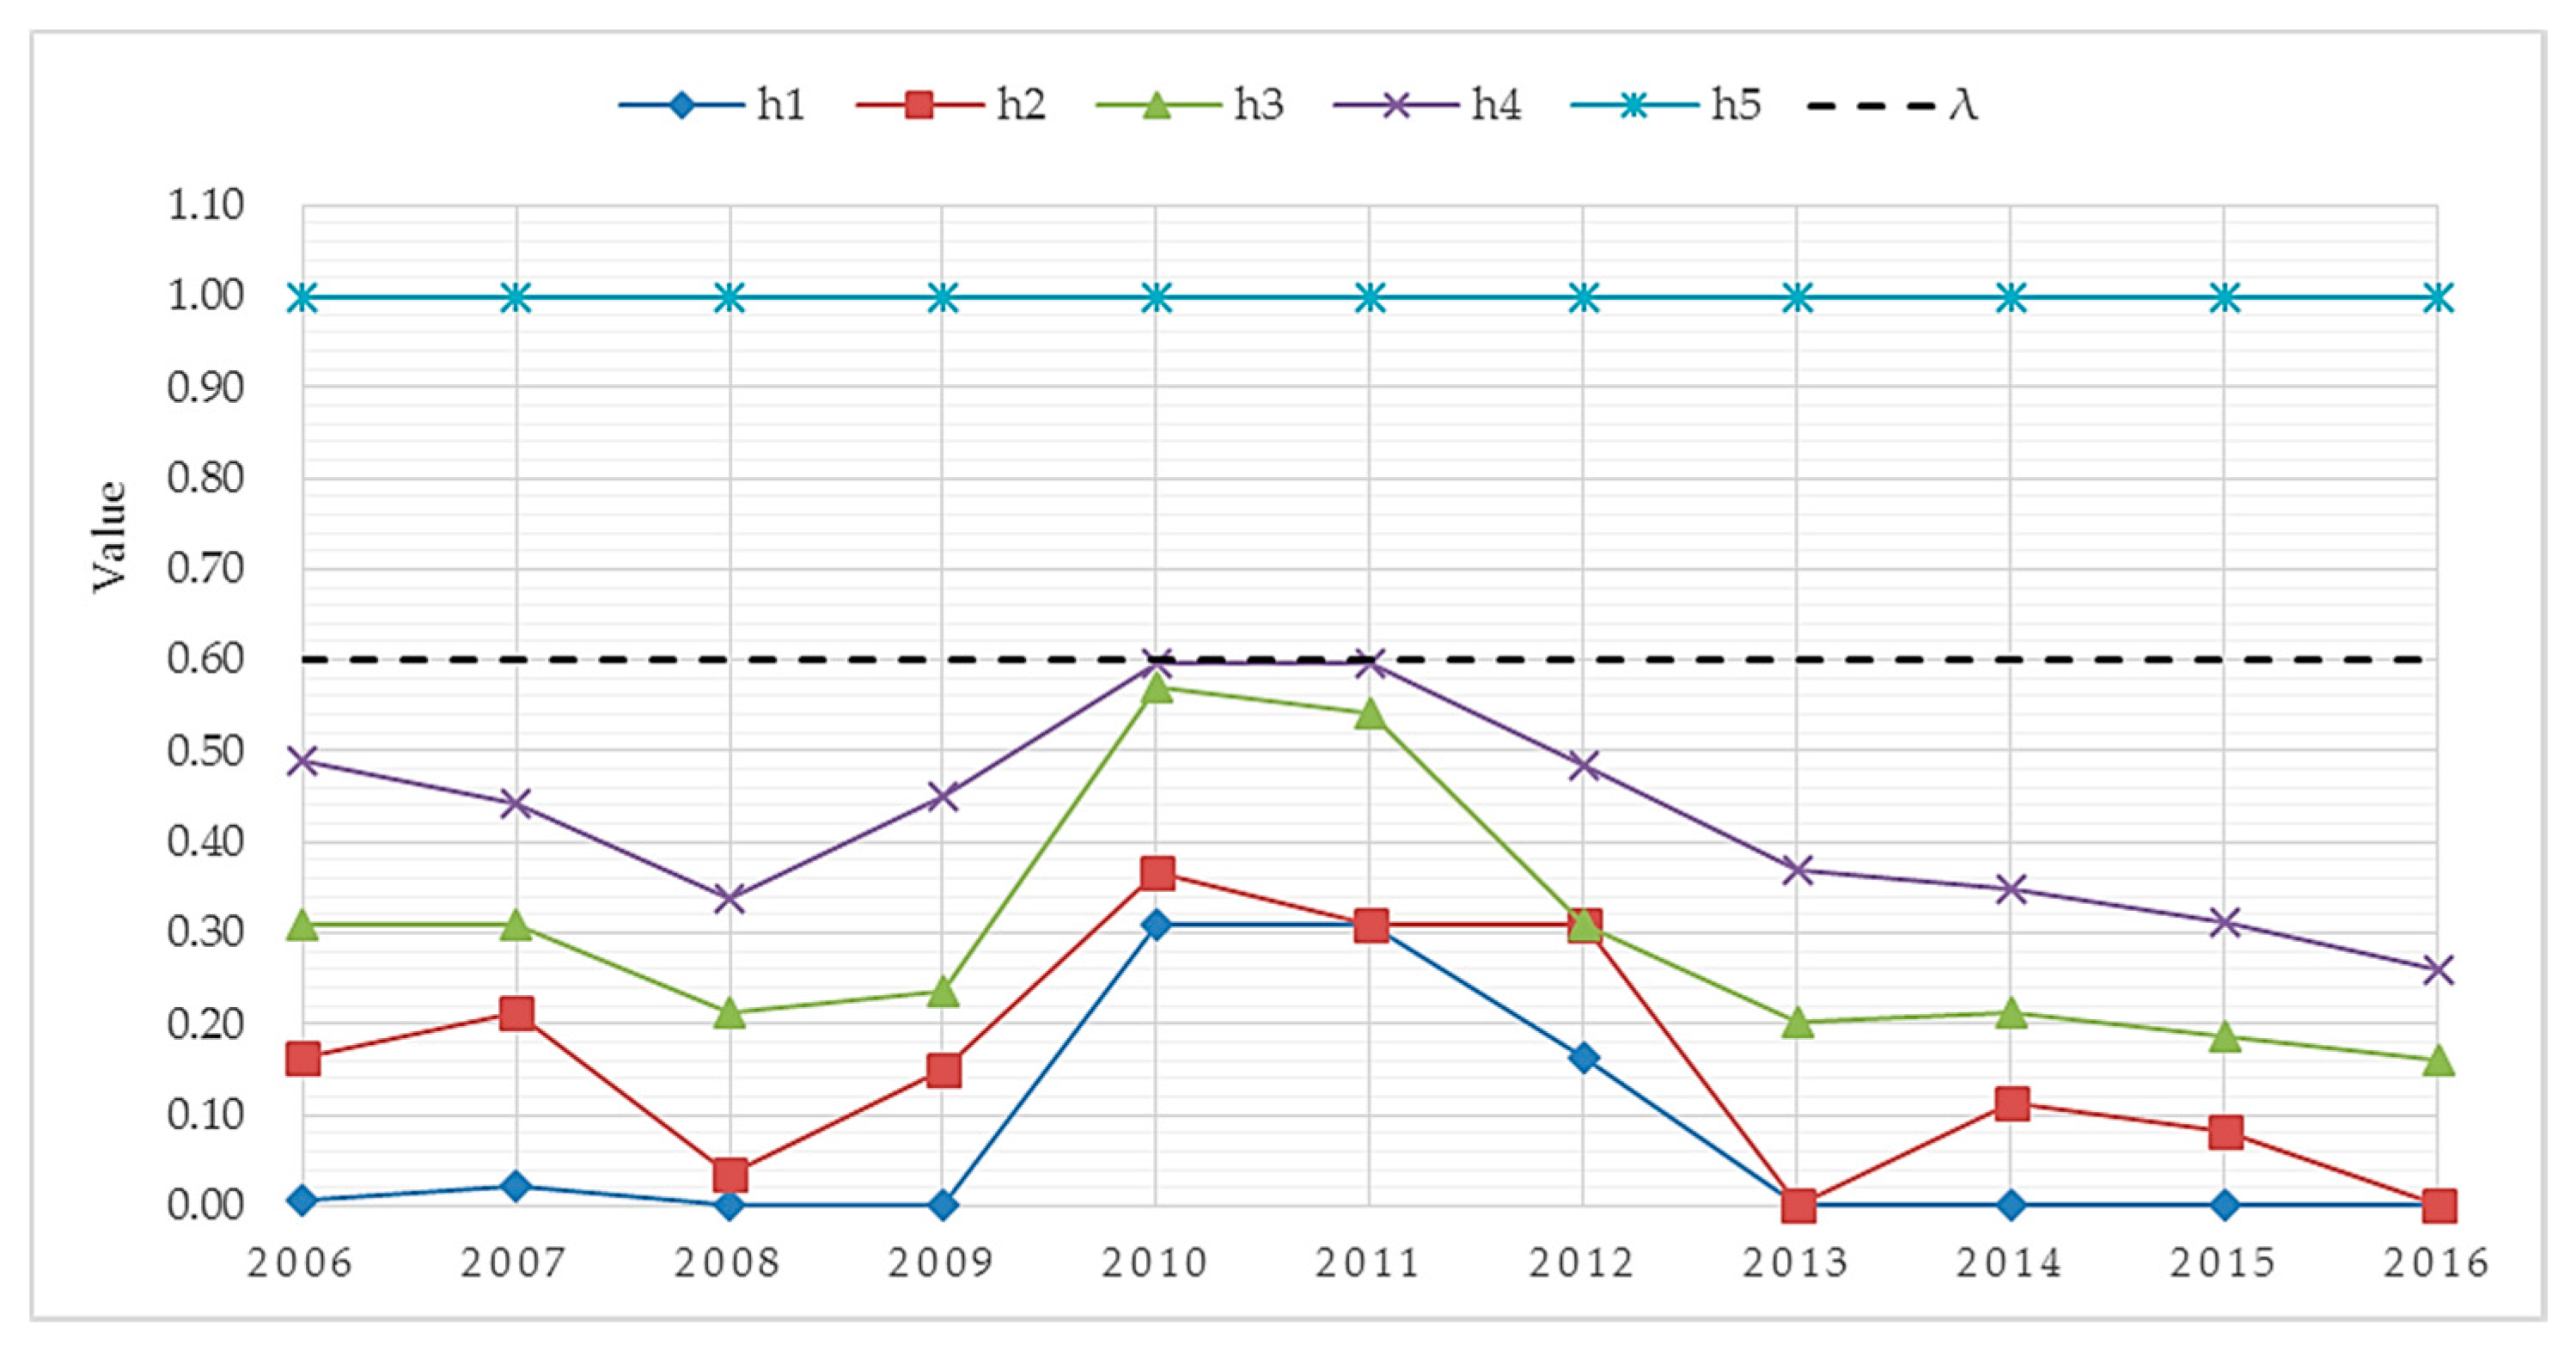
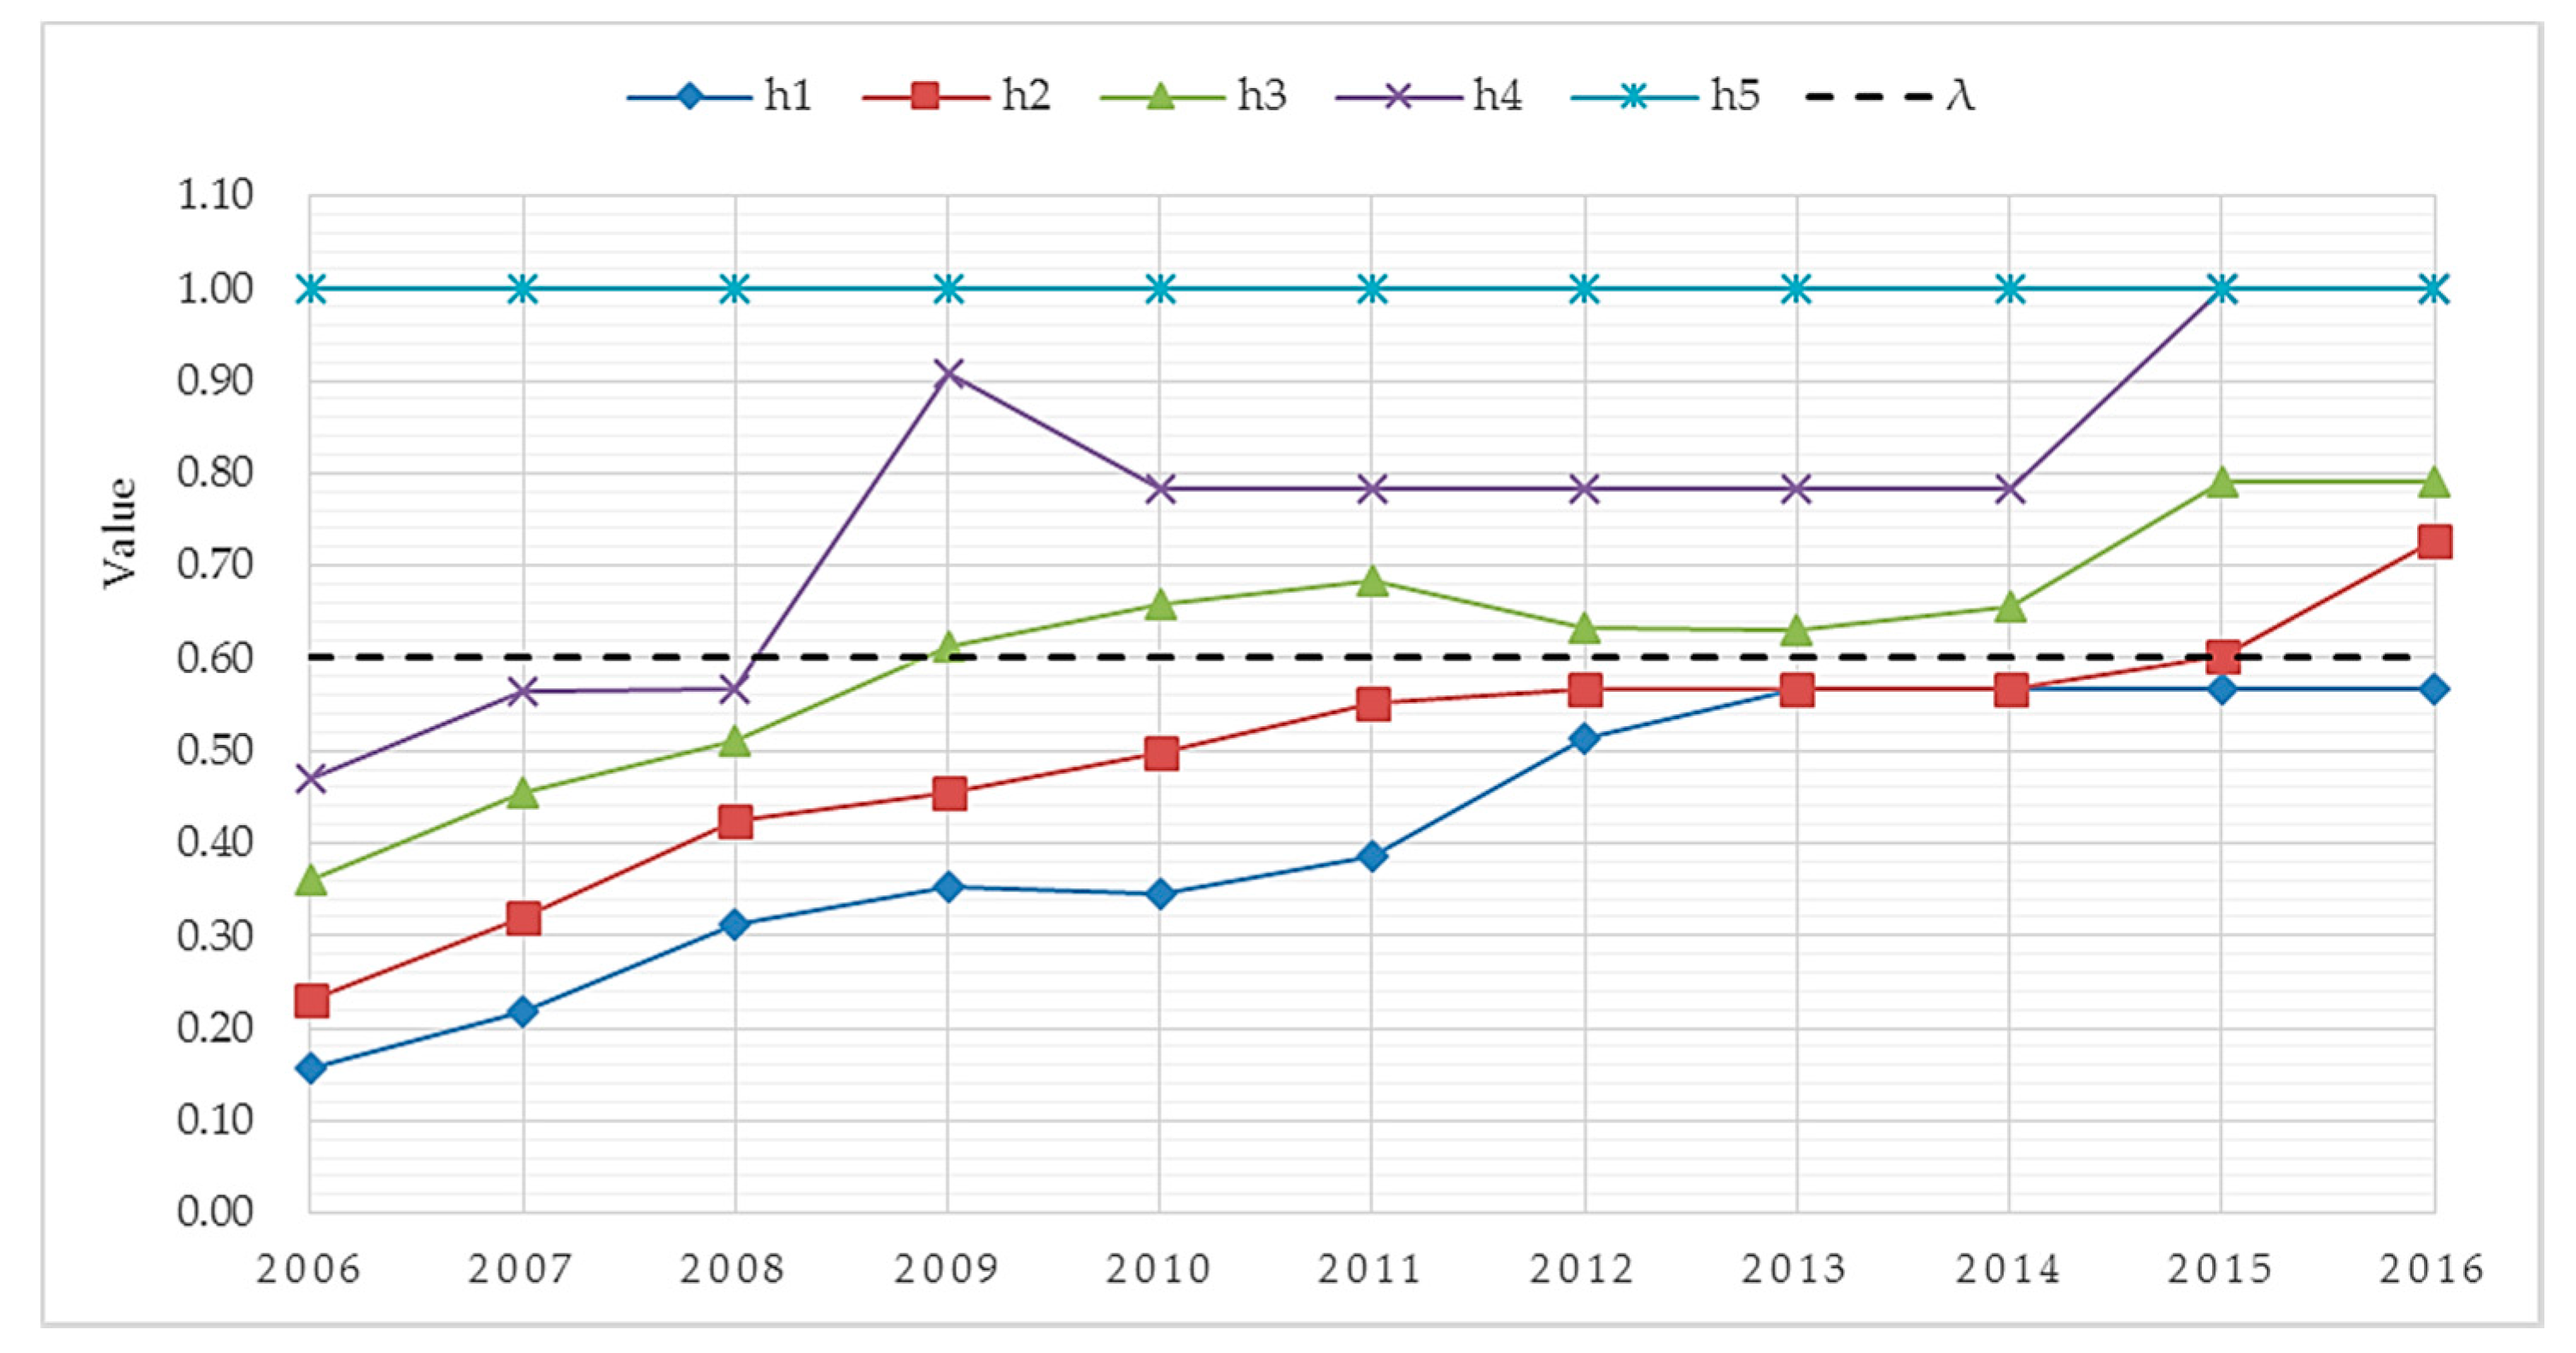
- In general, the water resource security situation in Luoyang has improved. From 2006 to 2008, Luoyang was graded at the Insecurity level, and the ranking was very close to being Critical Security for most of the years. This compares to a slightly improved grading of Critical Security level from 2009 to 2016 (except for 2013). However, the overall level of water resource security is still low.
- (2)
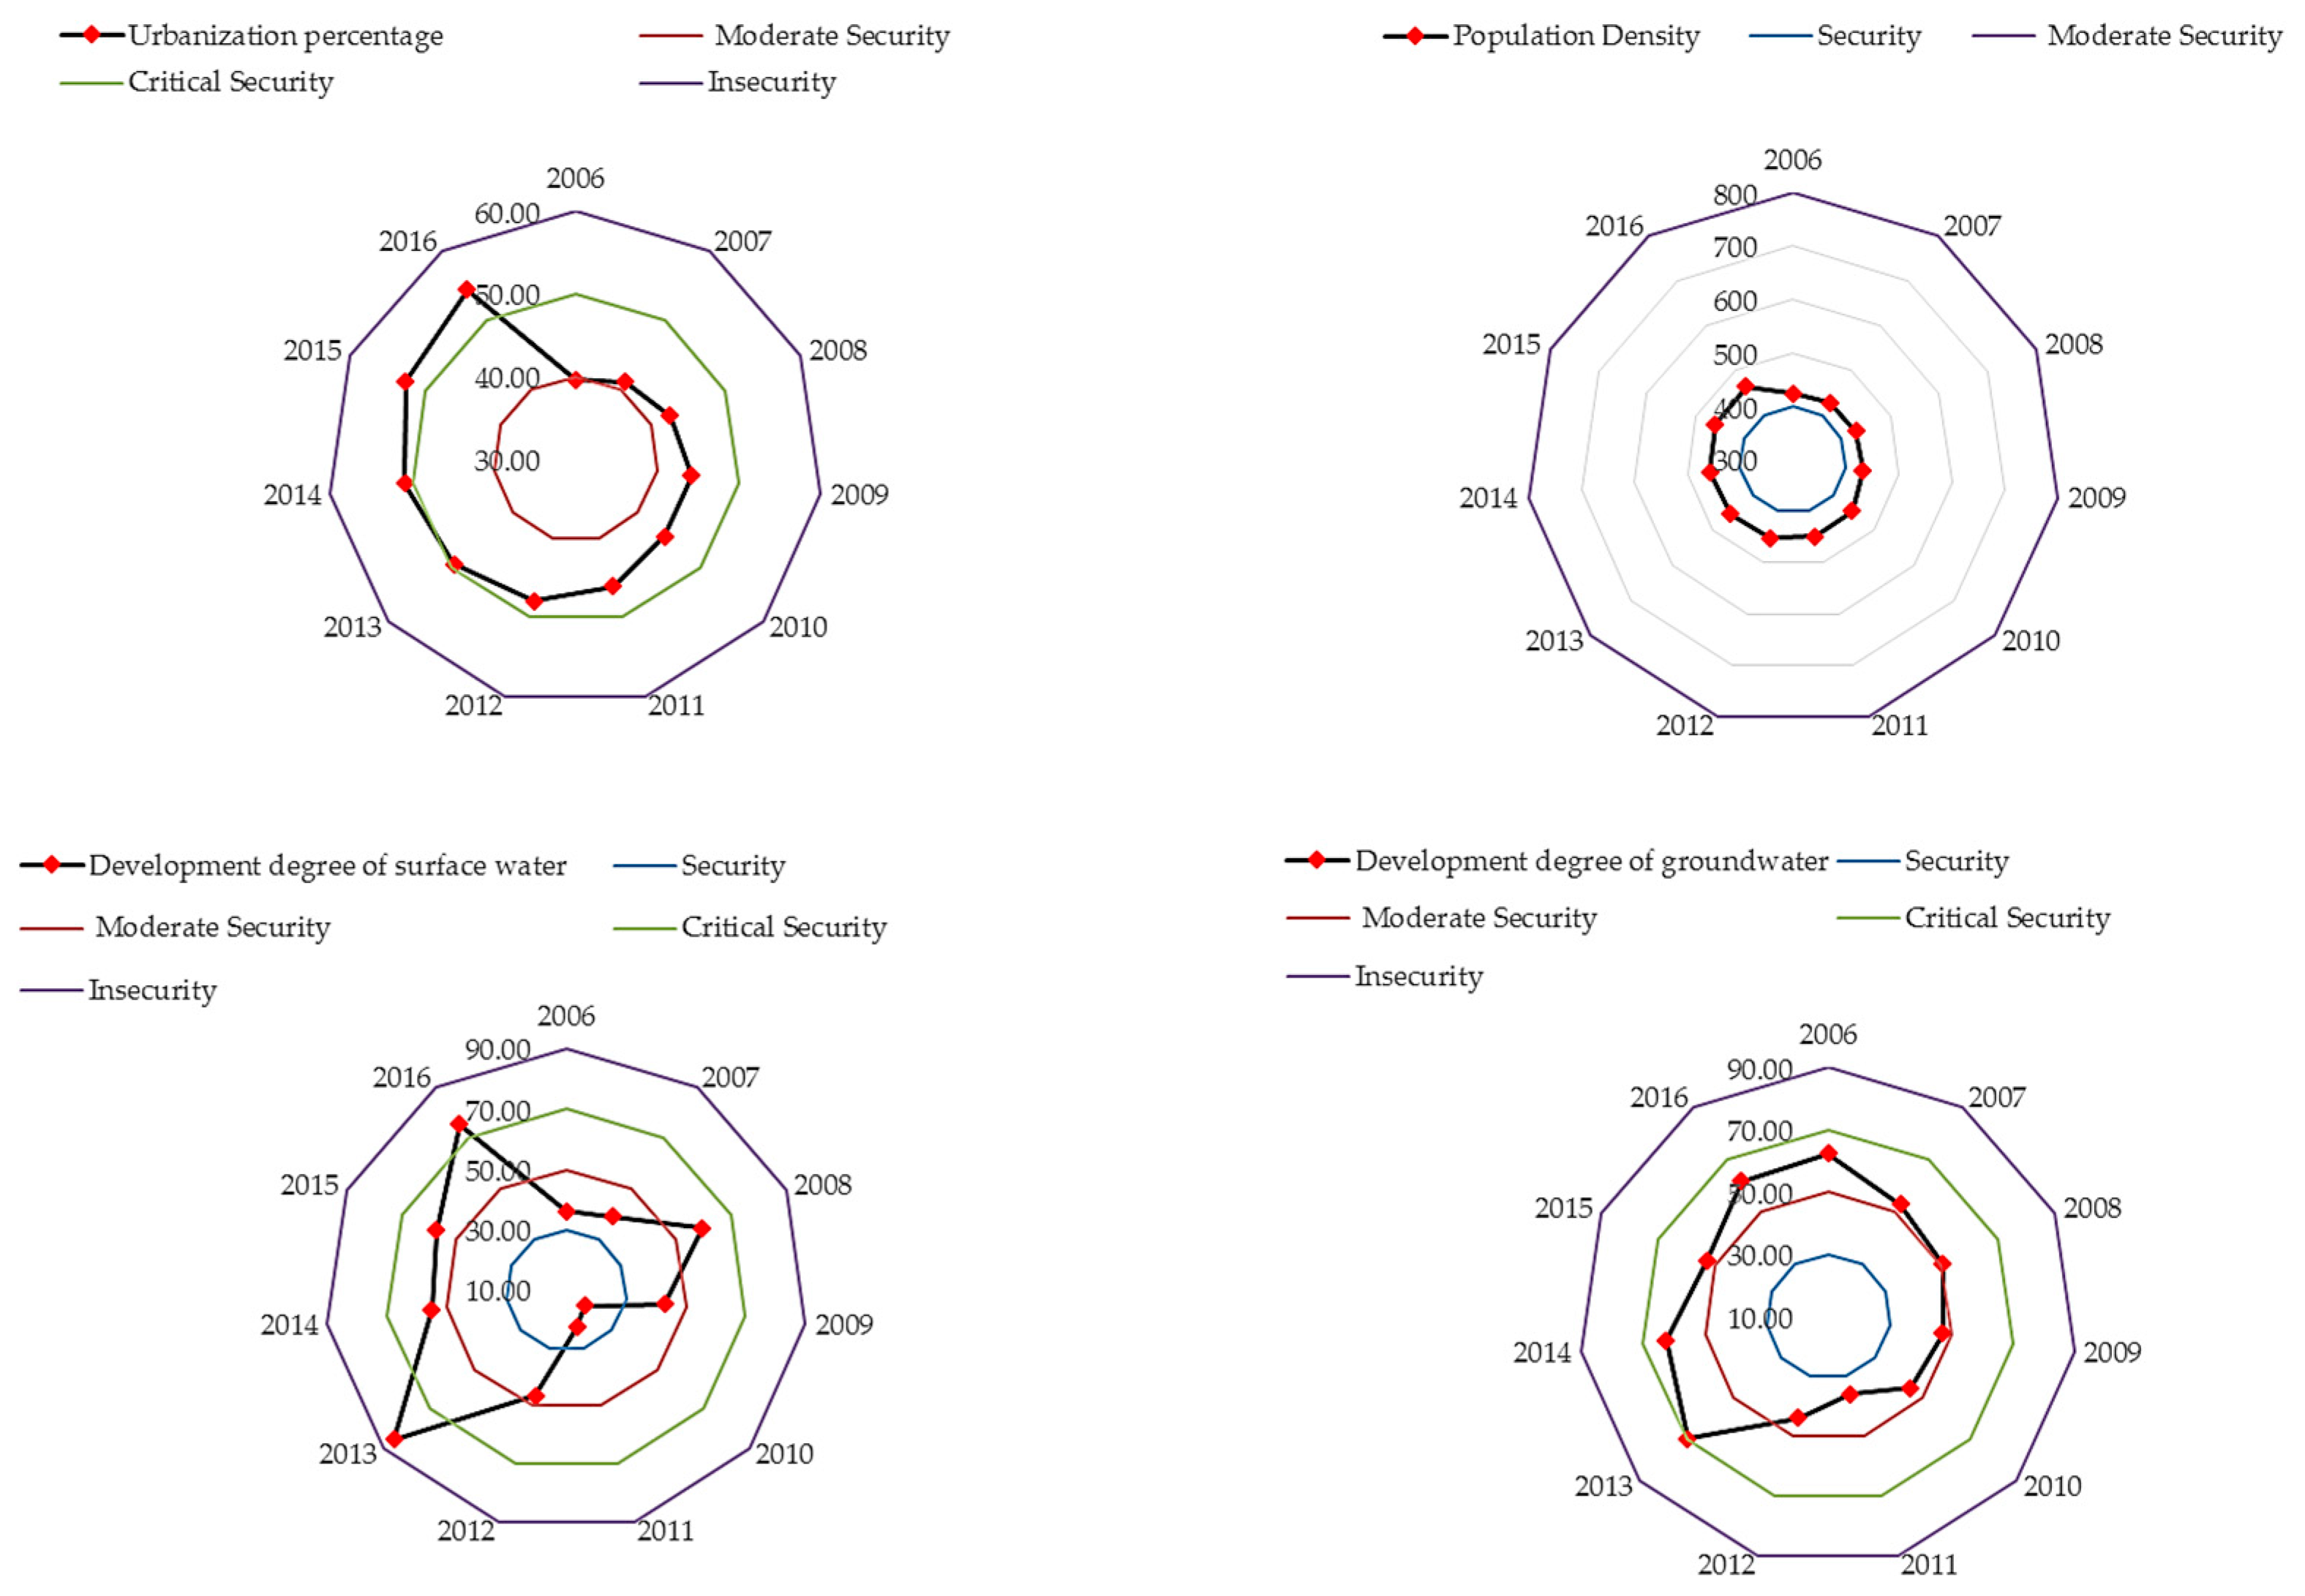
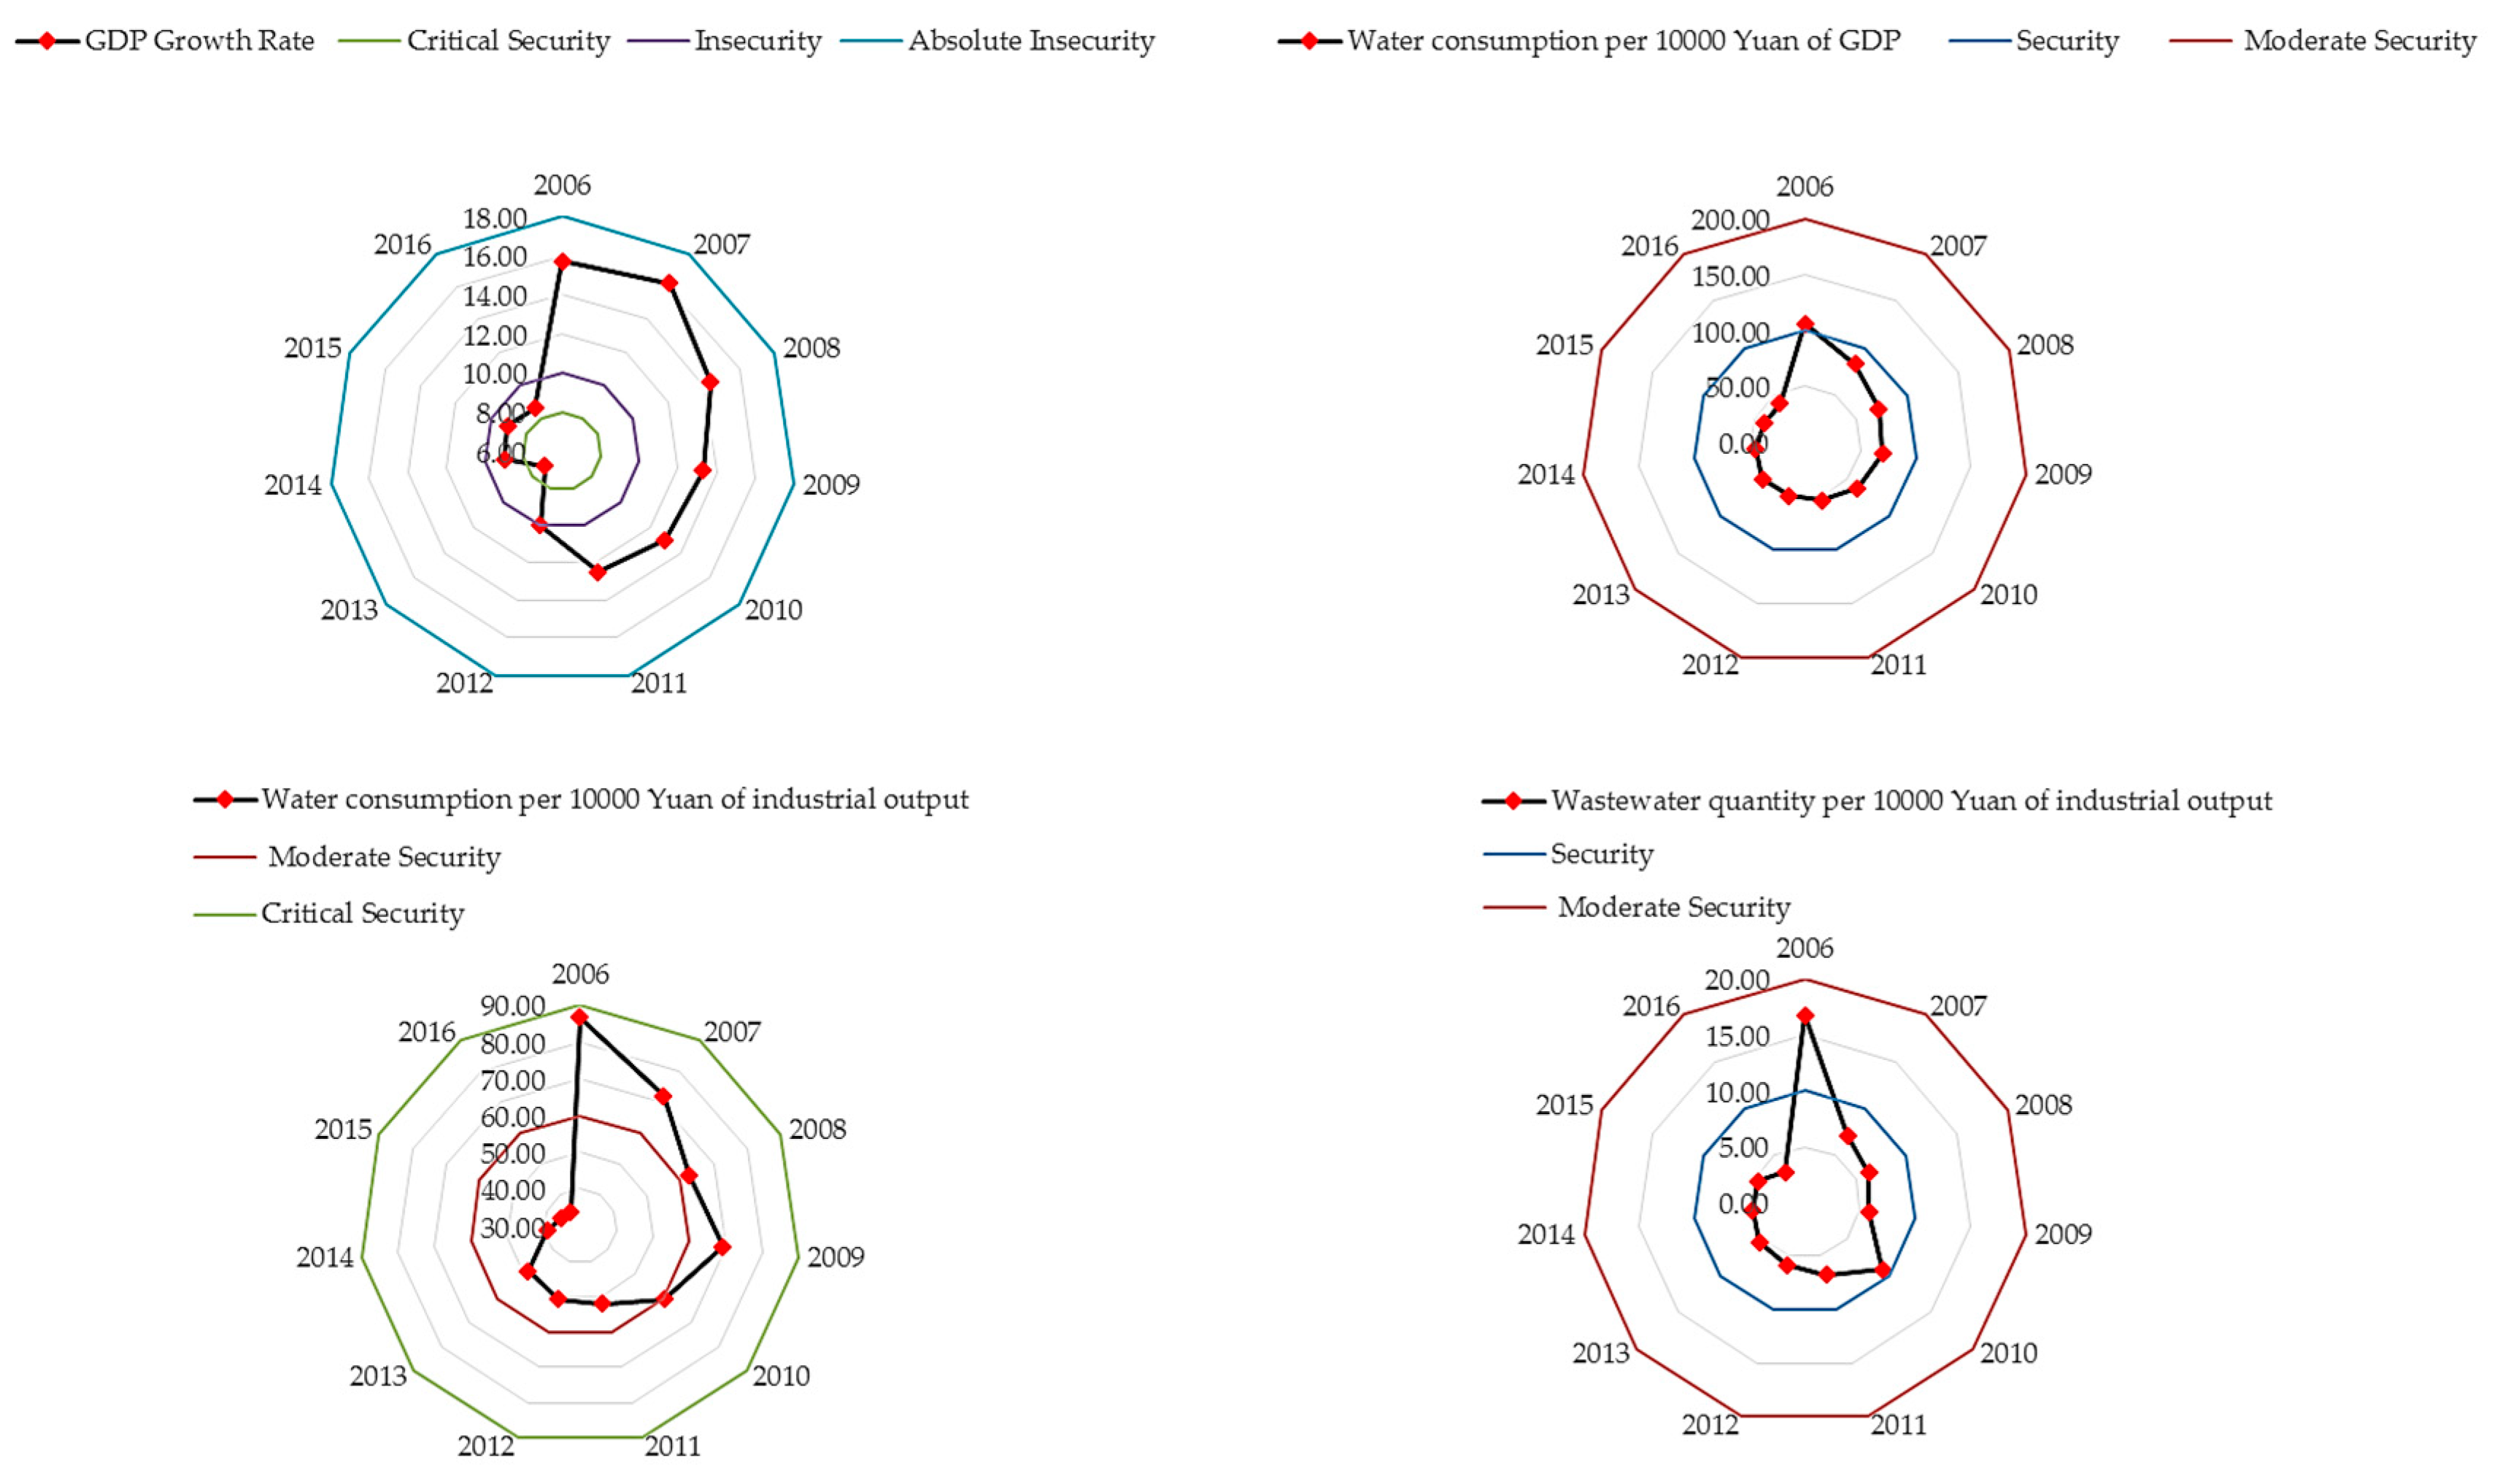
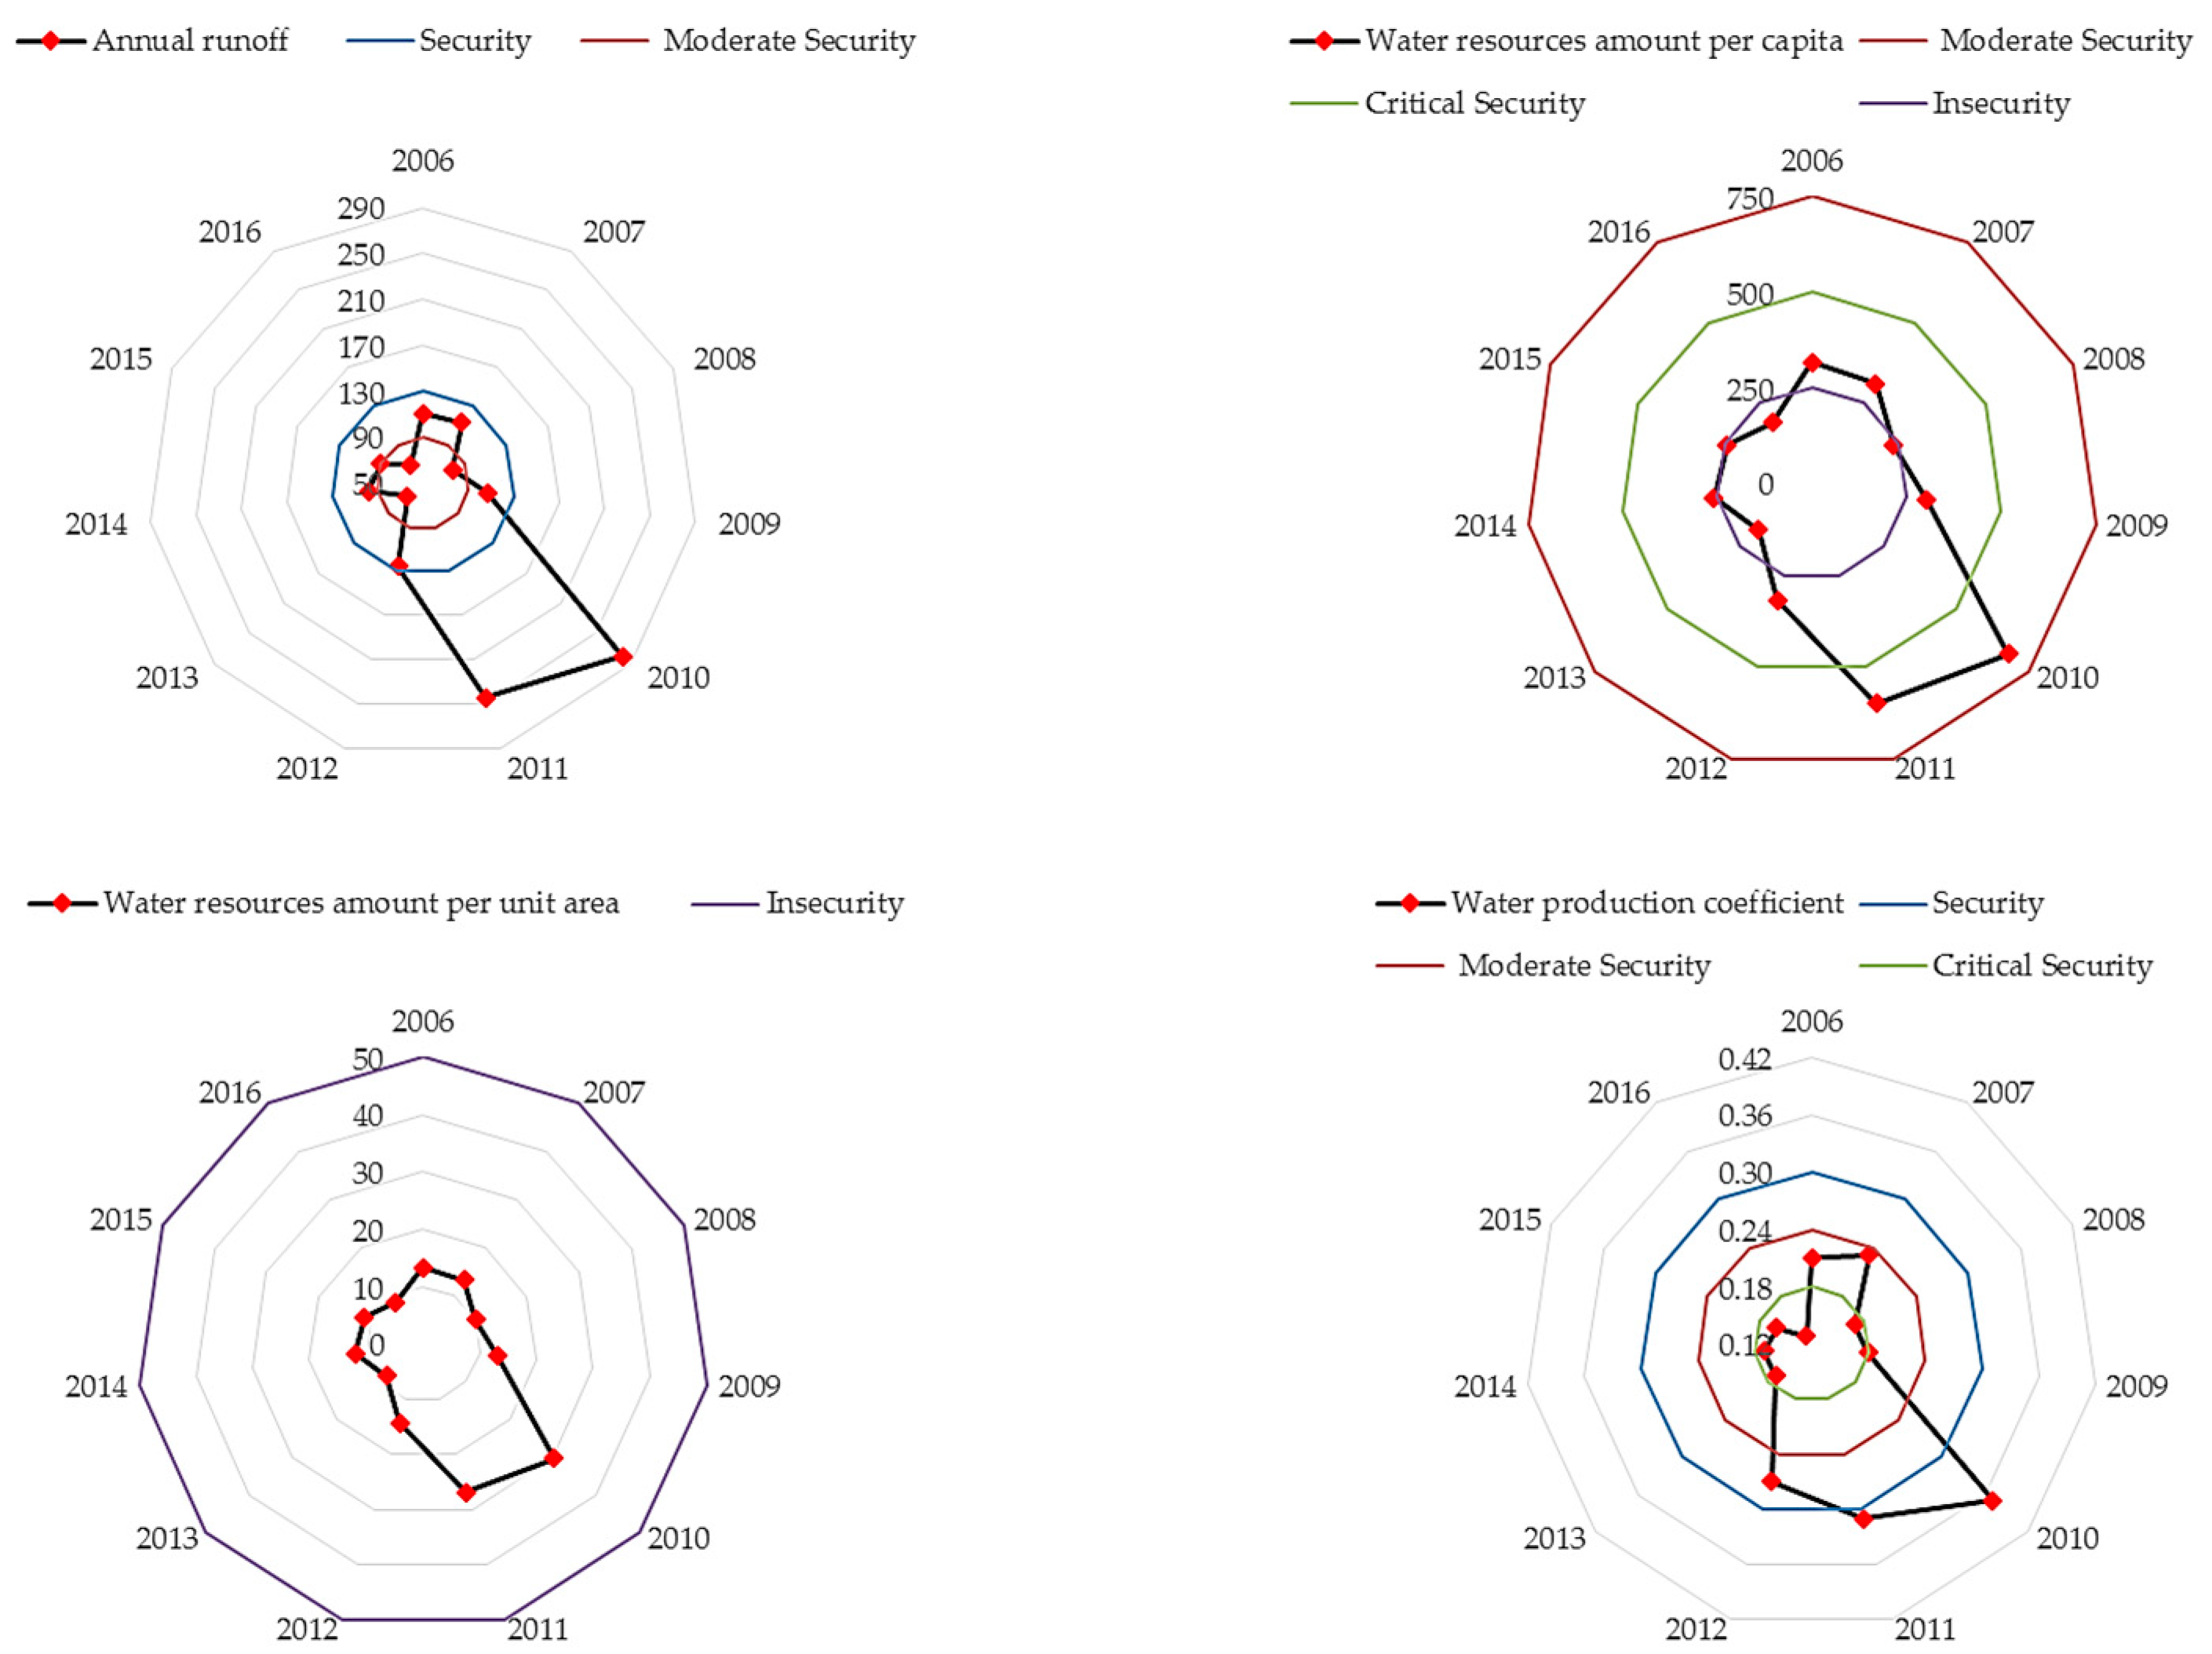
- From the evaluation results of each subsystem, we found that the response subsystem has the largest weight and develops in a safer direction. The pressure subsystem ranks second in weight. The pressure of water resource security increases because of urbanization and its negative influence on the development and utilization of water resources. Also, this pressure increases gradually. The state subsystem has the smallest weight. The state subsystem is mainly affected by climate change and tends to worsen.
- (3)
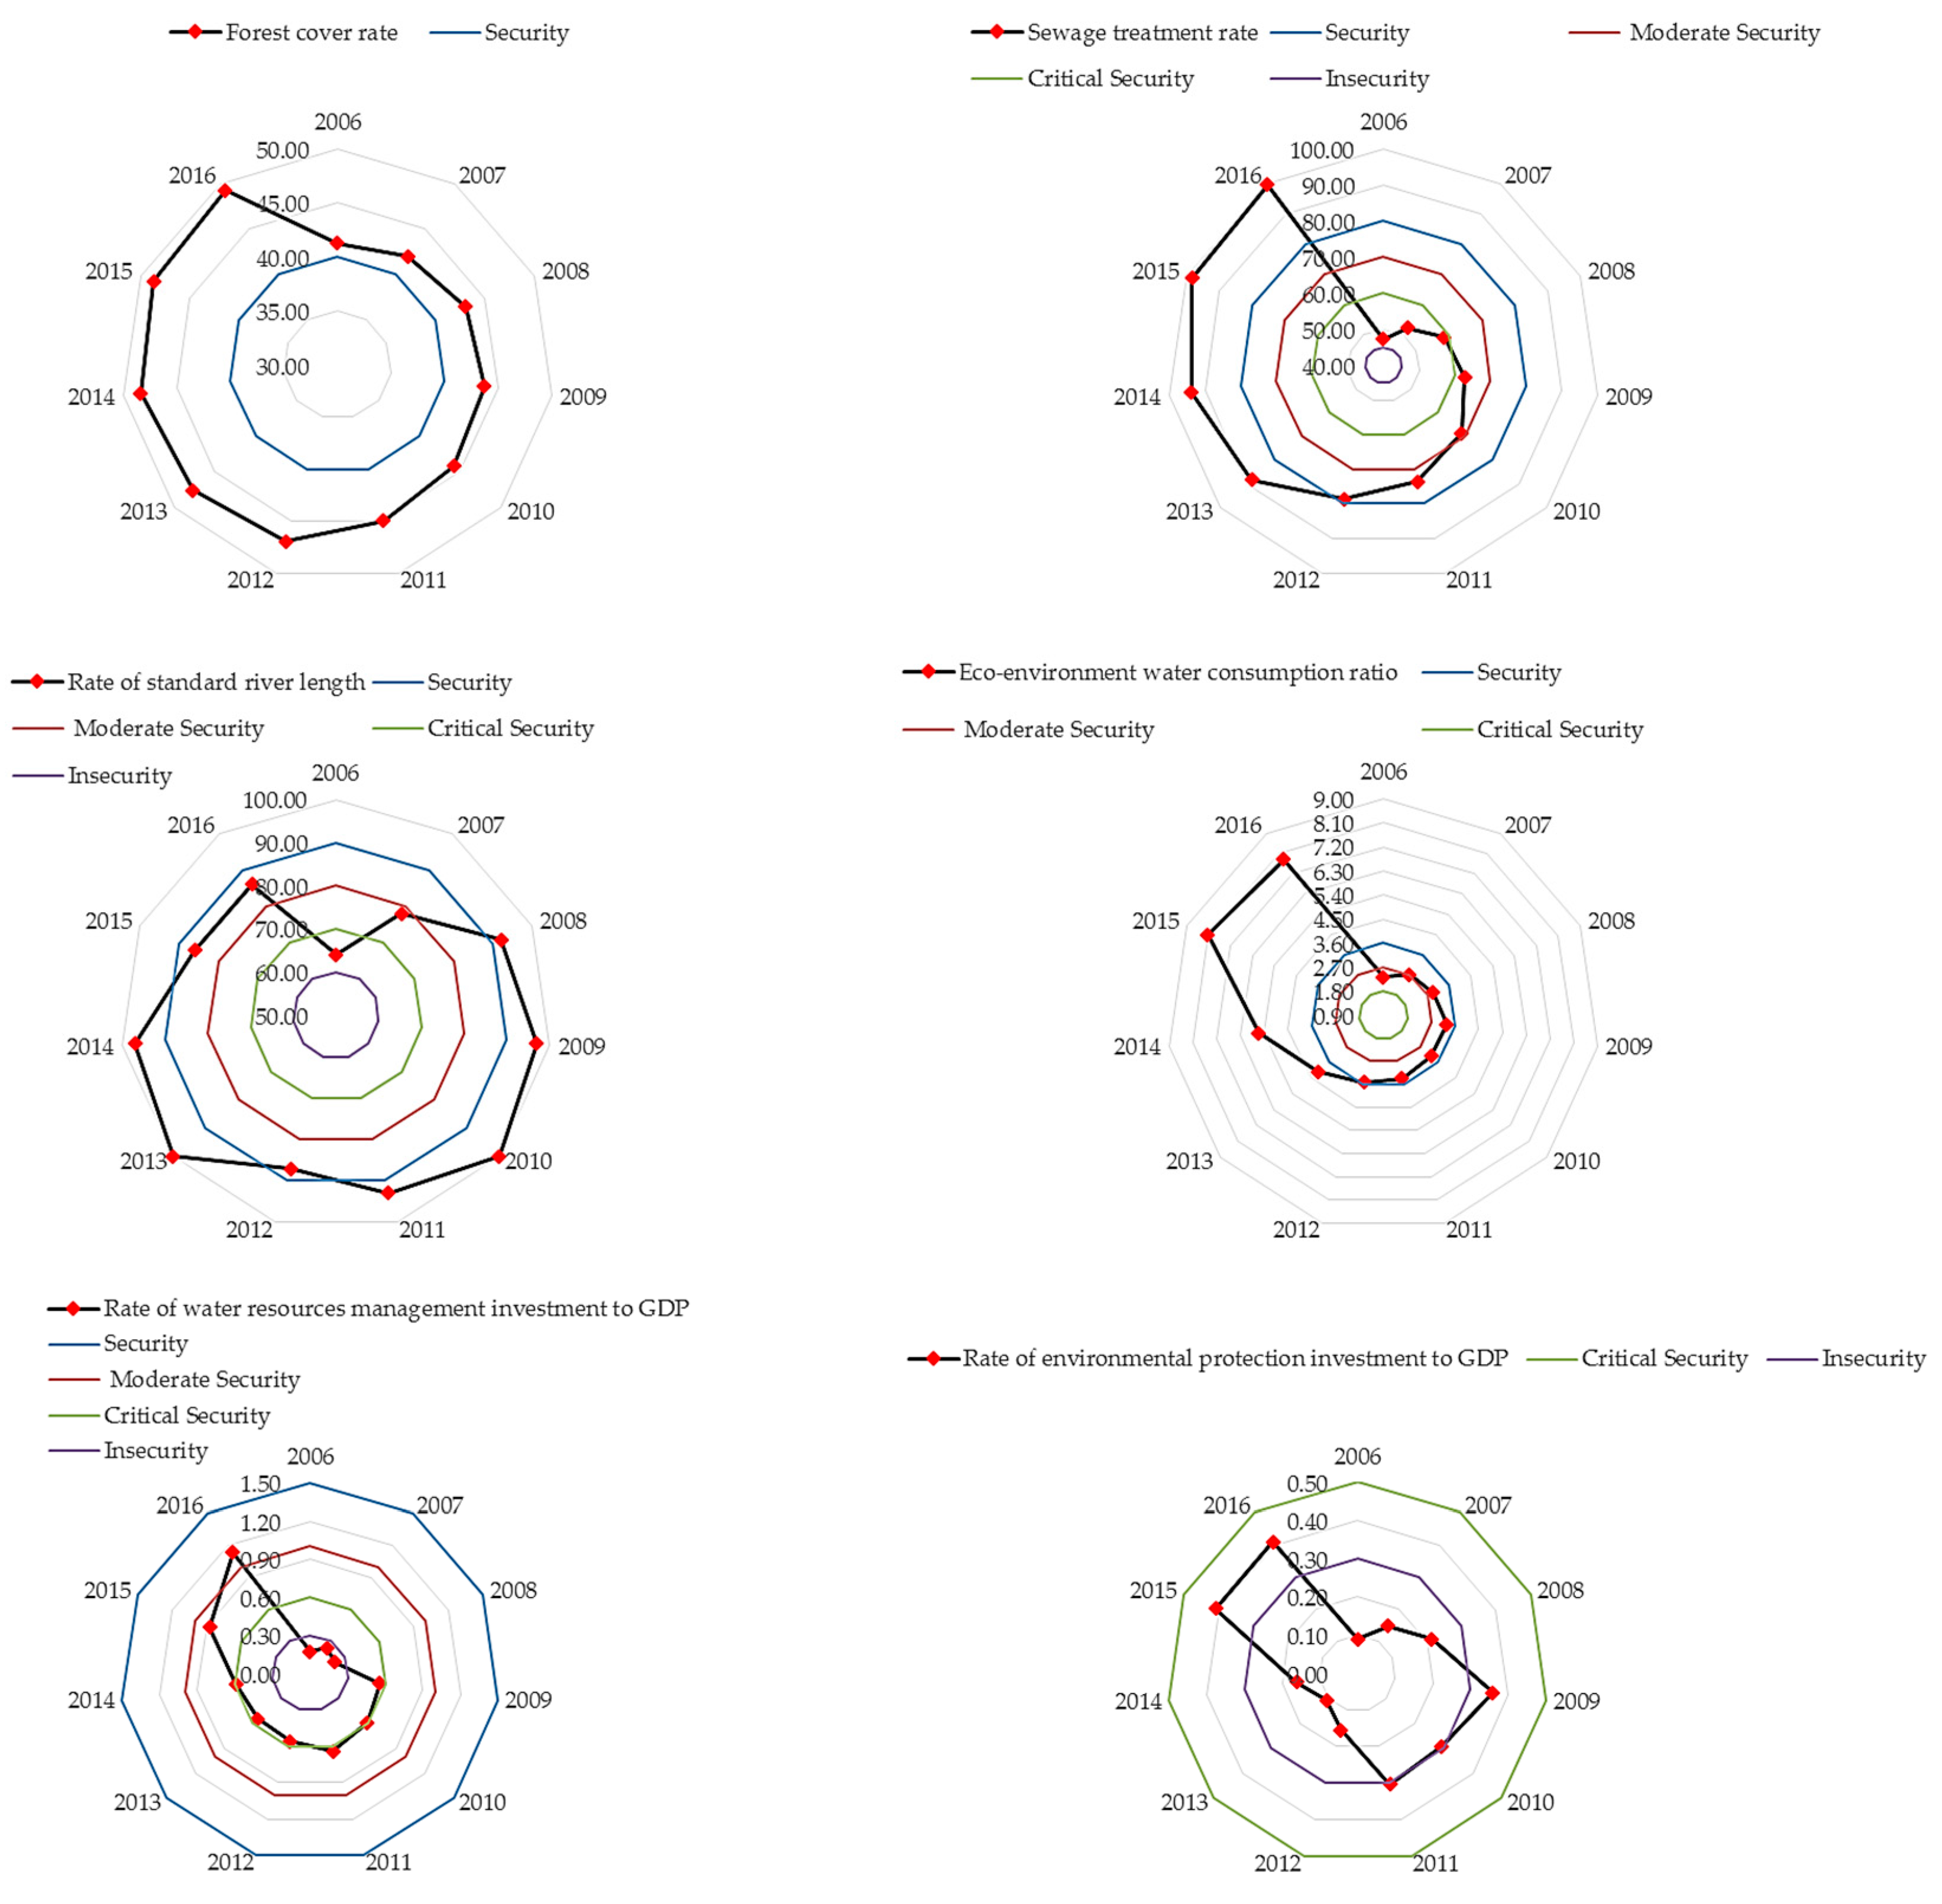
- From the perspective of the changes in various indexes, the social and economic development of Luoyang has gradually reduced the pressure on water resource consumption. Water quality and ecological protection have both improved significantly. However, the problem of shortages in terms of the quantity of water resources still poses a certain threat to water resource security.
- (4)
- The SPA method provides a new idea for the quantitative expression of the uncertain system and is not limited by the number of evaluation indicators. When combining the SPA method with the comprehensive weight method and the PSR model, the evaluation results reflect the sources of pressure on water resources and the efficiency of response measures. These methods can also be applied to water quality assessment, environmental assessment, disaster assessment, water cycle health assessment, etc., and have valuable application prospects.
Author Contributions
Funding
Conflicts of Interest
References
- Grant, S.B.; Saphores, J.-D.; Feldman, D.L.; Hamilton, A.J.; Fletcher, T.D.; Cook, P.L.M.; Stewardson, M.; Sanders, B.F.; Levin, L.A.; Ambrose, R.F.; et al. Taking the “waste” out of “wastewater” for human water security and ecosystem sustainability. Science 2012, 337, 681–686. [Google Scholar] [CrossRef] [PubMed]
- Bakker, K. Water security: Research challenges and opportunities. Science 2012, 337, 914–915. [Google Scholar] [CrossRef] [PubMed]
- Cook, C.; Bakker, K. Water security: Debating an emerging paradigm. Glob. Environ. Chang.-Hum. Policy Dimens. 2012, 22, 94–102. [Google Scholar] [CrossRef]
- Voeroesmarty, C.J.; McIntyre, P.B.; Gessner, M.O.; Dudgeon, D.; Prusevich, A.; Green, P.; Glidden, S.; Bunn, S.E.; Sullivan, C.A.; Liermann, C.R.; et al. Global threats to human water security and river biodiversity. Nature 2010, 467, 555–561. [Google Scholar] [CrossRef] [PubMed]
- Bogardi, J.J.; Dudgeon, D.; Lawford, R.; Flinkerbusch, E.; Meyn, A.; Pahl-Wostl, C.; Vielhauer, K.; Voeroesmarty, C. Water security for a planet under pressure: Interconnected challenges of a changing world call for sustainable solutions. Curr. Opin. Environ. Sustain. 2012, 4, 35–43. [Google Scholar] [CrossRef]
- Gerlak, A.K.; Mukhtarov, F. ‘Ways of knowing’ water: Integrated water resources management and water security as complementary discourses. Int. Environ. Agreem.-Polit. Law Econ. 2015, 15, 257–272. [Google Scholar] [CrossRef]
- Chen, Z.; Wei, S. Application of system dynamics to water security research. Water Resour. Manag. 2014, 28, 287–300. [Google Scholar] [CrossRef]
- Xia, J.; Zhu, Y. The measurement of water resources security: A study and challenge on water resources carrying capacity. J. Nat. Resour. 2002, 17, 262–269. [Google Scholar]
- Chen, Z.; Li, G.; Tan, X. Study on concept and future strategic demonstration of water resources security in east China coastal cities. Water Resour. Prot. 2017, 33, 38–46. [Google Scholar]
- Tao, T.; Xin, K. A sustainable plan for China's drinking water. Nature 2014, 511, 527–528. [Google Scholar] [CrossRef] [PubMed]
- Chen, Y.; He, L.; Lu, H.; Li, J.; Ren, L. Planning for regional water system sustainability through water resources security assessment under uncertainties. Water Resour. Manag. 2018, 32, 3135–3153. [Google Scholar] [CrossRef]
- Roach, T.; Kapelan, Z.; Ledbetter, R. A resilience-based methodology for improved water resources adaptation planning under deep uncertainty with real world application. Water Resour. Manag. 2018, 32, 2013–2031. [Google Scholar] [CrossRef]
- Molinos-Senante, M.; Mocholi-Arce, M.; Sala-Garrido, R. Estimating the environmental and resource costs of leakage in water distribution systems: A shadow price approach. Sci. Total Environ. 2016, 568, 180–188. [Google Scholar] [CrossRef] [PubMed]
- Wang, X.-J.; Zhang, J.-Y.; Shahid, S.; Guan, E.-H.; Wu, Y.-X.; Gao, J.; He, R.-M. Adaptation to climate change impacts on water demand. Mitig. Adapt. Strat. Glob. Chang. 2016, 21, 81–99. [Google Scholar] [CrossRef]
- Sullivan, C.A. Quantifying water vulnerability: A multi-dimensional approach. Stoch. Environ. Res. Risk Assess. 2011, 25, 627–640. [Google Scholar] [CrossRef]
- Manandhar, S.; Pandey, V.P.; Kazama, F. Application of water poverty index (WPI) in Nepalese context: A case study of Kali Gandaki River Basin (KGRB). Water Resour. Manag. 2012, 26, 89–107. [Google Scholar] [CrossRef]
- Wilk, J.; Jonsson, A.C. From water poverty to water prosperity-a more participatory approach to studying local water resources management. Water Resour. Manag. 2013, 27, 695–713. [Google Scholar] [CrossRef]
- Gunda, T.; Benneyworth, L.; Burchfield, E. Exploring water indices and associated parameters: A case study approach. Water Policy 2015, 17, 98–111. [Google Scholar] [CrossRef]
- Gain, A.K.; Giupponi, C.; Wada, Y. Measuring global water security towards sustainable development goals. Environ. Res. Lett. 2016, 11. [Google Scholar] [CrossRef]
- Lautze, J.; Manthrithilake, H. Water security: Old concepts, new package, what value? Nat. Resour. Forum 2012, 36, 76–87. [Google Scholar] [CrossRef]
- Wang, X.; Cui, Q.; Li, S. An optimal water allocation model based on water resources security assessment and its application in Zhangjiakou Region, northern China. Resour. Conserv. Recycl. 2012, 69, 57–65. [Google Scholar] [CrossRef]
- Liu, K.K.; Li, C.H.; Cai, Y.P.; Xu, M.; Xia, X.H. Comprehensive evaluation of water resources security in the Yellow River Basin based on a fuzzy multi-attribute decision analysis approach. Hydrol. Earth Syst. Sci. 2014, 18, 1605–1623. [Google Scholar] [CrossRef]
- Gao, Y.; Wang, H.; Xu, X.; Gao, X.; Shi, Q. Assessment of water resources security case of Quanzhou City in Fujian Province. J. Nat. Resour. 2012, 27, 204–214. [Google Scholar]
- Norman, E.S.; Dunn, G.; Bakker, K.; Allen, D.M.; de Albuquerque, R.C. Water security assessment: Integrating governance and freshwater indicators. Water Resour. Manag. 2013, 27, 535–551. [Google Scholar] [CrossRef]
- Su, Y.; Guan, D.; Su, W.; Gao, W. Integrated assessment and scenarios simulation of urban water security system in the southwest of China with system dynamics analysis. Water Sci. Technol. 2017, 76, 2255–2267. [Google Scholar] [CrossRef]
- Wang, D.; Borthwick, A.G.; He, H.; Wang, Y.; Zhu, J.; Lu, Y.; Xu, P.; Zeng, X.; Wu, J.; Wang, L.; et al. A hybrid wavelet de-noising and rank-set pair analysis approach for forecasting hydro-meteorological time series. Environ. Res. 2018, 160, 269–281. [Google Scholar] [CrossRef] [PubMed]
- Neri, A.C.; Dupin, P.; Sanchez, L.E. A pressure-state-response approach to cumulative impact assessment. J. Clean. Prod. 2016, 126, 288–298. [Google Scholar] [CrossRef]
- Sun, T.; Lin, W.; Chen, G.; Guo, P.; Zeng, Y. Wetland ecosystem health assessment through integrating remote sensing and inventory data with an assessment model for the Hangzhou Bay, China. Sci. Total Environ. 2016, 566, 627–640. [Google Scholar] [CrossRef] [PubMed]
- Wolfslehner, B.; Vacik, H. Evaluating sustainable forest management strategies with the analytic network process in a pressure-state-response framework. J. Environ. Manag. 2008, 88, 1–10. [Google Scholar] [CrossRef] [PubMed]
- Hambling, T.; Weinstein, P.; Slaney, D. A review of frameworks for developing environmental health indicators for climate change and health. Int. J. Environ. Res. Public Health 2011, 8, 2854–2875. [Google Scholar] [CrossRef] [PubMed]
- Wu, K.-Y.; Jin, J.-L.; Wei, Y.-M.; Zhang, H. Diagnosis assessment model of watershed water security based on index system. Acta Sci. Nat. Univ. Sunyatseni 2008, 47, 105–113. [Google Scholar]
- Zhang, J.-Y.; Wang, L.-C. Assessment of water resource security in Chongqing City of China: What has been done and what remains to be done? Nat. Hazards 2015, 75, 2751–2772. [Google Scholar] [CrossRef]
- Zhang, F.; Wang, L.; Su, W. The safety evaluation of water resources based on DPSIRM conceptual framework in karst region. China Environ. Sci. 2015, 35, 3511–3520. [Google Scholar]
- Luoyang Statistics Bureau. Luoyang Statistical Yearbook; China Statistics Press: Beijing, China, 2007.
- Water Resources Department of Henan Province. Henan Water Resources Bulletin; Water Resources Department of Henan Province: Zhengzhou, China, 2006.
- Bao, C.; Zou, J. Analysis of spatiotemporal changes of the human-water relationship using water resources constraint intensity index in northwest China. Ecol. Indic. 2018, 84, 119–129. [Google Scholar] [CrossRef]
- Delgado, A.; Romero, I. Environmental conflict analysis using an integrated grey clustering and entropy-weight method: A case study of a mining project in Peru. Environ. Model. Softw. 2016, 77, 108–121. [Google Scholar] [CrossRef]
- Xie, T.; Wang, M.; Su, C.; Chen, W. Evaluation of the natural attenuation capacity of urban residential soils with ecosystem-service performance index (EPX) and entropy-weight methods. Environ. Pollut. 2018, 238, 222–229. [Google Scholar] [CrossRef] [PubMed]
- Jin, J.-L.; Wei, Y.-M.; Zou, L.-L.; Liu, L.; Zhang, W.-W.; Zhou, Y.-L. Forewarning of sustainable utilization of regional water resources: A model based on BP neural network and set pair analysis. Nat. Hazards 2012, 62, 115–127. [Google Scholar] [CrossRef]
- Feng, L.H.; Sang, G.S.; Hong, W.H. Statistical prediction of changes in water resources trends based on set pair analysis. Water Resour. Manag. 2014, 28, 1703–1711. [Google Scholar] [CrossRef]
- Pan, Z.; Wang, Y.; Jin, J.; Liu, X. Set pair analysis method for coordination evaluation in water resources utilizing conflict. Phys. Chem. Earth 2017, 101, 149–156. [Google Scholar] [CrossRef]
- Li, C.; Sun, L.; Jia, J.; Cai, Y.; Wang, X. Risk assessment of water pollution sources based on an integrated k-means clustering and set pair analysis method in the region of Shiyan, China. Sci. Total Environ. 2016, 557, 307–316. [Google Scholar] [CrossRef] [PubMed]
- Chou, C.-M. Application of set pair analysis-based similarity forecast model and wavelet denoising for runoff forecasting. Water 2014, 6, 912–928. [Google Scholar] [CrossRef]
- Xia, J. A perspective on hydrological base of water security problem and its application study in north China. Prog. Geogr. 2002, 21, 517–526. [Google Scholar]
- He, C.; Li, J.; Zhang, X.; Liu, Z.; Zhang, D. Will rapid urban expansion in, the drylands of northern China continue: A scenario analysis based on the land use scenario dynamics-urban model and the shared socioeconomic pathways. J. Clean. Prod. 2017, 165, 57–69. [Google Scholar] [CrossRef]
- Jiang, Y. China’s water scarcity. J. Environ. Manag. 2009, 90, 3185–3196. [Google Scholar] [CrossRef] [PubMed]
- Liu, L.; Guan, D.; Yang, Q. Evaluation of water resource security based on an MIV-BP model in a karst area. Water 2018, 10. [Google Scholar] [CrossRef]
- Wang, S.; Li, R. Toward the coordinated sustainable development of urban water resource use and economic growth: An empirical analysis of Tianjin City, China. Sustainability 2018, 10. [Google Scholar] [CrossRef]
- Min, Q.; Cheng, S. Water resource security and countermeasures in China oriented to globalization. Resour. Sci. 2002, 24, 49–55. [Google Scholar]
- Cheng, H.; Hu, Y.; Hao, J. Meeting China’s water shortage crisis: Current practices and challenges. Environ. Sci. Technol. 2009, 43, 240–244. [Google Scholar] [CrossRef] [PubMed]
- Richter, B.D.; Mathews, R.; Wigington, R. Ecologically sustainable water management: Managing river flows for ecological integrity. Ecol. Appl. 2003, 13, 206–224. [Google Scholar] [CrossRef]
- Zhang, L.; Xia, J. Situation and problem analysis of water resource security in China. Resour. Environ. Yangtze Basin 2009, 18, 116–120. [Google Scholar]
| Factor | Indicators | Unit | Indicator Meaning | Type |
|---|---|---|---|---|
| Pressure (B1) | GDP Growth Rate (C1) | % | Reflect the economic development and population consumption pressures on water resources | − |
| Population Density (C2) | Pop. km−2 | Reflects population growth pressures on water resources | − | |
| Urbanization percentage in the area (C3) | % | Reflects water pressures from regional development | − | |
| Water consumption per 10,000 Yuan of GDP (C4) | m3·10−4 Yuan | Reflects the intensity of economic development pressures on water resources | − | |
| Water consumption per 10,000 Yuan of industrial output (C5) | m3·10−4 Yuan | Reflects the intensity of industrial development pressures on water resources | − | |
| Water consumption per 10,000 Yuan of agricultural output (C6) | m3·10−4 Yuan | Reflects the intensity of agricultural development pressures on water resources | − | |
| Wastewater quantity per 10,000 Yuan of industrial output (C7) | t·10−4 Yuan | Reflects the water quality pressures from industrial production | − | |
| Development degree of surface water (C8) | % | Reflects the development and utilization pressures on surface water resources | − | |
| Development degree of groundwater (C9) | % | Reflects the development and utilization pressures on groundwater resources | − | |
| State (B2) | Annual runoff (C10) | mm | Reflects the amount of water resources | + |
| Water resources amount per capita (C11) | m3/person | Reflects the per capita state of water resources | + | |
| Water resources amount per unit area (C12) | 104 m3·km−2 | Reflects the per unit area state of water resources | + | |
| Water supply amount per capita (C13) | m3/person | Reflects the intensity of water supply | + | |
| Water production coefficient (C14) | Reflects the amount of precipitation | + | ||
| Response (B3) | Sewage treatment rate (C15) | % | Reflects the response to quality of water resources | + |
| Forest coverage rate (C16) | % | Reflects the response to quantity of water resources | + | |
| Rate of wastewater up to discharge standard for urban (C17) | % | Reflects the response to quality of water resources | + | |
| Rate of standard river length (C18) | % | Reflects the response to quality of water resources | + | |
| Eco-environment water consumption ratio (C19) | % | Reflects the response to eco-environment water security condition | + | |
| Rate of water resources management investment to GDP (C20) | % | Reflects the capacity of investment to aid in ecological management and reduce pressure on water resources | + | |
| Rate of environmental protection investment to GDP (C21) | % | Reflects the capacity of investment to aid in ecological management and reduce pressure on water resources | + |
| Factor | Indicators | Unit | Security | Moderate Security | Critical Security | Insecurity | Absolute Insecurity |
|---|---|---|---|---|---|---|---|
| Pressure (B1) | GDP Growth Rate (C1) | % | ≤3 | 3–5 | 5–8 | 8–10 | ≥10 |
| Population Density (C2) | Pop. km−2 | ≤400 | 400–800 | 800–2000 | 2000–5000 | ≥5000 | |
| Urbanization percentage in the area (C3) | % | ≤30 | 30–40 | 40–50 | 50–60 | ≥60 | |
| Water consumption per 10,000 Yuan of GDP (C4) | m3·10−4 Yuan | ≤100 | 100–200 | 200–300 | 300–400 | ≥400 | |
| Water consumption per 10,000 Yuan of industrial output (C5) | m3·10−4 Yuan | ≤30 | 30–60 | 60–90 | 90–120 | ≥120 | |
| Water consumption per 10,000 Yuan of agricultural output (C6) | m3·10−4 Yuan | ≤500 | 500–1000 | 1000–1500 | 1500–2000 | ≥2000 | |
| Wastewater quantity per 10,000 Yuan of industrial output (C7) | t·10−4 Yuan | ≤10 | 10–20 | 20–30 | 30–40 | ≥40 | |
| Development degree of surface water (C8) | % | ≤30 | 30–50 | 50–70 | 70–90 | ≥90 | |
| Development degree of groundwater (C9) | % | ≤30 | 30–50 | 50–70 | 70–90 | ≥90 | |
| State (B2) | Annual runoff (C10) | mm | ≥130 | 90–130 | 50–90 | 10–50 | ≤10 |
| Water resources amount per capita (C11) | m3/person | ≥1000 | 750–1000 | 500–750 | 250–500 | ≤250 | |
| Water resources amount per unit area (C12) | 104 m3·km−2 | ≥200 | 150–200 | 100–150 | 50–100 | ≤50 | |
| Water supply amount per capita (C13) | m3/person | ≥800 | 600–800 | 400–600 | 200–400 | ≤200 | |
| Water production coefficient (C14) | ≥0.3 | 0.24–0.3 | 0.18–0.24 | 0.12–0.18 | ≤0.12 | ||
| Response (B3) | Sewage treatment rate (C15) | % | ≥80 | 70–80 | 60–70 | 45–60 | ≤45 |
| Forest coverage rate (C16) | % | ≥40 | 30–40 | 20–30 | 10–20 | ≤10 | |
| Rate of wastewater up to discharge standard for urban (C17) | % | ≥95 | 85–95 | 75–85 | 60–75 | ≤60 | |
| Rate of standard river length (C18) | % | ≥90 | 80–90 | 70–80 | 60–70 | ≤60 | |
| Eco-environment water consumption ratio (C19) | % | ≥3.6 | 2.7–3.6 | 1.8–2.7 | 0.9–1.8 | ≤0.9 | |
| Rate of water resources management investment to GDP (C20) | % | ≥1.5 | 1–1.5 | 0.6–1 | 0.3–0.6 | ≤0.3 | |
| Rate of environmental protection investment to GDP(C21) | % | ≥1 | 0.8–1 | 0.5–0.8 | 0.3–0.5 | ≤0.3 |
| Factor | Indicators | |||
|---|---|---|---|---|
| Pressure (0.3519) | C1 | 0.0168 | 0.0476 | 0.0322 |
| C2 | 0.0135 | 0.0503 | 0.0319 | |
| C3 | 0.0098 | 0.0453 | 0.0275 | |
| C4 | 0.0629 | 0.0407 | 0.0518 | |
| C5 | 0.0575 | 0.0423 | 0.0499 | |
| C6 | 0.0334 | 0.0402 | 0.0368 | |
| C7 | 0.0629 | 0.0390 | 0.0510 | |
| C8 | 0.0270 | 0.0433 | 0.0351 | |
| C9 | 0.0270 | 0.0444 | 0.0357 | |
| State (0.2368) | C10 | 0.0137 | 0.0634 | 0.0385 |
| C11 | 0.0643 | 0.0592 | 0.0617 | |
| C12 | 0.0353 | 0.0602 | 0.0478 | |
| C13 | 0.0643 | 0.0443 | 0.0543 | |
| C14 | 0.0183 | 0.0508 | 0.0345 | |
| Response (0.4112) | C15 | 0.0453 | 0.0467 | 0.0460 |
| C16 | 0.0562 | 0.0471 | 0.0516 | |
| C17 | 0.0372 | 0.0393 | 0.0383 | |
| C18 | 0.0372 | 0.0402 | 0.0387 | |
| C19 | 0.0610 | 0.0568 | 0.0589 | |
| C20 | 0.1283 | 0.0487 | 0.0885 | |
| C21 | 0.1283 | 0.0503 | 0.0893 |
| Year | Security Grade | ||||||||||
|---|---|---|---|---|---|---|---|---|---|---|---|
| 2006 | 0.1891 | 0.1570 | 0.1712 | 0.1112 | 0.3716 | 0.1891 | 0.3460 | 0.5172 | 0.6284 | 1 | Grade 4 |
| 2007 | 0.2662 | 0.1498 | 0.1638 | 0.0767 | 0.3435 | 0.2662 | 0.4160 | 0.5798 | 0.6565 | 1 | Grade 4 |
| 2008 | 0.2951 | 0.1029 | 0.1812 | 0.0535 | 0.3673 | 0.2951 | 0.3980 | 0.5792 | 0.6327 | 1 | Grade 4 |
| 2009 | 0.3119 | 0.1470 | 0.1680 | 0.1733 | 0.1997 | 0.3119 | 0.4589 | 0.6269 | 0.8003 | 1 | Grade 3 |
| 2010 | 0.4134 | 0.1369 | 0.1744 | 0.0582 | 0.2171 | 0.4134 | 0.5503 | 0.7247 | 0.7829 | 1 | Grade 3 |
| 2011 | 0.4455 | 0.1344 | 0.1461 | 0.0564 | 0.2176 | 0.4455 | 0.5800 | 0.7261 | 0.7824 | 1 | Grade 3 |
| 2012 | 0.4124 | 0.1579 | 0.0746 | 0.1110 | 0.2441 | 0.4124 | 0.5703 | 0.6449 | 0.7559 | 1 | Grade 3 |
| 2013 | 0.3959 | 0.0523 | 0.1363 | 0.1577 | 0.2578 | 0.3959 | 0.4482 | 0.5845 | 0.7422 | 1 | Grade 4 |
| 2014 | 0.4151 | 0.0748 | 0.1283 | 0.1380 | 0.2437 | 0.4151 | 0.4900 | 0.6182 | 0.7563 | 1 | Grade 3 |
| 2015 | 0.4270 | 0.0783 | 0.1625 | 0.1663 | 0.1660 | 0.4270 | 0.5053 | 0.6677 | 0.8340 | 1 | Grade 3 |
| 2016 | 0.4293 | 0.0906 | 0.1128 | 0.1923 | 0.1751 | 0.4293 | 0.5199 | 0.6326 | 0.8249 | 1 | Grade 3 |
| PSR | Year | ||||||||||
|---|---|---|---|---|---|---|---|---|---|---|---|
| Pressure | 2006 | 0.3514 | 0.2527 | 0.2365 | 0.0680 | 0.0914 | 0.3514 | 0.6041 | 0.8406 | 0.9086 | 1 |
| 2007 | 0.4866 | 0.1811 | 0.2409 | 0.0000 | 0.0914 | 0.4866 | 0.6677 | 0.9086 | 0.9086 | 1 | |
| 2008 | 0.4738 | 0.1402 | 0.2946 | 0.0000 | 0.0914 | 0.4738 | 0.6140 | 0.9086 | 0.9086 | 1 | |
| 2009 | 0.4729 | 0.1987 | 0.2370 | 0.0000 | 0.0914 | 0.4729 | 0.6716 | 0.9086 | 0.9086 | 1 | |
| 2010 | 0.5658 | 0.1720 | 0.1708 | 0.0000 | 0.0914 | 0.5658 | 0.7378 | 0.9086 | 0.9086 | 1 | |
| 2011 | 0.6073 | 0.1894 | 0.1031 | 0.0088 | 0.0914 | 0.6073 | 0.7966 | 0.8997 | 0.9086 | 1 | |
| 2012 | 0.4637 | 0.2872 | 0.1348 | 0.0229 | 0.0914 | 0.4637 | 0.7509 | 0.8857 | 0.9086 | 1 | |
| 2013 | 0.4626 | 0.1486 | 0.1791 | 0.1556 | 0.0541 | 0.4626 | 0.6112 | 0.7903 | 0.9459 | 1 | |
| 2014 | 0.5171 | 0.1373 | 0.1938 | 0.1518 | 0.0000 | 0.5171 | 0.6544 | 0.8482 | 1.0000 | 1 | |
| 2015 | 0.5507 | 0.1272 | 0.1708 | 0.1421 | 0.0091 | 0.5507 | 0.6779 | 0.8487 | 0.9909 | 1 | |
| 2016 | 0.5575 | 0.0716 | 0.1360 | 0.2349 | 0.0000 | 0.5575 | 0.6290 | 0.7651 | 1.0000 | 1 | |
| State | 2006 | 0.0055 | 0.1572 | 0.1457 | 0.1811 | 0.5105 | 0.0055 | 0.1627 | 0.3084 | 0.4895 | 1 |
| 2007 | 0.0222 | 0.1891 | 0.0971 | 0.1351 | 0.5565 | 0.0222 | 0.2113 | 0.3084 | 0.4435 | 1 | |
| 2008 | 0.0000 | 0.0346 | 0.1766 | 0.1265 | 0.6623 | 0.0000 | 0.0346 | 0.2113 | 0.3377 | 1 | |
| 2009 | 0.0000 | 0.1498 | 0.0857 | 0.2156 | 0.5489 | 0.0000 | 0.1498 | 0.2355 | 0.4511 | 1 | |
| 2010 | 0.3084 | 0.0573 | 0.2033 | 0.0285 | 0.4024 | 0.3084 | 0.3657 | 0.5691 | 0.5976 | 1 | |
| 2011 | 0.3084 | 0.0000 | 0.2324 | 0.0546 | 0.4045 | 0.3084 | 0.3084 | 0.5408 | 0.5955 | 1 | |
| 2012 | 0.1627 | 0.1457 | 0.0000 | 0.1748 | 0.5168 | 0.1627 | 0.3084 | 0.3084 | 0.4832 | 1 | |
| 2013 | 0.0000 | 0.0000 | 0.2020 | 0.1681 | 0.6299 | 0.0000 | 0.0000 | 0.2020 | 0.3701 | 1 | |
| 2014 | 0.0000 | 0.1122 | 0.0991 | 0.1377 | 0.6510 | 0.0000 | 0.1122 | 0.2113 | 0.3490 | 1 | |
| 2015 | 0.0000 | 0.0816 | 0.1054 | 0.1252 | 0.6878 | 0.0000 | 0.0816 | 0.1870 | 0.3122 | 1 | |
| 2016 | 0.0000 | 0.0000 | 0.1600 | 0.1002 | 0.7398 | 0.0000 | 0.0000 | 0.1600 | 0.2602 | 1 | |
| Response | 2006 | 0.1562 | 0.0752 | 0.1303 | 0.1081 | 0.5302 | 0.1562 | 0.2314 | 0.3617 | 0.4698 | 1 |
| 2007 | 0.2185 | 0.1007 | 0.1366 | 0.1089 | 0.4353 | 0.2185 | 0.3192 | 0.4558 | 0.5647 | 1 | |
| 2008 | 0.3126 | 0.1105 | 0.0873 | 0.0573 | 0.4324 | 0.3126 | 0.4231 | 0.5104 | 0.5676 | 1 | |
| 2009 | 0.3542 | 0.1016 | 0.1565 | 0.2965 | 0.0913 | 0.3542 | 0.4558 | 0.6123 | 0.9087 | 1 | |
| 2010 | 0.3442 | 0.1530 | 0.1609 | 0.1248 | 0.2171 | 0.3442 | 0.4972 | 0.6581 | 0.7829 | 1 | |
| 2011 | 0.3869 | 0.1651 | 0.1330 | 0.0978 | 0.2171 | 0.3869 | 0.5520 | 0.6850 | 0.7829 | 1 | |
| 2012 | 0.5129 | 0.0547 | 0.0660 | 0.1492 | 0.2171 | 0.5129 | 0.5676 | 0.6336 | 0.7829 | 1 | |
| 2013 | 0.5676 | 0.0000 | 0.0619 | 0.1533 | 0.2171 | 0.5676 | 0.5676 | 0.6296 | 0.7829 | 1 | |
| 2014 | 0.5676 | 0.0000 | 0.0890 | 0.1262 | 0.2171 | 0.5676 | 0.5676 | 0.6566 | 0.7829 | 1 | |
| 2015 | 0.5676 | 0.0346 | 0.1879 | 0.2099 | 0.0000 | 0.5676 | 0.6022 | 0.7901 | 1.0000 | 1 | |
| 2016 | 0.5676 | 0.1586 | 0.0656 | 0.2082 | 0.0000 | 0.5676 | 0.7262 | 0.7918 | 1.0000 | 1 |
© 2018 by the authors. Licensee MDPI, Basel, Switzerland. This article is an open access article distributed under the terms and conditions of the Creative Commons Attribution (CC BY) license (http://creativecommons.org/licenses/by/4.0/).
Share and Cite
Dong, G.; Shen, J.; Jia, Y.; Sun, F. Comprehensive Evaluation of Water Resource Security: Case Study from Luoyang City, China. Water 2018, 10, 1106. https://doi.org/10.3390/w10081106
Dong G, Shen J, Jia Y, Sun F. Comprehensive Evaluation of Water Resource Security: Case Study from Luoyang City, China. Water. 2018; 10(8):1106. https://doi.org/10.3390/w10081106
Chicago/Turabian StyleDong, Guanghua, Juqin Shen, Yizhen Jia, and Fuhua Sun. 2018. "Comprehensive Evaluation of Water Resource Security: Case Study from Luoyang City, China" Water 10, no. 8: 1106. https://doi.org/10.3390/w10081106
APA StyleDong, G., Shen, J., Jia, Y., & Sun, F. (2018). Comprehensive Evaluation of Water Resource Security: Case Study from Luoyang City, China. Water, 10(8), 1106. https://doi.org/10.3390/w10081106


