3.1. Groundwater Geochemical Characteristics
Statistical information of groundwater geochemical parameters, including the minimum, maximum, mean, and standard deviation, is presented for 2006 and 2016 in
Table 4. The mean value of pH was 7.28 in 2006 and 7.71 in 2016. TH, TDS, and COD
Mn were relatively stable in 2006 and 2016. All of them were in the acceptable levels of drinking water quality set by the Ministry of Health of the P.R. China (PRC) and the World Health Organization (WHO) (
Table 4).
For cations, groundwater had K
+ concentrations of 1.03~2.57 mg/L in 2006 and 1.53~3.74 mg/L in 2016. There was the same trend to the concentration of Na
+, with an average of 46.5 mg/L in 2006 and an average of 47.3 mg/L in 2016. The average concentration of Ca
2+ decreased from 50.8 mg/L in 2006 to 37.5 mg/L in 2016. The concentration of Mg
2+ in 2006 was in the range of 7.12~22.82 mg/L, whereas it was lower, ranging from 6.4 to 14.8 mg/L, in 2016. The concentrations of anions were lower than the maximum allowable values of drinking water quality set by the PRC and WHO. Cl
− had a higher concentration in 2016, with an average of 19.4 mg/L. The concentration of SO
42− had significantly decreased from 2006 to 2016 with the average of 24.3 mg/L and 15.5 mg/L, respectively. HCO
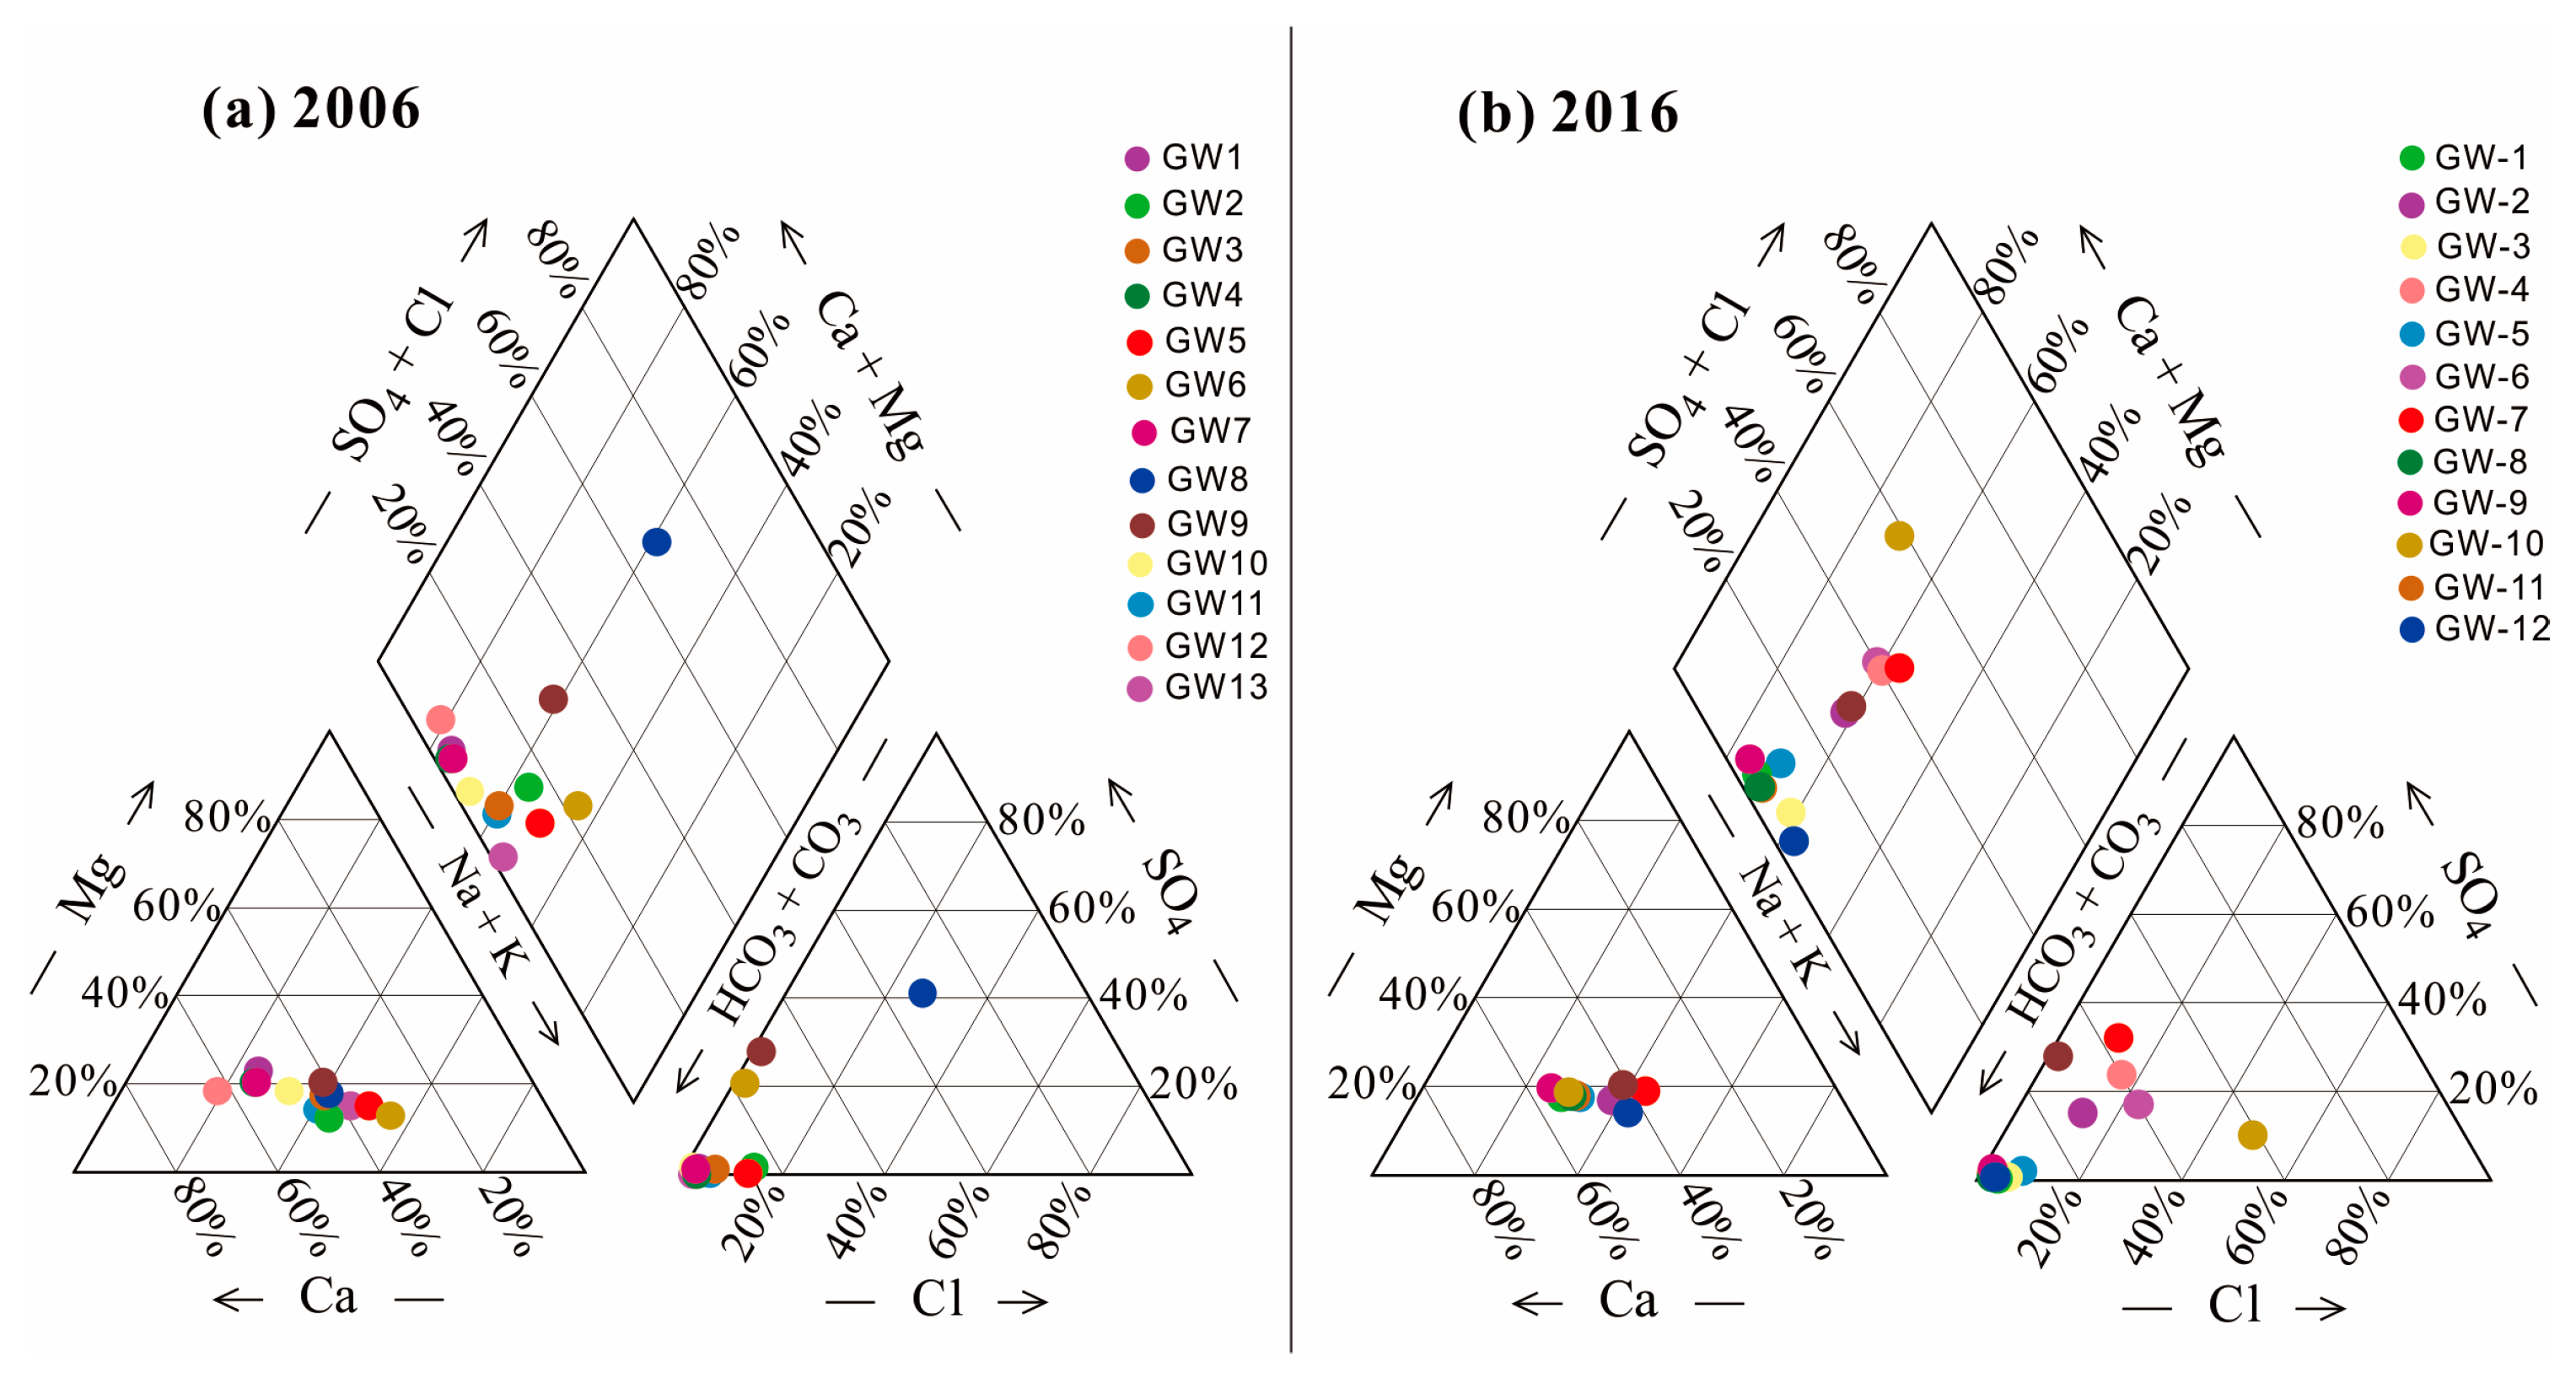
3− had the concentration in the range of 173~583 mg/L in 2006 and 98~423 mg/L in 2016. In general, the analyses above implied that changes in groundwater geochemical characteristics from 2006 to 2016 were not significant. Na
+, Ca
2+ and HCO
3− were major ions in the groundwater. Similarly, it can be found from
Figure 2 that the aquifer was mainly dominated by HCO
3-Ca·Na-type water and HCO
3−Ca-type water in 2006 and 2016, respectively.
Table 4 shows that the average concentrations of NH
4-N, TFe and Mn exceeded the acceptable levels both in 2006 and 2016. Since in more than half of the groundwater samples, NO
2-N was not detected, we decided not to take it into account in this study.
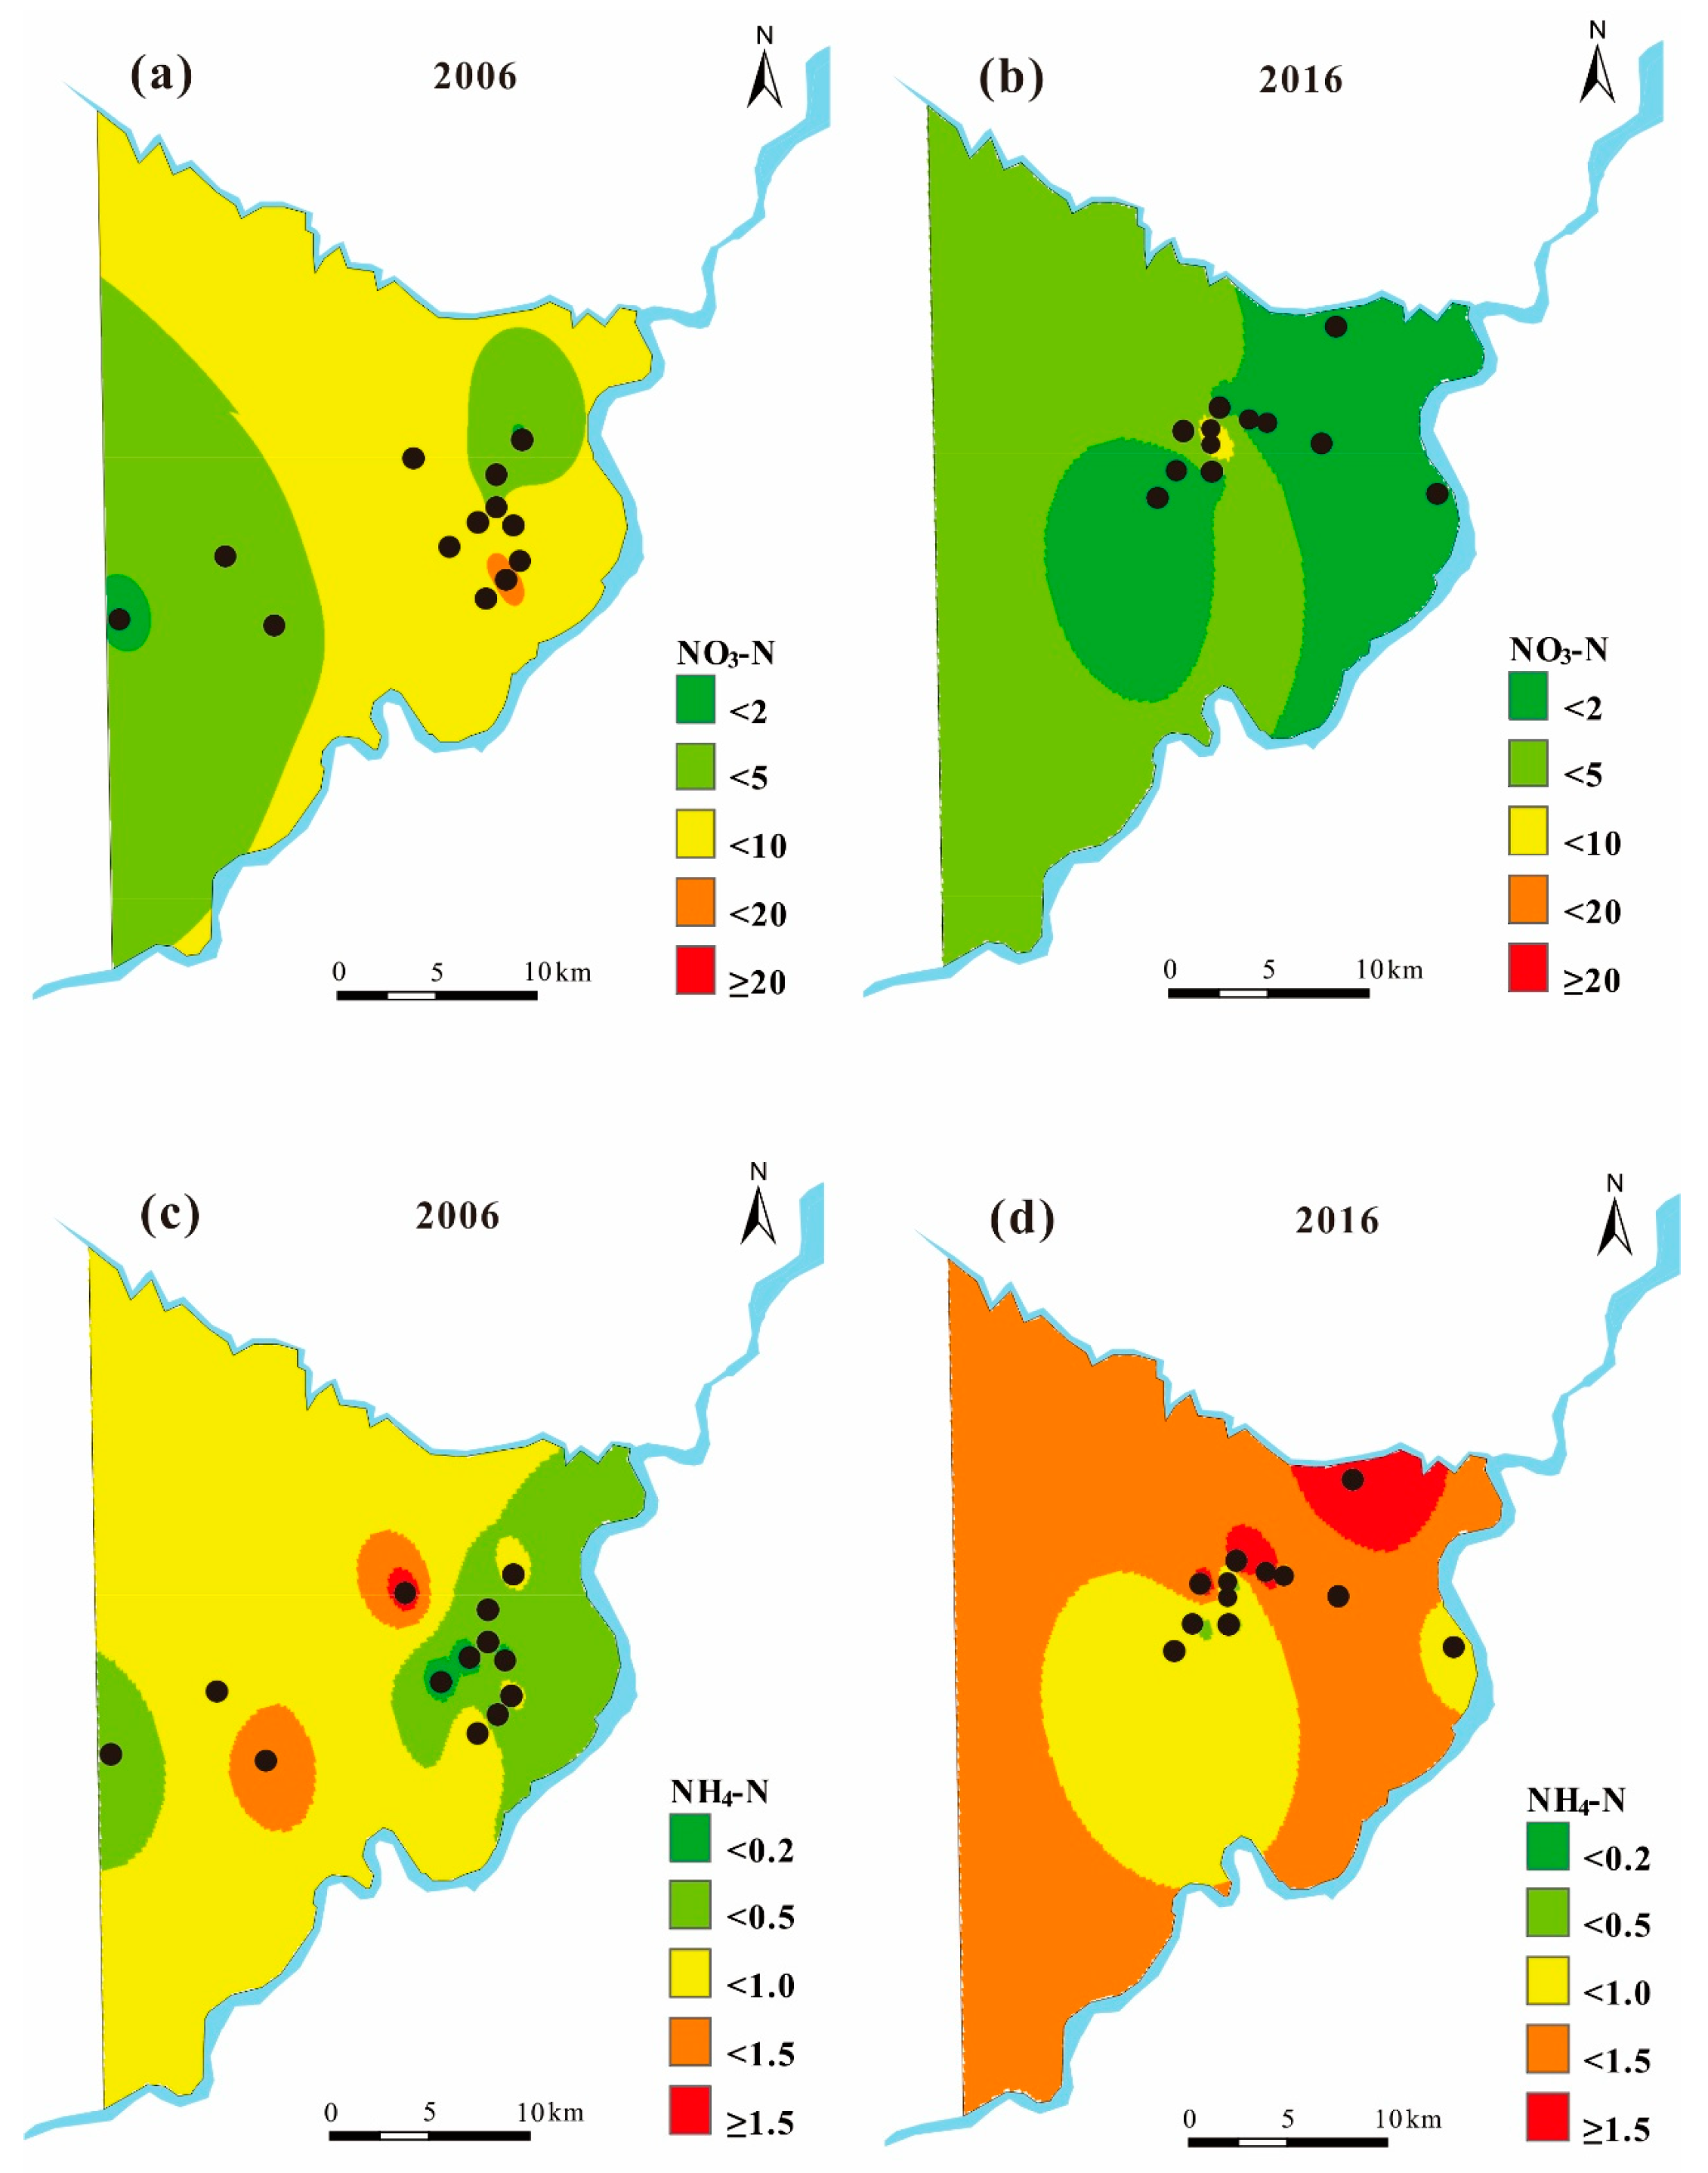
Figure 3 shows that the concentration of NO
3-N had a decreasing trend from 2006 to 2016. In 2006, NO
3-N concentrations were 2~10 mg/L, while in 2016 it was less than 5 mg/L in most areas. High NO
3-N concentration in groundwater occurs frequently due to excessive irrigation water and fertilizer [
44]. Nevertheless, there was only one sample in 2006 with a NO
3-N concentration exceeding (>10 mg/L) the water quality standard. Reduction of agricultural area (
Figure 4) and restrictions on the use of chemical fertilizers [
45] contributed to these low concentrations. Denitrification has a key role in nitrate attenuation in shallow aquifers, because it greatly reduces the nitrate concentrations in water [
5,
46,
47]. We suspected that the fresh water recharging mainly from precipitation had some dilution effect on the groundwater concentration of NO
3-N, and this was consistent with the findings of Zhai et al. [
48]. The concentrations of NH
4-N in large areas were 0.5~1.0 mg/L in 2006 and it increased to 1.0~1.5 mg/L in 2016. Release of wastewater from factories, agricultural runoff, and domestic sewage constituted both point and non-point sources of NH
4-N [
49]. The rapid development of the study area contributed to the increasing of NH
4-N pollution from 2006 to 2016. There are many sources of pollution distributed along the Songhua River and Hulan River, including both point and non-point sources, resulting in large emissions of NH
4-N. These sources have lowered the water quality to a point where it has reached the surface water quality standards IV grade (>1 mg/L) of the PRC [
50,
51,
52]. This may increase the risk of groundwater pollution with the decreasing river water quality [
53,
54].
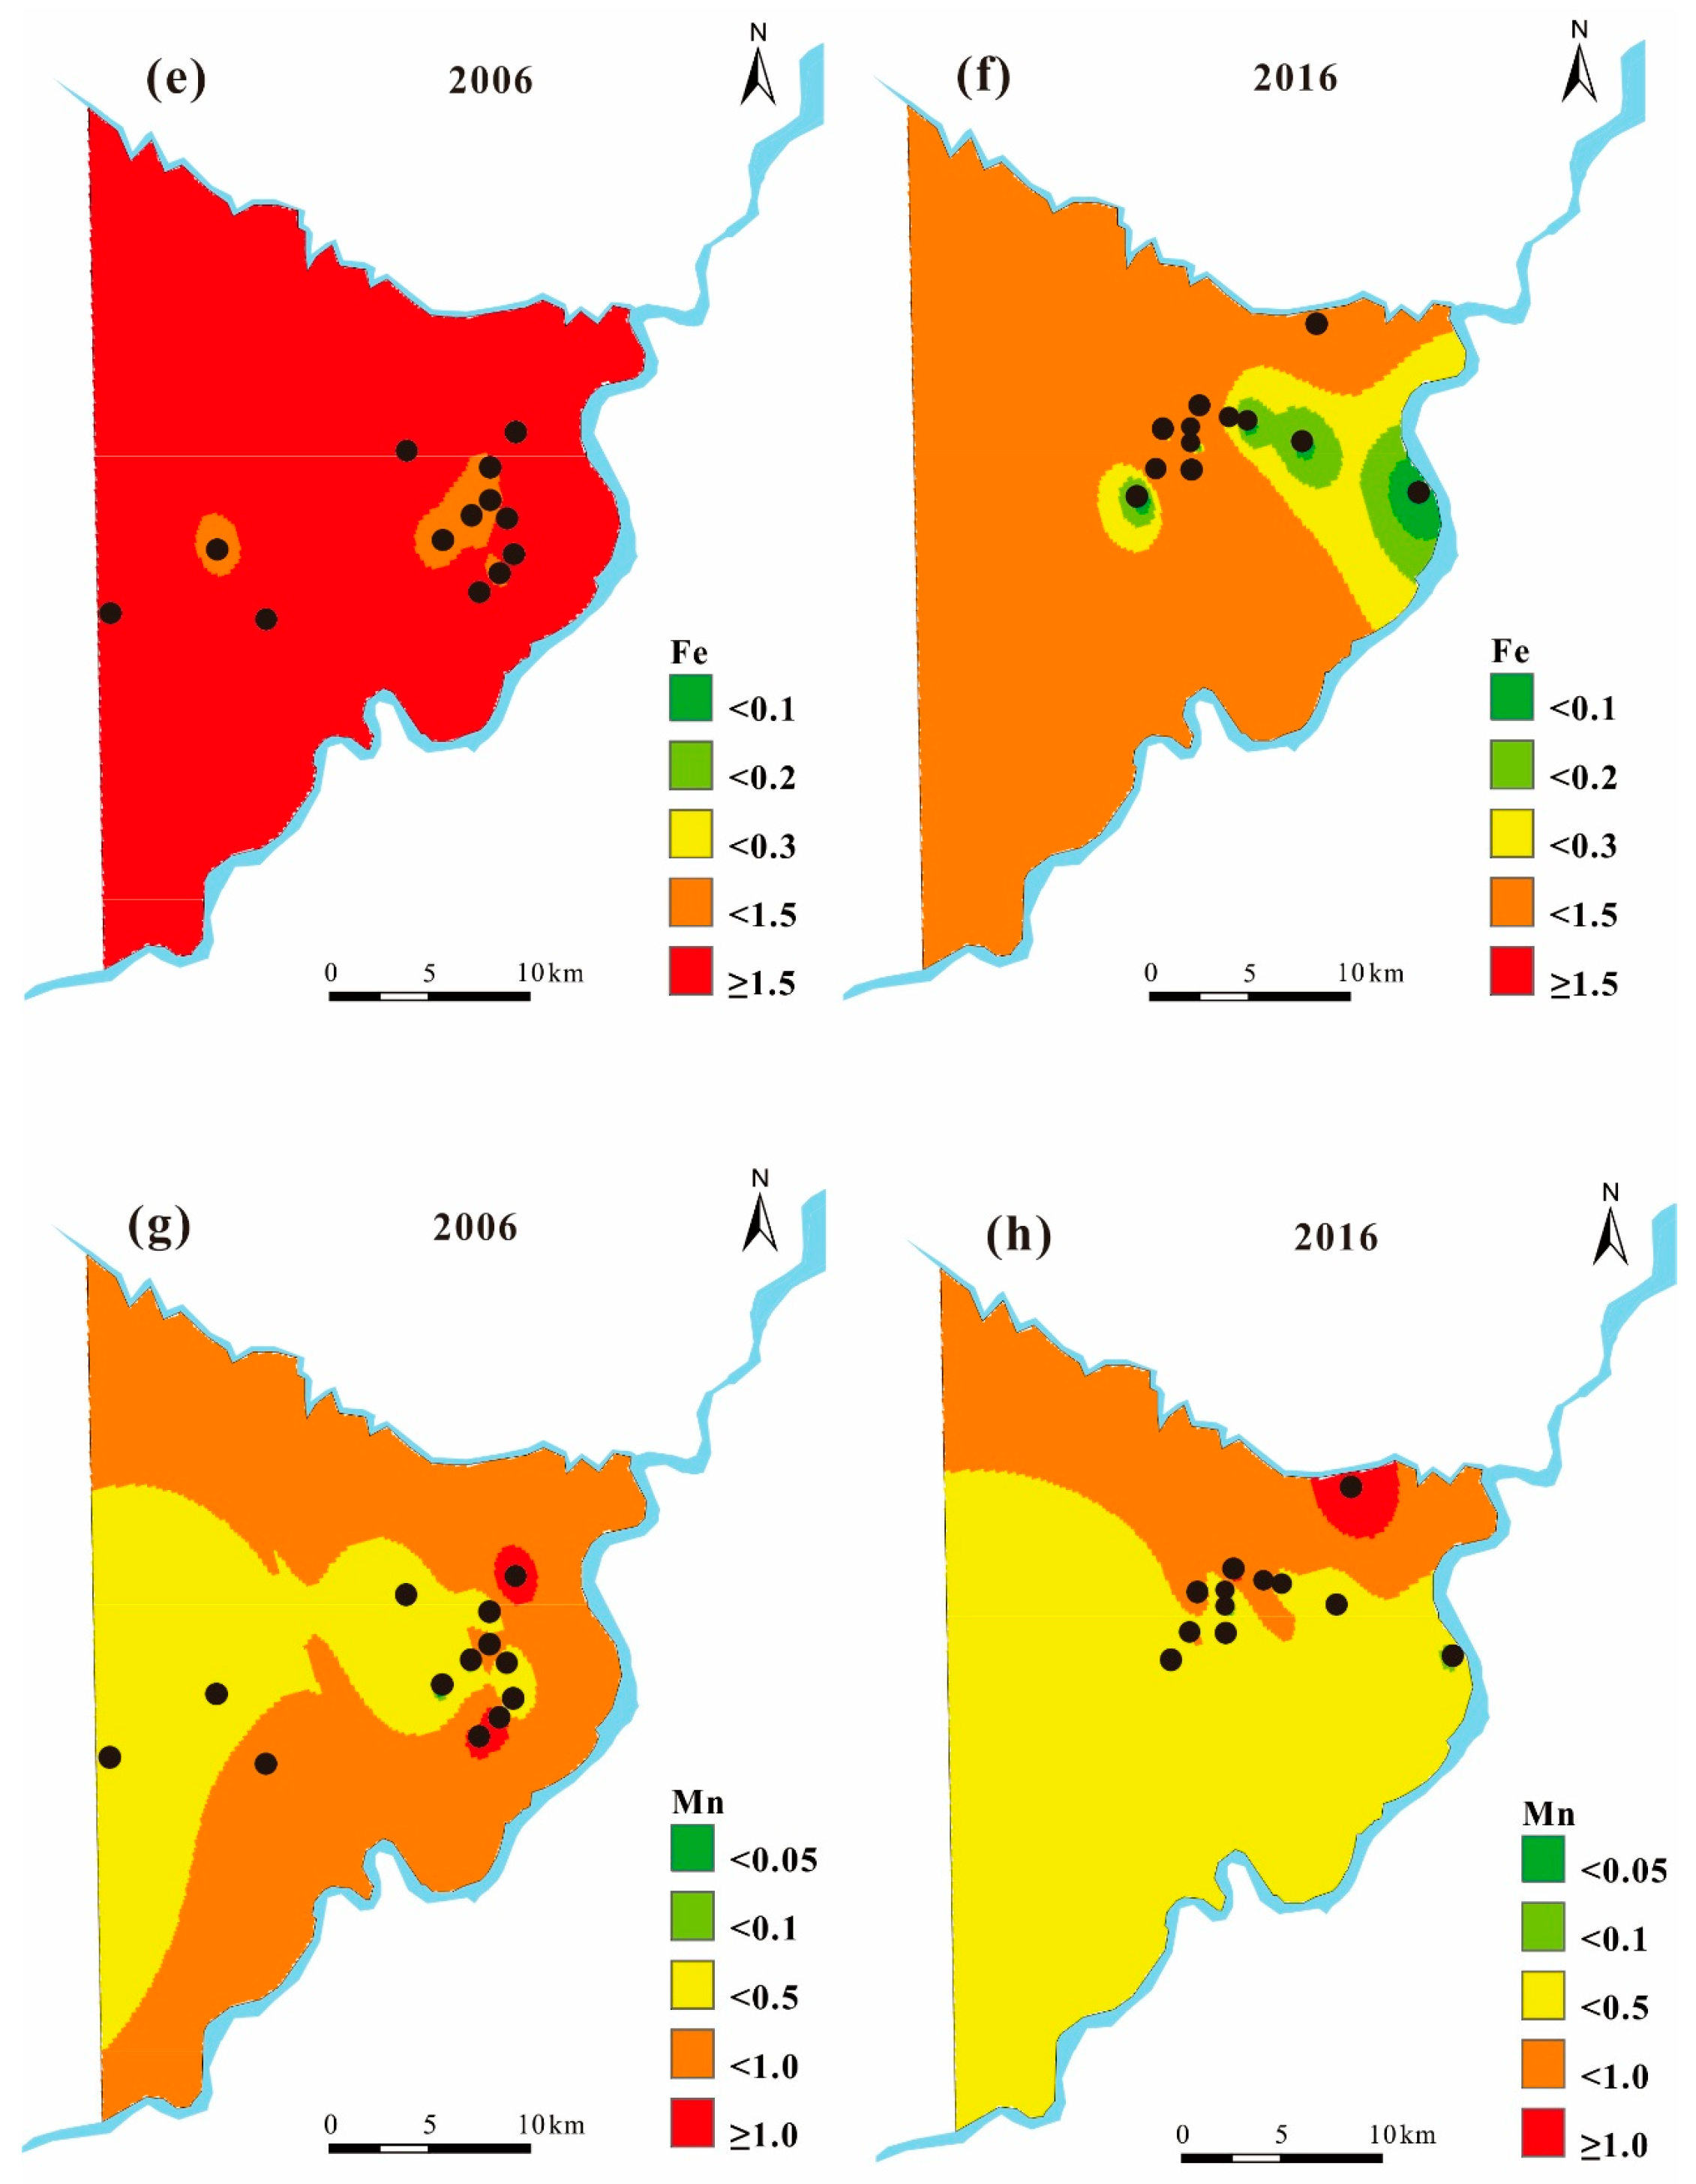
It has been reported that high contents of Fe and Mn in groundwater are common in northeastern China, with high Fe concentrations generally occurring where Mn concentrations are high [
55,
56,
57]. Especially in the center of the Songnen Plain, in which our study area occurs, contents of Fe and Mn are as high as 11.2–44.4 mg/g and 0.5–1.0 mg/g, respectively, due to the abundance of iron–manganese nodules in local Quaternary aquifer sediments [
55,
58]. Therefore, the background concentrations of Fe and Mn in the study area are very high and usually exceed the acceptable levels. Groundwater Fe concentration showed a considerably decrease from 2006 (
Figure 3e) to 2016 (
Figure 3f) and this change corresponded with the results of Sharma, et al. [
59] and the Kruskal-Wallis test (
Table 4). The Mn concentration decreased insignificantly and varied from 0.57 mg/L in 2006 to 0.51 mg/L in 2016. For the year 2016, areas of higher concentrations of Mn exhibited a decrease compared with 2006. Dissolution processes of minerals, which are often controlled by the redox level of groundwater, affect reductive dissolution of Fe/Mn oxides. Increasing the exploitation of groundwater will cause water levels to drop, leading to changes in the redox conditions as water table pumping delivers more O
2 to the subsurface [
4,
60]. Dissolved Fe from the reducing zone may precipitate as in the oxidation condition [
4].
3.3. Groundwater Vulnerability Assessment
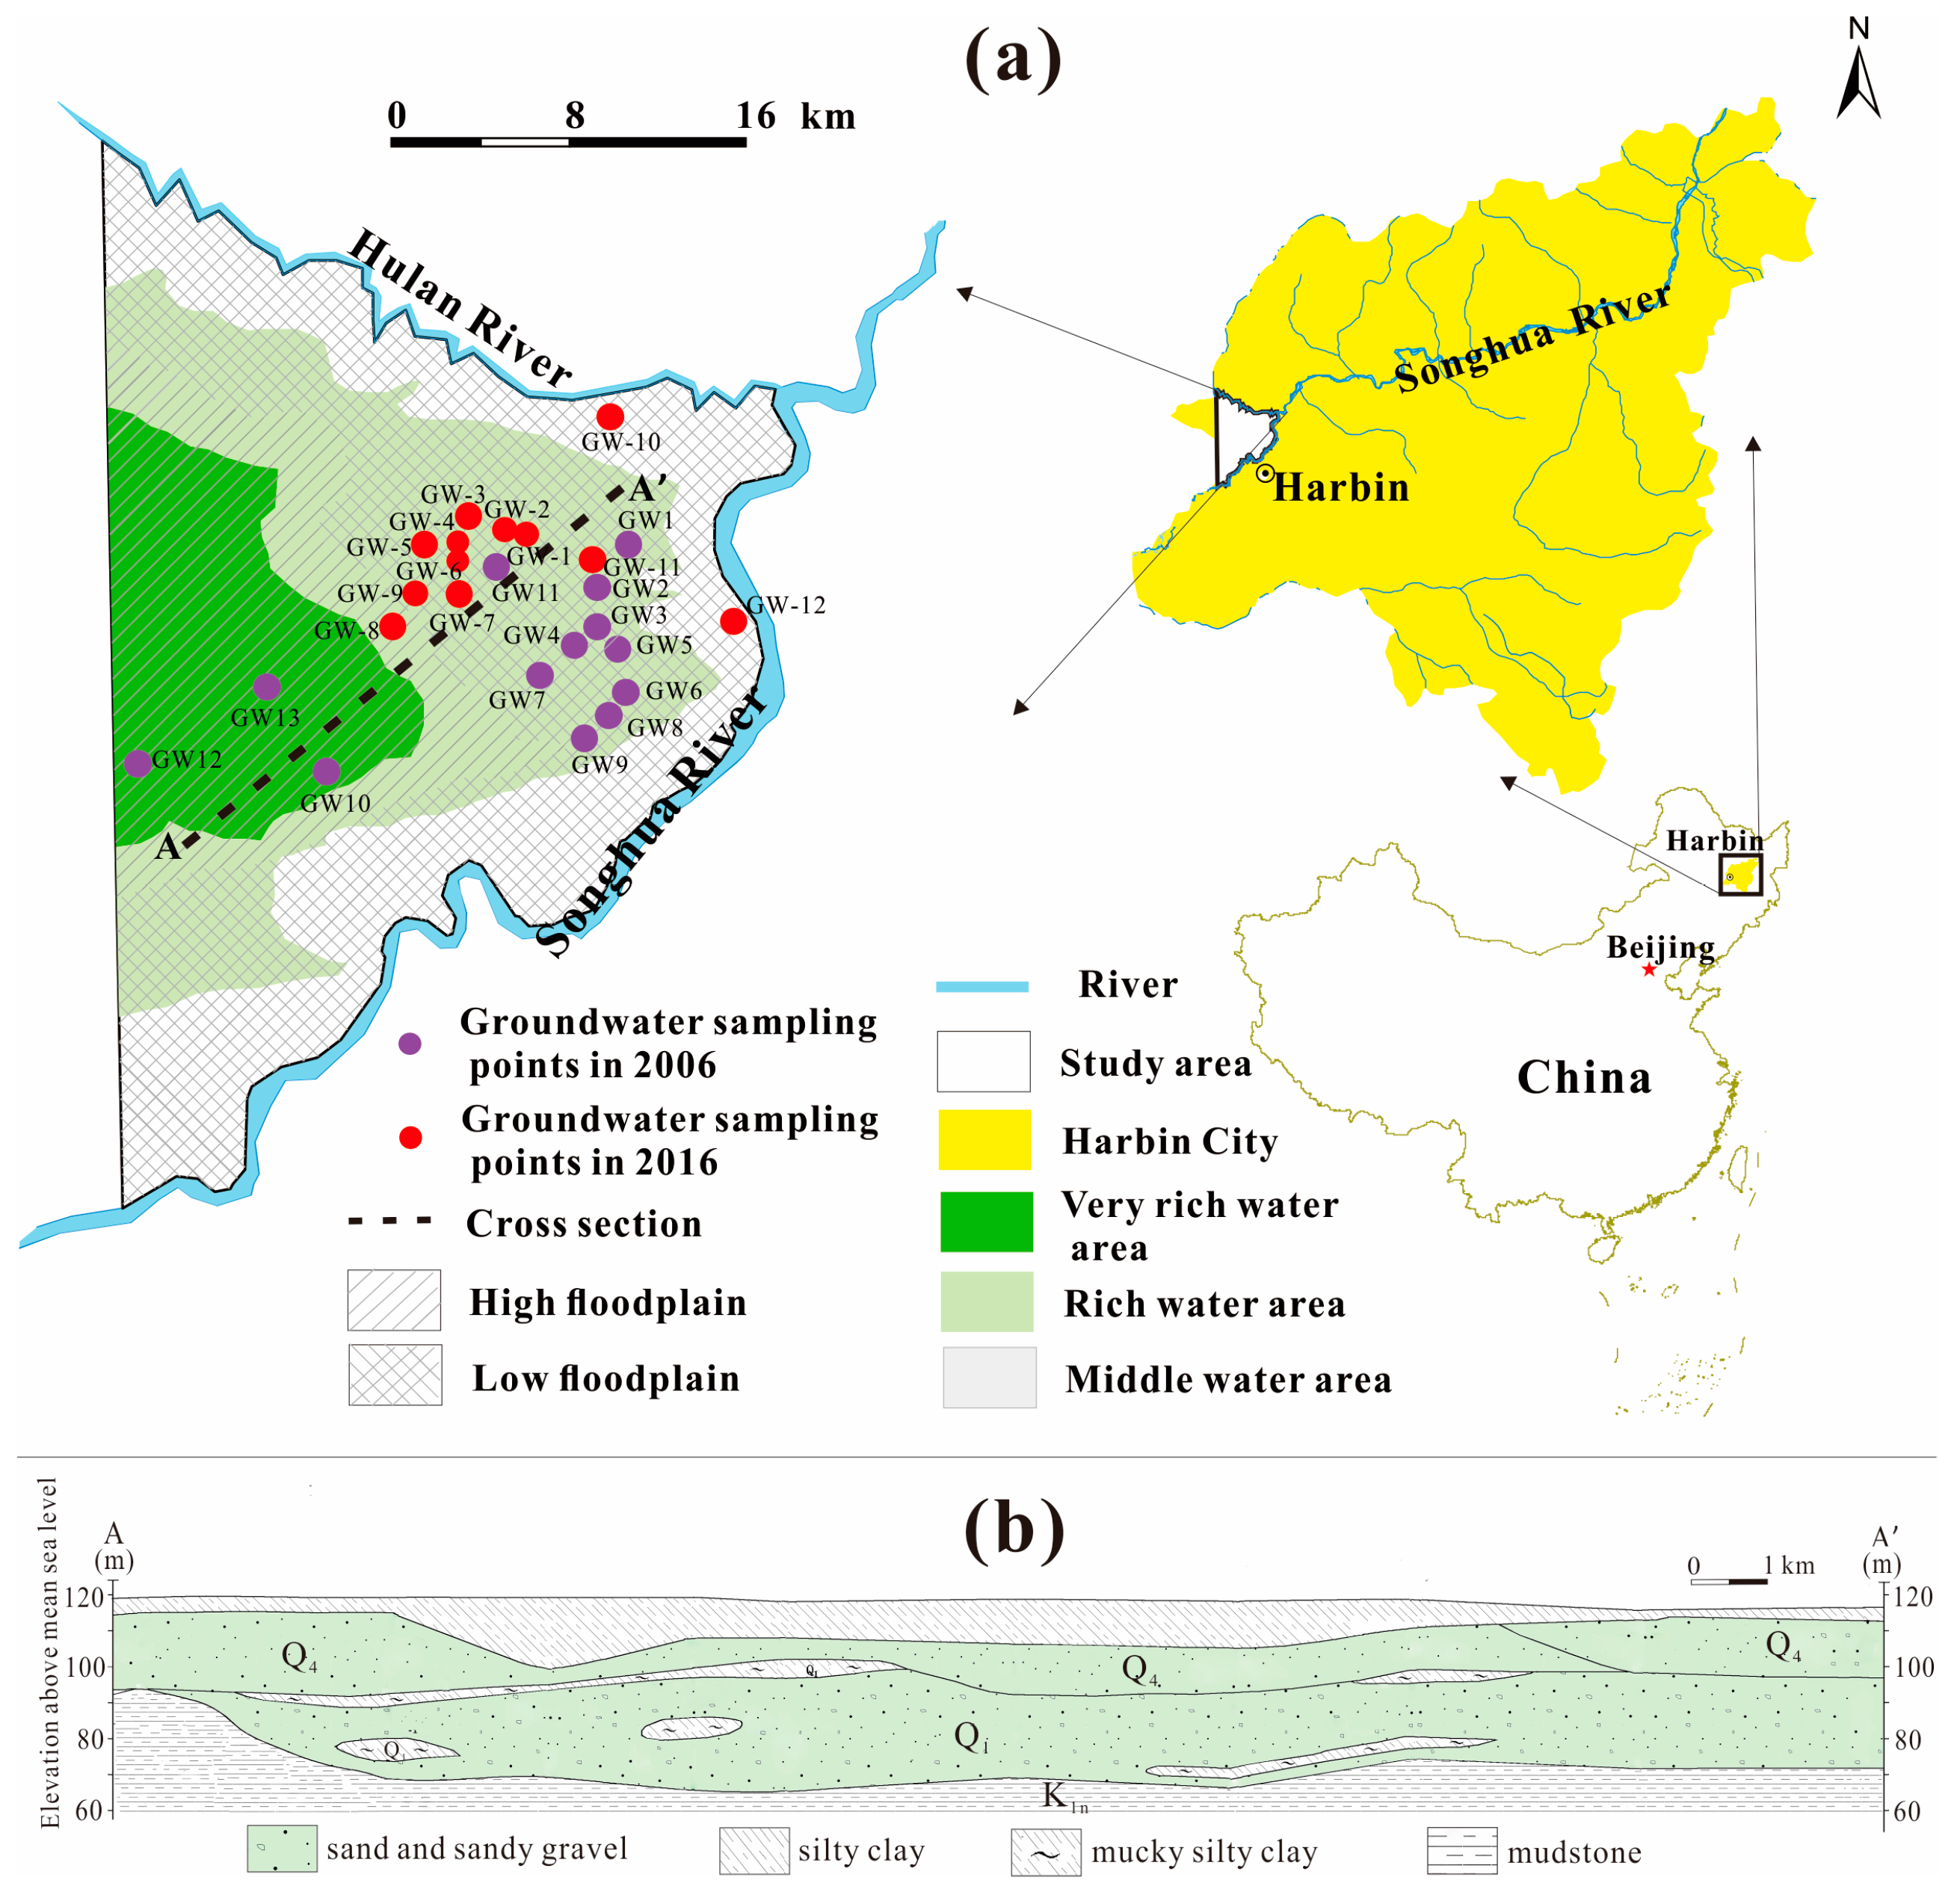
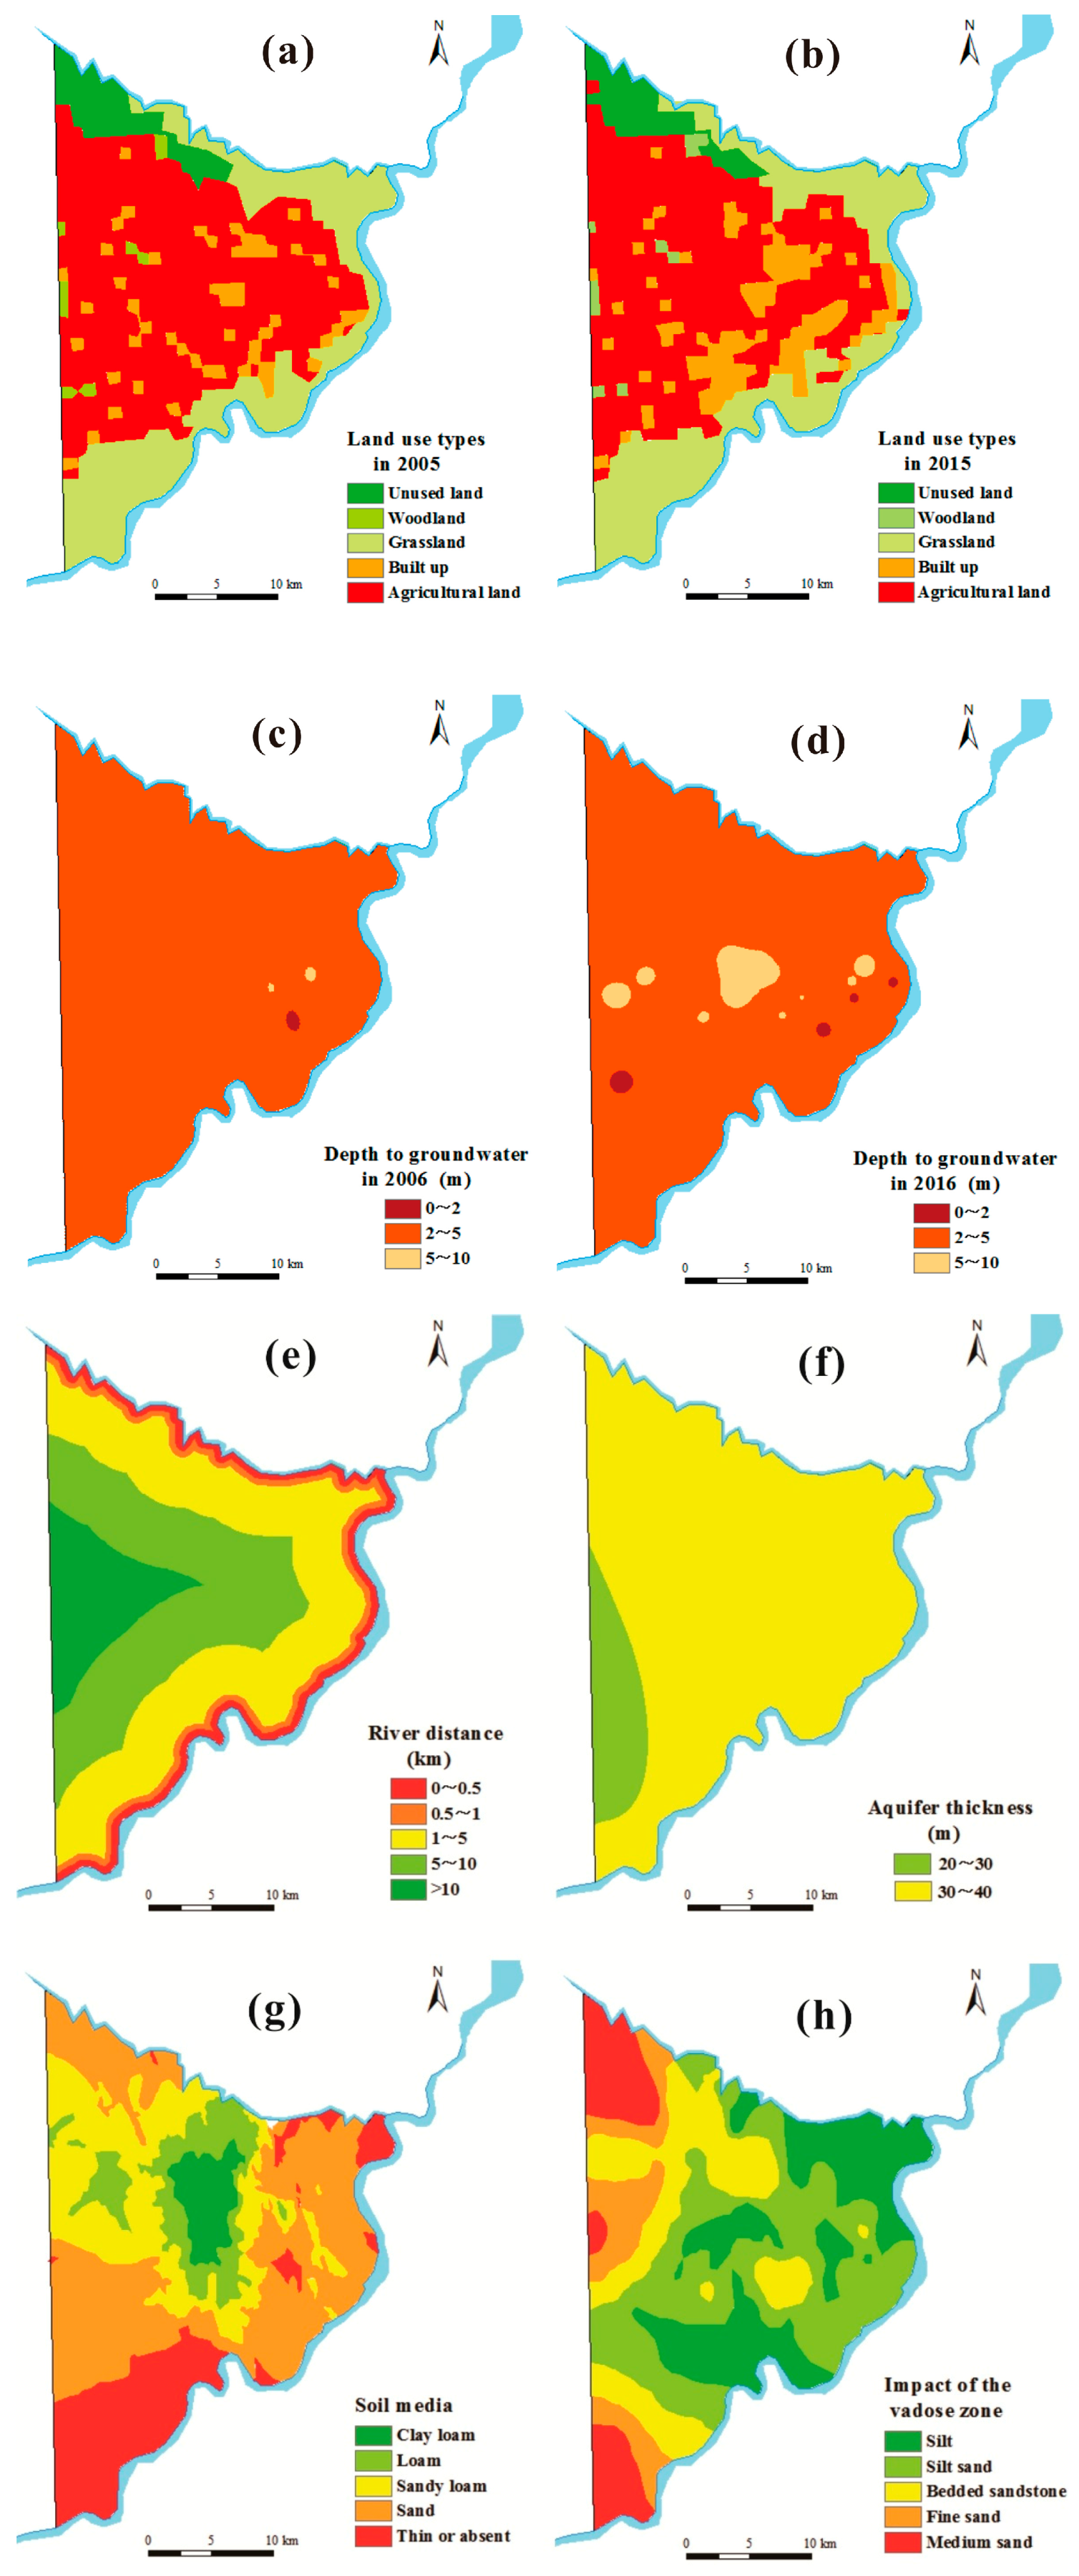
The assessment of groundwater vulnerability in this study was conducted based on modified DRASICL model. Spatial maps of seven parameters are shown in
Figure 5. Variation of water table depth and land use were compared in our study based on the assumption of other parameters had no change over time. During the study period, water table depth in both 2006 and 2016 were less than 10 m, which indicated the groundwater to be more susceptible to contamination, based on
Table 2. Most of the area in 2006 had a groundwater depth range of 2 to 5 m, which was associated with rating score of 8 (
Figure 5c). Areas with deeper depths in 2016 had increased, and were mainly were found in the central part. Although consumption of groundwater in 2016 increased significantly, recharge of groundwater during the rainy season reduced the drop of water table [
44,
61].
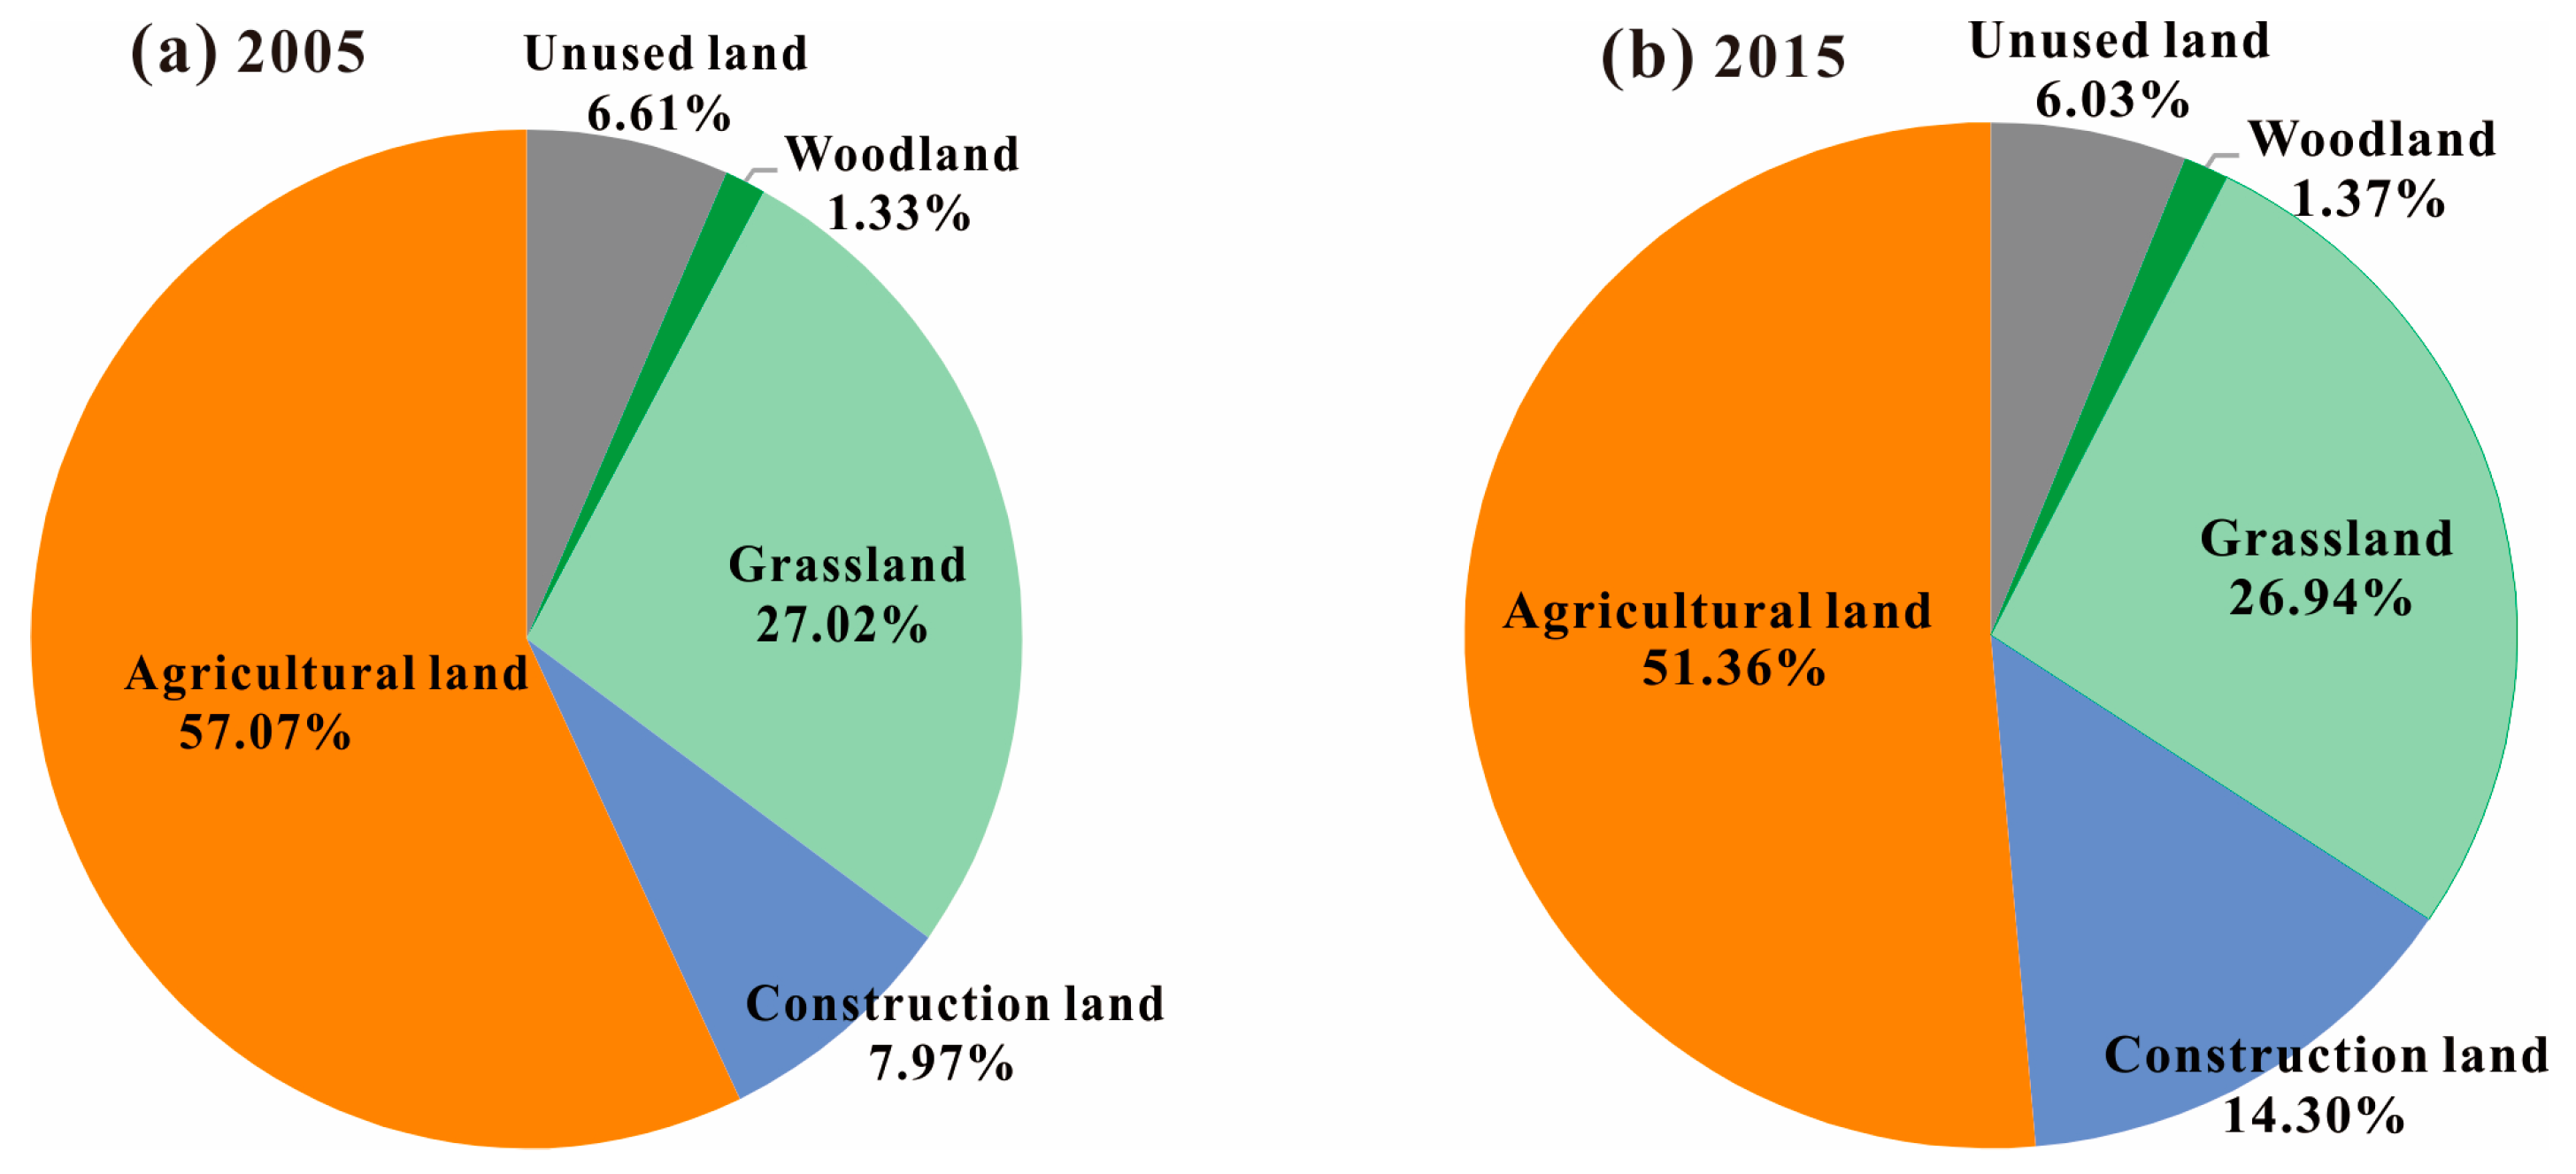
Free maps of nationwide land use type are provided every five years at the website of Geospatial Data Cloud, so maps of land use in 2005 and 2015 were evaluated. It can be seen from
Figure 4 that agricultural land occupied the largest area within the Limin District. In 2015, the areas of unused land, woodland, and grassland changed slightly compared with 2005. The drastic changes occurred at construction land that ranged from 8.0% in 2005 to 14.3% in 2015. It seems that an increase of construction land led to a decrease in agricultural land according to the comparison with
Figure 5a,b. To a certain degree, types of land use have determined the variety and quantity of pollutants [
6]. Irrational use of land will directly result in groundwater pollution, thereby affecting future land planning. With population growth and industrial development, area of construction land nearly doubled between 2005 and 2015.
The impact of rivers water on groundwater in the study area is obvious as varying with distance from rivers where interactions between groundwater and surface water occur. Anthropogenic sources such as industrial sources, fecal pollution, livestock wastewater, and agricultural pollution increase pollution of the rivers, which intensify groundwater vulnerability [
32], especially during the wet season, when groundwater is recharged from the rivers. Song et al. [
54] analyzed the distance between the groundwater sampling points and Songhua riverbank and inferred that the K
+, NH
4-N, and Cl
− concentrations of groundwater increased owing to the recharge of polluted surface water.
Figure 5e shows the distance from the rivers. Areas with closer distance from the rivers were associated with higher rating values that indicated stronger hydraulic connection between groundwater and the rivers. Both the level and quality of the river have impacts on groundwater system.
In general, aquifer thickness in the study area was relatively homogeneous (
Figure 5f), and thickness, which ranged from 30 to 40 m, occupied most of the area. Different soil media can reflect their infiltration capacity. Lower rating values are associated with lower infiltration capacity, which provides lower risk of groundwater pollution.
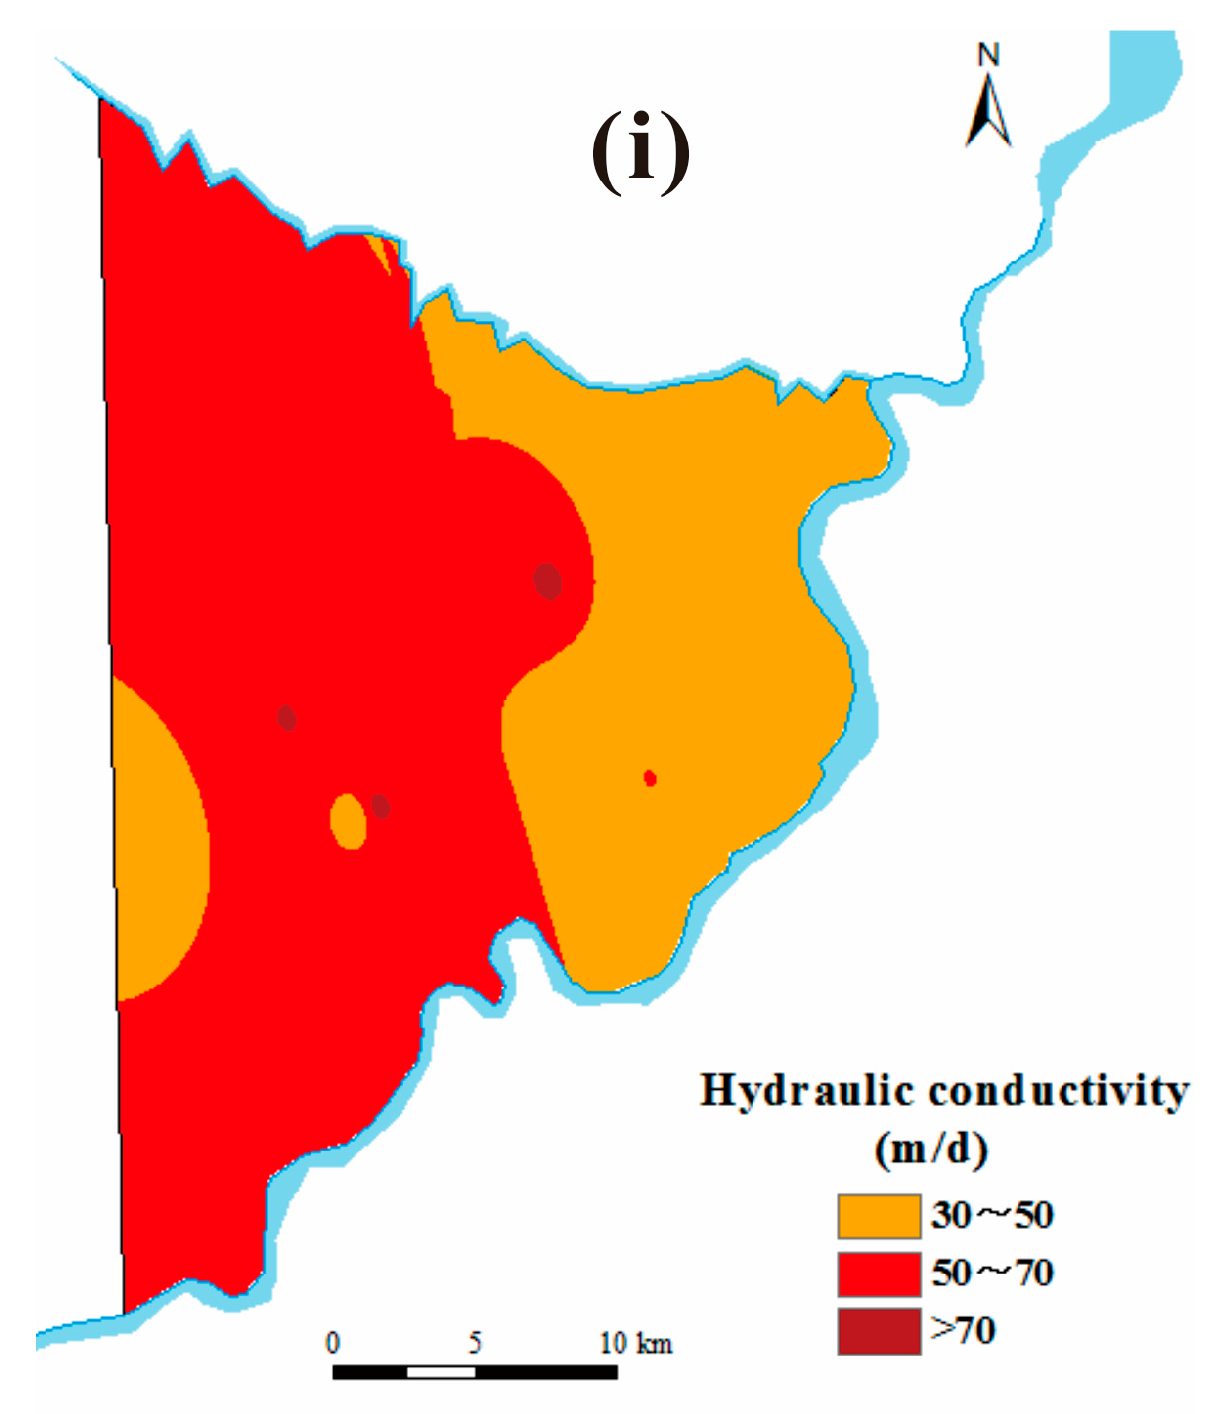
Figure 5h shows that eastern and northeastern parts of the vadose zone are occupied by silt and silt sand, which are assigned lower rating values. There are mainly two ranges of hydraulic conductivity and are assigned rating scores of 7 and 9. Hydraulic conductivity in the eastern part of study area ranged between 30 and 50 m/day, corresponding to a higher rating score of 7 (
Figure 5i).
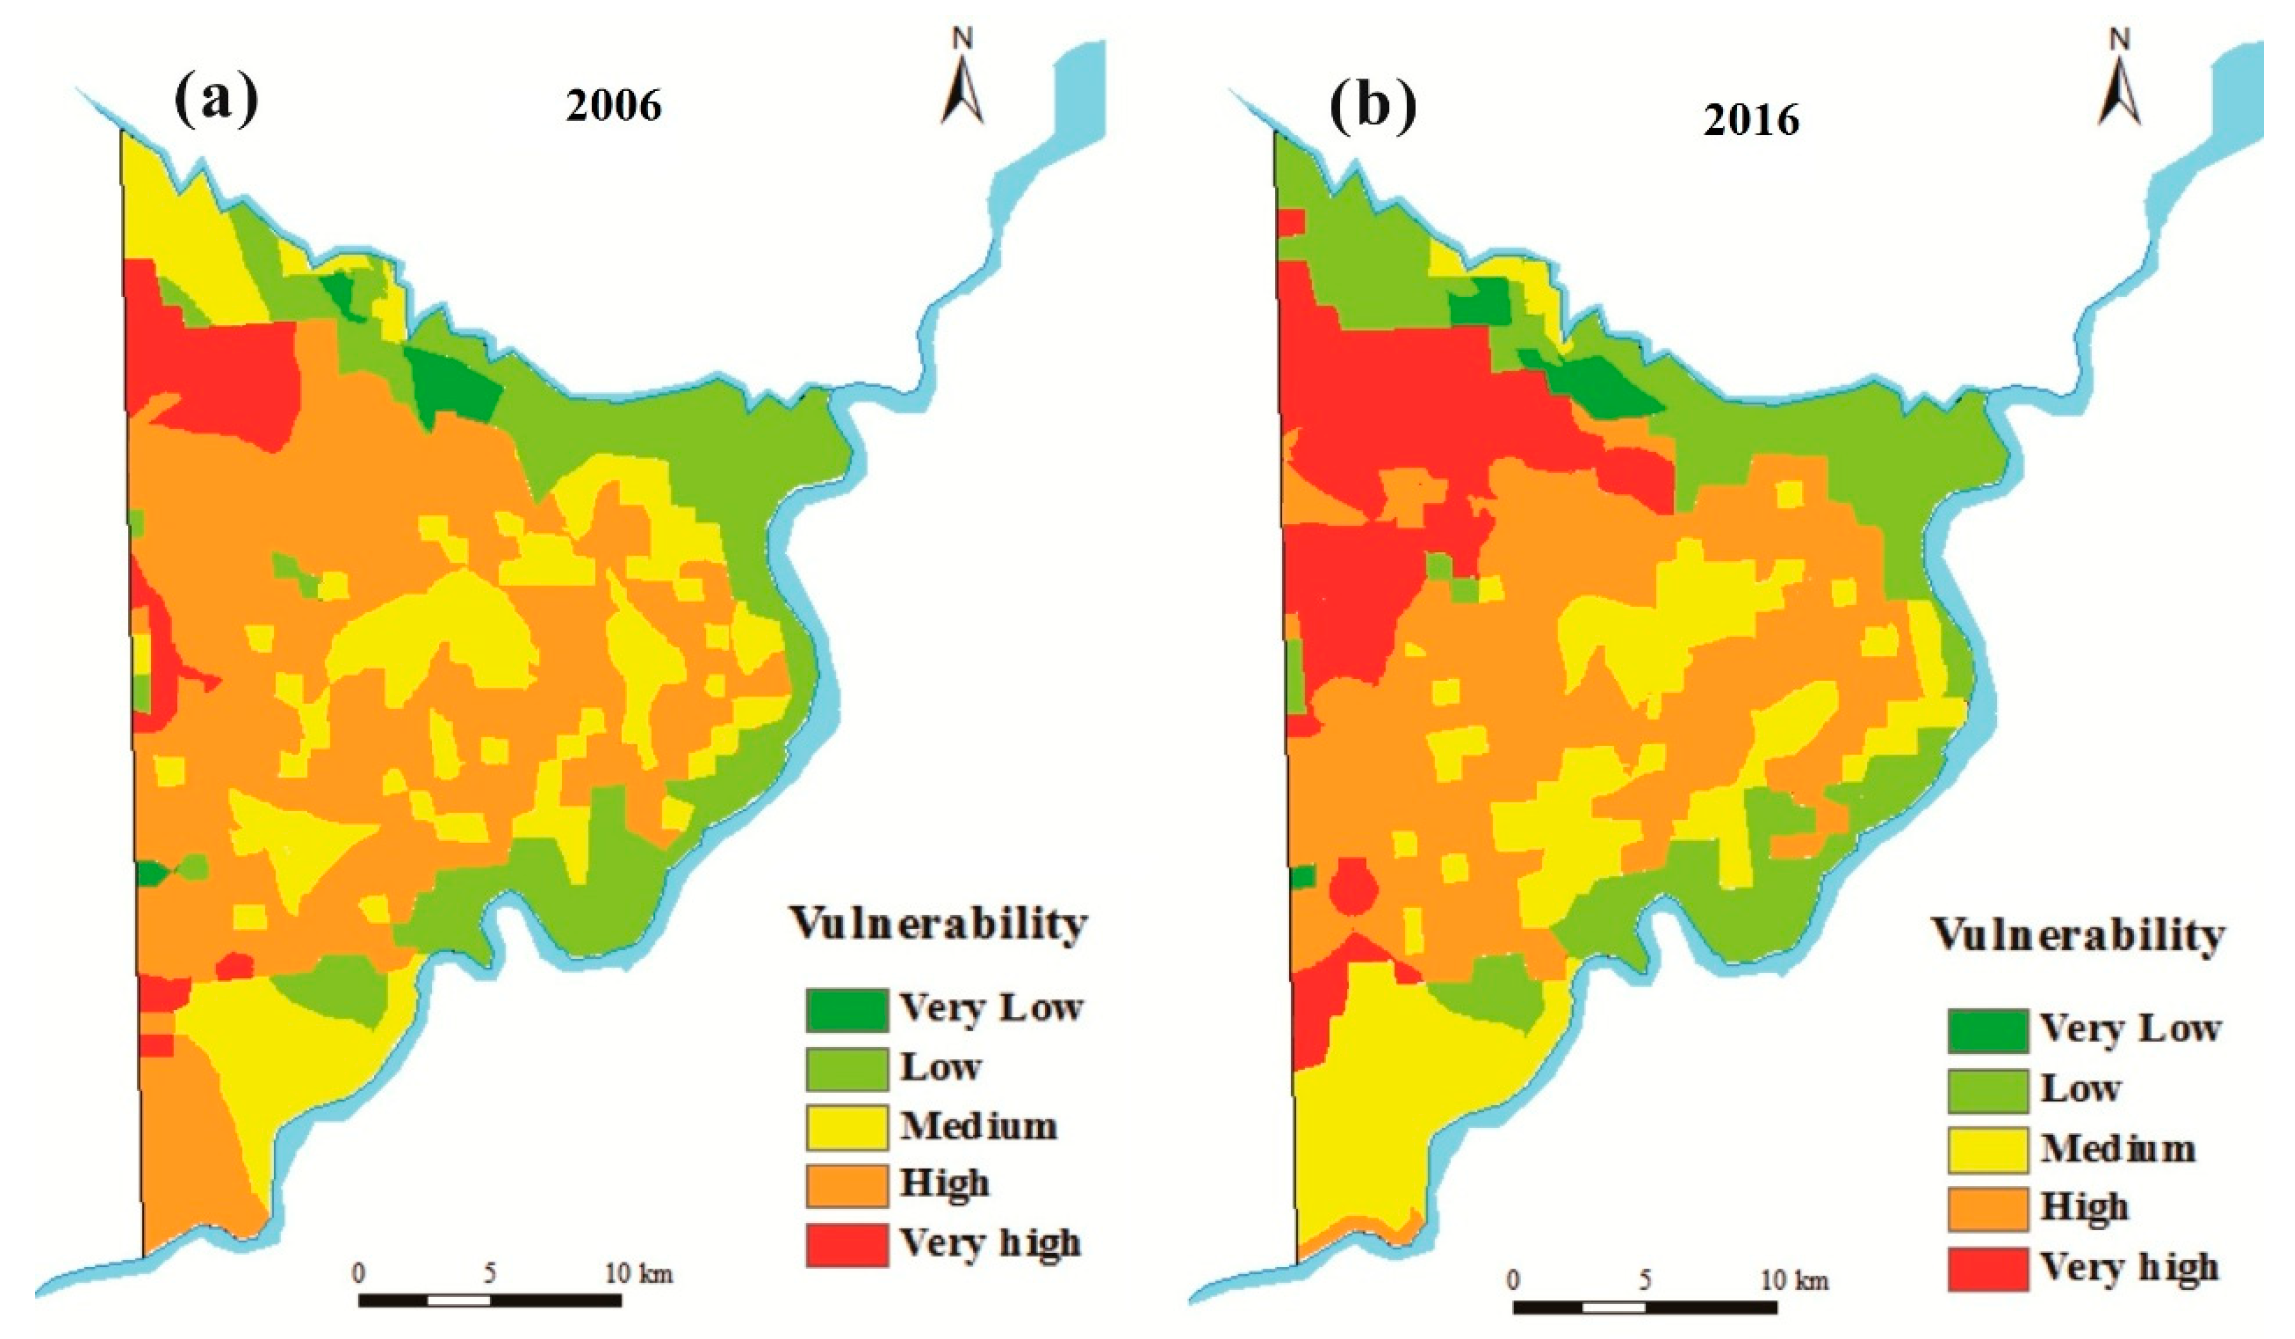
The groundwater vulnerability maps of 2006 and 2016 and areas of different classes of vulnerability are shown, respectively, in
Figure 6 and in
Table 6. Very low- and low-vulnerability zones in 2006 and 2016 accounted for 21.6% and 23.9% of the total area, respectively. Low vulnerability areas were mainly distributed in the low floodplain. The largest areas in 2006 and 2016 were determined to have high vulnerability and were, respectively, 47.5% and 37.0%. A very high-vulnerability area, which was found near the northwest corner, increased by 10% in 2016, compared with 2006. High- and very high-vulnerability zones in 2006 and 2016 corresponded to cultivated land, and this suggests that agriculture contributed more pollutants to shallow groundwater aquifers.
3.4. Human Health Risk Assessment
Higher concentrations of TFe, Mn, NH
4-N, and NO
3-N in groundwater are more likely to pose high risks to human health. They were used to conduct the non-carcinogenic health risk assessment, and the assessment results for adults and children in both years are shown in
Table 7. We found that the average HQ
Mn for adults and children was higher than other constituents’ HQ in 2006, while HQ
NO3-N was the highest in 2016. The non-carcinogenic risk values of TFe and Mn in 2016 for adults and children were markedly lower than in 2006. Recent research has shown that concentrations of Mn exceeding the drinking water standard may do harm to children’s intelligence [
62,
63]. Although the concentration of Mn is high in the Limin District, it is not difficult to remove it simply by using treatments such as aeration and sand filtration [
64]. There were slightly higher health risks of NH
4-N and NO
3-N for adults and children in 2016. High values of NO
3-N may pose higher risk of human illness, such as methemoglobinemia, gastric cancer, goiter, hypertension, etc. [
65].
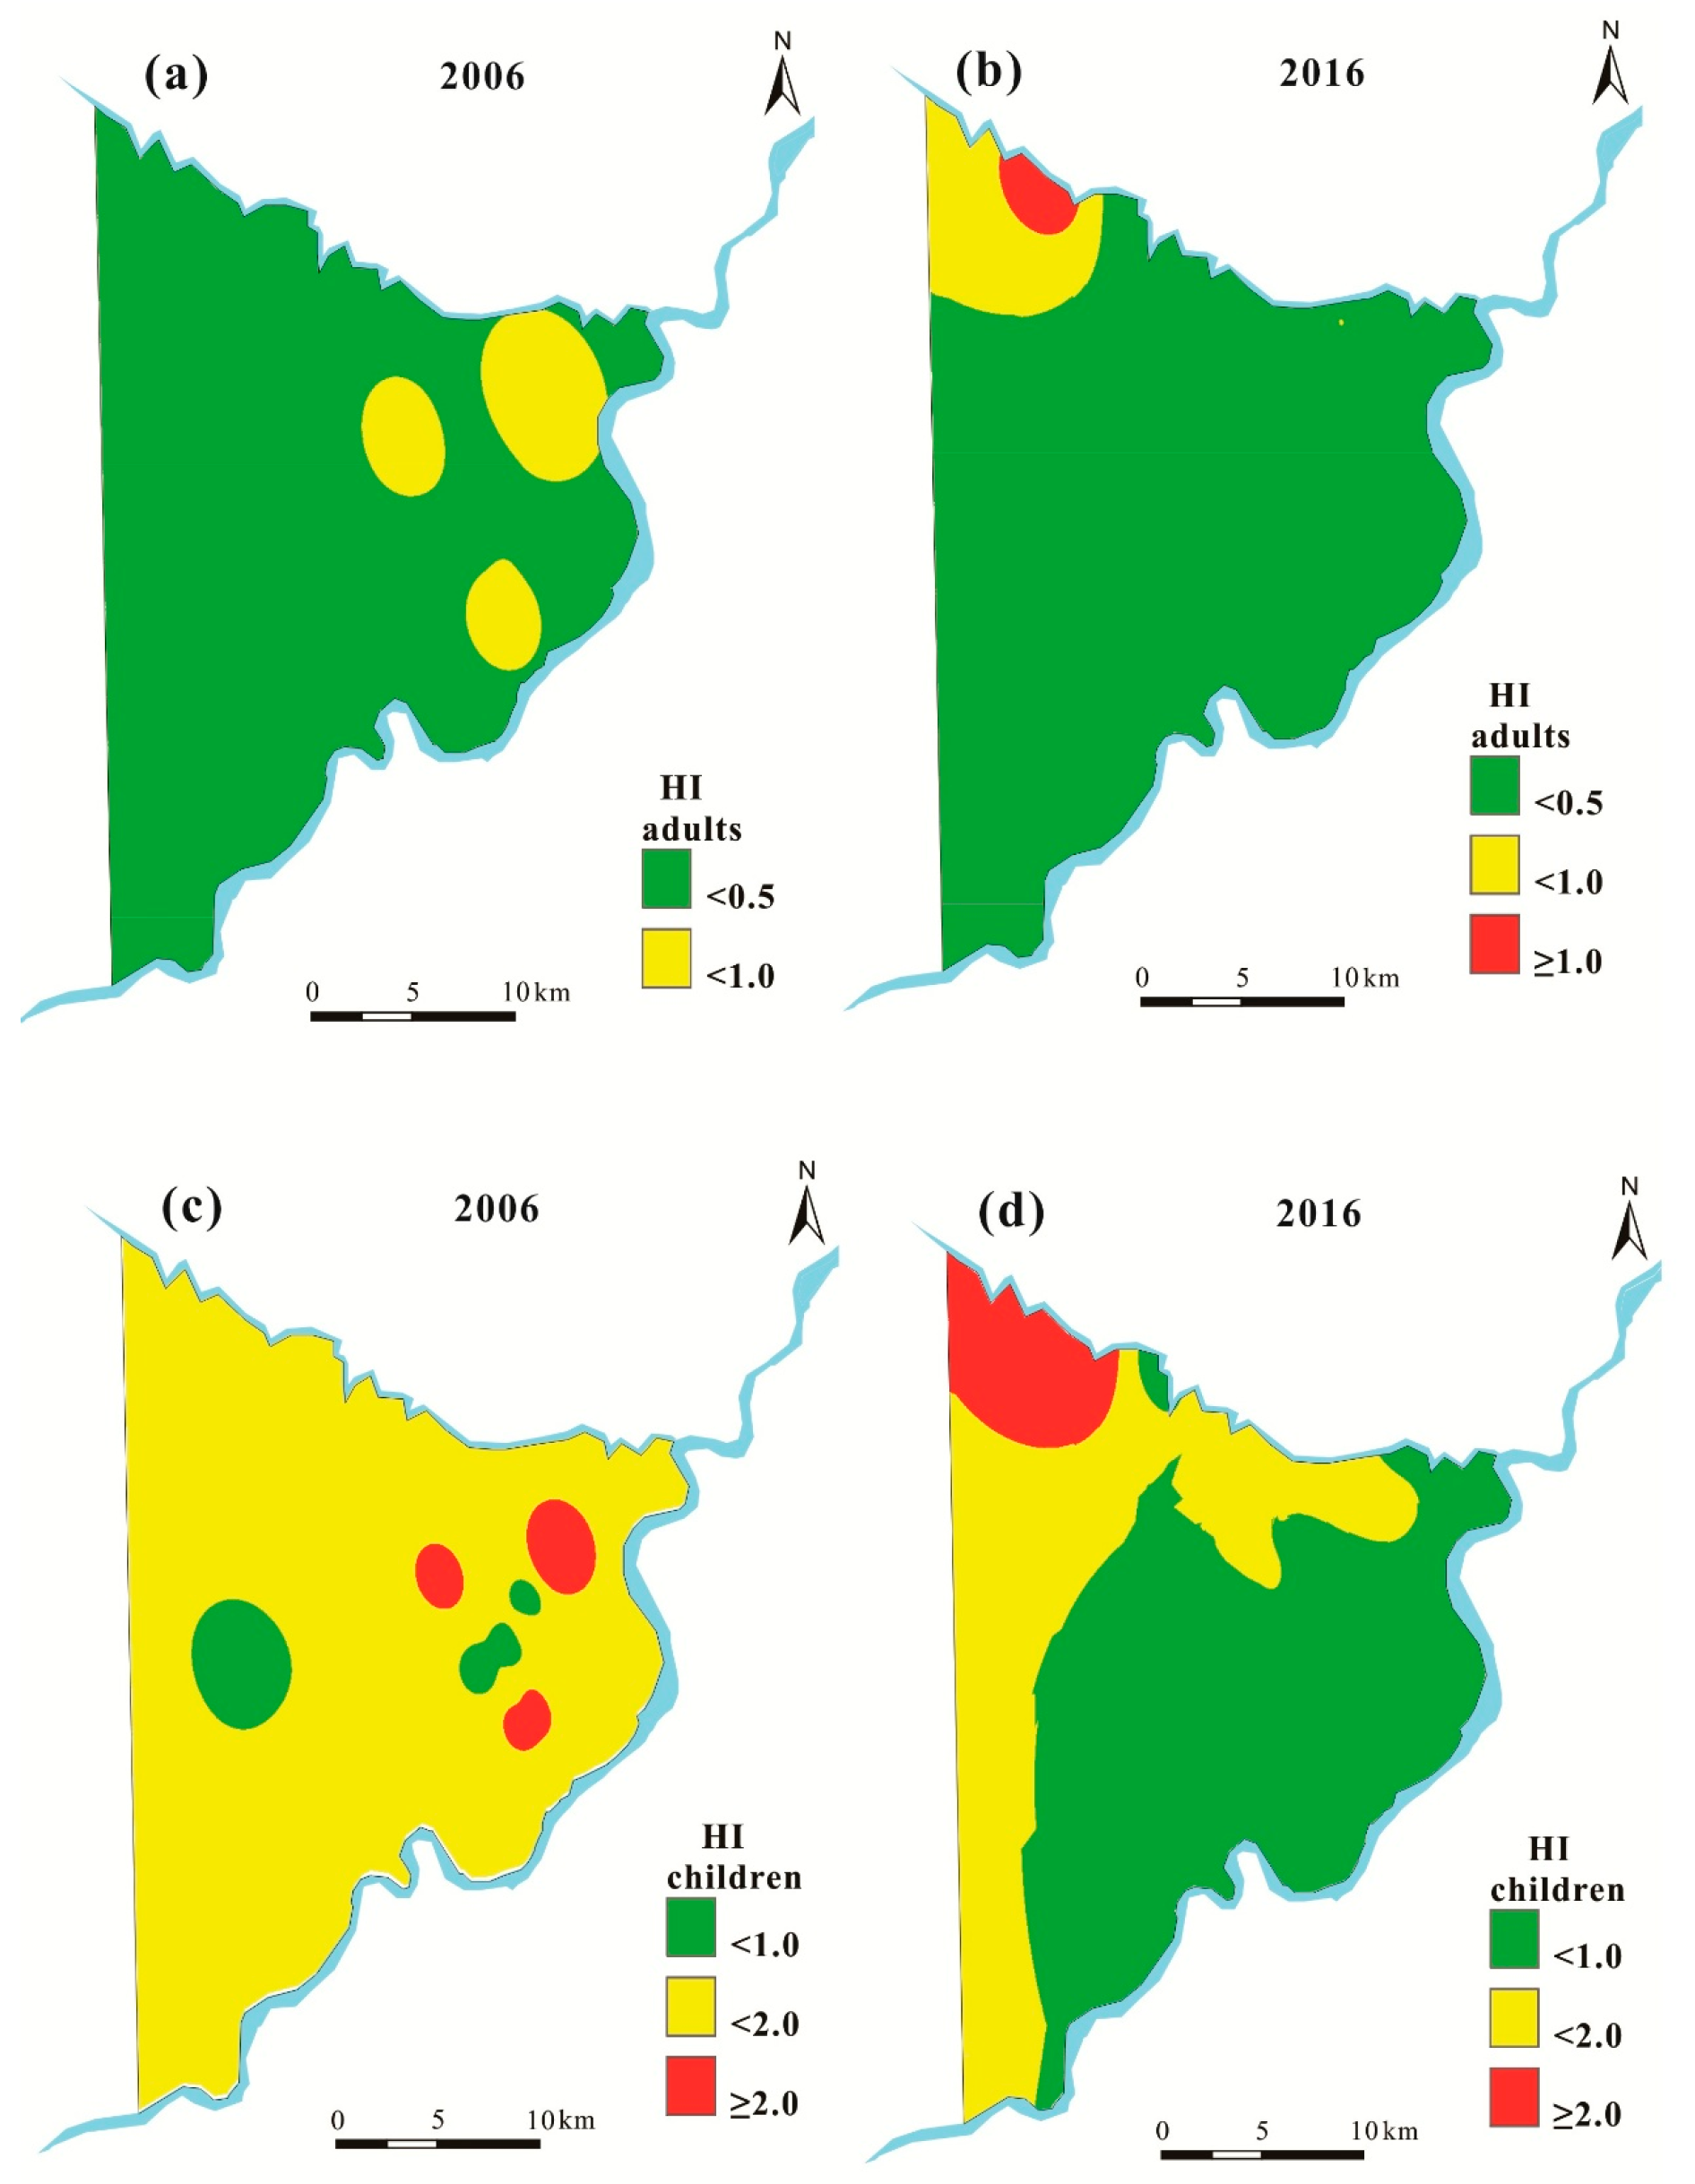
Spatial distribution of HI for adults (
Figure 7a,b) show that most areas have little to no health risks except for a small part of the northwest in 2016. HI for children was generally higher than for adults (
Table 7), whether in 2006 (
Figure 7c) or 2016 (
Figure 7d). In 2006, 91.8% of the study area had HI between 1.0 and 2.0, while this figure decreased to 34.4% in 2016. Additionally, in 2016, 58.4% had HI < 1.0, and 7.3% located at the northwestern corner had HI > 2.0.


