Article

Simulation of Soil Wetting Pattern of Vertical Moistube-Irrigation

1
Key Laboratory of Mechanics on Disaster and Environment in Western China, the Ministry of Education of China, College of Civil Engineering and Mechanics, Lanzhou University, Lanzhou 730000, China
2
College of Energy and Power Engineering, Lanzhou University of Technology, Lanzhou 730050, China
*
Author to whom correspondence should be addressed.
Water 2018, 10(5), 601; https://doi.org/10.3390/w10050601
Submission received: 11 April 2018 / Revised: 29 April 2018 / Accepted: 3 May 2018 / Published: 4 May 2018
(This article belongs to the Section Water Use and Scarcity)

Abstract

:
Knowledge of the soil wetting pattern characteristics of vertical moistube-irrigation is essential for the design of cost-effective and efficient irrigation systems. We conducted laboratory experiments to determine the specific discharge calculation formula and compare the accuracy of HYDRUS-2D simulation. The cumulative infiltrations, wetting pattern distances, and water content distributions predicted with HYDRUS-2D were found to align well with experimental data. The results provide support for using HYDRUS-2D as a tool for investigating and designing moistube-irrigation management practices. Numerical simulations were carried out with HYDRUS-2D to investigate the influence of soil texture, initial water content, pressure head, moistube length, and buried depth on wetting pattern characteristics. There are small differences in the shape of the soil wetting pattern, as well as significant differences in size. The wetting pattern and water content contour are approximately “ellipsoid” around the moistube. Soil texture has a significant effect on the wetting pattern characteristics, the vertical and horizontal wetting front distance, and the wetted soil volume decrease along with the increase of soil clay content. The initial water content, pressure head, and moistube length have great influence on the wetting front distance and the wetted soil volume. Both are positively correlated with the initial water content, pressure head, and length. Moistube buried depth affects the wetting pattern position. The soil wetting pattern decreases synchronously as the buried depth drops.

1. Introduction

The forest fruit industry is a good choice for achieving economic growth and ecological conservation in arid regions of northwest China [1]. However, the area has limited rainfall, and fruit tree production largely depends on irrigation [2,3]. Traditional flood irrigation has a large amount of water and low water use efficiency, which is not conducive to the sustainable development of the ecological economy [4]. Considering the strong surface evaporation and the deep-rootedness characteristics of fruit trees in arid areas, effective irrigation methods are urgently needed to transport the water directly to the root zone soil of the fruit trees, in order to reduce soil evaporation and improve irrigation water use efficiency.
Vertical line source moistube-irrigation (VLSMI) is a water-saving irrigation technique suitable for deep-rooted plants. It introduces membrane technology into the irrigation field, uses macromolecular polymer semipermeable membranes to make moistube, and irrigates water through moistube for subsurface irrigation [5,6]. The surface of the moistube contains nano-pores, which are uniformly and densely distributed. During irrigation, the soil water movement is approximately line source infiltration. Compared to subsurface drip irrigation, the main advantages of VLSMI include a line source infiltration increasing the wetted depth, a freely settable spacing, and a low-pressure head and less power consumption. Given that the fruit trees are wider in spacing and deeper in the system of root, this type of tree is more appropriate for applying the VLSMI technique [7].
The rational design of VLSMI systems requires knowledge of the soil wetting pattern characteristics around the line source to minimize the soil surface moisture and deep percolation [8]. The dynamic changes and water distribution of wetting patterns depend on many factors, including soil physical properties (texture, bulk density, and initial water content) and emitter parameters (discharge rate, line source length, and buried depth) [9,10,11,12,13]. Several studies have shown that soil texture is an important factor for determining irrigation design parameters because it has a great influence on infiltration. Therefore, the design of the subsurface irrigation system should involve consideration of soil texture [10,13,14,15]. Generally, under the same soil conditions, when the soil bulk density increases, the soil becomes dense and porosity decreases. This results in a decrease of soil infiltration capacity [16,17,18,19]. The initial water content determines the soil water potential at the initial stages of infiltration. The higher the initial soil water content, the larger the size of the wetting pattern in all directions [10,12,20].
To ascertain the impact of the emitter discharge rate on the wetting pattern sizes, the researchers conducted many laboratory and field experiments. For an equal volume of applied water, an increase in the emitter discharge rate leads to an increase in horizontal diffusion distance and a decrease in vertical wetted depth [21,22,23,24]. Ismail et al. [25] set up “a hydraulic barrier” (with a secondary drip line buried below the primary line), and found that when the secondary drip line wets the soil below the primary drip line, it will force water from the primary drip line to redistribute horizontally and upwards, instead of moving downward. El-Nesr et al. [12] showed that the dual-drip irrigation system can improve water distribution in sandy soils. Additionally, the sequential and concurrent dual-drip irrigation system can efficiently limit downward leaching of the solutes. In addition, the soil-wetting pattern depends on the emitter’s position relative to the soil surface. It is a key factor for achieving an effective match between wetted soil volume and crop roots [12,26].
Numerical simulation is an efficient method for studying optimal irrigation management practices. In order to efficiently describe the soil water movement from a point source or line source, the researchers designed some models [27,28,29,30,31]. The numerical model HYDRUS developed by Šimunek et al. [32] has been widely used to simulate soil water movement for various irrigation methods. Many investigators have used this model to evaluate either field or laboratory experiments, as well as other mathematical models [12,13,33,34,35,36]. The HYDRUS model enables its users to trace the movement of water, solutes, and the wetting patterns in both simple and complex geometries, for homogeneous or heterogeneous soils, and for different combinations of initial and boundary conditions.
The objectives of this study are to assess the feasibility of HYDRUS-2D for simulation of the soil water movement of vertical line source moistube-irrigation through a laboratory experiment, and to investigate numerically the influence of soil texture, initial water content, pressure head, moistube length, and buried depth on the soil wetting pattern.

2. Materials and Methods

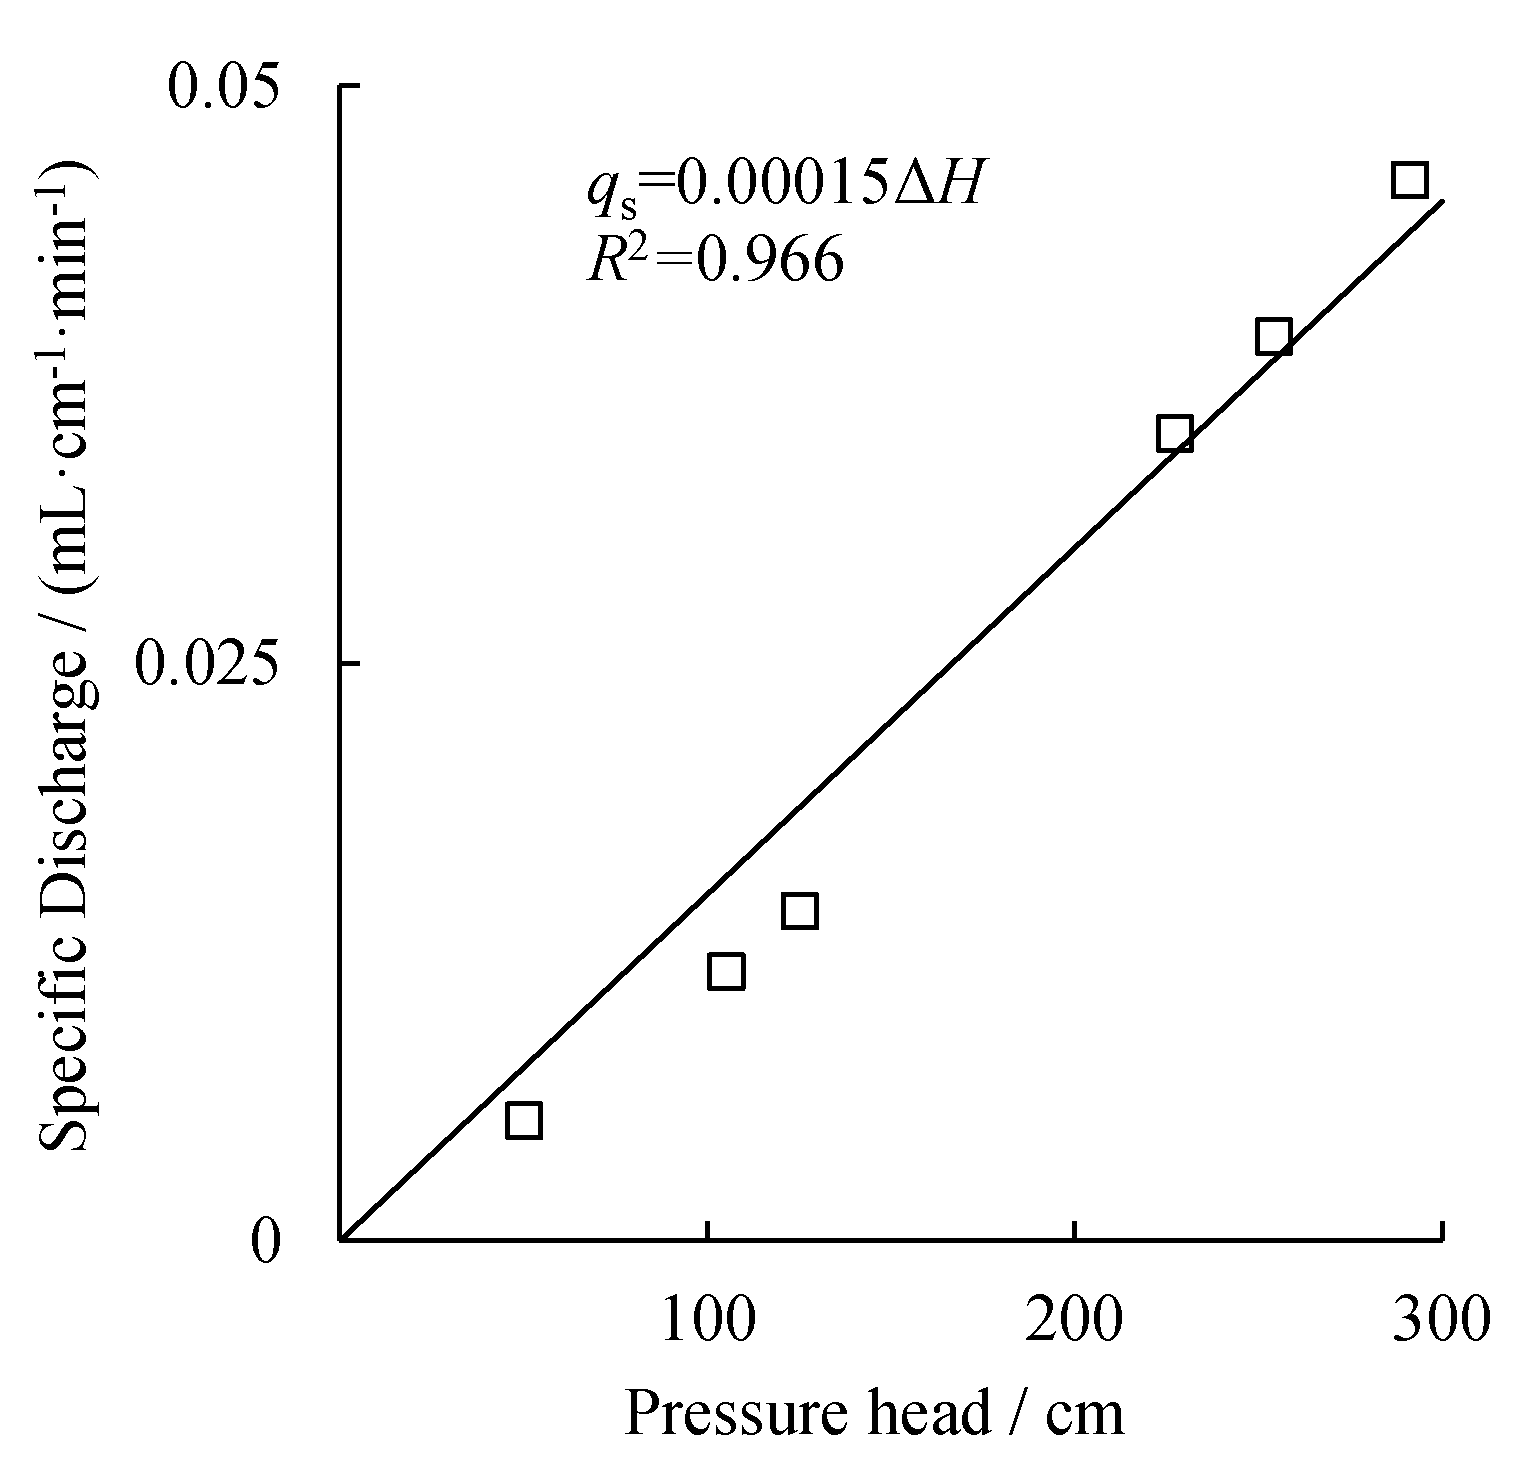
2.1. Specific Discharge Calculation

Moistube is a porous semipermeable membrane, which is the same as a porous medium (e.g., soil). Its seepage process conforms to Darcy’s law [37,38].
Q = k π D n L Δ H d
where Q is moistube discharge (mL/min), k is moistube permeability coefficient (cm/min), D n is moistube inner diameter (cm), L is moistube length (cm), Δ H is pressure difference between the inside and outside of moistube (cm), and d is moistube thickness (cm).
The moistube is not only the delivery pipe but also the seepage pipe and the pipe wall is permeable everywhere. Assuming the surface pore is evenly distributed on the moistube, the specific discharge of the moistube can be obtained.
q s = Q / L
where q s is moistube specific discharge (mL/(cm·min)).
Substituting Equation (2) into Equation (1), the following equation is generated.
q s = k π D n Δ H d
Given that inner diameter and thickness of moistube are constant, Equation (3) can be simplified using the equation below.
{ q s = K Δ H K = k π D n / d
where K is the comprehensive permeability coefficient (mL/(cm2·min)).
When the moistube is vertically placed in the soil, the pressure difference between the inside and outside of the moistube is mainly affected by the pressure head, the soil lateral pressure, and the soil water suction. Niu et al. [39] found that water pressure was the key factor in controlling the moistube discharge, which is followed by soil bulk density. The initial water content had the least effect on discharge. Based on Equation (4), the expression of specific discharge in the soil was established using the following equation.
q s = K ( H + M + a γ N + b )
where H is inlet pressure head (cm), M is distance between compute nodes and water inlet (cm), γ is soil bulk density (g/cm3), N is buried depth of compute nodes (cm), and a and b are fitting parameters.

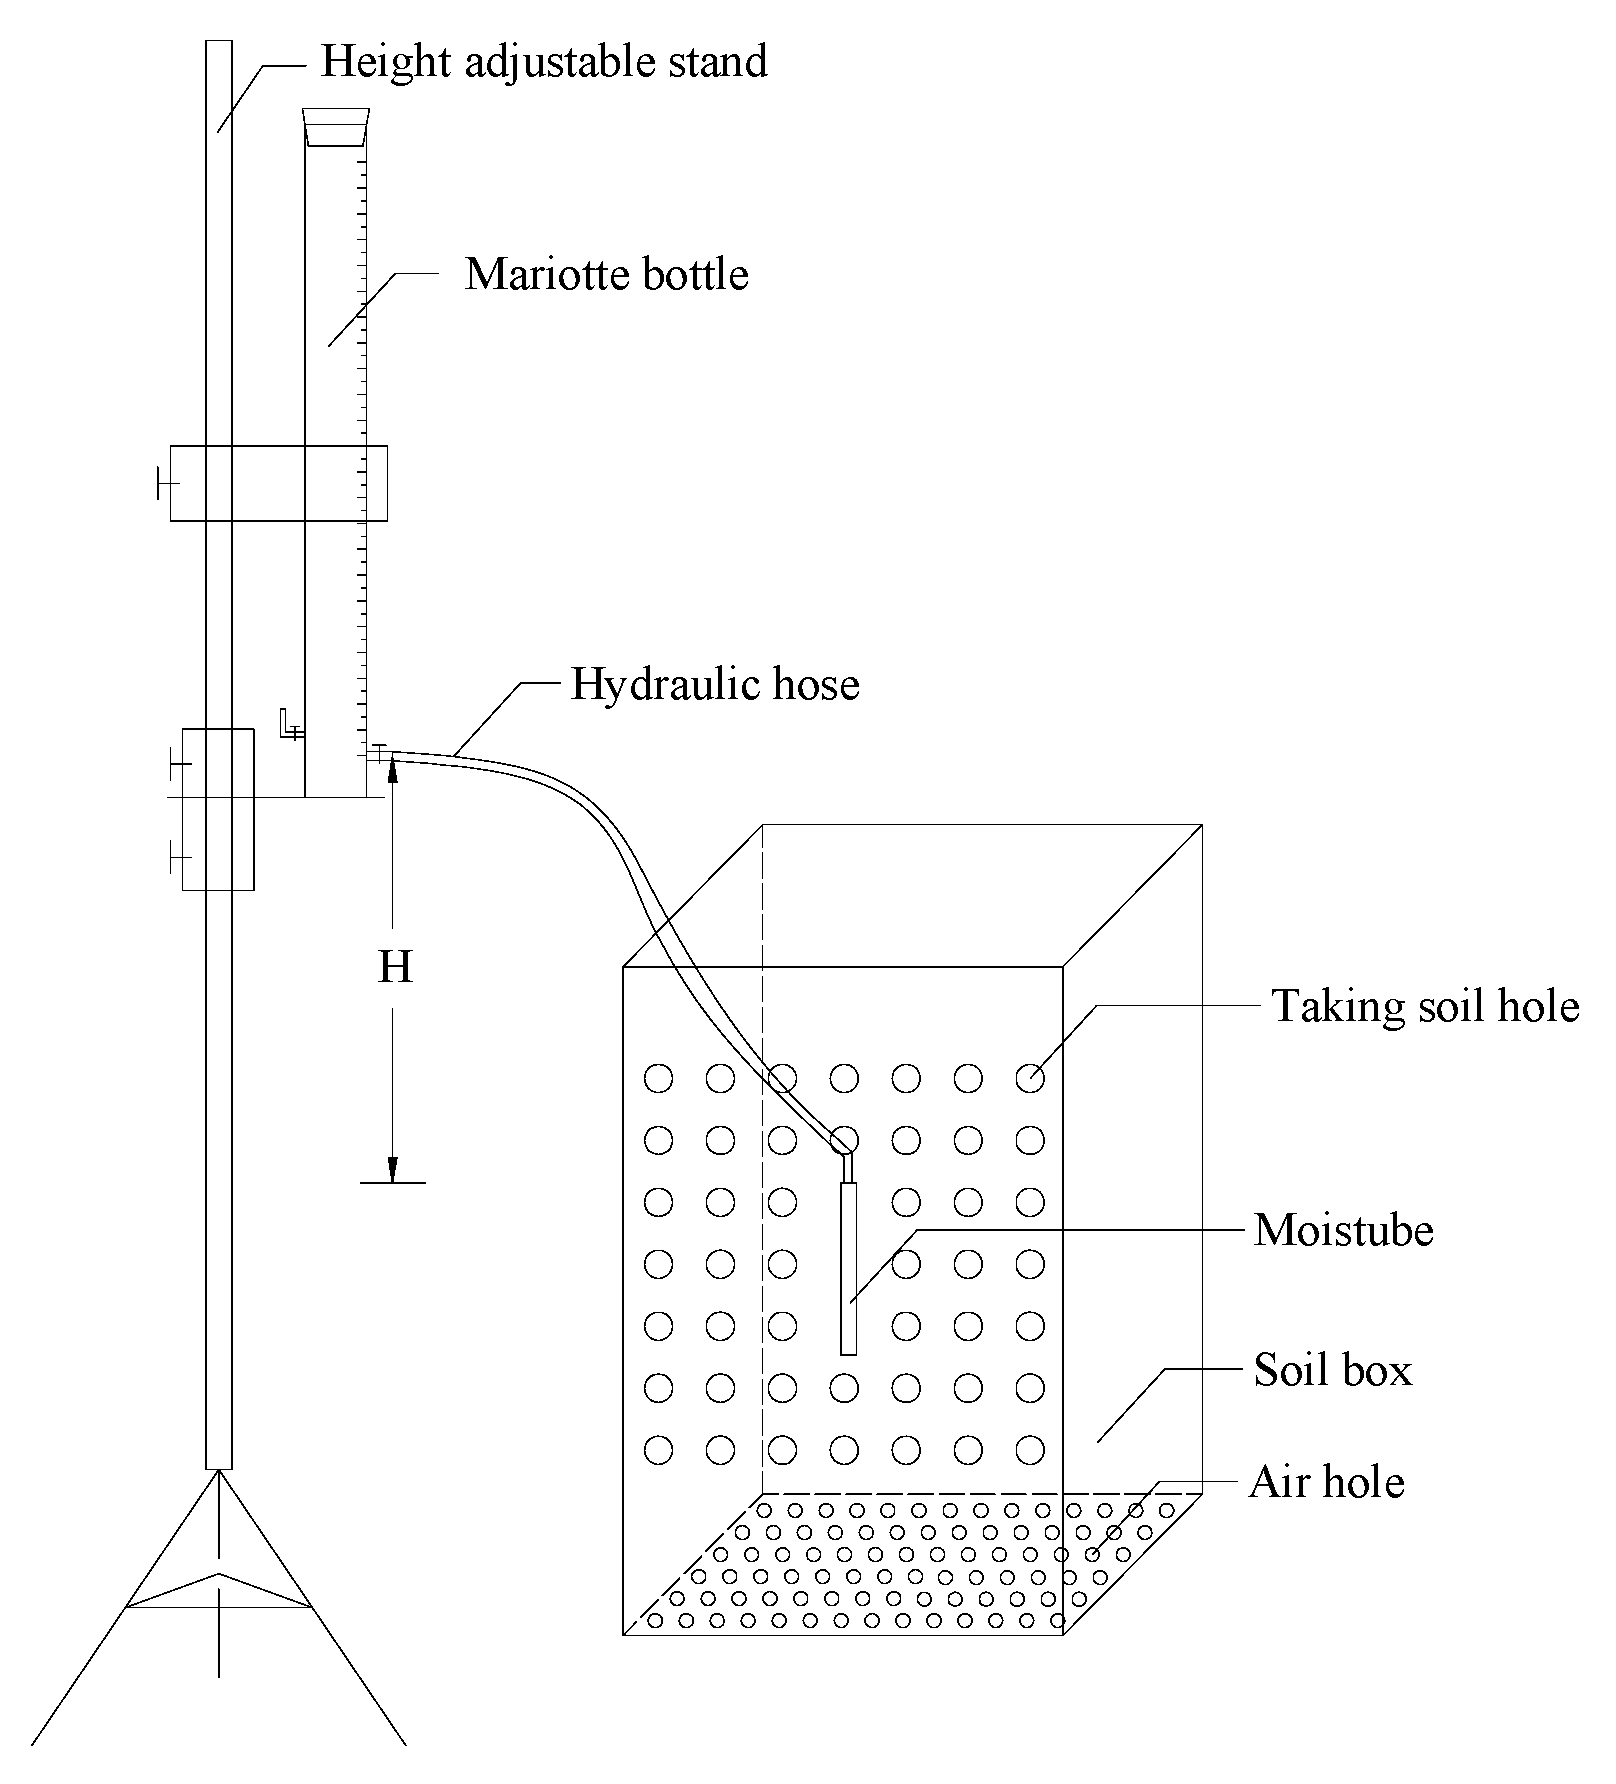
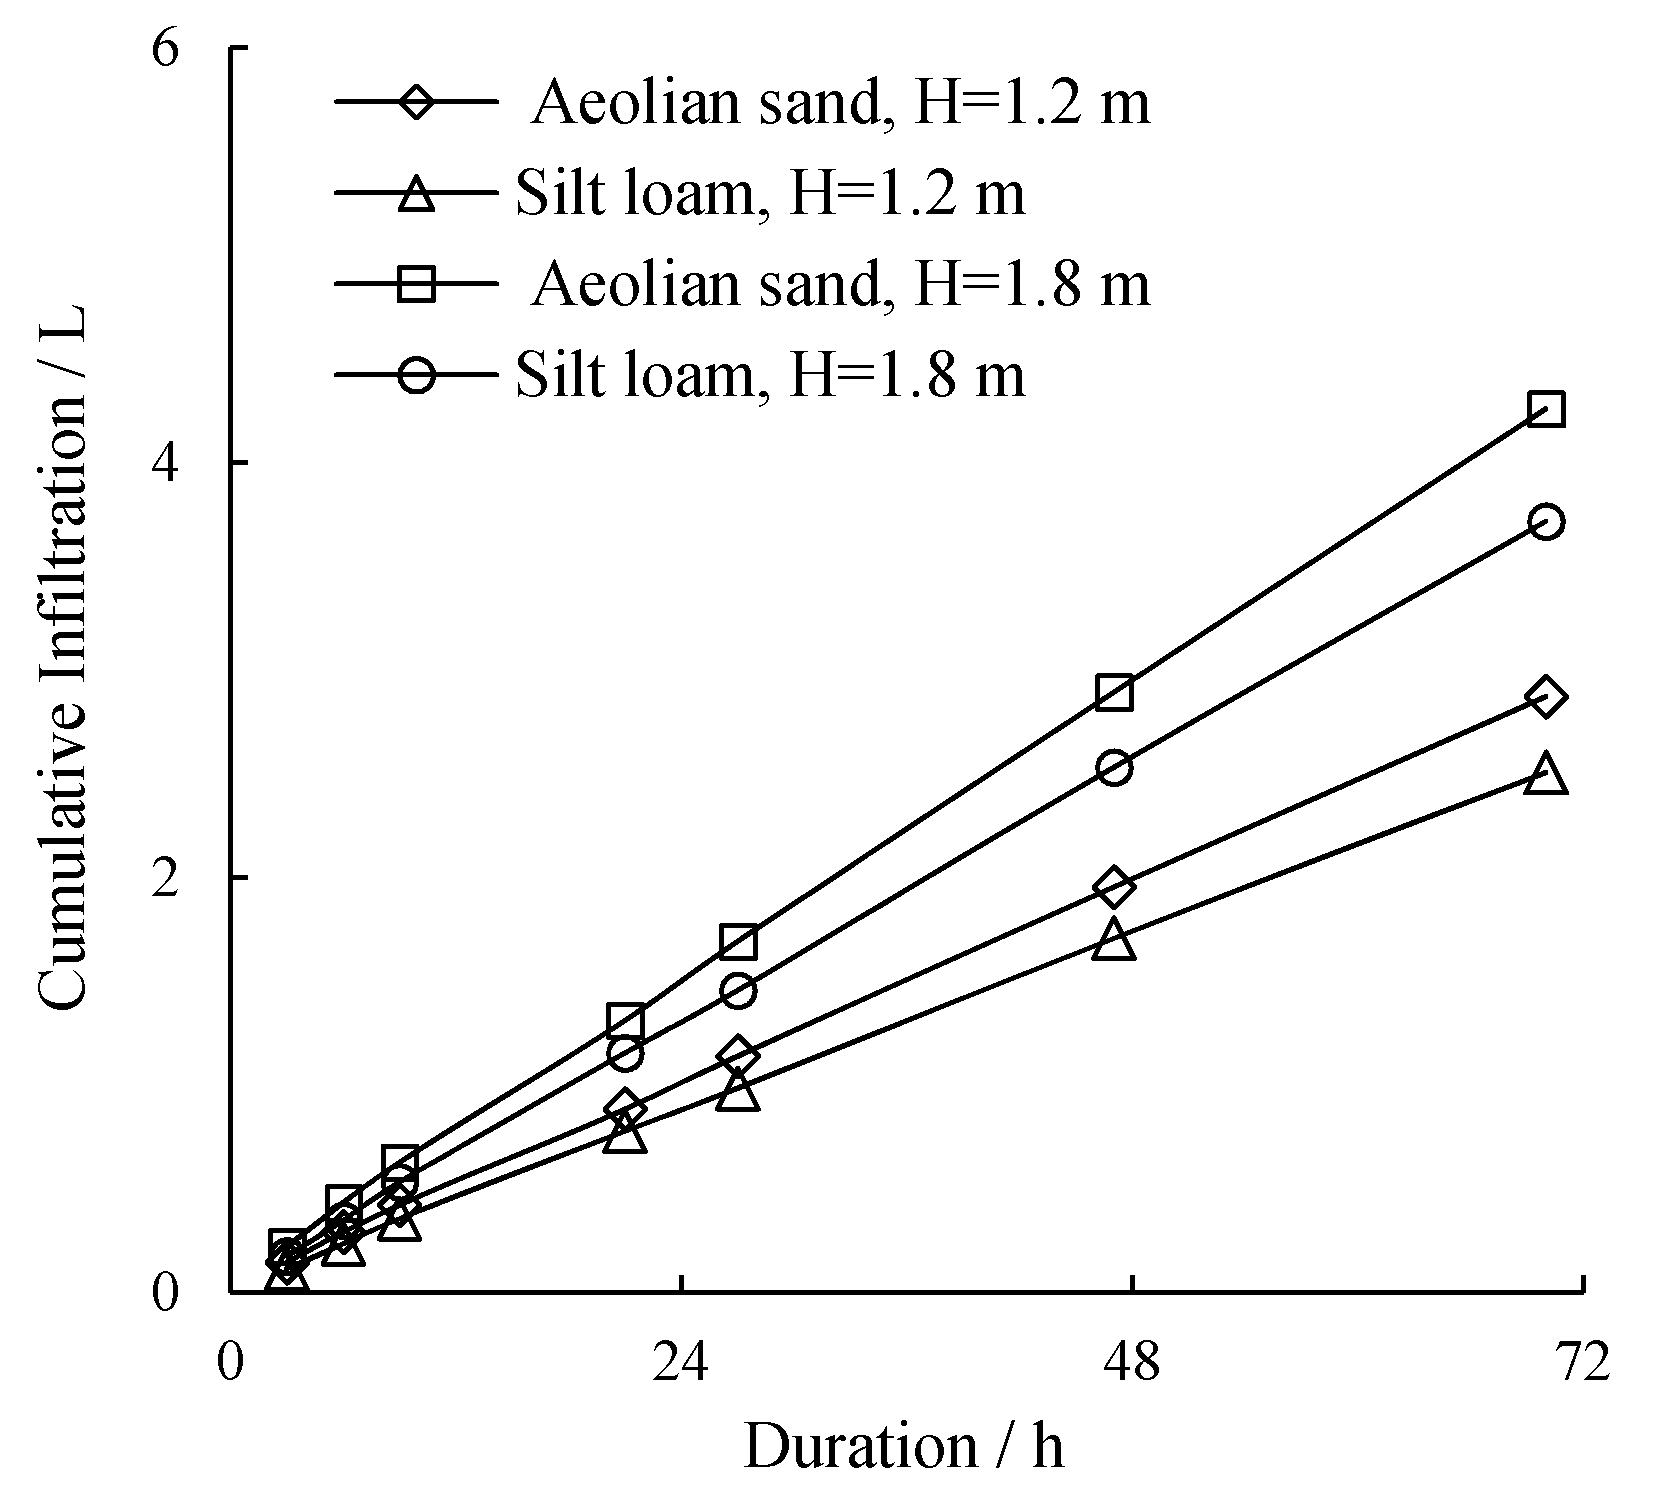
2.2. Laboratory Experiments

The experimental equipment, presented in Figure 1, was comprised of five parts including the soil box, the mariotte battle, the moistube, the height adjustable stand, and the hydraulic hose. The soil box was made of transparent acrylic material with the thickness of 10 mm, and measured 60 cm long, 60 cm wide, and 100 cm deep. A considerable amount of air holes with a diameter of 2 mm were opened at the bottom of the soil box for ventilation. The soil holes with a diameter of 2 cm and a spacing of 5 cm were designed on the side of the soil box near the moistube to measure soil water content (SWC) after irrigation. The moistube had a 16 mm inside diameter, a thickness of 1 mm, and seepage holes of 10 to 900 nm. A Mariotte bottle was used to maintain a constant pressure head.
The experiment was carried out in air and soil conditions. In the air, we aimed to determine the comprehensive permeability coefficient, which was performed for the six different pressure heads (0 cm, 55 cm, 75 cm, 177 cm, 204 cm, and 241 cm) and a fixed moistube length of 100 cm. A study of water infiltration under moistube-irrigation was conducted on aeolian sand and silt loam, which were taken from Jingtai and Qilihe District, China. Basic physical properties of these tested soils are listed in Table 1. The soil sample was loaded into a soil box at 5-cm per layer to acquire a homogeneous soil profile. The moistube was placed close to the wall of the soil box to observe the soil wetting pattern. The moistube in aeolian sand and silt loam was 40 cm and 30 cm in length, respectively. Its water inlet was located 20 cm below the soil surface. Two pressure heads (1.2 m and 1.8 m) were adopted. The experimental data under the pressure head of 1.2 m was used to fit the formula parameters of specific discharge and the experimental data under 1.8 m pressure head was used for simulating verification. Cumulative infiltration was recorded and the wetting pattern was drawn during the infiltration. Finally, after infiltration for 70 h, the water supply was stopped and soil samples were collected from taking soil holes and the SWC was determined by recording the weight loss of the samples after oven drying at 105 °C for 24 h.

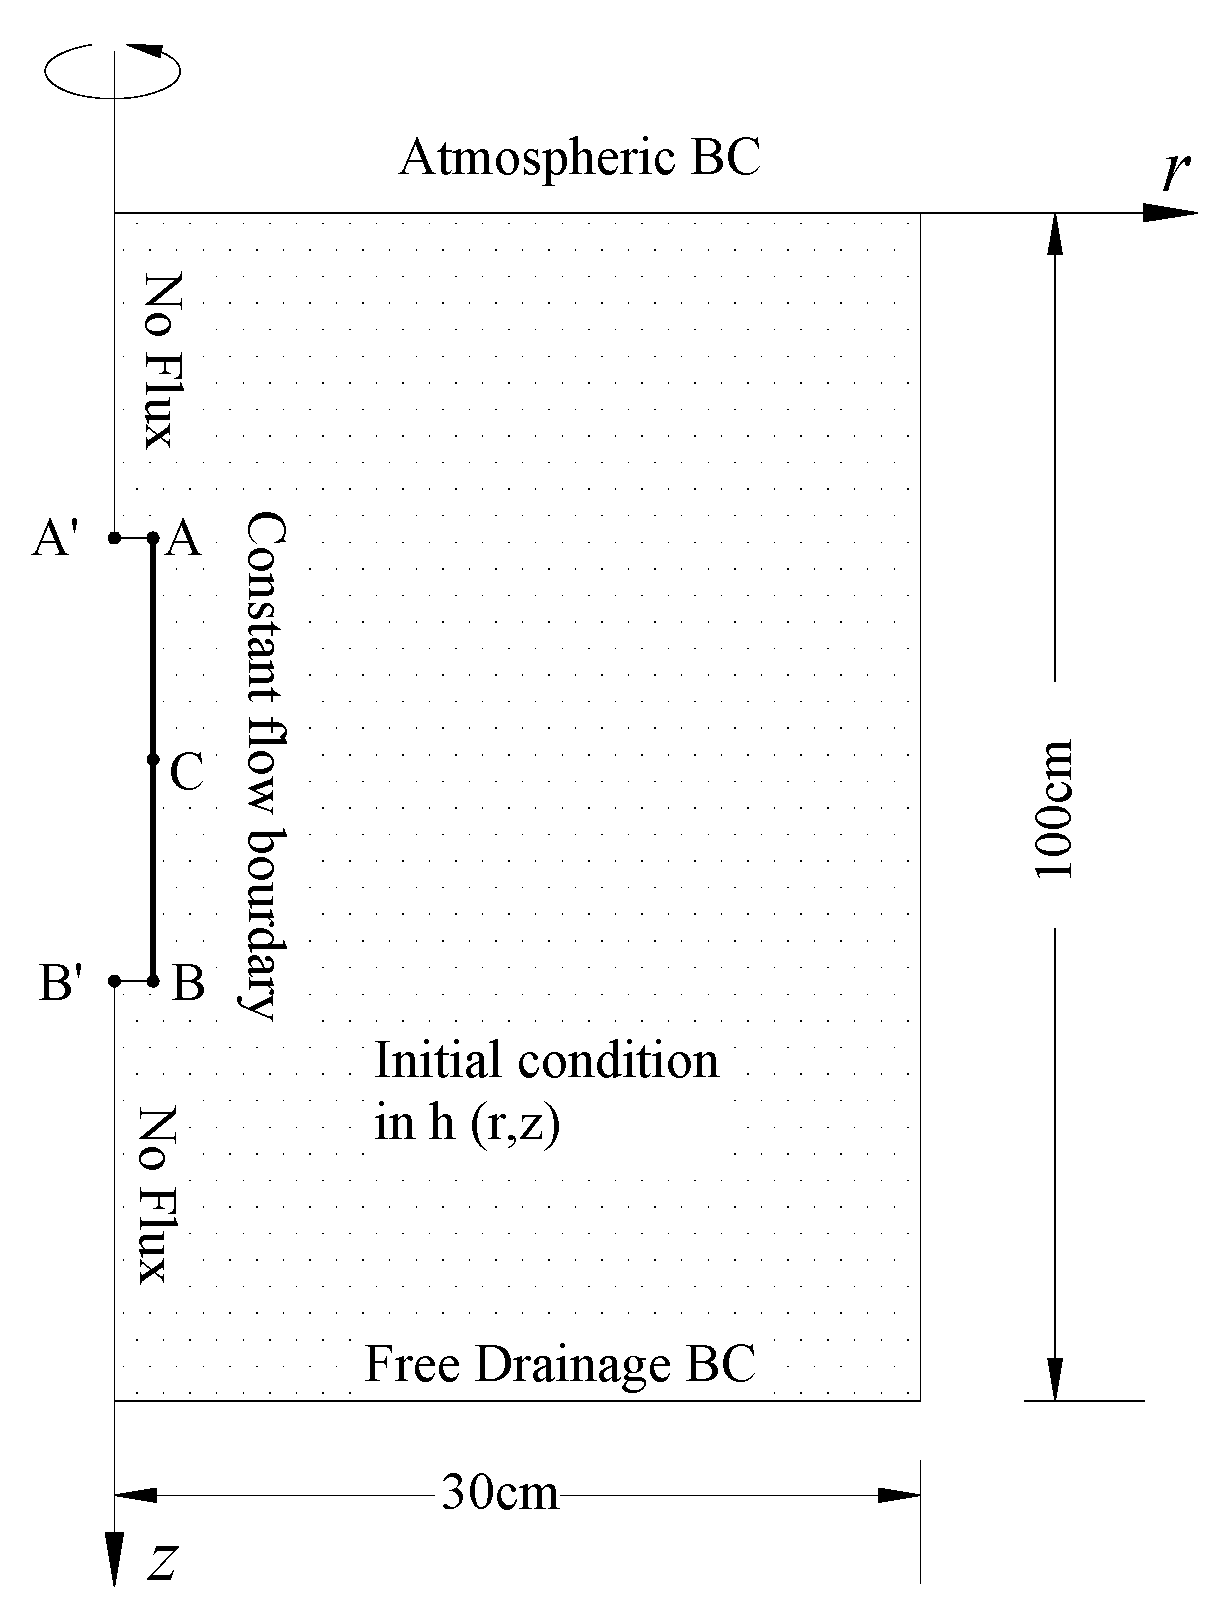
2.3. Numerical Model

Assuming the soil is homogeneous and isotropic, the water infiltration of the vertical line source moistube-irrigation can be conceptualized as an axisymmetric three-dimensional process. We simulated water infiltration using HYDRUS-2D [40]. The governing equation for water flow is the 2D Richards equation.
θ t = 1 r r [ r K ( h ) h r ] + z [ K ( h ) h z ] K ( h ) z
where θ is the volumetric water content (cm3·cm−3), t is the time (min), r is the radial (horizontal) coordinate (cm), K(h) is the unsaturated hydraulic conductivity (cm·min−1), h is the soil water pressure head (cm), and z is the vertical coordinate that is positive downward (cm).
The water retention curve and hydraulic conductivity curve are important soil characteristics [41]. A centrifugal machine (SCR-20) was used to determine a water retention curve under rotational speeds of 900 rpm, 1700 rpm, 2200 rpm, 2800 rpm, 3100 rpm, 5300 rpm, 6900 rpm, and 8100 rpm, respectively. Each speed was maintained for 60 min. Then SWC was measured for each rotational speed in which the soil water suction was calculated using Equation (14).
S = 1.118 × R × ( r p m ) 2 × 10 5
where R is the radial distance to the midpoint of the soil sample (cm) and r p m is rotational speed.
After determining the soil water retention curve, saturated conductivity was measured on the same soil samples using a constant head permeameter [34].
The van Genuchten-Mualem model [42,43] was used to describe the constitutive soil hydraulic properties.
θ ( h ) = θ r + θ s θ r ( 1 + | α h | n ) m
K ( h ) = K s S e 0.5 [ 1 ( 1 S e 1 / m ) m ] 2
where θ s is saturated water contents (cm3·cm−3), θ r is residual water contents (cm3·cm−3), K s is saturated hydraulic conductivity (cm·min−1), S e is the effective degree of saturation equal to ( θ θ r ) / ( θ s θ r ) (–), α is an empirical parameter (cm−1) inversely related to the air entry value, and m and n are empirical constants affecting the shape of the retention curve (–). The value of m is restricted by m = 1 − 1/n.
The θ ( h ) and K ( h ) relationships in Equations (8) and (9) were simultaneously fitted to the experimentally obtained θ ( h ) and K ( h ) data using the RETC software [44]. The van Genuchten-Mualem analytical model parameters [Equations (8) and (9)] for the soil water retention and conductivity curves are listed in Table 2.
The infiltration space can be described as a three-dimensional axisymmetric domain, which is shown in Figure 2. The transport domain was 30 cm wide (radius) and 100 cm deep (depth).
The initial and boundary conditions (BC) are also presented in Figure 2. In the simulation, the initial condition was the initial pressure head, the upper boundary was the atmospheric condition, and the lower boundary was the free drainage condition. Boundaries at both vertical sides were ‘‘No Flux’’ condition. The moistube with a radius of 8 mm was represented as a line source and located on the left vertical boundary of the transport domain. The moistube bottom was assigned a ‘‘Constant flow’’ condition, which corresponds with the calculated moistube specific discharge shown in Equation (5).

2.4. Statistical Analysis

The HYDRUS-2D simulations performance was assessed by using the mean absolute error (MAE), the root mean square error (RMSE), the percent bias (PBIAS), and Nash-Sutcliffe efficiency (NSE) [45]. These parameters are defined by the equations below.
M A E = i = 1 n | Y i o b s Y i s i m | n
R M S E = 1 n i = 1 n ( Y i o b s Y i s i m ) 2
P B I A S = i = 1 n ( Y i o b s Y i s i m ) 100 i = 1 n Y i o b s
N S E = 1 i = 1 n ( Y i o b s Y i s i m ) 2 i = 1 n ( Y i o b s Y m e a n ) 2
where Y i o b s is the ith observed data, Y i s i m is the ith simulated data, Y m e a n is the mean of the observed data for the constituent being evaluated, and n is the total number of observations. The MAE can potentially identify the presence of bias. The RMSE provides an overall measure of the degree to which the data differ from the model predictions. MAE and RMSE values of 0 indicate a perfect fit. However, the PBIAS is the deviation of data being evaluated and expressed as a percentage. If PBIAS is within ± 10, the PBIAS values are considered to be within a very accurate range. NSE ranges between −∞ and 1.0. If NSE = 1, it will be the optimal value.

3. Results and Discussion

3.1. Comprehensive Permeability Coefficient

When the moistube was placed vertically in the air, the moistube pressure gradually increases from the top (point A) to the bottom (point B) and its center (point C) is the median point, which represents the average pressure head. Therefore, it is advisable to calculate the pressure head at the C point. According to the experimental data, the moistube flow characteristic curve under a different pressure head was obtained, as shown in Figure 3.
As expected, the cumulative seepage of the moistube is in a good linear relationship with the time, and increases with the pressure head. Based on the linear regression calculation of cumulative seepage and time, the influence of the average pressure head on specific discharge was given in Figure 4. Using Equation (4) to fit, we obtained K = 0.00015 mL/(cm2·min). The coefficient of determination R2 = 0.966 indicates that the center position of moistube can be used as the calculation point of the average specific discharge.

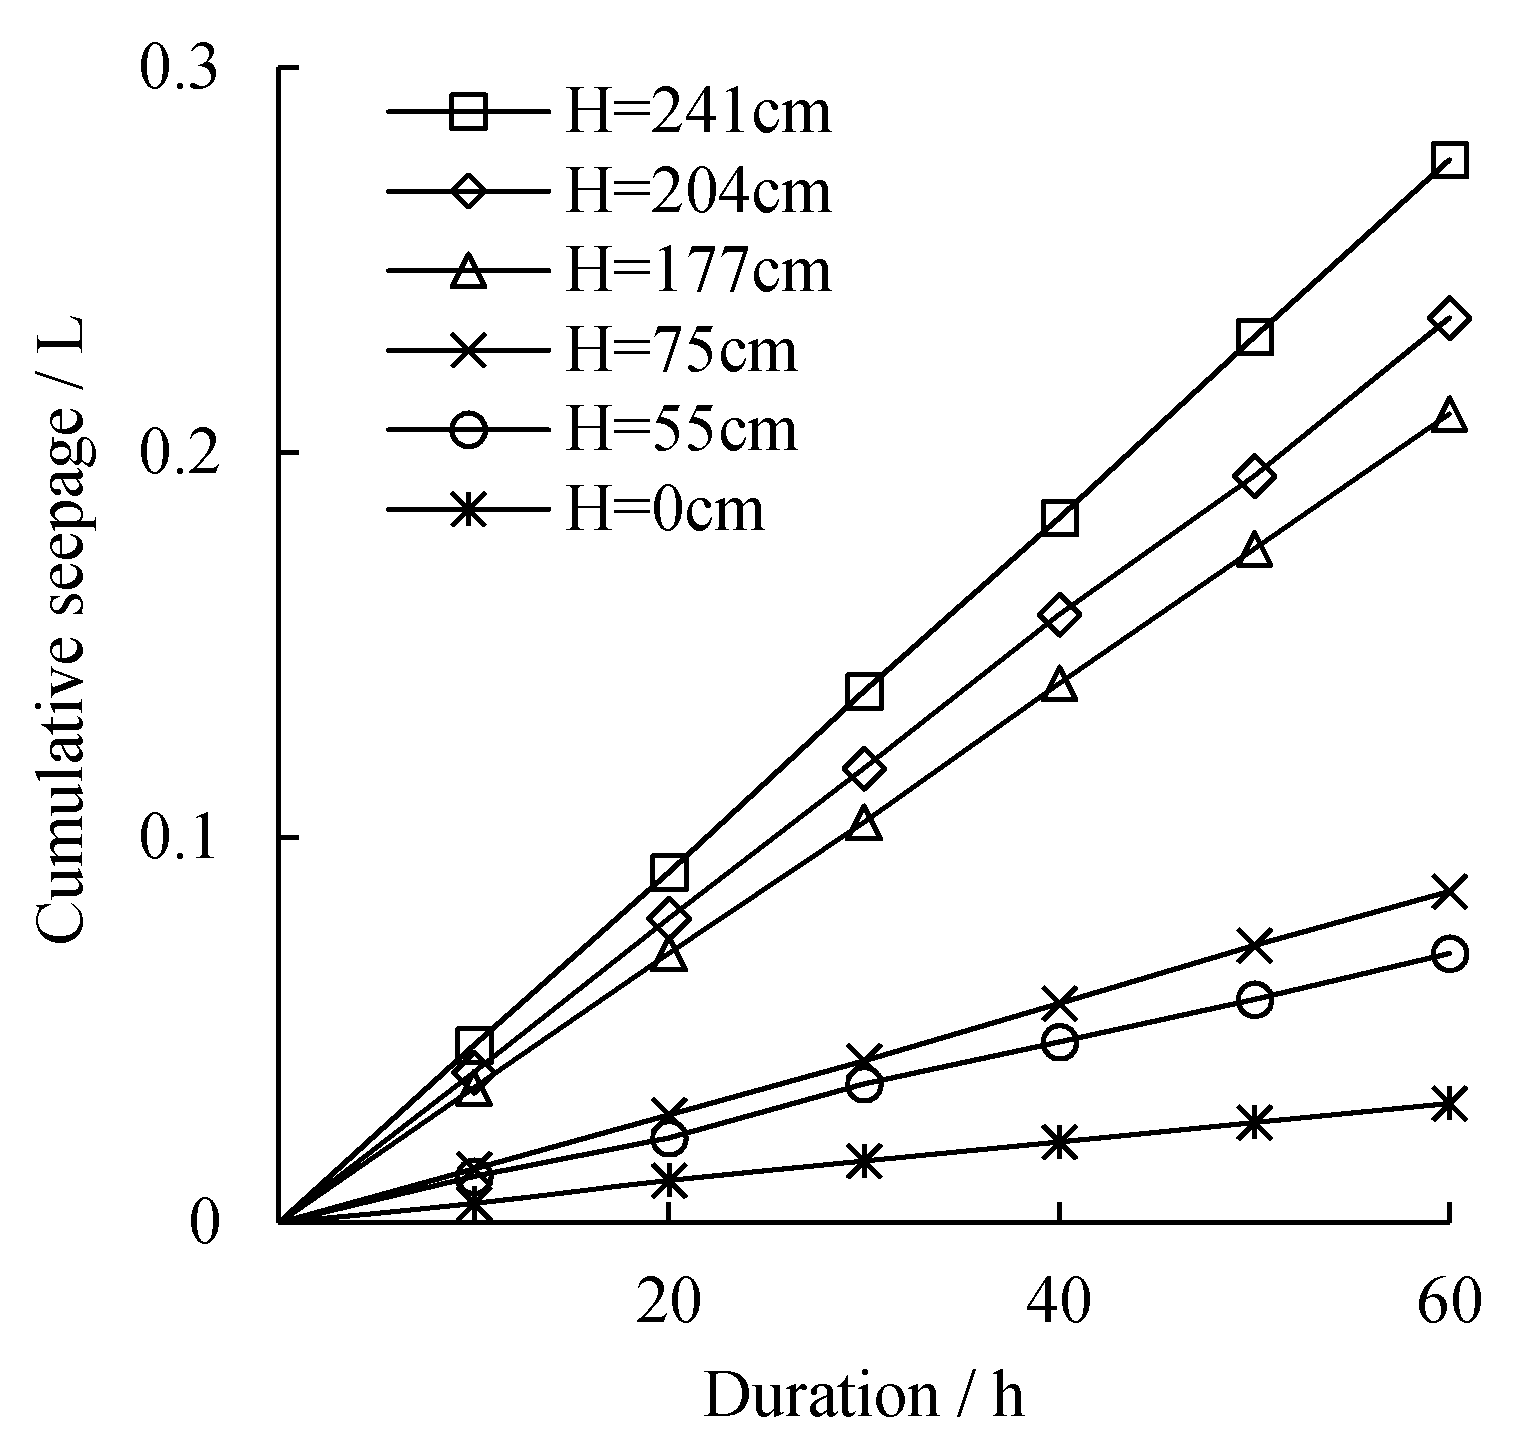
3.2. Specific Discharge Determination

Figure 5 shows the seepage characteristics of the moistube in aeolian sand and silt loam. Linear regression analysis was used to determine the average specific discharge ( q s ) with two soils and a pressure head of 1.2 m. The relationship between q s and H , M and γ , from Figure 5 resulted in the following equation.
q s = K ( H + M 1.3 γ N + 58.2 )
The values of fitting parameters a and b were −1.3 and 58.2, respectively.

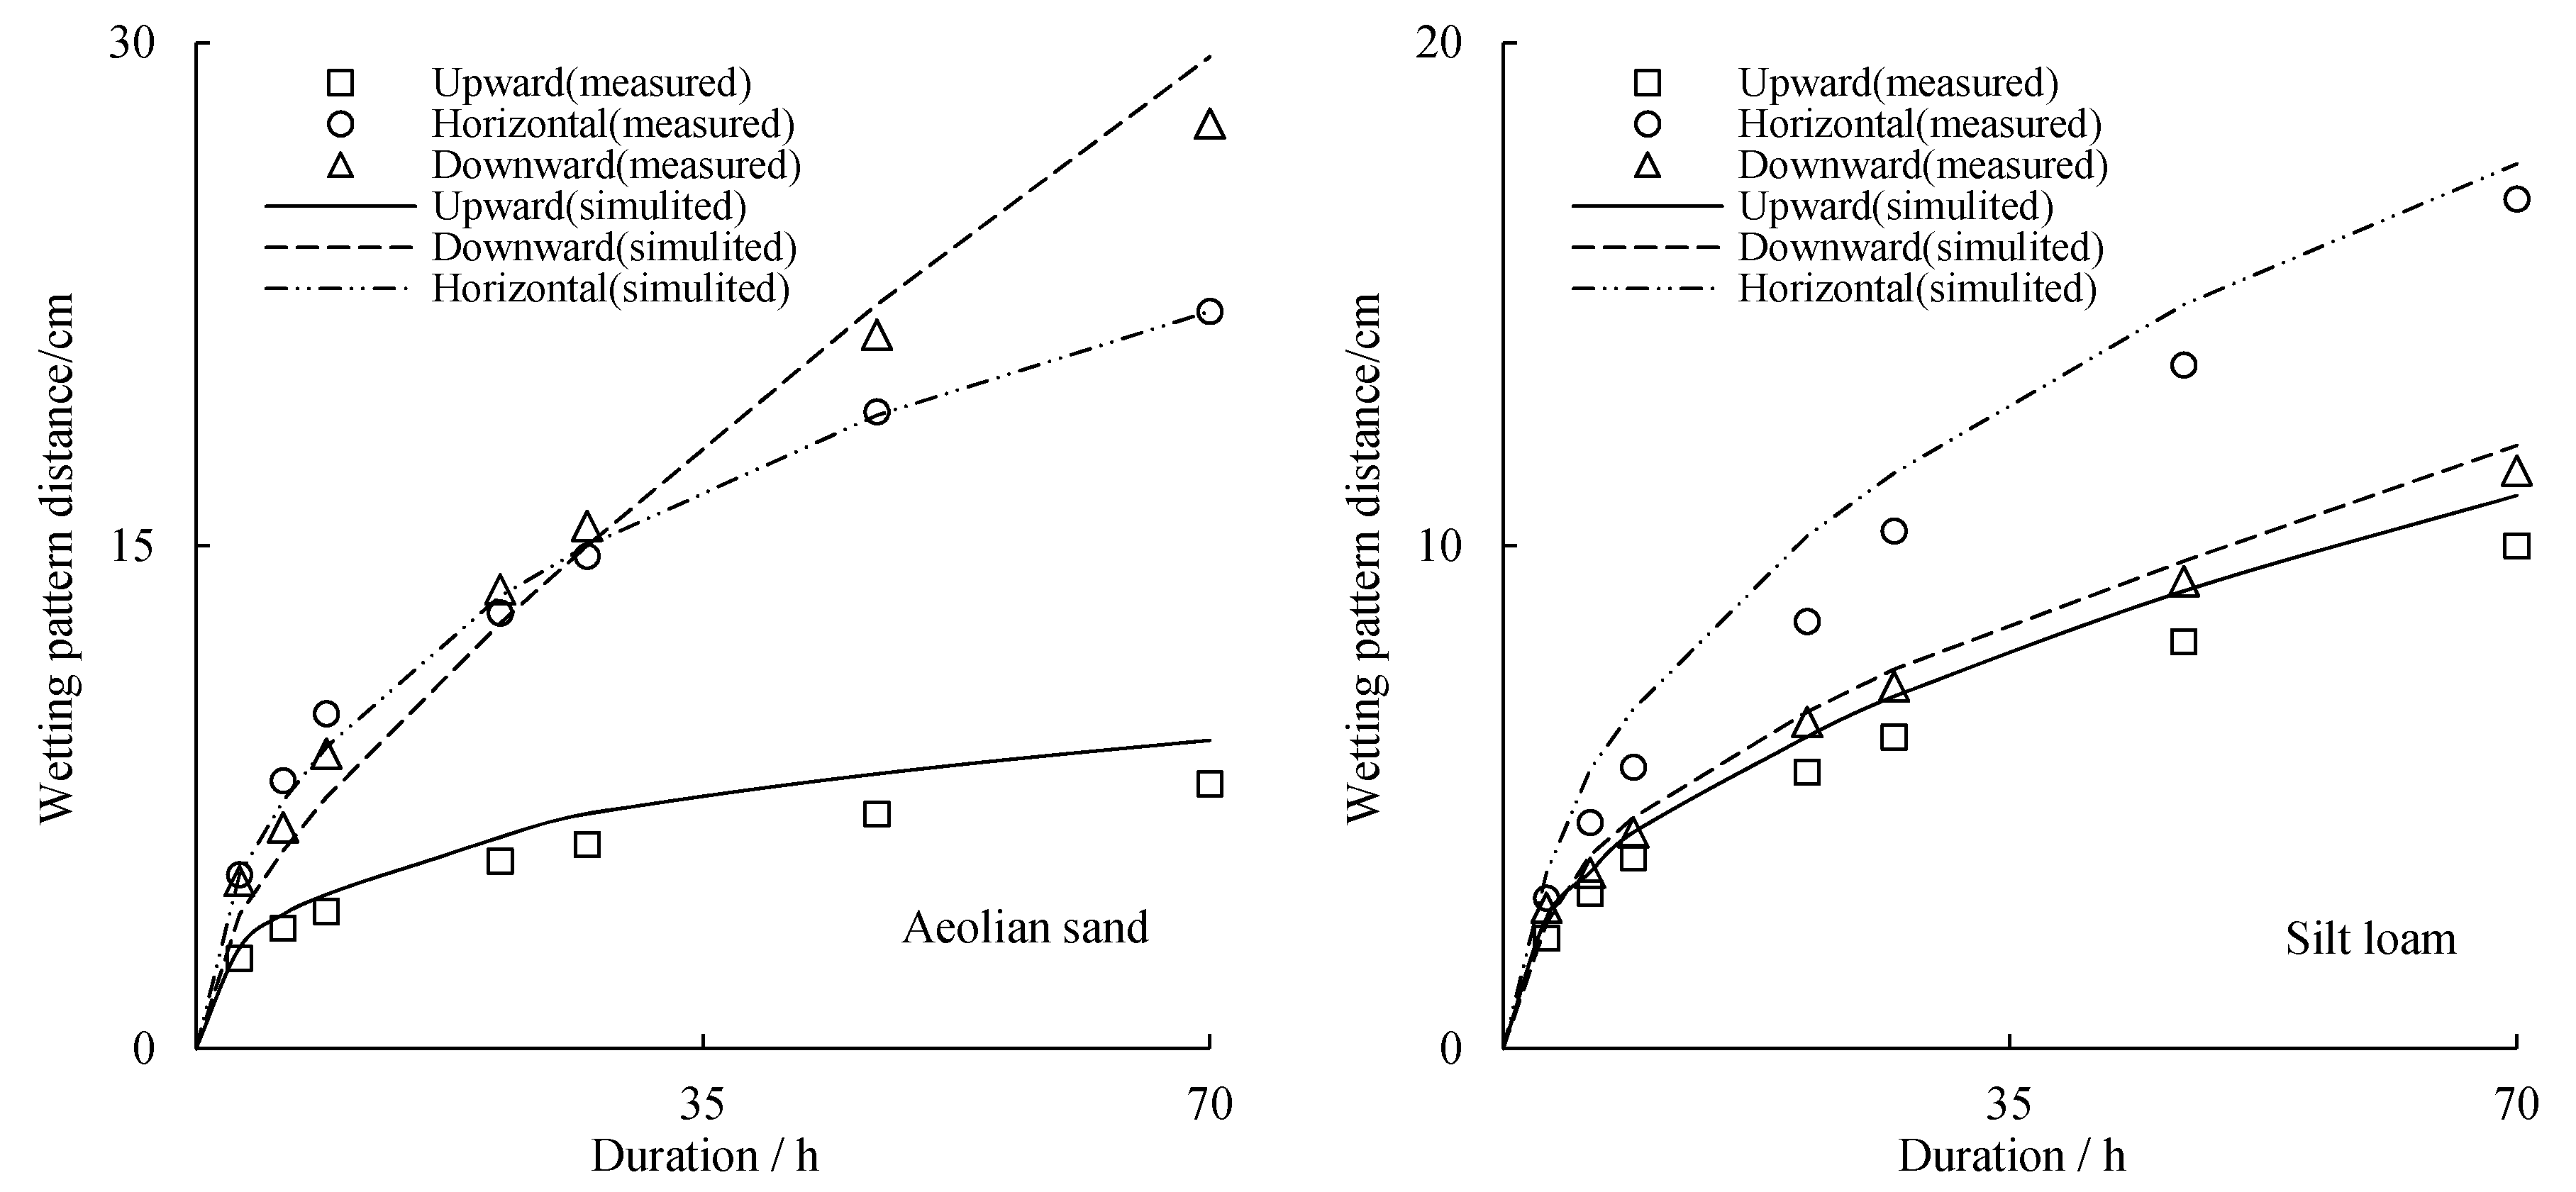
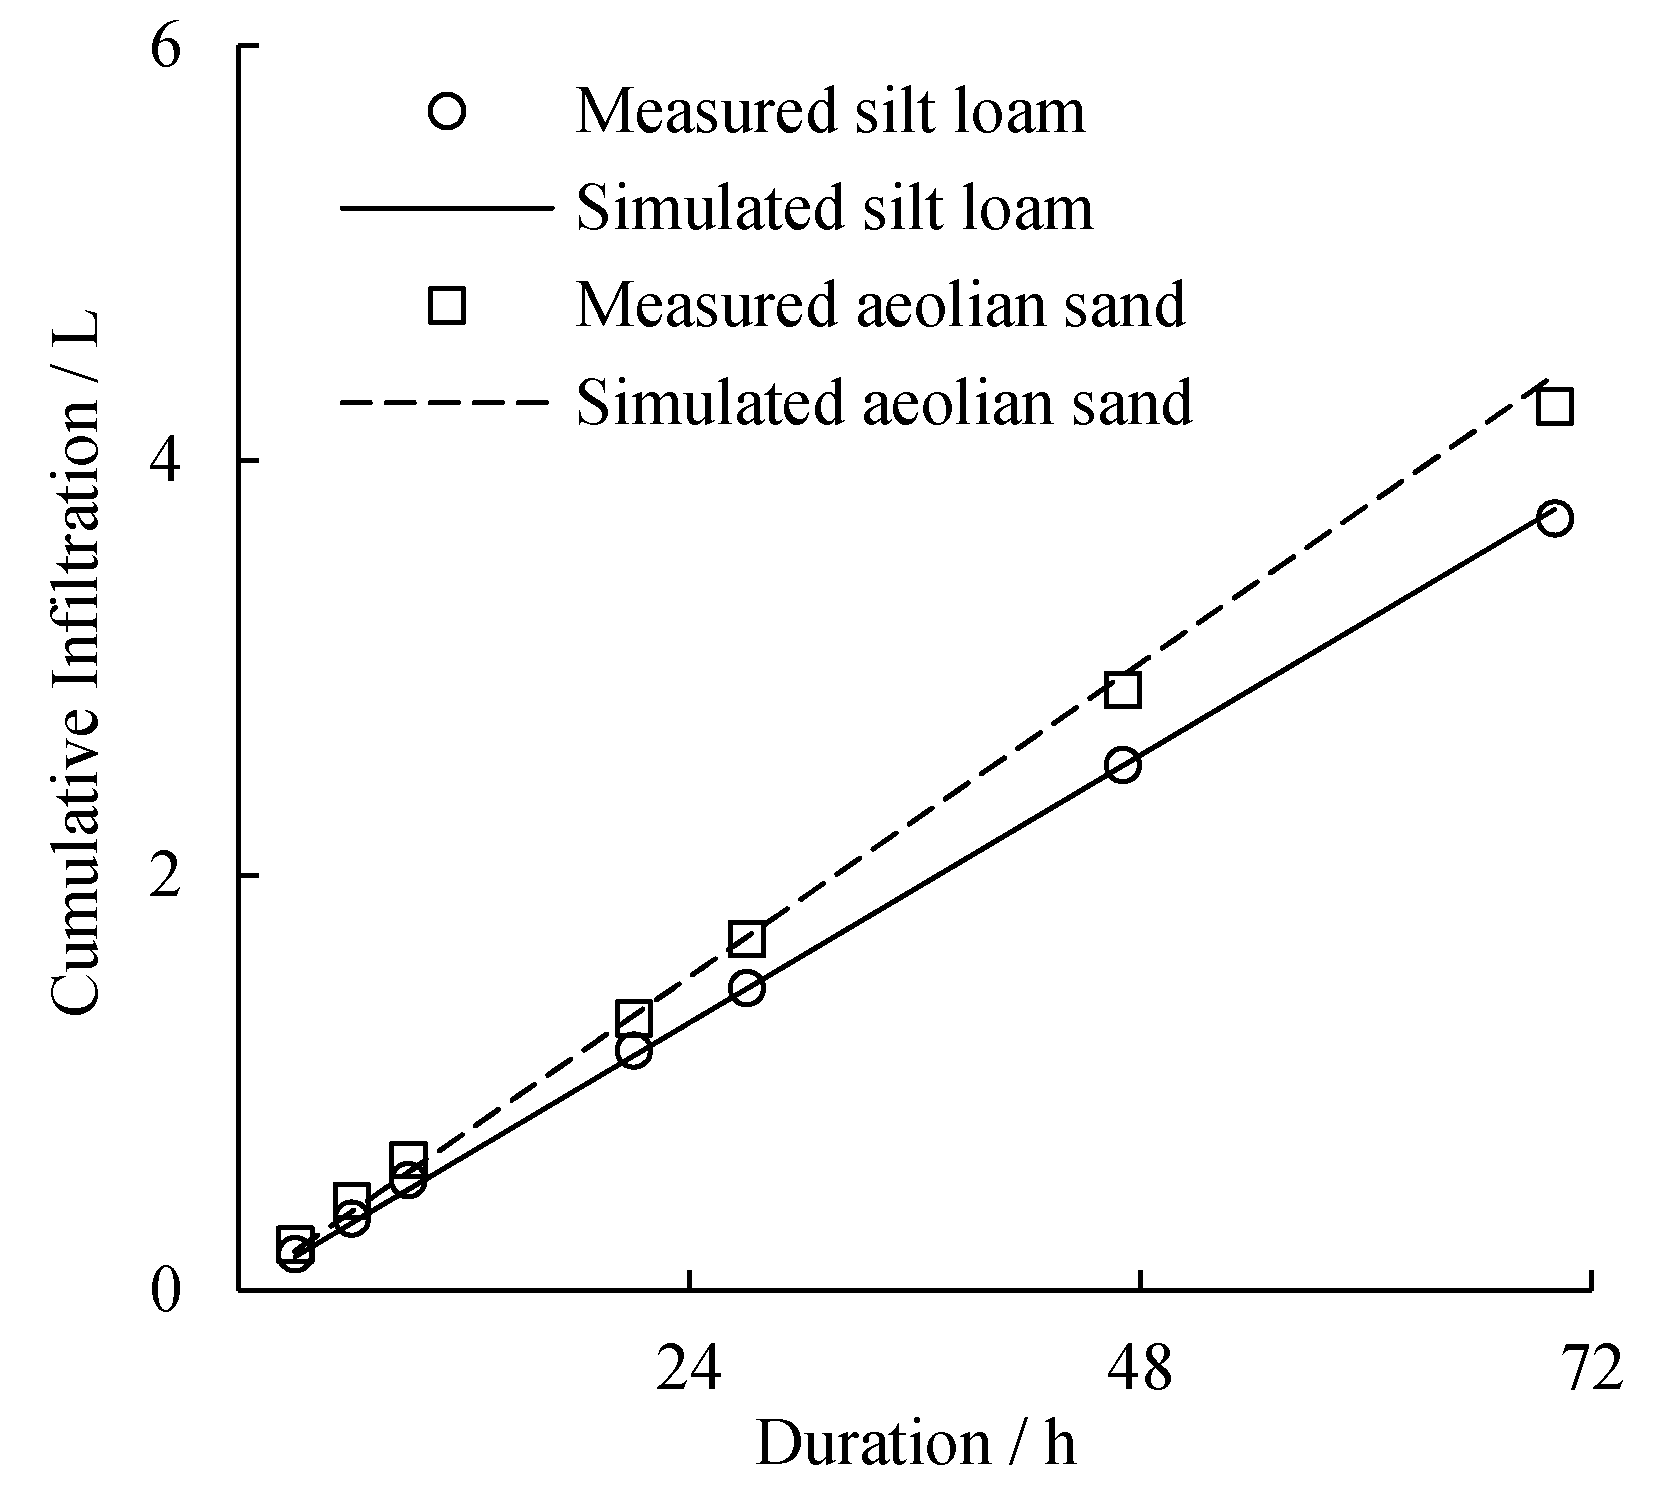
3.3. Simulation Verification

Figure 6 shows the measured and simulated cumulative infiltration for two soils with a 1.8 m pressure head. The specific discharge at different nodes is calculated by using Equation (14). The measured cumulative infiltration is represented by dots while simulation results obtained through HYDRUS-2D are shown as lines. Value of MAE, RMSE, PBIAS, and NSE are 0.04 L, 0.03 L, 0.05, and 0.998, respectively. It indicates that the prediction model (see Equation (14)) is suitable for describing cumulative infiltrations of vertical moistube-irrigation.
Three eigenvalues of wetting front distance, i.e., vertical upward at point A, vertical downward at point B, and horizontal direction at point C, were respectively selected. The wetting front distance is quantitatively analyzed and compared with the measured value, which is shown in Figure 7. MAE, RMSE, PBIAS, and NSE reach 0.79 cm, 1.11 cm, −4.79, and 0.972, respectively. Therefore, HYDRUS-2D can accurately simulate the dynamic changes of the wetting pattern during vertical moistube-irrigation.
Figure 8 shows the measured and simulated water content distributions after irrigation (70 h). It is clear from the contour plots in Figure 8 that the predicted water content distribution is in excellent agreement with experimental data. MAE, RMSE, PBIAS, and NSE values are 0.01 cm3/cm3, 0.03 cm3/cm3, −4.75, and 0.955, respectively. Therefore, HYDRUS-2D can be used to simulate water content distribution of soil under vertical moistube-irrigation.
Overall, we judge the accuracy of the HYDRUS-2D simulations to be very satisfactory and clearly accurate enough to justify using HYDRUS-2D as a tool for investigating the influence of soil texture, initial water content, pressure head, line source length, and buried depth on the wetting pattern.

3.4. Different Factors Affecting Wetting Patterns of Moistube-Irrigation

To investigate the influence of soil texture, initial water content, pressure head, moistube length, and buried depth on wetting pattern characteristics, we have chosen eleven scenarios for simulation, which are listed in Table 3.
Simulations were carried out for soils representing three textural classes: silt loam, loam, and sandy loam. Soil hydraulic parameters for the three textural classes were taken from the soil catalog provided by the HYDRUS software [46] and are given in Table 4. The field capacity of three soils (silt loam, loam, and sandy loam) are 0.238 cm3/cm3, 0.290 cm3/cm3, and 0.321 cm3/cm3, respectively. [47].

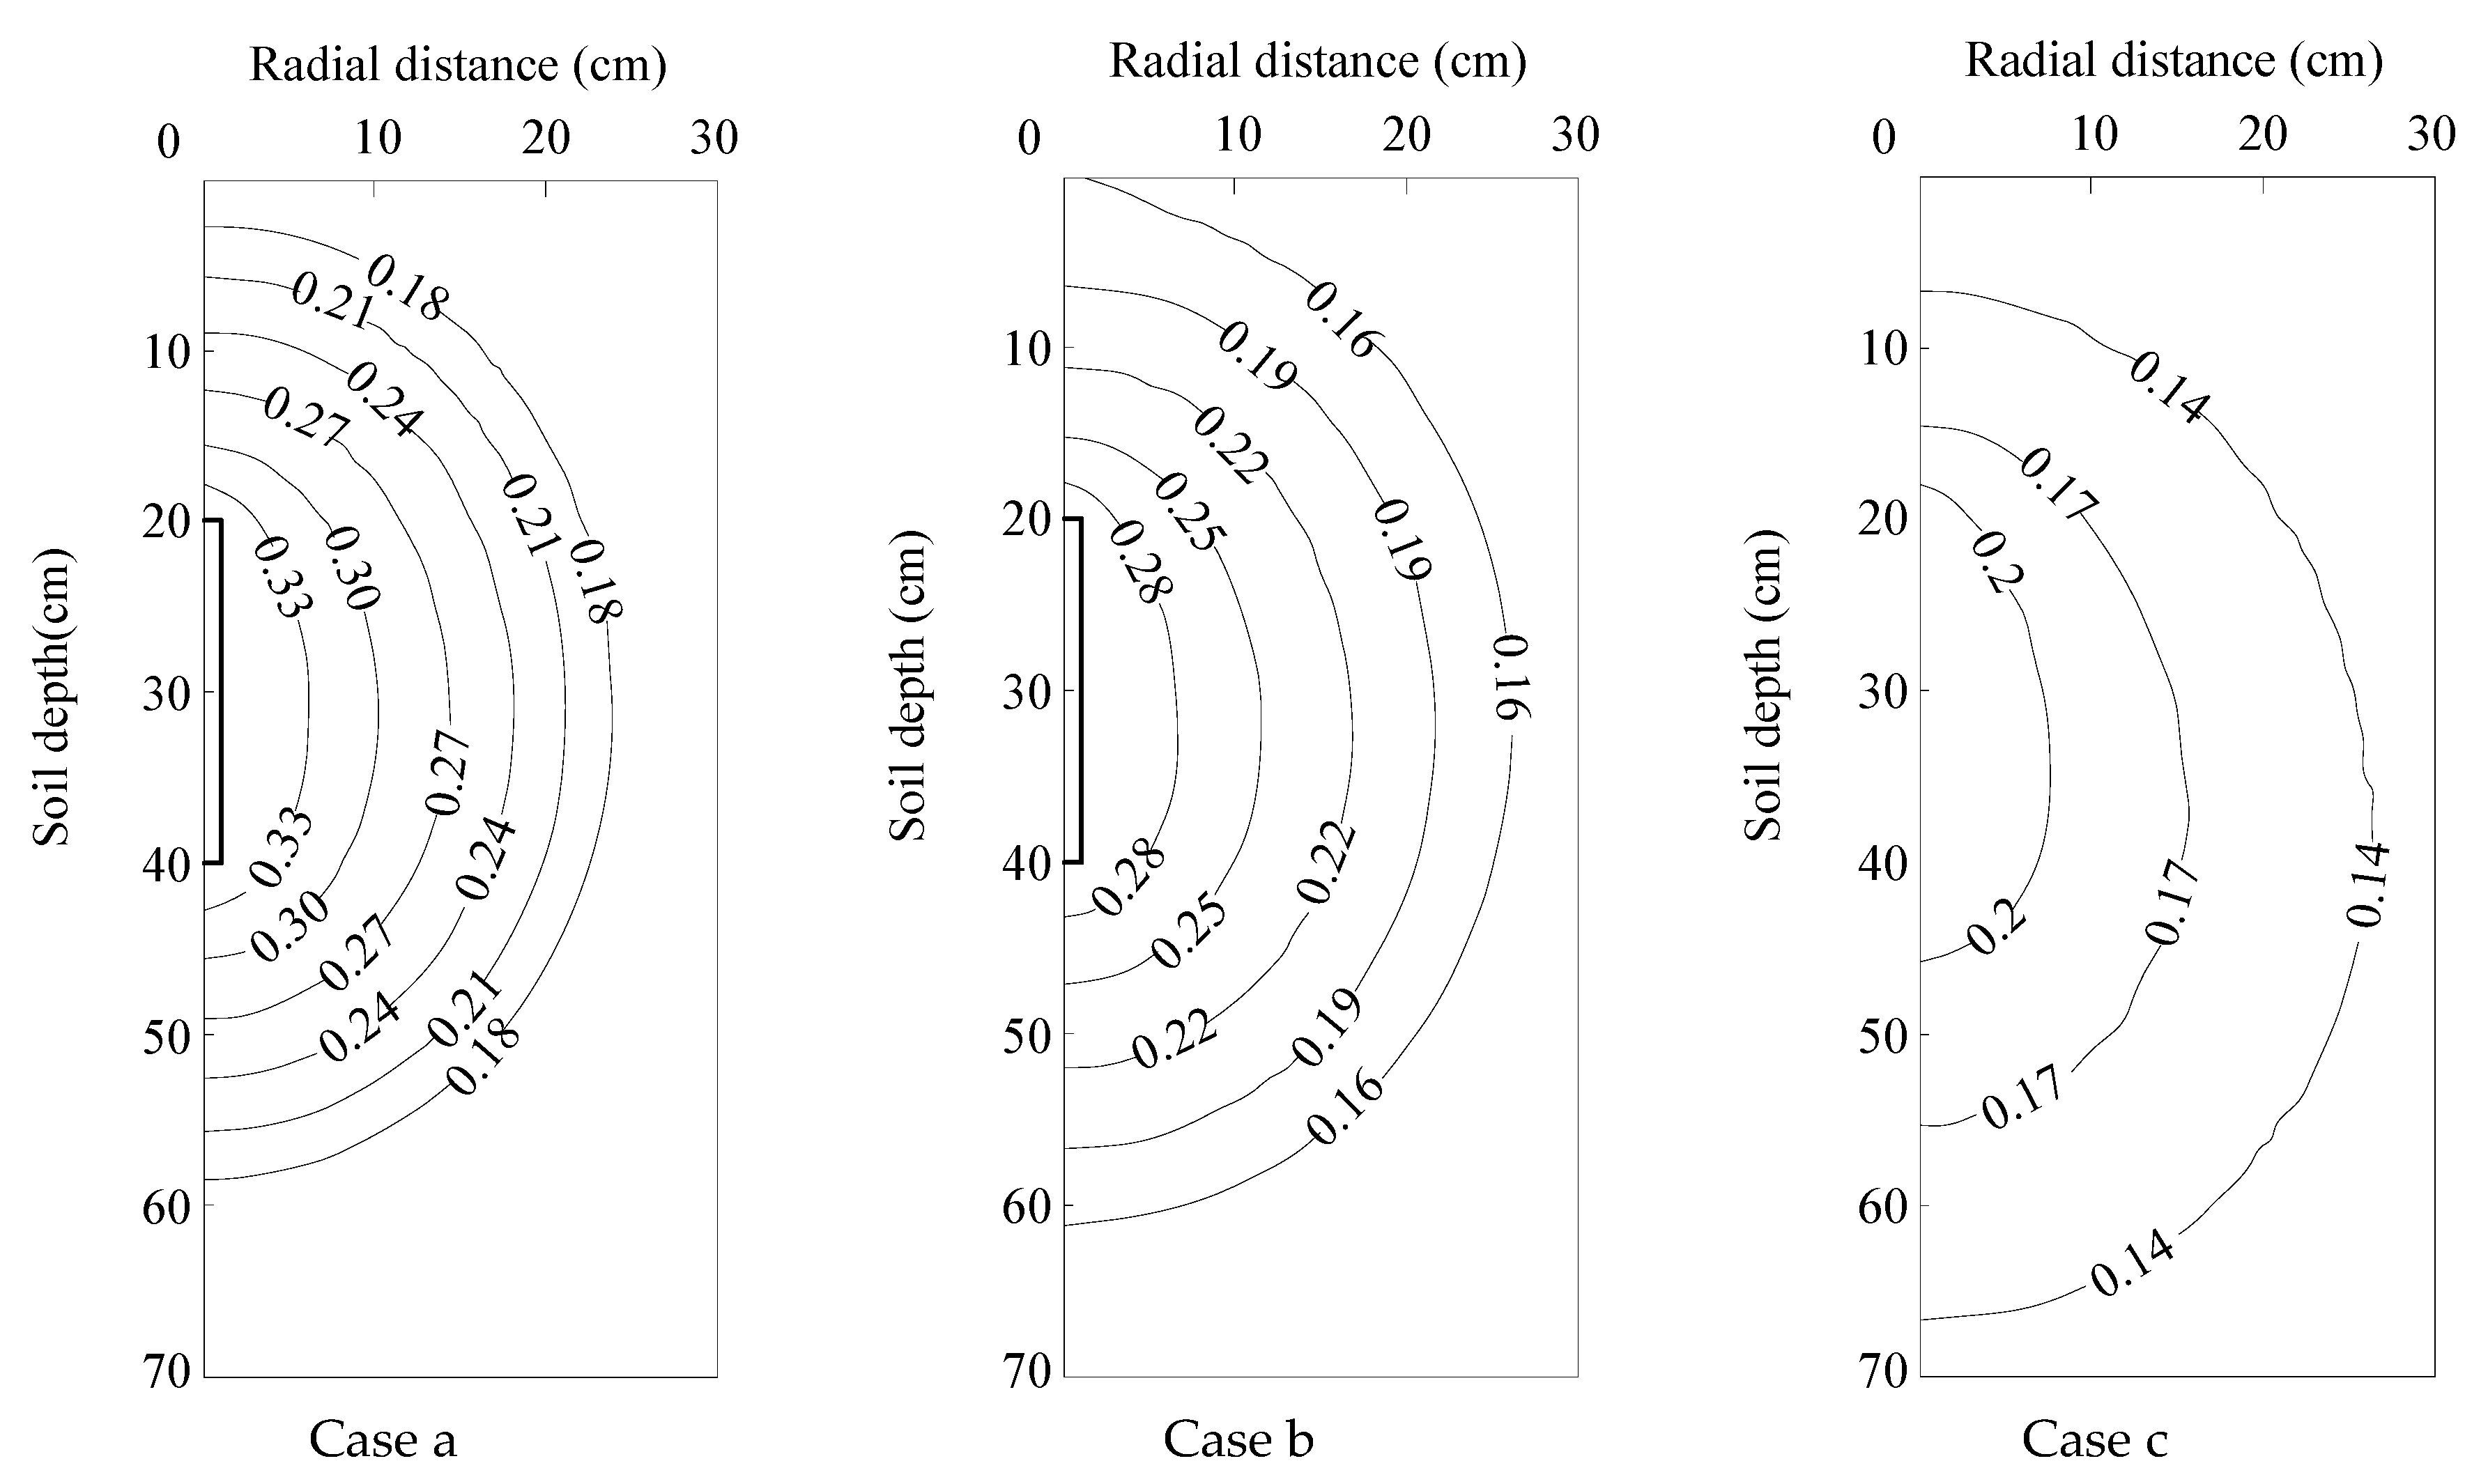
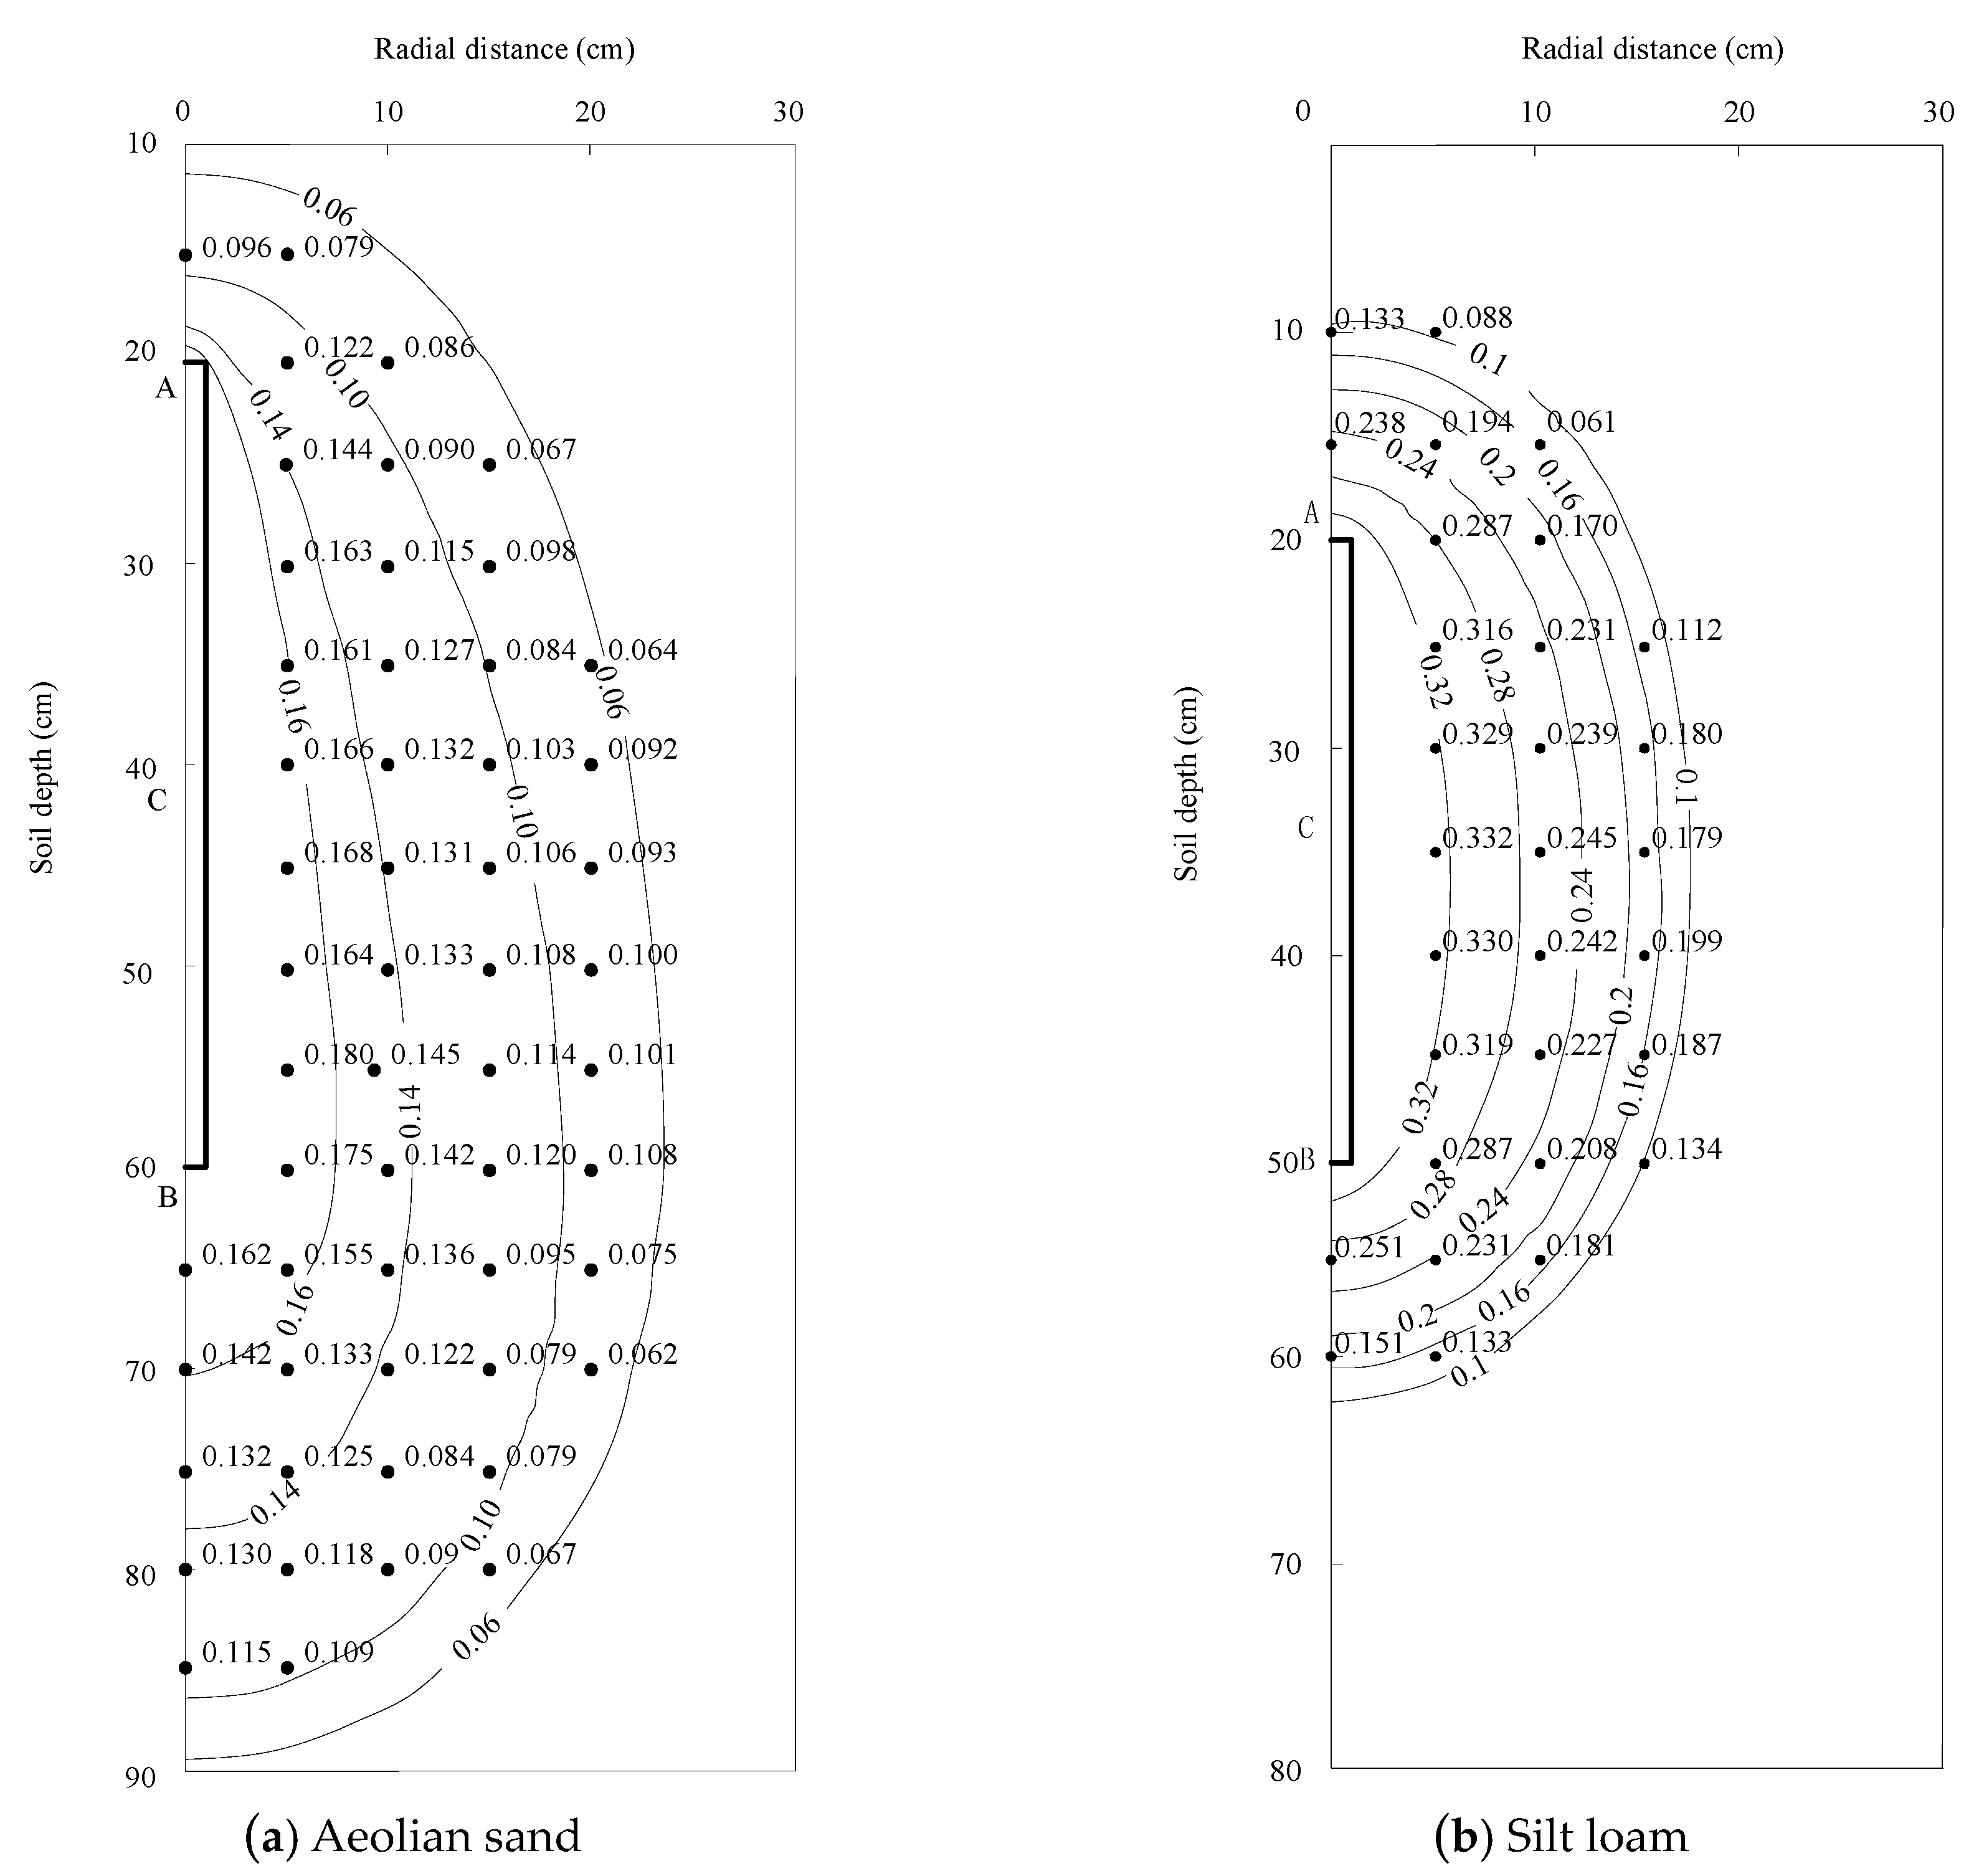
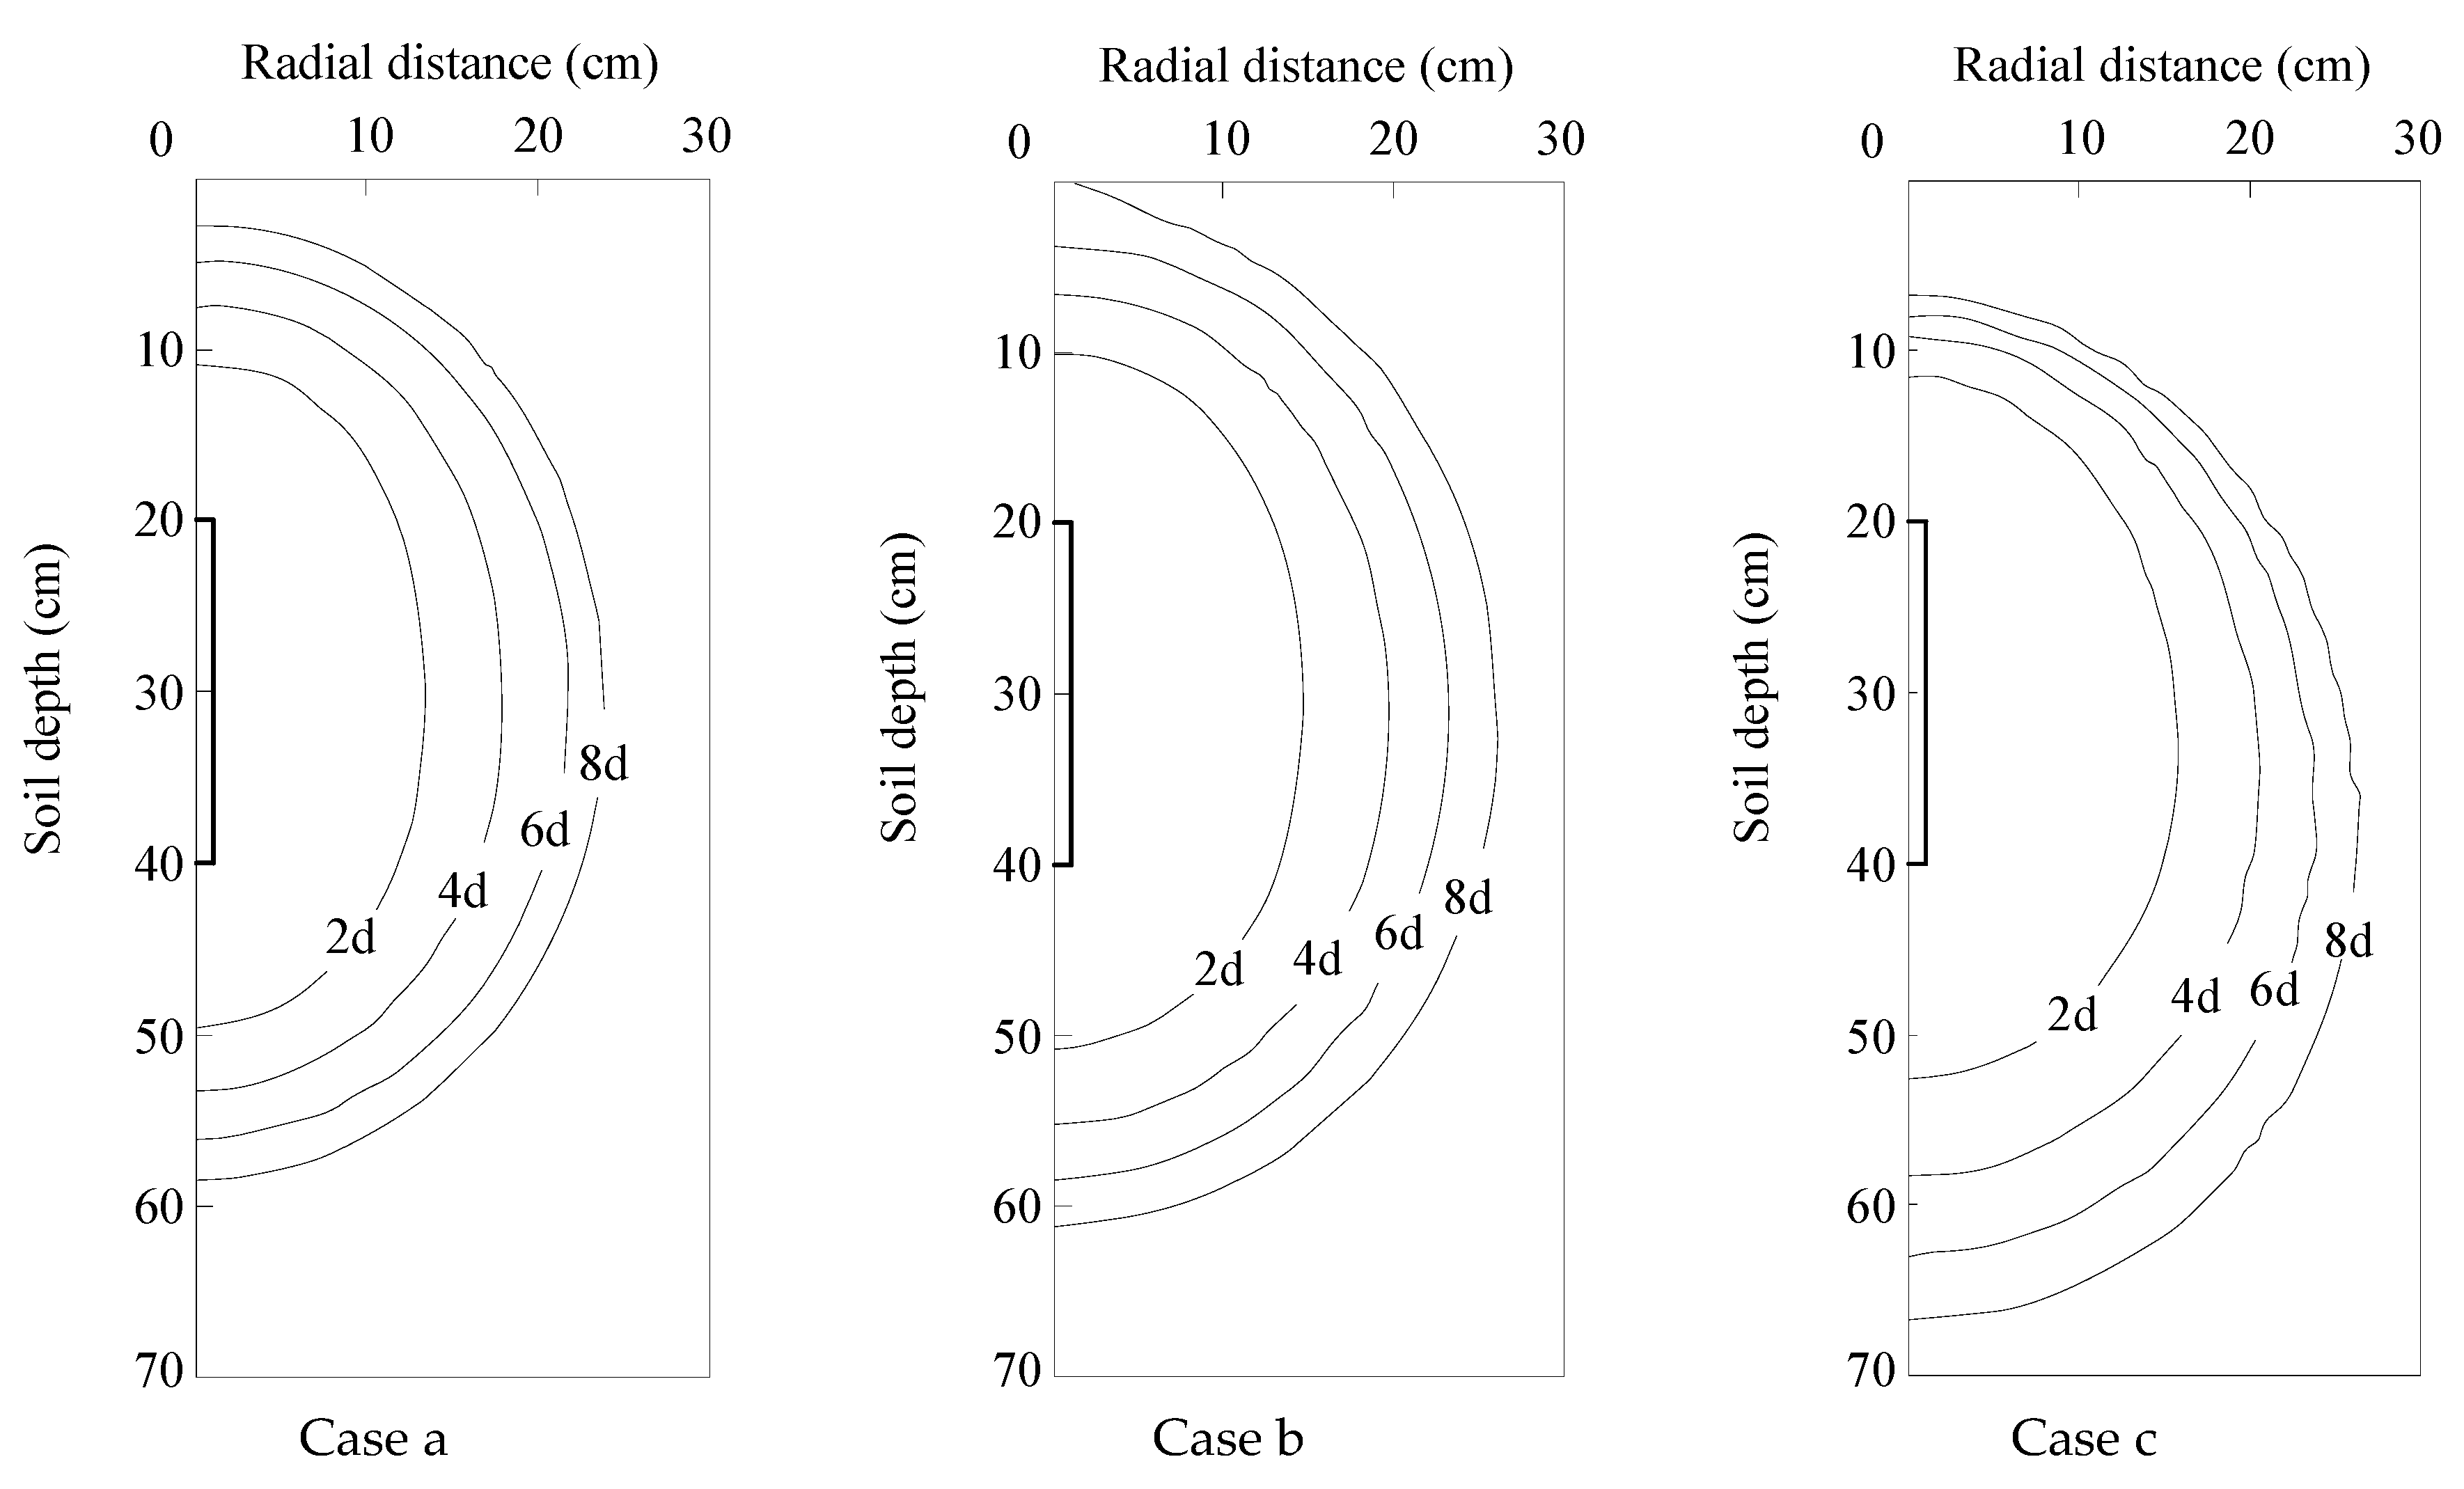
3.4.1. Influence of Soil Texture

Figure 9 shows the dynamic changes of the wetting pattern in different soil textures. Before the wetting front reaches the surface, the shape of the wetting pattern with different observation times is approximately “ellipsoidal” around the moistube. The size of the wetting pattern in each direction increases with the irrigation time. In the initial period of irrigation, the wetting front moves faster in all directions with the horizontal moving fastest. As time goes on, the wetting front migration rate is slowed down. This is because the gradient of matric potential between the moistube and the wetting front is relatively large at the initial stage of infiltration, while the difference in soil water content (matric potential) at each node of the moistube is small. The horizontal gradient of the matric potential is greater than the gradient of the vertical matric potential.
There are significant differences in the wetting front distance under different soil textures. For a given time, the maximum horizontal and vertical downward wetting distances are small for fine-texture soil, and larger for coarse-texture soil. With the increase of soil clay content, the maximum vertical upward wetting distances tend to increase at first and then decrease, and the difference between the maximum vertical upward and maximum vertical downward wetting distances decreases. The finer the soil texture, the smaller the intergranular pores, the weaker the permeability, and the stronger the capillary action. This results in the slower wetting front migration were more uniform in the vertical direction. On the contrary, the coarser the soil texture, the greater the intergranular pore, the larger the penetration, and the stronger the gravitational force. Therefore, the vertical downward wetted depth is greater than vertical upward wetted height.
The influence of three soil texture classes on water content distribution after irrigation cut-off (8 days) is shown in Figure 10. The contour lines of soil water content are all approximately “ellipsoids” around the moistube and the soil water content gradually decreases from the moistube to the surrounding area. Since the moistube specific discharge is less than the soil infiltration rate, the soil water content near the moistube is not saturated.
The soil texture has a significant effect on the water content distribution. Compared with the coarse-texture soil, the water content near the moistube in the fine-texture soil is slightly higher, the contour line of water content is denser, and the volume of the wetting pattern is smaller. The reason for this is that the wetting front migration rate of heavy clay soil is slow, which leads to small wetted soil volume. In addition, relative to the coarse grained soil, the surface of fine grained soil has strong adsorption and good water retention, which results in a higher soil water content in the same profile.

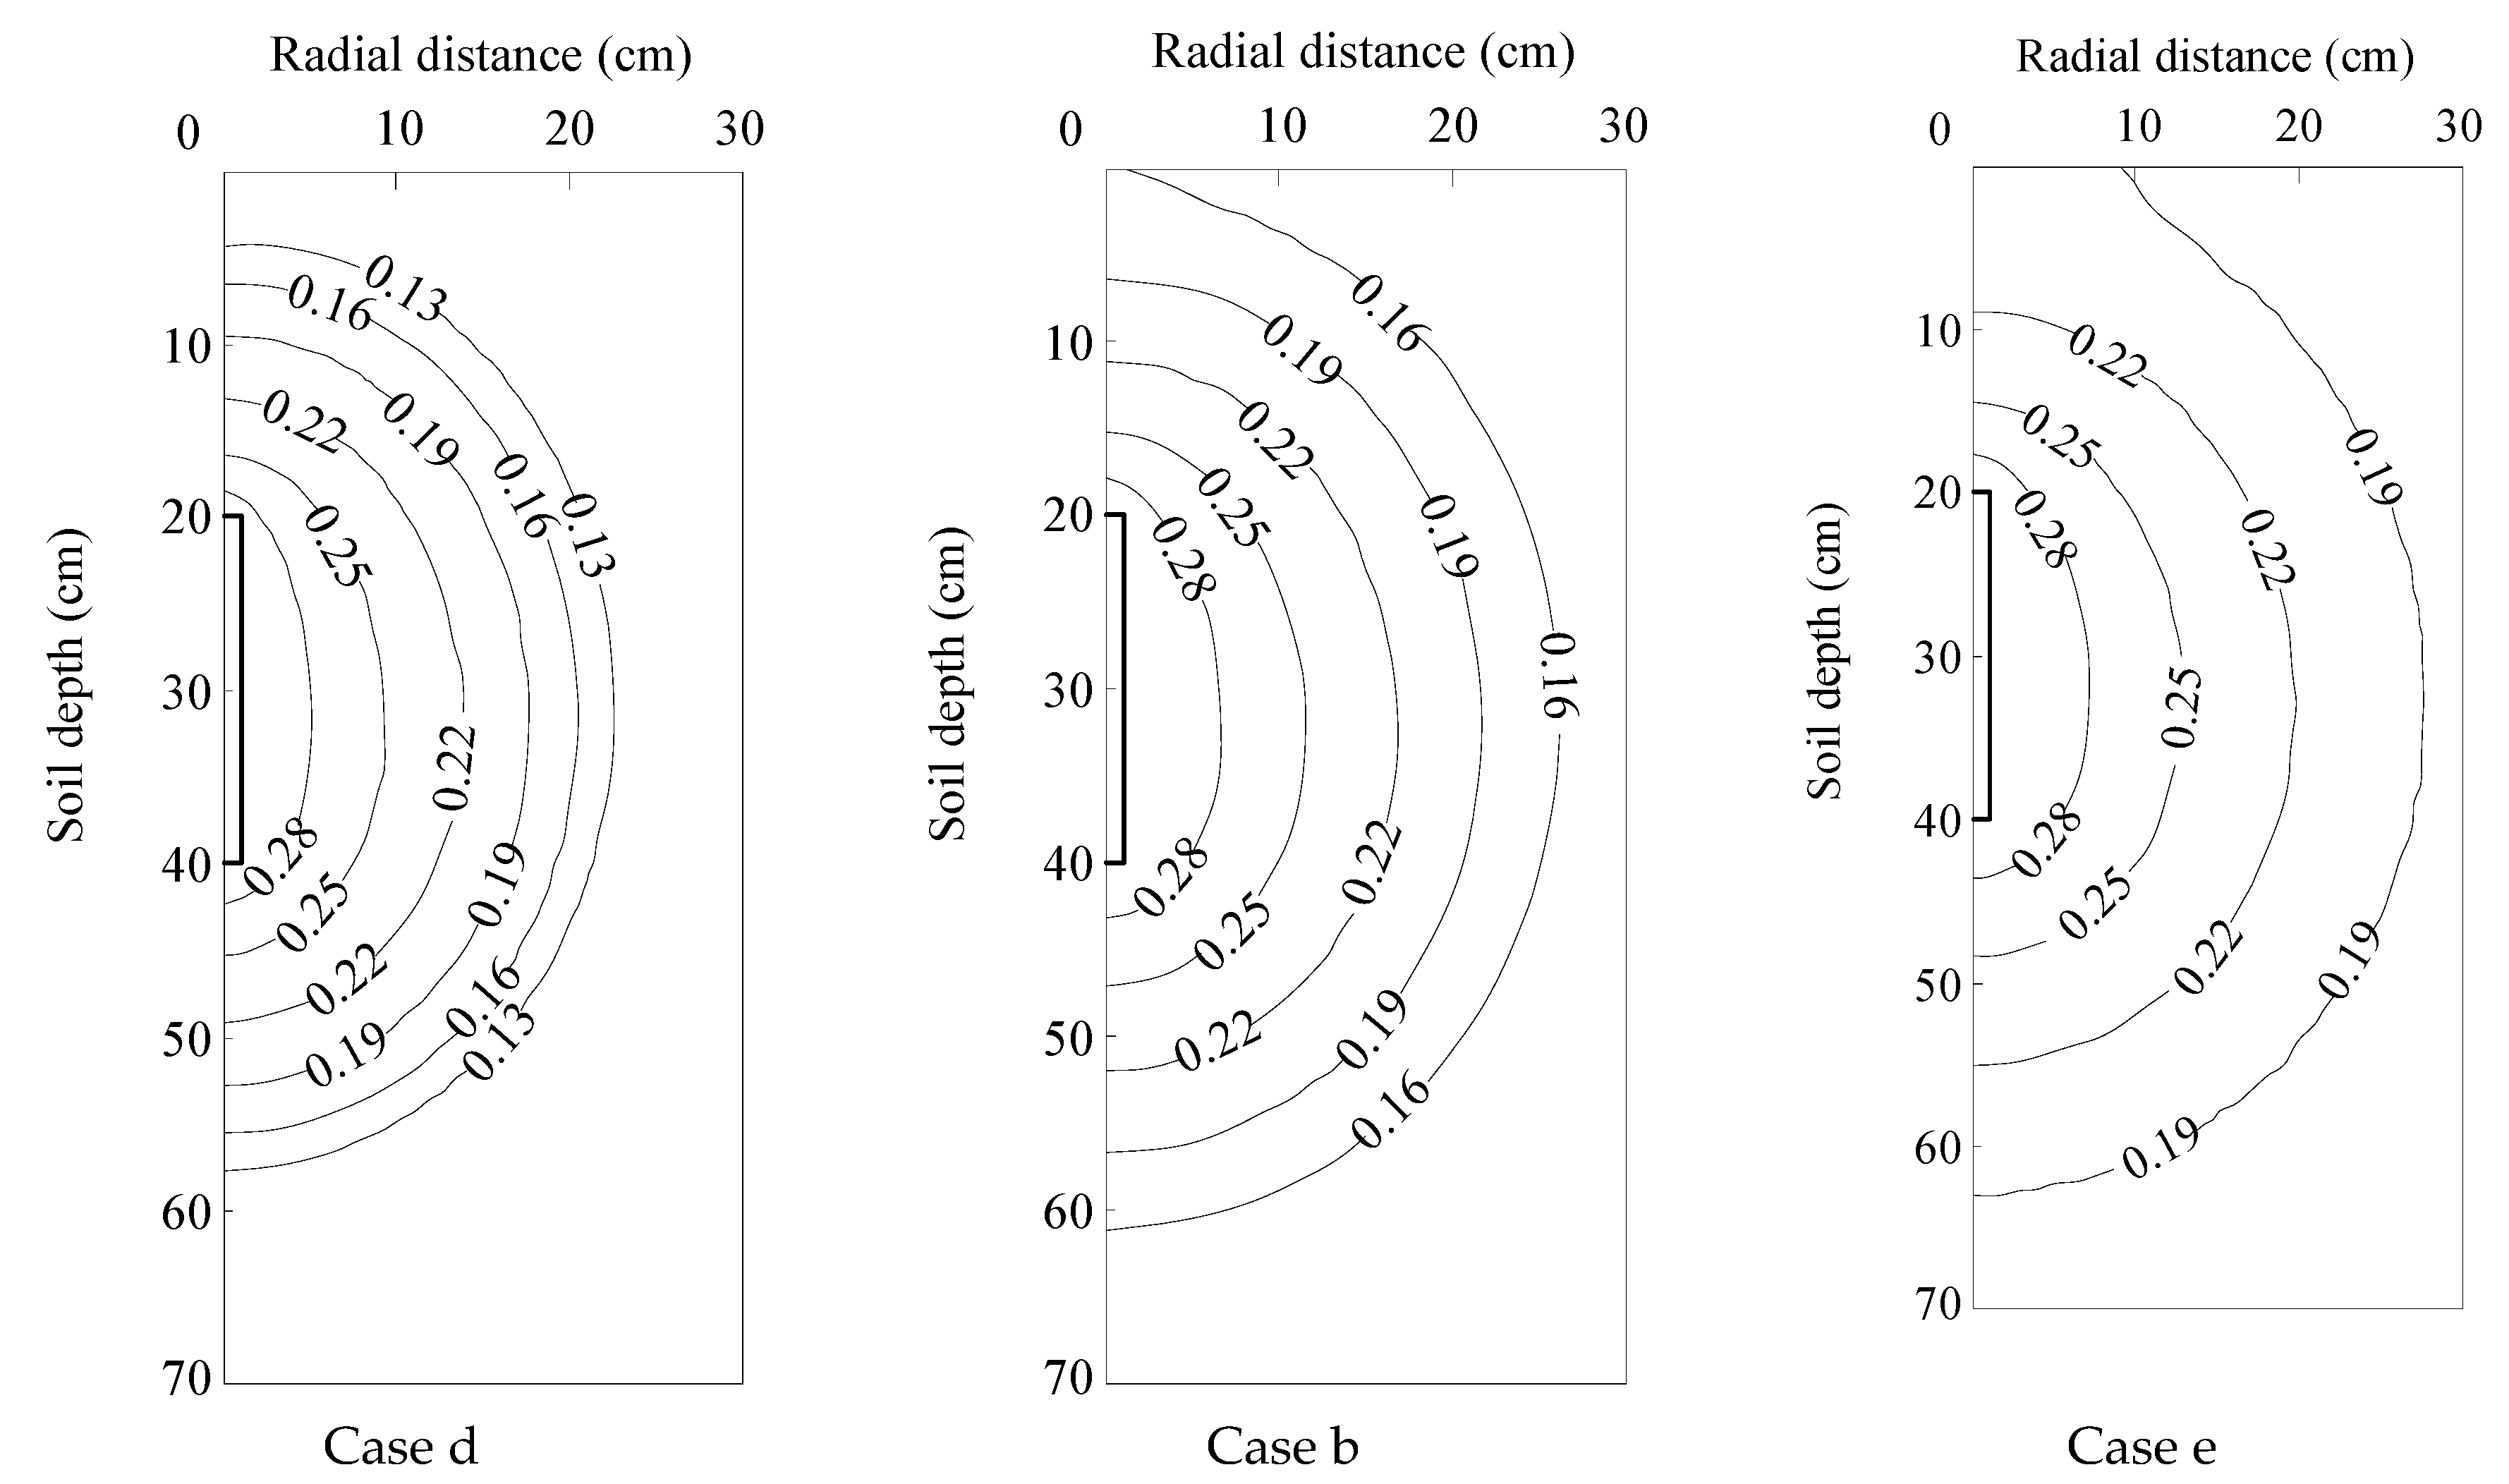
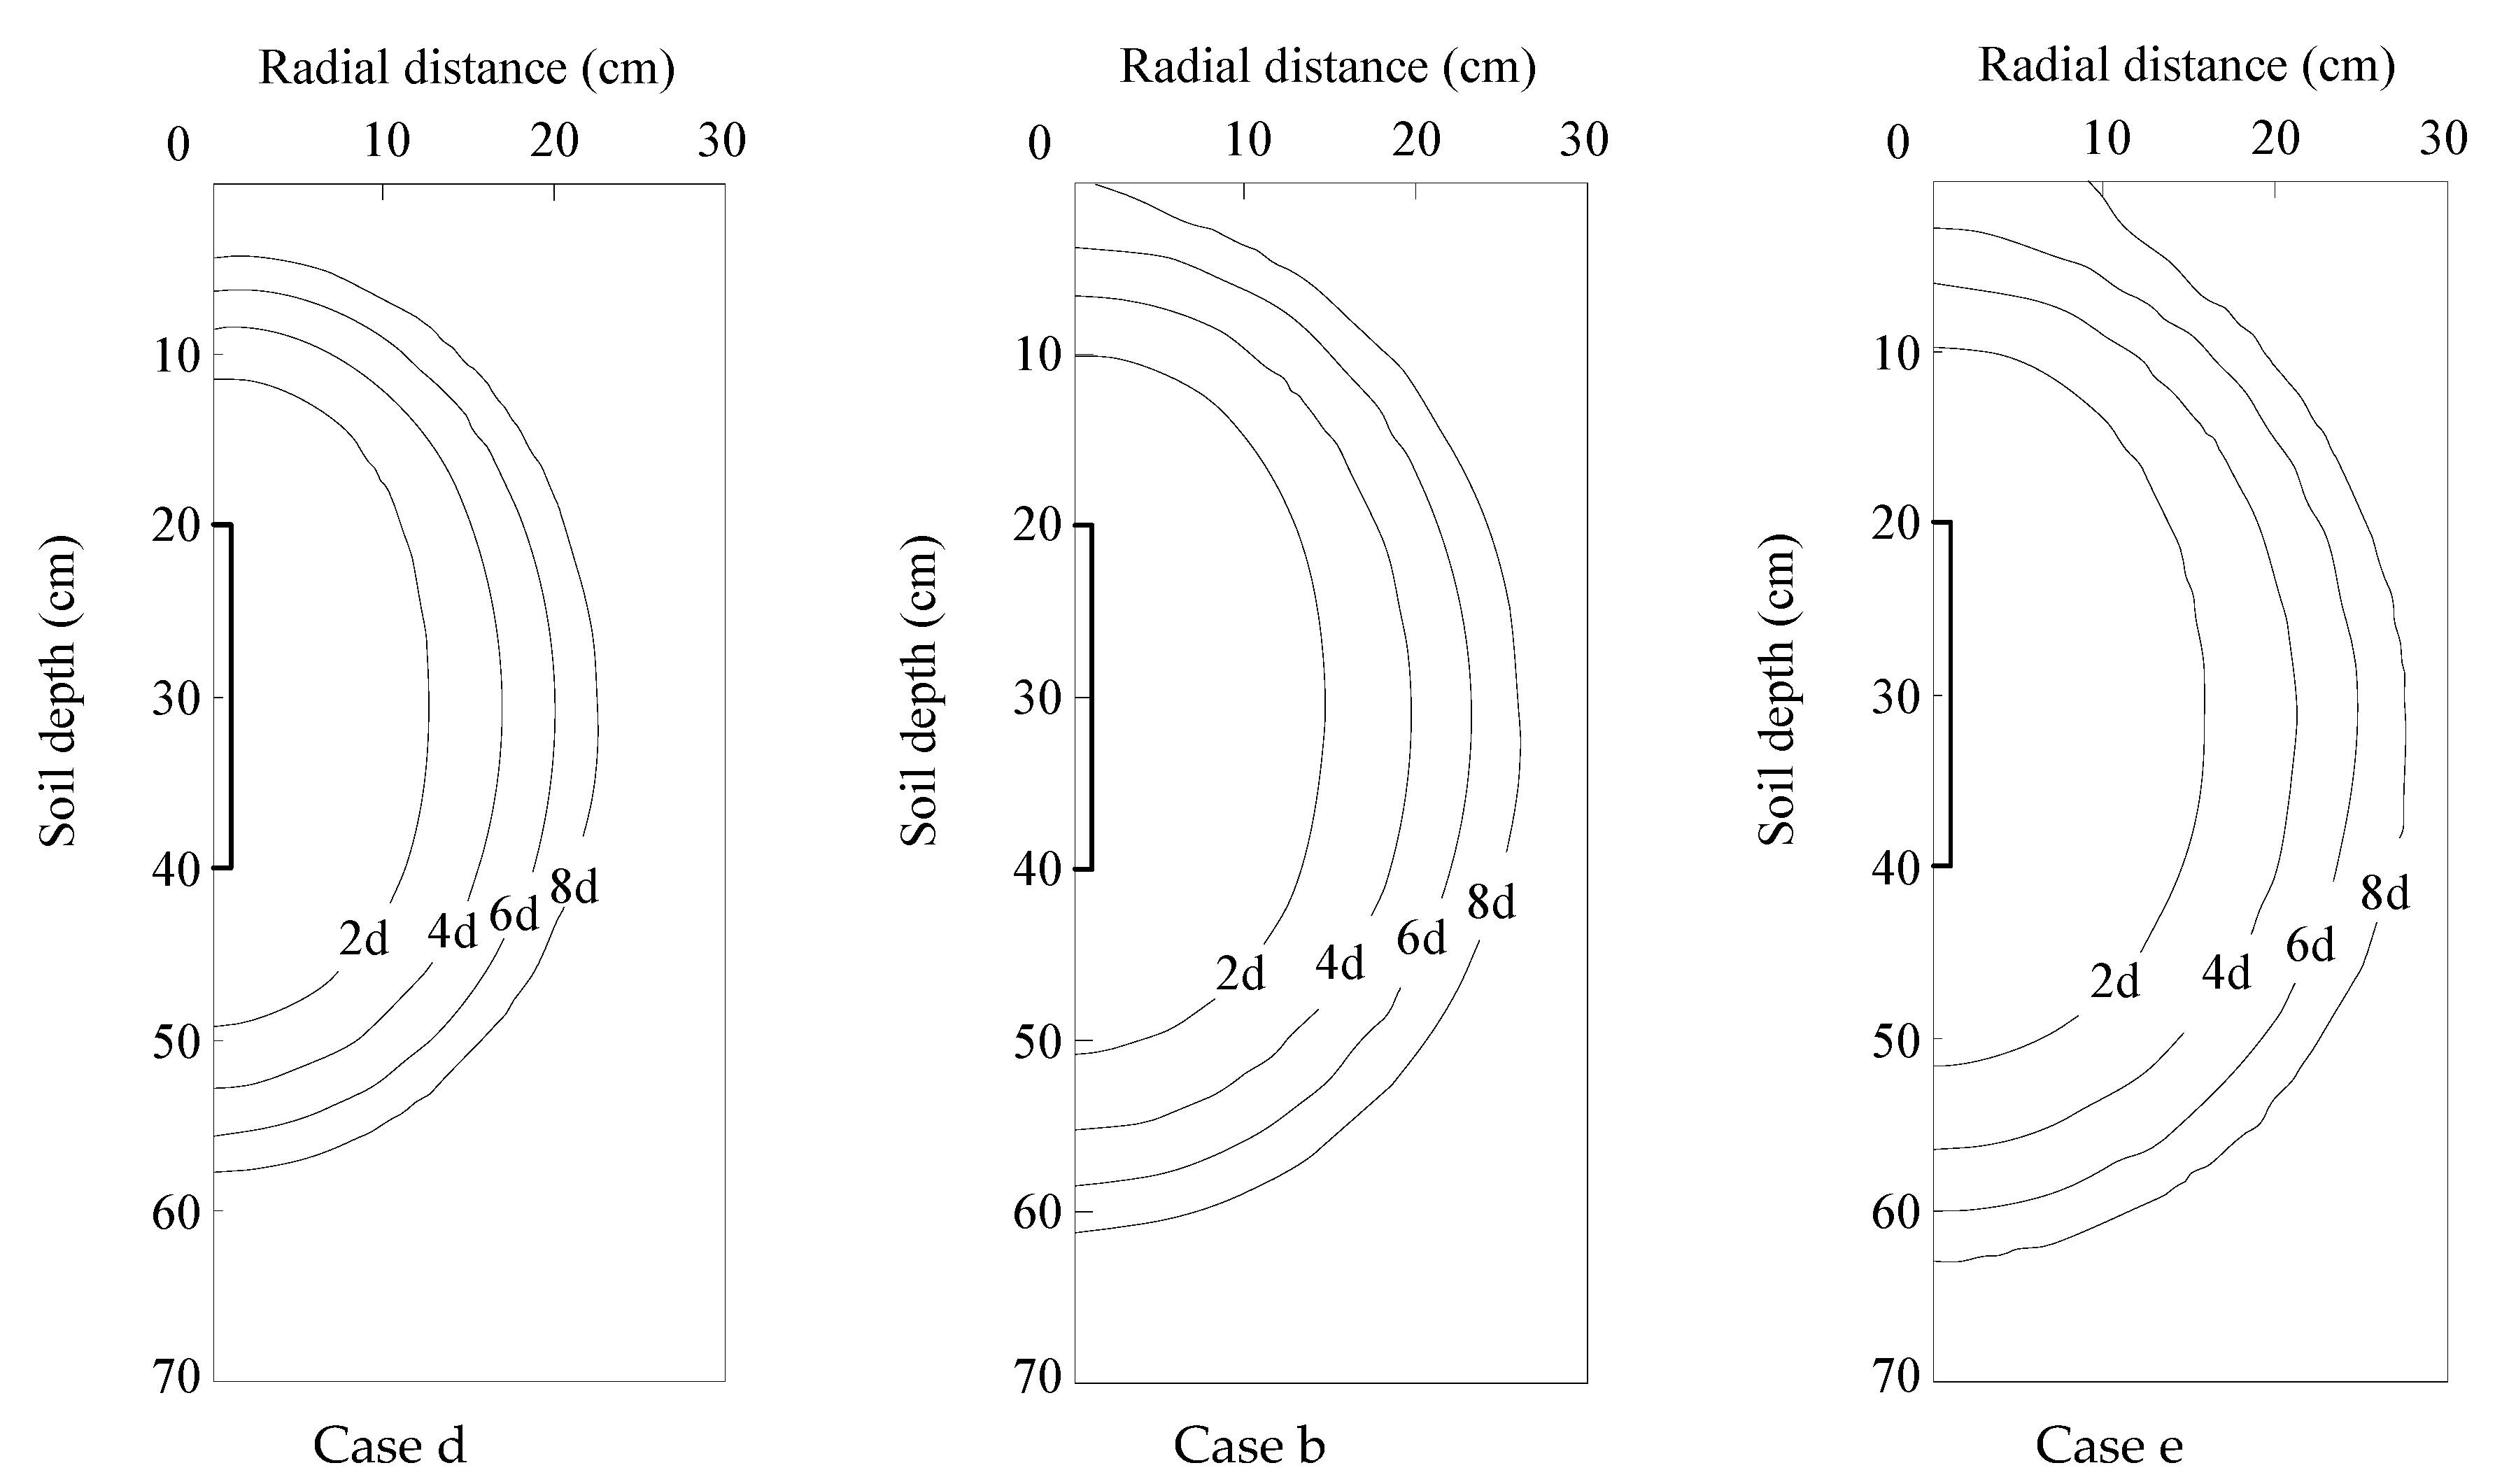
3.4.2. Influence of Soil Initial Water Content

Figure 11 shows the dynamic changes of the wetting pattern in different soil initial water content. As can be seen in Figure 11, the wetting front distance is positively correlated with the initial water content, and increases with the rise in the initial water content. This appears to be in contradiction with the fact that the higher the initial soil water content is, the larger the matric potential, the smaller the soil water suction, and the slower the wetting front migration rate. However, the higher the soil initial water content, the greater the soil water conductivity, which is conducive to the movement of water in the soil. In addition, due to the high initial water content of the soil, the amount of water that needs to be filled in the soil pores is reduced, which accelerates the wetting front migration.
The influence of three soil initial water contents on water content distributions after irrigation cut-off (8 days) is shown in Figure 12.
As the initial water content increases, the volume of the wetting pattern increases and the gradient of water content decreases. The volume of the wetting pattern with 50% and 60% field capacity was 1.6 times and 2.1 times that of 40%, respectively. The reason is that the wetted soil volume is mainly affected by the wetting front migration rate. This means the higher the soil water content, the faster the wetting front migration rate and the greater the wetting range, for the same irrigation time.

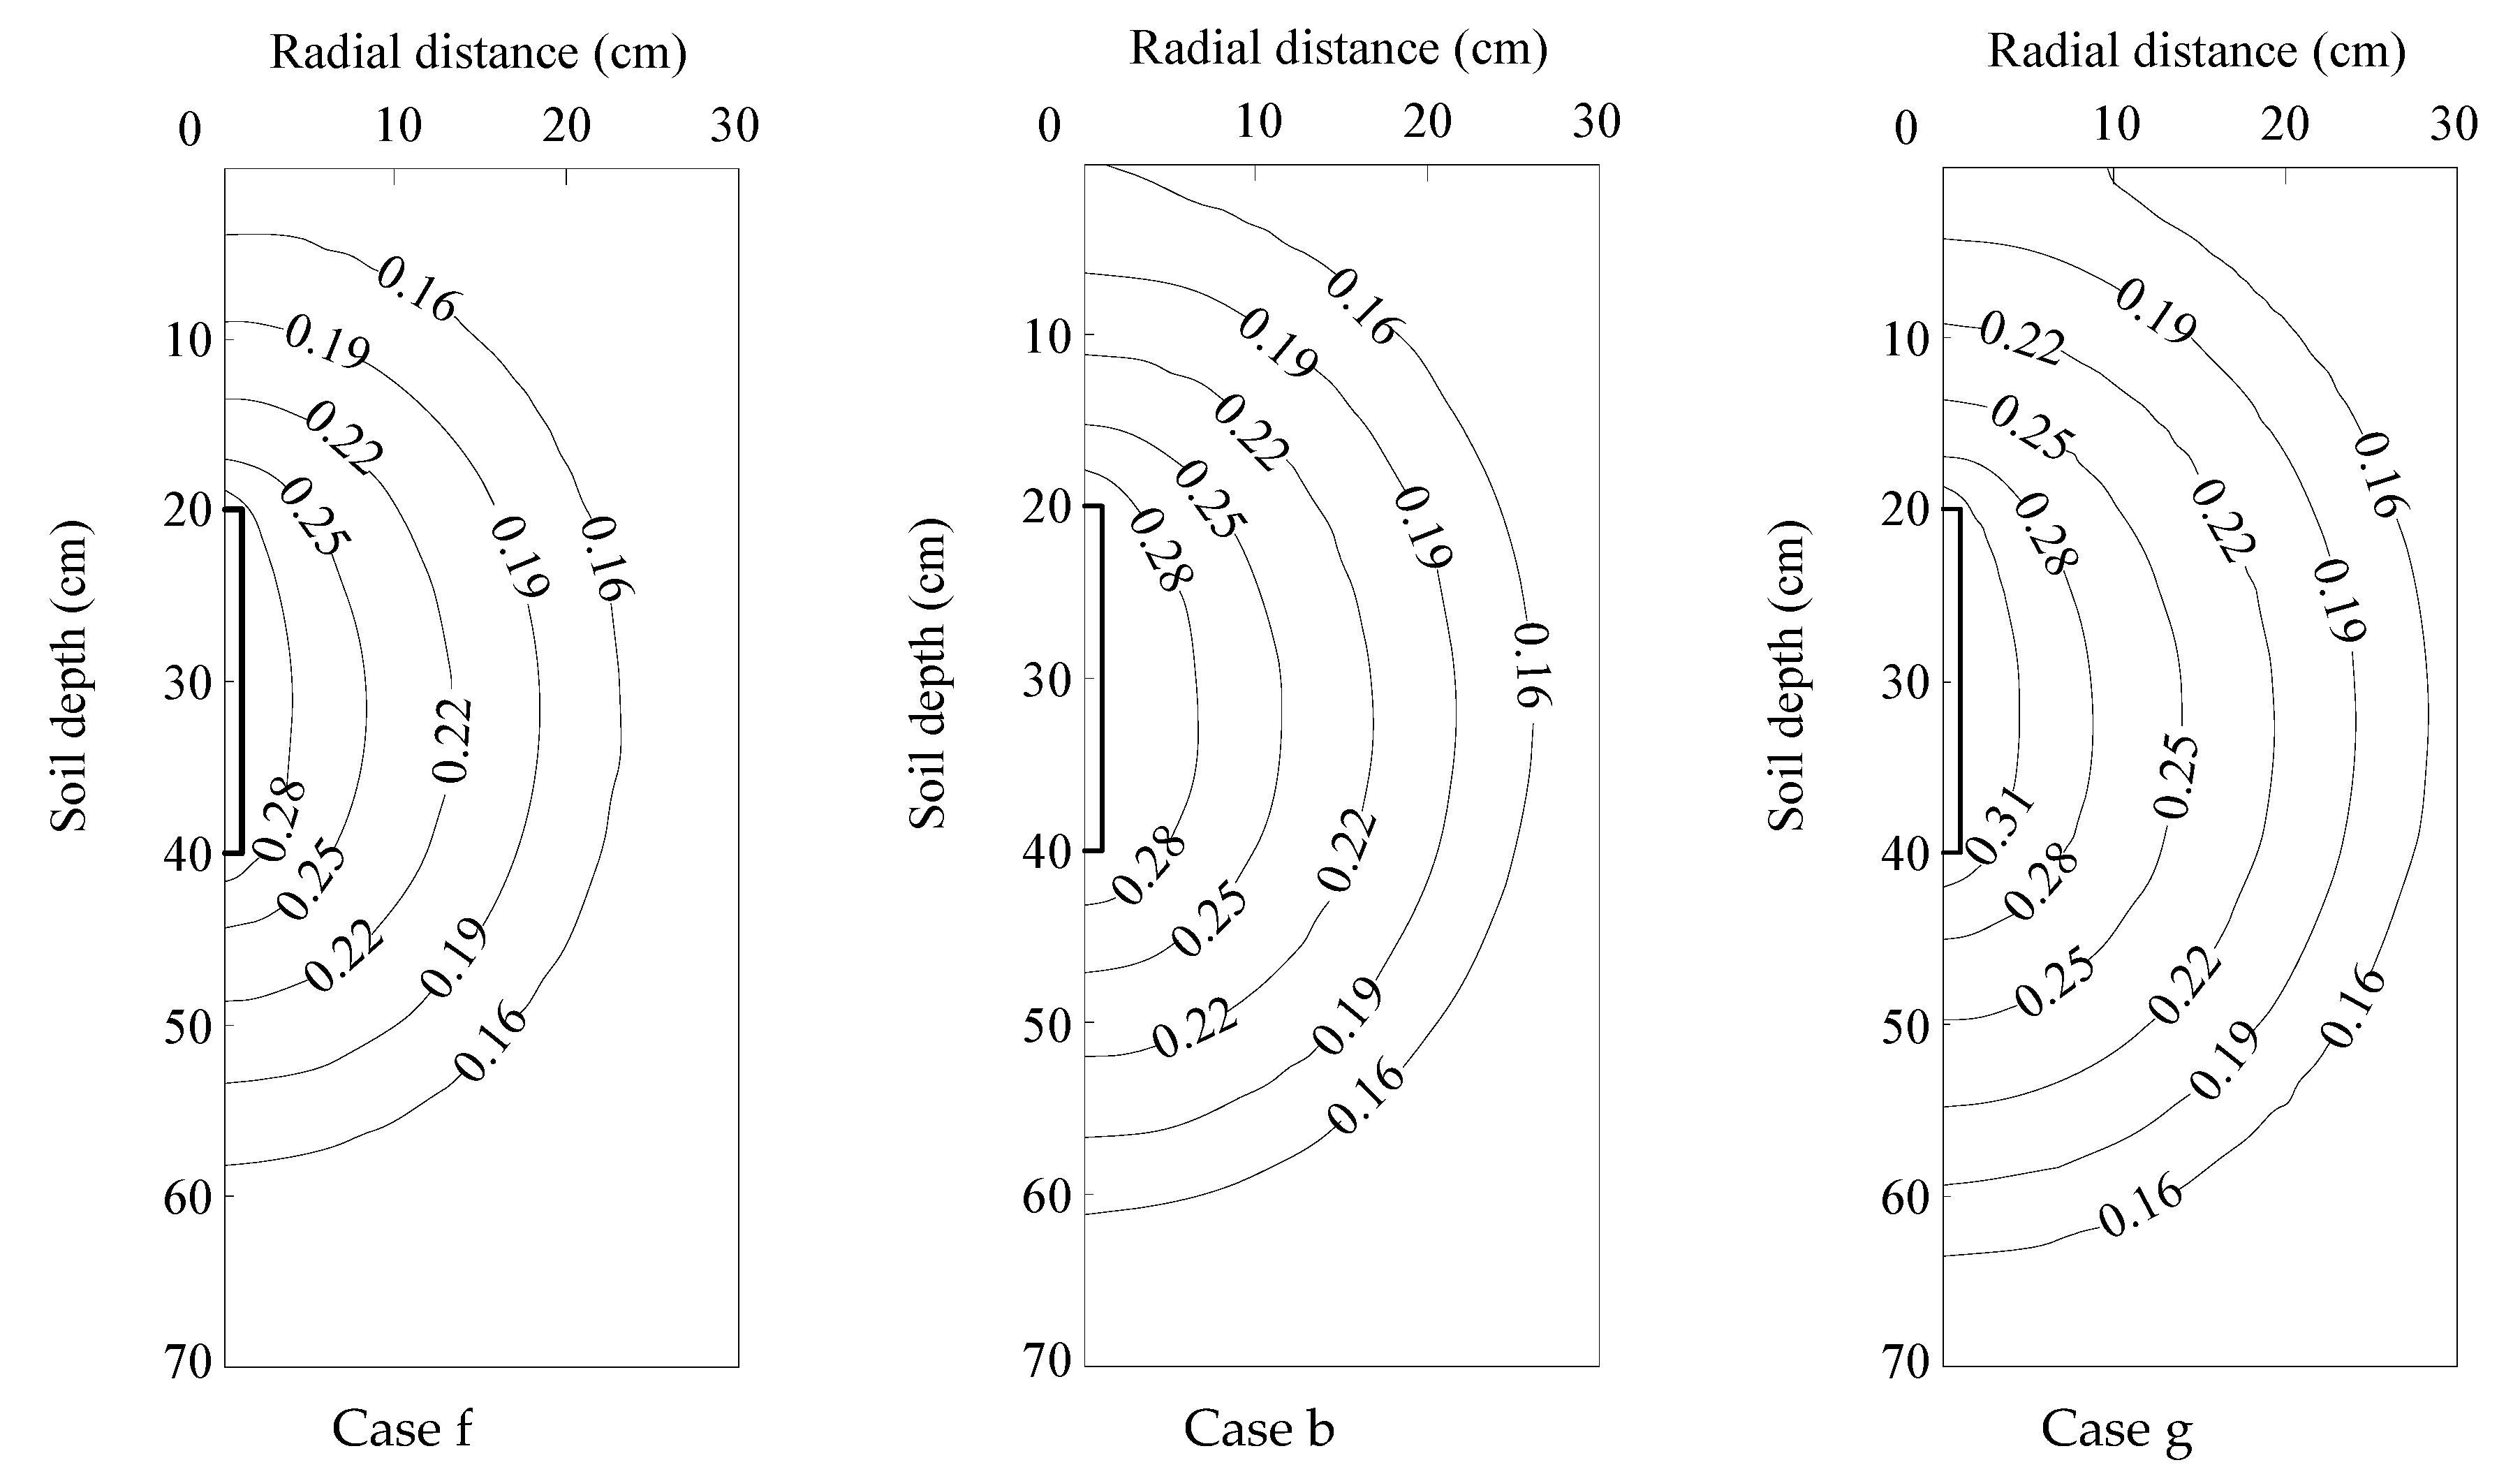
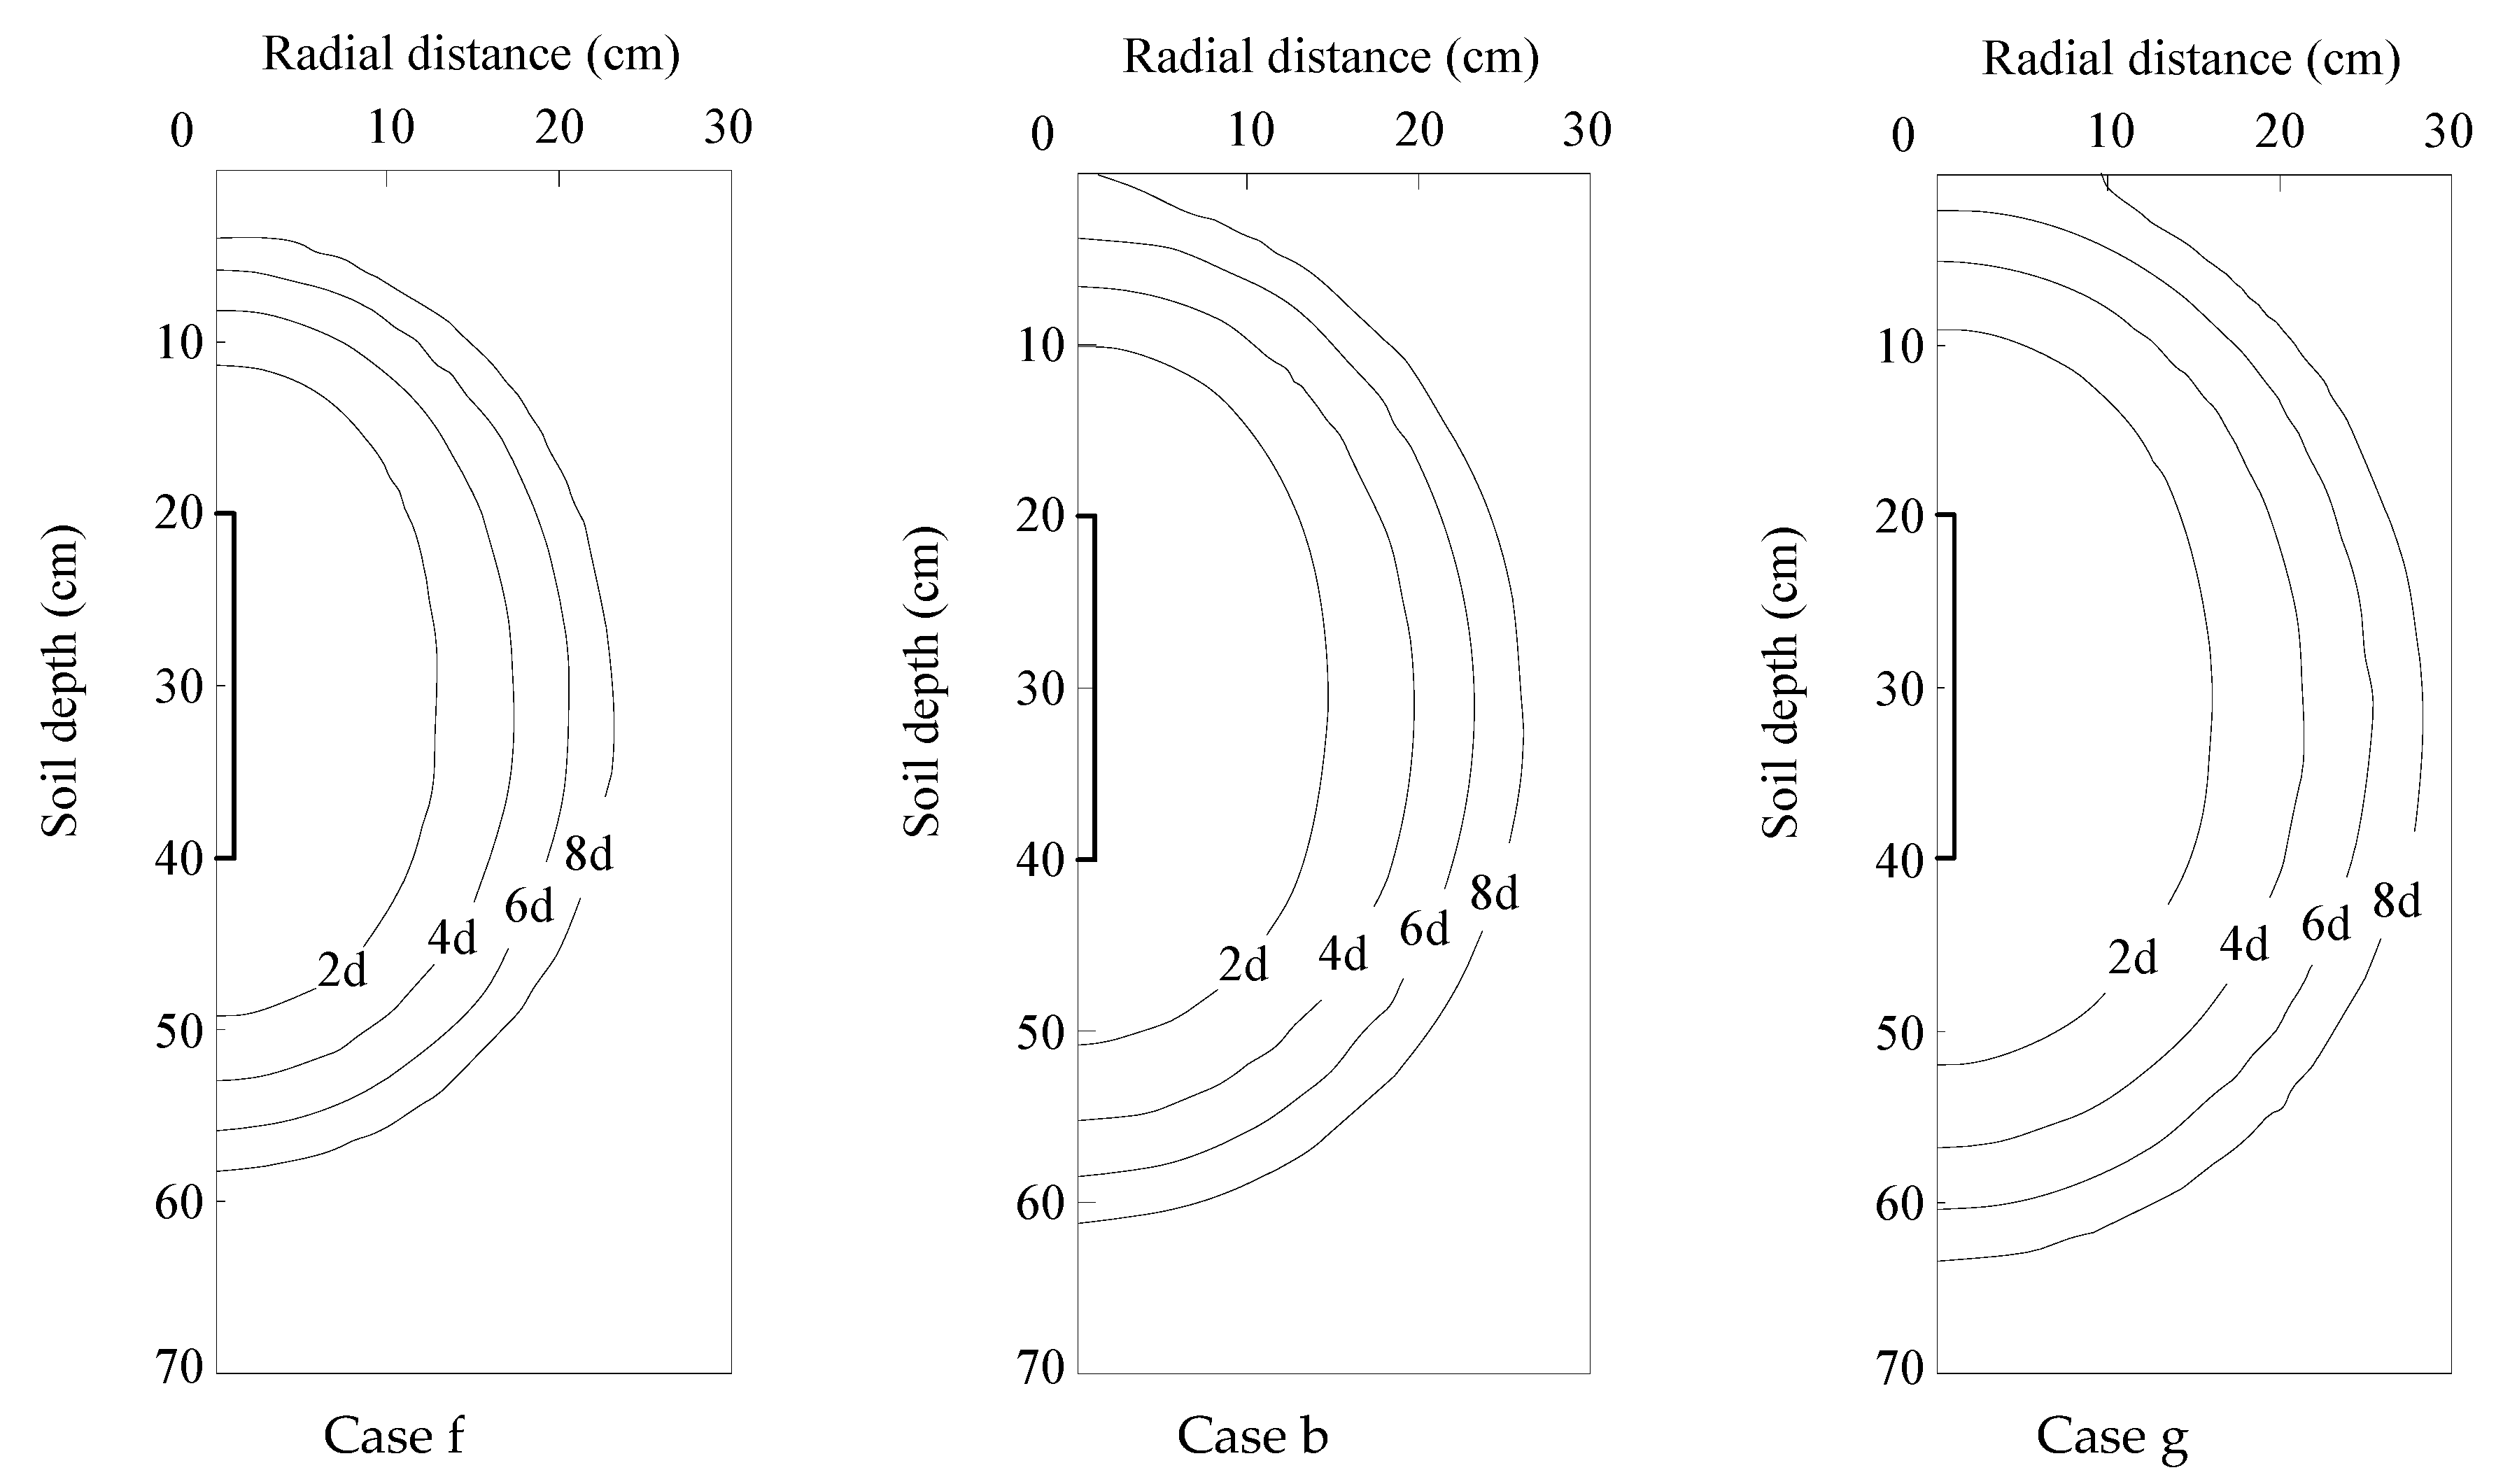
3.4.3. Influence of Pressure Head

Figure 13 shows the dynamic changes of the wetting pattern in a different pressure head. It can be seen from Figure 13 that the wetting front distance is positively correlated with the pressure head and increases with pressure head. As the pressure head increases, the moistube specific discharge becomes larger and the amount of water entering the soil per unit time increases, which leads to a faster wetting front migration rate.
The influence of three pressure heads on water content distributions after irrigation cut-off (8 days) is shown in Figure 14.
From Figure 14, we can see that the pressure head has a larger effect on water content distribution. As the pressure head increases, the wetted soil volume and the water content near the moistube increases. The soil water content near the moistube at the three heads (1.0 m, 1.5 m, and 2.0 m) were 0.34 cm3/cm3, 0.36 cm3/cm3, and 0.38 cm3/cm3, respectively. The volume of the wetting pattern of 1.5 m and 2.0 m increased by 50% and 90%, respectively, when compared with 1.0 m. Because the pressure head increases, the moistube specific discharge increases, which is limited by the soil permeability. Soil water does not spread rapidly, which results in the increase of water content near the moistube. At the same time, as the wetting front migration rate accelerates, the wetted soil volume increases.

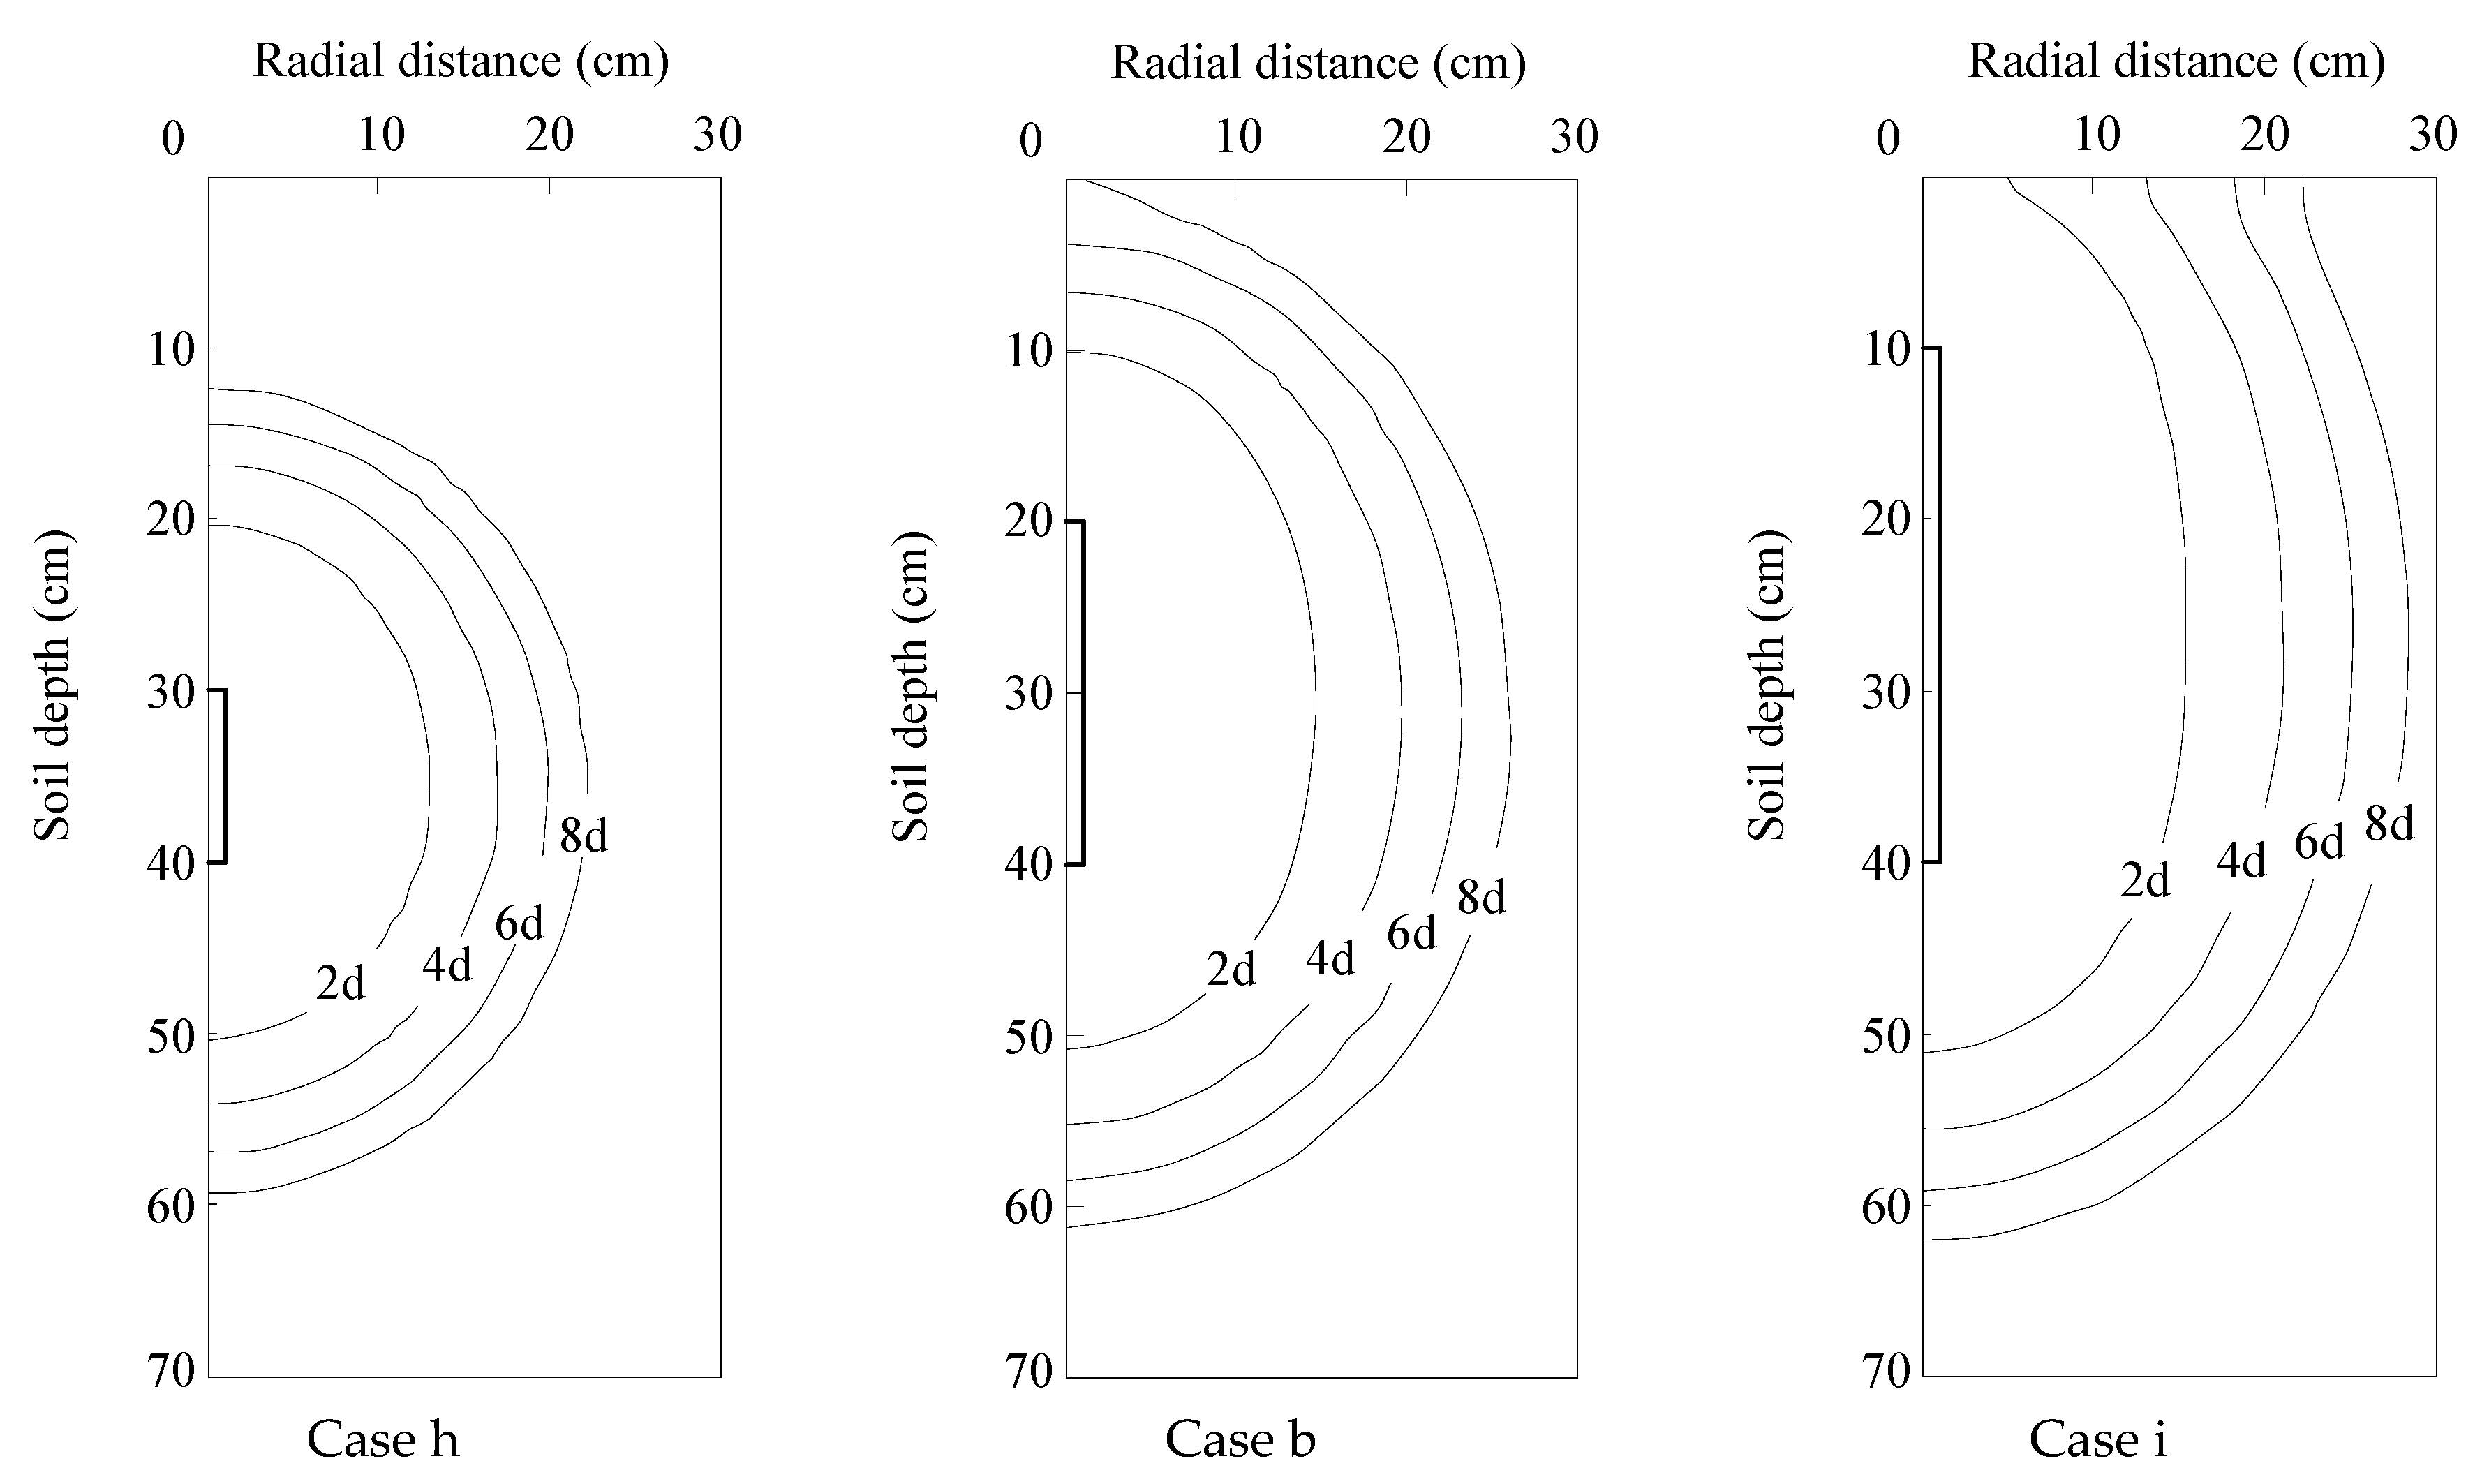
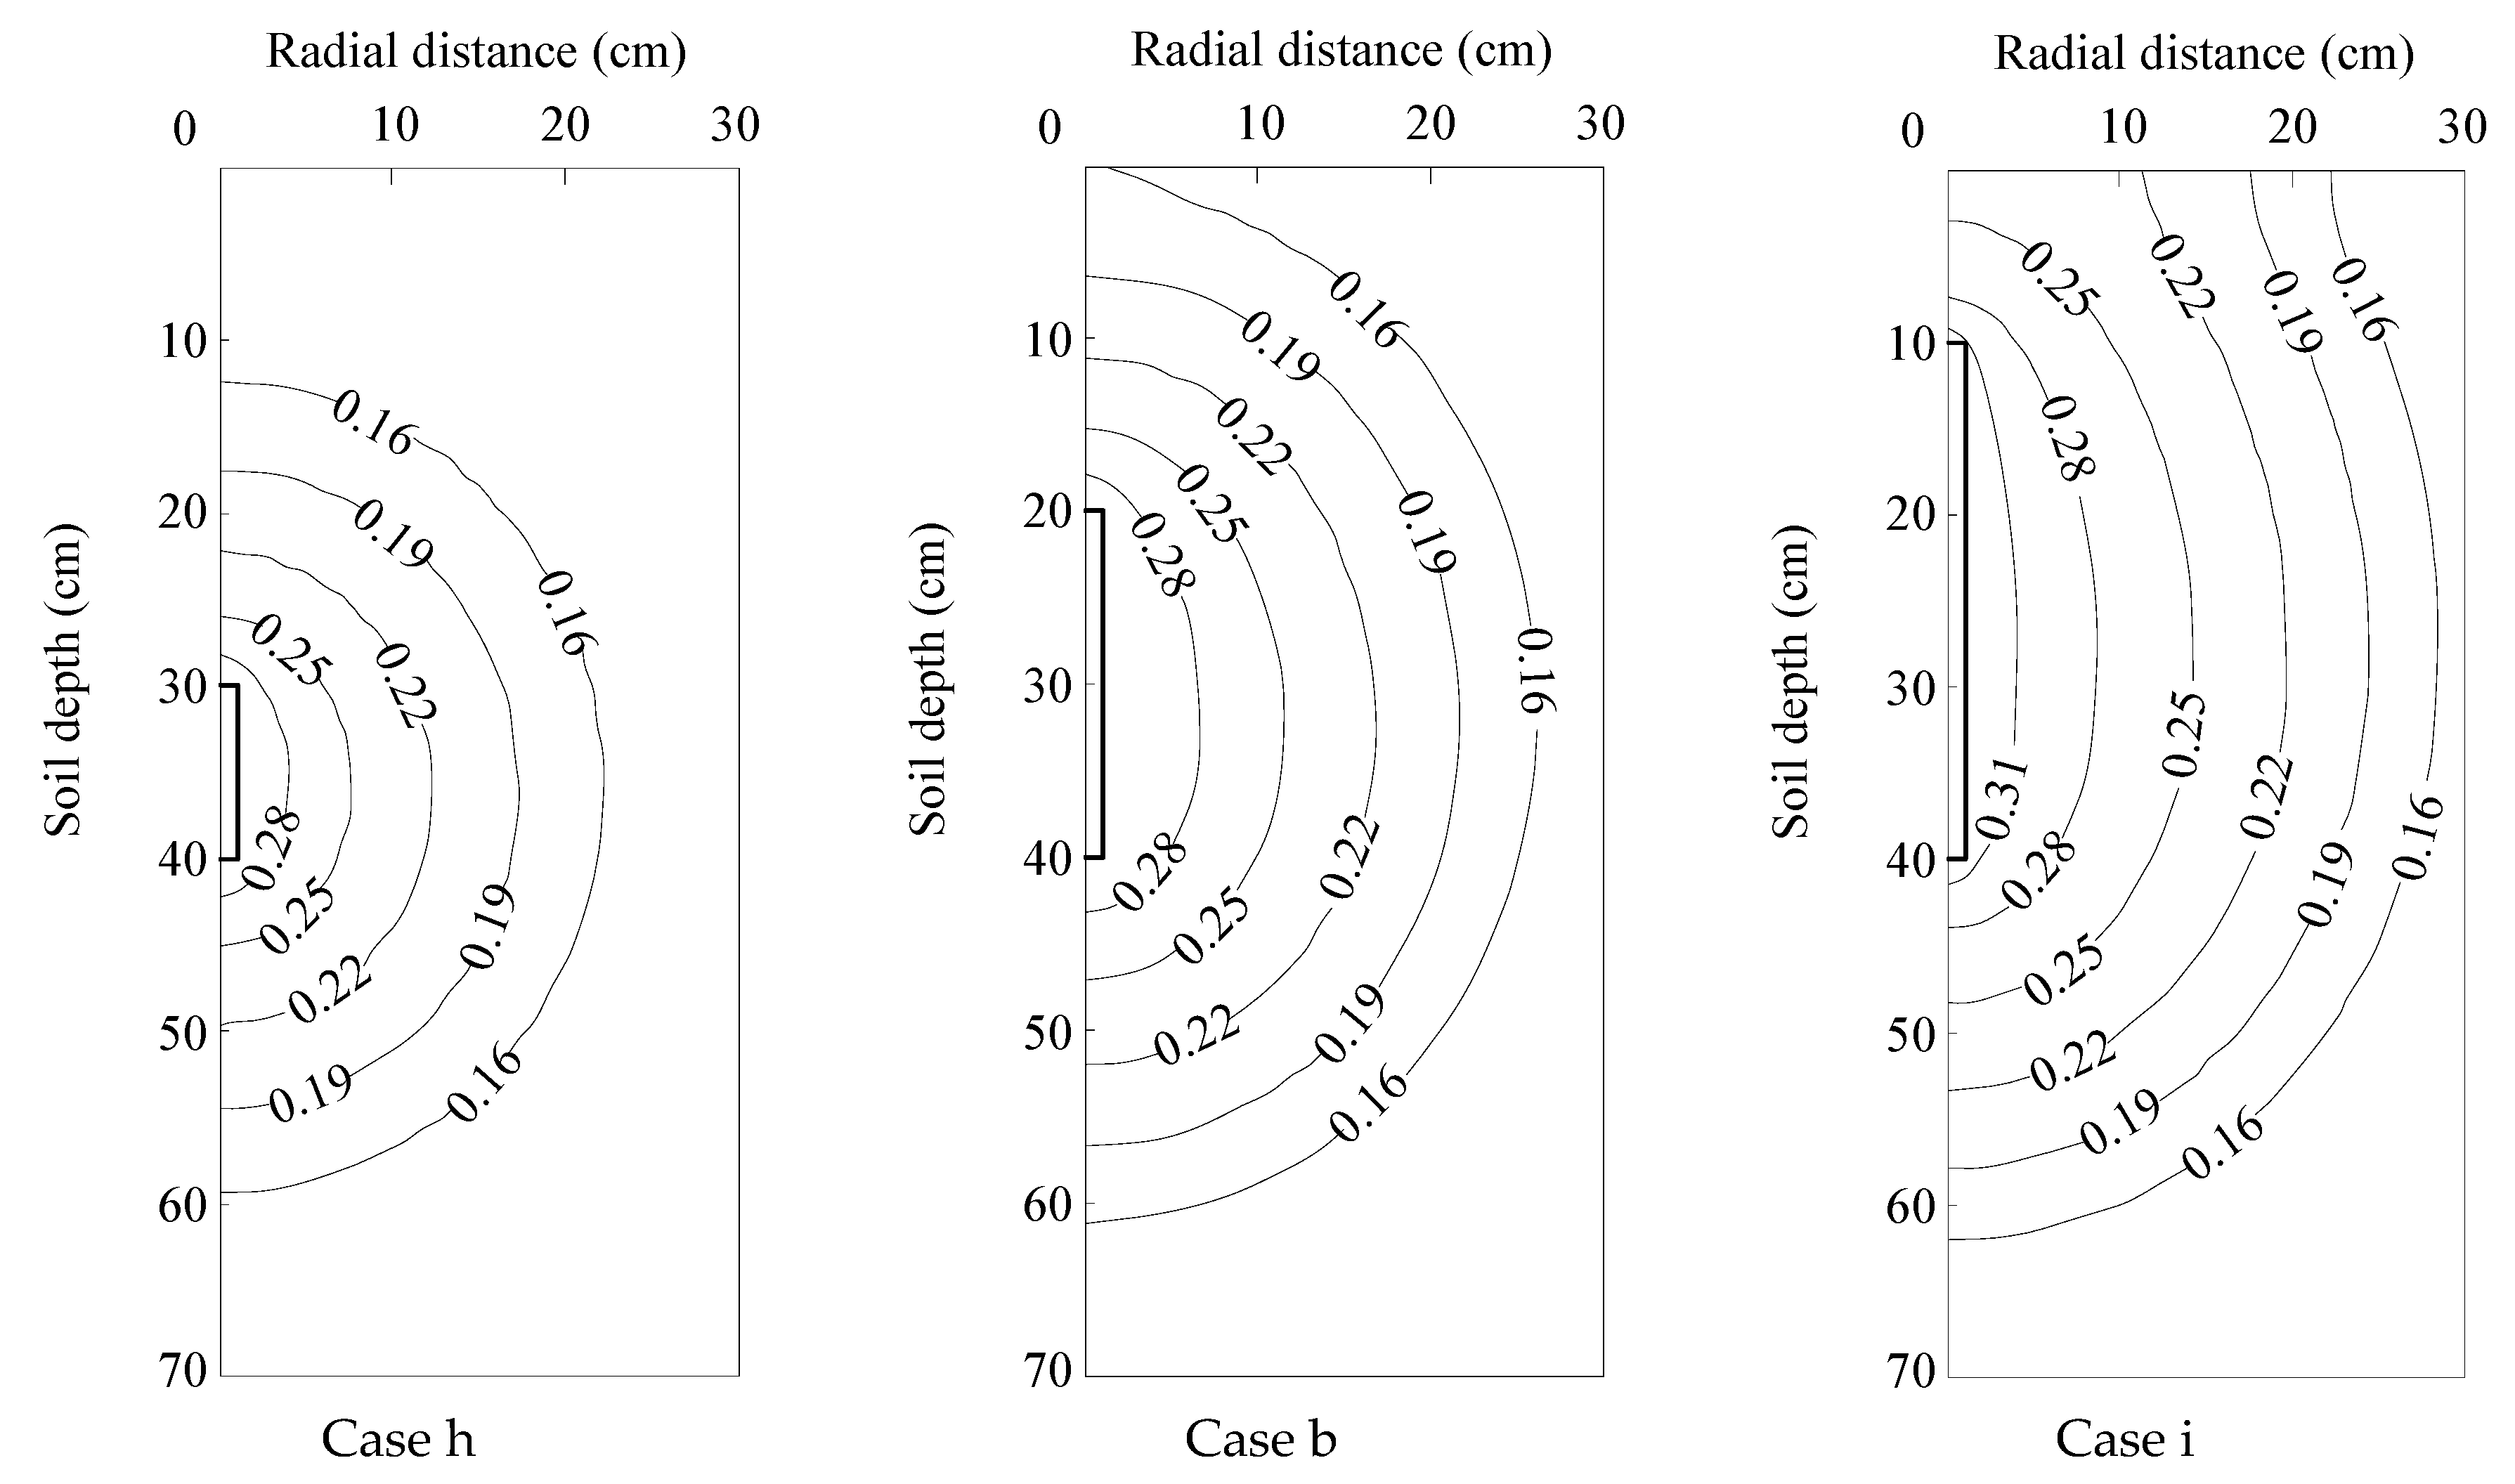
3.4.4. Influence of Moistube Length

Figure 15 shows the dynamic changes of the wetting pattern in different moistube lengths. From Figure 15, we can see that the wetting front migration distance has a positive correlation with moistube length and grows with the increase of the length. The longer the moistube, the larger the seepage area, the more water enters the soil within a unit of time, and the faster the wetting front moves. At the same buried depth (40 cm), the water of the long moistube (30 cm) reaches the soil surface first. After the wetting front reaches the surface, the soil surface wetted radius rapidly increases and the shape of the wetting pattern in the upper part of the moistube is similar to a “trapezoid” shape.
The influence of three moistube lengths on water content distributions after irrigation cut-off (8 days) is shown in Figure 16. As can be seen from Figure 16, the moistube length had a greater impact on water content distribution. The longer the moistube, the more the irrigation amount, the faster the wetting front migration, and the greater the volume of the wetting pattern. The irrigation amount with a moistube length of 20 cm and 30 cm is 2.4 times and 3.6 times that of 10 cm and the volume of the wetting pattern is 1.8 times and 2.3 times respectively. This shows that increasing the length of the moistube can increase the average water content of the wetted body.

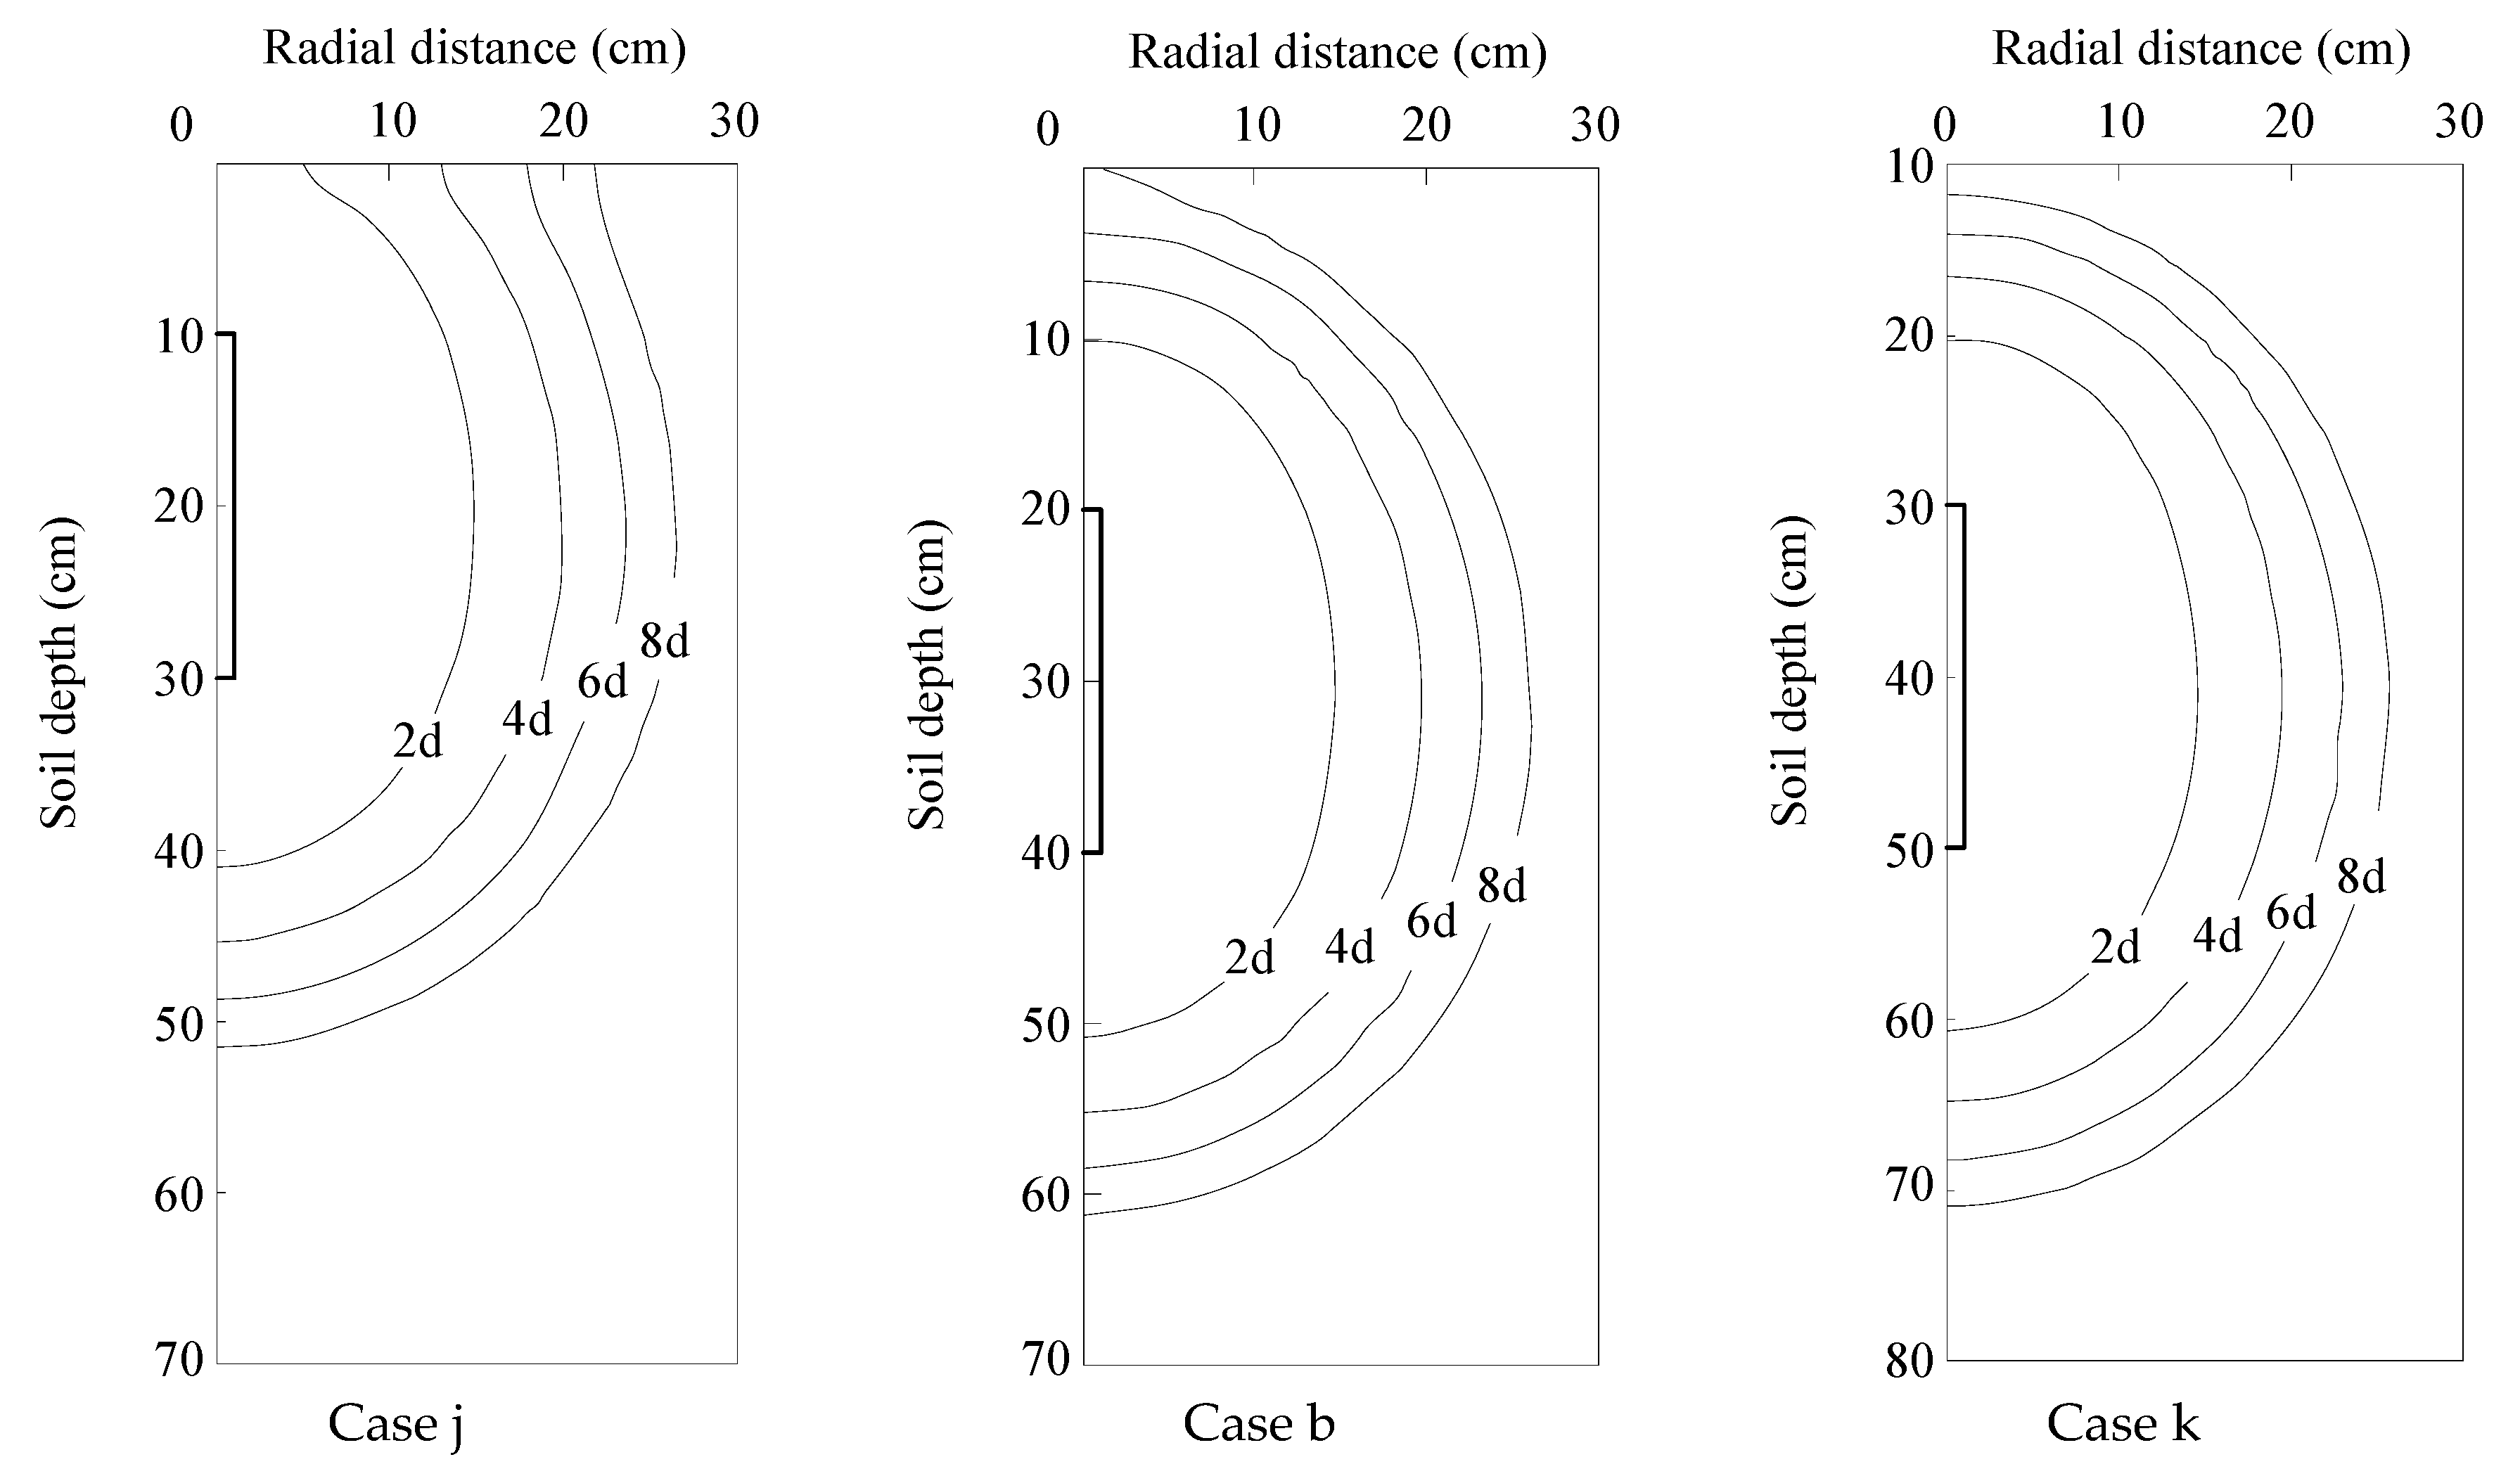
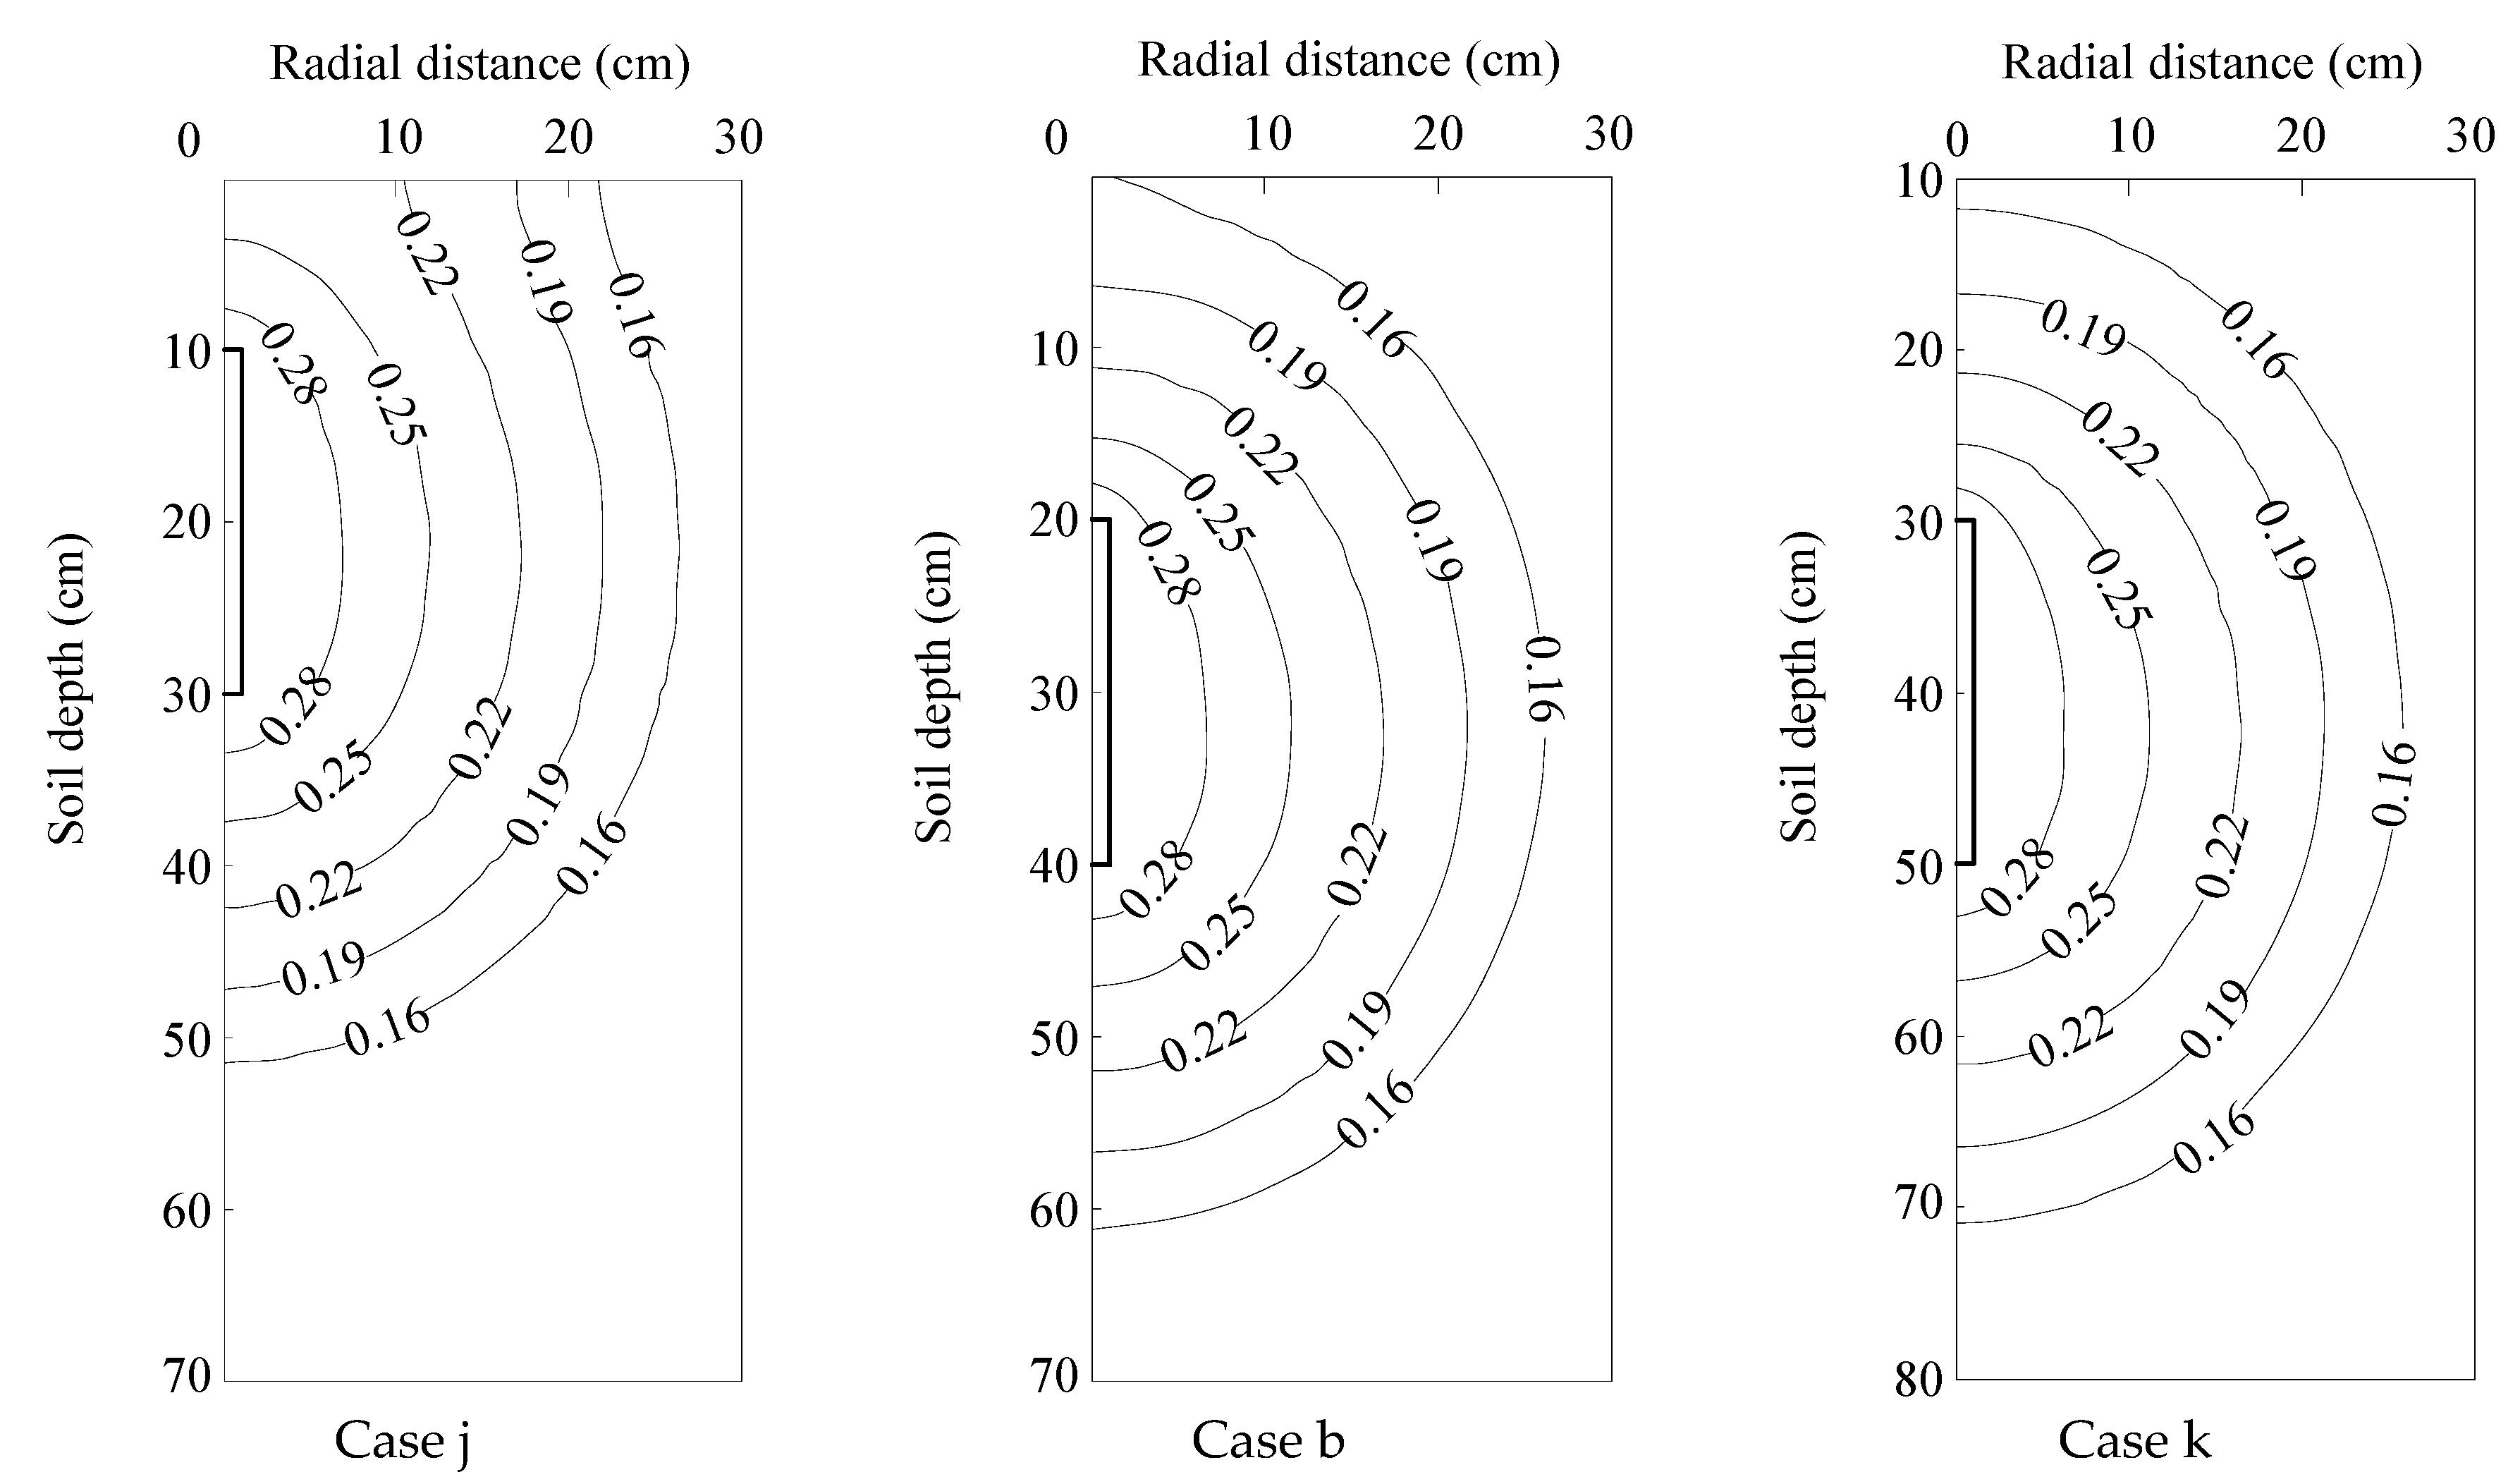
3.4.5. Influence of Moistube Buried Depth

Figure 17 shows the dynamic changes of the wetting pattern in different moistube buried depths. From Figure 17, we can see that the moistube buried depth affects the shape and position of the wetting pattern. When the depth is shallow, soil water easily reaches the soil surface and the wetting radius of the soil surface increases rapidly, which boosts surface water evaporation. When the depth is greater, the soil water tends to stay away from the root zone, which causes deep seepage and a topsoil water deficit. Therefore, the buried depth should be adapted to the soil conditions, root distribution, and farming requirements.
The influence of three moistube buried depths on water content distributions after irrigation cut-off (8 days) is shown in Figure 18.
It can be seen from Figure 18 that the difference in the volume of the wetting pattern is small, but the difference of location is great. When the wetting front with a buried depth of 30 cm reaches the surface, the water content of the soil surface increases. As the depth moves down, the contour of the soil water content moves downwards synchronously, and the wetting front with a buried depth of 50 cm does not reach the surface.

4. Conclusions

Based on Darcy’s law, the linear relationship between the specific discharge and the pressure head, the bulk density, and the water content was determined during the laboratory experiments. We evaluated the accuracy of HYDRUS-2D simulations of water infiltration and distribution under moistube-irrigation of aeolian sand and silt loam soil. The cumulative infiltrations, wetting pattern distances, and water content distributions predicted with HYDRUS-2D were found to be in very good agreement with experimental data. The results provide support for using HYDRUS-2D as a tool for investigating and designing moistube-irrigation management practices. We simulated the influence of soil texture, initial water content, pressure head, moistube length, and buried depth on the characteristics of the soil wetting pattern. There were small differences in the shape of the soil wetting pattern but significant differences in size. The wetting pattern and water content contour are approximately “ellipsoidal” in shape around the moistube. Soil texture has a significant effect on the wetting pattern characteristics. Both the vertical and horizontal wetting front distance and the wetted soil volume decreases with an increase in soil clay content. The initial water content, pressure head, and moistube length have great influence on the wetting front distance and wetted soil volume. Both the wetted soil volume and the wetting front distance have a positive correlation with the initial water content, pressure head, and moistube length. Moistube buried depth will affect the distribution of the soil wetting pattern. When the buried depth is shallow, the wetting front can easily reach the surface and the water content of the soil surface increases. When the buried depth is deeper, the soil-wetting pattern moves down synchronously.
Water-savings have significant benefits for expanding irrigated areas, reducing food prices, developing regional economic and restoring downstream ecosystems. However, efficient water use in agriculture reduces the recharge of groundwater on which natural vegetation depends, and affects regional ecological stability. Therefore, it is necessary to study how to create a multifunctional agricultural ecosystem by considering the allocation and regulation of water to increase synergies of environment, economy and ecosystem, so as to achieve a win-win situation between efficient agricultural water use and eco-environmental health.

Author Contributions

Y.F. designed the experiments and wrote the paper; T.Z. performed the experiments; and N.H. and J.Z. revised the paper.

Acknowledgments

This research was supported by National Key Research and Development Program of China (No. 2016YFC0500901) and the National Natural Science Foundation of China (No. 51409137). Special and sincere thanks to the Key Laboratory of Mechanics on Disaster and Environment in Western China, the Ministry of Education of China for the support for the experiments.

Conflicts of Interest

The authors declare no conflict of interest.

References

  1. Fan, Y.W.; Huang, N.; Gong, J.G.; Shao, X.X.; Zhang, J.; Zhao, T. A simplified infiltration model for predicting cumulative infiltration during vertical line source irrigation. Water 2018, 10, 89. [Google Scholar] [CrossRef]
  2. Du, S.Q.; Kang, S.Z.; Li, F.S.; Du, T.S. Water use efficiency is improved by alternate partial root-zone irrigation of apple in arid northwest China. Agric. Water Manag. 2017, 179, 184–192. [Google Scholar] [CrossRef]
  3. Li, Y.B.; Fan, Y.W.; Liu, Y.; Ma, X.Y. Influencing factors and simplified model of film hole irrigation. Water 2017, 9, 543. [Google Scholar] [CrossRef]
  4. Kang, S.Z.; Hu, X.T.; Jerie, P.; Zhang, J.H. The effects of partial rootzone drying on root, trunk sap flow and water balance in an irrigated pear (Pyrus communis, L.) orchard. J. Hydrol. 2003, 280, 192–206. [Google Scholar] [CrossRef]
  5. Petty, J.D.; Huckins, J.N.; Martin, D.B.; Adornato, T.G. Use of semipermeable membrane devices (SPMDS) to determine bioavailable organochlorine pesticide residues in streams receiving irrigation drainwater. Chemosphere 1995, 30, 1891–1903. [Google Scholar] [CrossRef]
  6. Yang, Q. Irrigation Method with Semi Permeable Membrane, Irrigation Container and Irrigation System Made of Semi Permeable Membrane and Their Application. EP2153714, 17 February 2010. [Google Scholar]
  7. Niu, W.Q.; Zhang, J.; Zhang, L.L.; Xue, W.L.; Zhang, L.T. Effects of buried depth and pressure head on water movement of wetted soil during moistube-irrigation. Trans. Chin. Soc. Agric. Mach. 2013, 44, 128–134. (In Chinese) [Google Scholar]
  8. Yu, X.D.; Liu, X.G.; Zhu, Y.F.; Qi, Y.T.; Yang, Q.L.; Tang, J.K. Effects of soil texture and water pressure on moistube infiltration in vertical inserting mode. J. Drain. Irrig. Mach. Eng. 2017, 35, 71–79. (In Chinese) [Google Scholar]
  9. Kandelous, M.M.; Šimůnek, J.; Van Genuchten, M.T.; Malek, K. Soil water content distributions between two emitters of a subsurface drip irrigation system. Soil Sci. Soc. Am. J. 2011, 75, 488–497. [Google Scholar] [CrossRef]
  10. Skaggs, T.H.; Trout, T.J.; Rothfuss, Y. Drip irrigation water distribution patterns: Effects of emitter rate, pulsing, and antecedent water. Soil Sci. Soc. Am. J. 2010, 74, 1886. [Google Scholar] [CrossRef]
  11. Subbaiah, R. A review of models for predicting soil water dynamics during trickle irrigation. Irrig. Sci. 2013, 31, 225–258. [Google Scholar] [CrossRef]
  12. El-Nesr, M.N.; Alazba, A.A.; Šimůnek, J. Hydrus simulations of the effects of dual-drip subsurface irrigation and a physical barrier on water movement and solute transport in soils. Irrig. Sci. 2014, 32, 111–125. [Google Scholar] [CrossRef]
  13. Naglič, B.; Kechavarzi, C.; Coulon, F.; Pintar, M. Numerical investigation of the influence of texture, surface drip emitter discharge rate and initial soil moisture condition on wetting pattern size. Irrig. Sci. 2014, 32, 421–436. [Google Scholar] [CrossRef]
  14. Patel, N.; Rajput, T.B.S. Effect of subsurface drip irrigation on onion yield. Irrig. Sci. 2009, 27, 97. [Google Scholar] [CrossRef]
  15. Khoshravesh-Miangoleh, M.; Kiani, A. Effect of magnetized water on infiltration capacity of different soil textures. Soil Use Manag. 2015, 30, 588–594. [Google Scholar] [CrossRef]
  16. Gumbs, F.A.; Warkentin, B.P. The effect of bulk density and initial water content on infiltration in clay soil samples. Soil Sci. Soc. Am. Proc. 1972, 36, 720–724. [Google Scholar] [CrossRef]
  17. Sharda, A.K. Influence of soil bulk density on horizontal water infiltration. Soil Res. 1977, 15, 83–86. [Google Scholar] [CrossRef]
  18. Yang, J.L.; Zhang, G.L. Water infiltration in urban soils and its effects on the quantity and quality of runoff. J. Soils Sediments 2011, 11, 751–761. [Google Scholar] [CrossRef]
  19. Dao, T.H. Tillage and winter wheat residue management effects on water infiltration and storage. Soil Sci. Soc. Am. J. 2016, 57, 1586–1595. [Google Scholar] [CrossRef]
  20. Liu, H.; Lei, T.W.; Zhao, J.; Yuan, C.P.; Fan, Y.T.; Qu, L.Q. Effects of rainfall intensity and antecedent soil water content on soil infiltrability under rainfall conditions using the run off-on-out method. J. Hydrol. 2011, 396, 24–32. [Google Scholar] [CrossRef]
  21. Bresler, E.; Heller, J.; Diner, N.; Ben-Asher, J.; Brandt, A.; Goldberg, D. Infiltration from a trickle source: II. Experimental data and theoretical predictions. Soil Sci. Soc. Am. J. 1971, 35, 683–689. [Google Scholar] [CrossRef]
  22. Ah Koon, P.D.; Gregory, P.J.; Bell, J.P. Influence of drip irrigation emission rate on distribution and drainage of water beneath a sugarcane and a fallow plot. Agric Water Manag. 1990, 17, 267–282. [Google Scholar] [CrossRef]
  23. Khan, A.A.; Yitayew, M.; Warrick, A.W. Field evaluation of water and solute distribution from a point source. Irrig Drain Eng. 1996, 22, 221–227. [Google Scholar] [CrossRef]
  24. Li, J.; Zhang, J.; Ren, L. Water and nitrogen distribution as affected by fertigation of ammonium nitrate from a point source. Irrig Sci. 2003, 22, 12–30. [Google Scholar]
  25. Ismail, S.M.; El-Abedin, T.K.Z.; Wassif, M.M.; Nesr, M.N.E. Physical and hydraulic barriers under surface and subsurface drip irrigation systems. Misr. J. Agric. Eng. Res. MSAE 2006, 23, 1001–1016. [Google Scholar]
  26. Patel, N.; Rajput, T.B.S. Effect of drip tape placement depth and irrigation level on yield of potato. Agric. Water Manag. 2007, 88, 209–223. [Google Scholar] [CrossRef]
  27. Brandt, A.; Bresler, E.; Diner, N.; Ben-Asher, I.; Heller, J.; Goldberg, D. Infiltration from a trickle source: I. mathematical model. Soil Sci. Soc. Am. J. Proc. 1971, 35, 675–682. [Google Scholar] [CrossRef]
  28. Warrick, A.W. Point and line infiltration calculation of the wetted soil surface. Soil Sci. Soc. Am. J. 1985, 49, 1581–1583. [Google Scholar] [CrossRef]
  29. Revol, P.B.; Clothier, E.; Mailhol, J.C.; Vachaud, G.; Vauclin, M. Infiltration from a surface point source and drip irrigation: 2. An approximate time-dependent solution for wet front position. Water Resour. Res. 1997, 33, 1869–1874. [Google Scholar] [CrossRef]
  30. Singh, D.K.; Rajput, T.B.S.; Singh, D.K.; Sikarwar, H.S.; Sahoo, R.N.; Ahmad, T. Simulation of soil wetting pattern with subsurface drip irrigation from line source. Agric. Water Manag. 2006, 83, 130–134. [Google Scholar] [CrossRef]
  31. Zhou, Q.Y.; Kang, S.Z.; Zhang, L. Comparison of APRI and HYDRUS-2D models to simulate soil water dynamics in a vineyard under alternate partial root zone drip irrigation. Plant Soil. 2007, 291, 211–223. [Google Scholar] [CrossRef]
  32. Šimůnek, J.; Van Genuchten, M.T.; Šejna, M. Recent developments and applications of the HYDRUS computer software packages. Vadose Zone J. 2016, 15, 1–25. [Google Scholar] [CrossRef]
  33. Skaggs, T.H.; Trout, T.J.; Šimůnek, J.; Shouse, P.J. Comparison of HYDRUS-2D simulations of drip irrigation with experimental observations. J. Irrig. Drain. Eng. 2004, 130, 304–310. [Google Scholar] [CrossRef]
  34. Provenzano, G. Using HYDRUS -2D simulation model to evaluate wetted soil volume in subsurface drip irrigation systems. J. Irrig. Drain. Eng. 2007, 133, 342–349. [Google Scholar] [CrossRef]
  35. Stewart, R.D.; Rupp, D.E.; Najm, M.R.A.; Selker, J.S. Modeling effect of initial soil moisture on sorptivity and infiltration. Water Resour. Res. 2013, 49, 7037–7047. [Google Scholar] [CrossRef]
  36. Karandish, F.; Šimůnek, J. Two-dimensional modeling of nitrogen and water dynamics for various N-managed water-saving irrigation strategies using HYDRUS. Agric. Water Manag. 2017, 193, 174–190. [Google Scholar] [CrossRef]
  37. Tuller, M.; Or, D. Hydraulic conductivity of variably saturated porous media: Film and corner flow in angular pore space. Water Resour. Res. 2001, 37, 1257–1276. [Google Scholar] [CrossRef]
  38. Zhang, S.H.; Lei, T.W.; Ding, Y.Y.; Xu, C.P. Finite element modeling of soil water movement under subsurface irrigation with porous pipe and its application. Trans. Chin. Soc. Agric. Eng. 2002, 18, 1–5. (In Chinese) [Google Scholar]
  39. Niu, W.Q.; Zhang, M.Z.; Xu, J.; Zou, X.Y.; Zhang, R.C.; Li, Y. Prediction Methods and Characteristics of Flow for Moistube. Trans. Chin. Soc. Agric. Mach. 2017, 48, 217–224. (In Chinese) [Google Scholar]
  40. Šimůnek, J.; Van Genuchten, M.T.; Šejna, M. The HYDRUS Software Package for Simulating the Two- and Three-Dimensional Movement of Water, Heat, and Multiple Solutes in Variably Saturated Media; Technical Manual, Version 1.0; PC Progress: Prague, Czech Republic, 2006; p. 241. [Google Scholar]
  41. Xing, X.; Kang, D.; Ma, X. Differences in loam water retention and shrinkage behavior: Effects of various. types and concentrations of salt ions. Soil Till. Res. 2017, 167, 61–72. [Google Scholar] [CrossRef]
  42. Mualem, Y. A new model for predicting the hydraulic conductivity of unsaturated porous media. Water Resour. Res. 1976, 12, 513–522. [Google Scholar] [CrossRef]
  43. Van Genuchten, M.T. A closed-form equation for predicting the hydraulic conductivity of unsaturated soils. Soil Sci. Soc. Am. J. 1980, 44, 892–898. [Google Scholar] [CrossRef]
  44. Van Genuchten, M.T.; Leij, F.J.; Yates, S.R. The RETC Code for Quantifying the Hydraulic Functions of Unsaturated Soils; Research Report No. EPA/600/2-91/065; US Salinity Laboratory, US Department of Agriculture, Agricultural Research Service: Riverside, CA, USA, 1991. Available online: http://www.pc-progress.com/documents/programs/retc.pdf (accessed on 1 December 1991).
  45. Moriasi, D.N.; Arnold, J.G.; Van Liew, M.W.; Bingner, R.L.; Harmel, R.D.; Veith, T.L. Model evaluation guidelines for systematic quantification of accuracy in watershed simulations. Trans. ASABE 2007, 50, 885–900. [Google Scholar] [CrossRef]
  46. Carsel, R.F.; Parrish, R.S. Developing joint probability distributions of soil water retention characteristics. Water Resour. Res. 1988, 24, 755–769. [Google Scholar] [CrossRef]
  47. Jiang, P.F.; Lei, T.W.; Liu, X.H.; Wu, Y.; Li, X.; Wang, Q.J. Principles and experimental verification of capillary suction method for fast measurement of field capacity. Trans. Chin. Soc. Agric. Eng. 2006, 22, 1–5. (In Chinese) [Google Scholar]
Figure 1. Schematic diagram of experimental equipment (H represents inlet pressure head).
Water 10 00601 g001
Figure 2. Schematic diagram of the transport domain used in simulations.
Water 10 00601 g002
Figure 3. Cumulative seepage of moistube in the air.
Water 10 00601 g003
Figure 4. The relationship between specific discharge and pressure head.
Water 10 00601 g004
Figure 5. Cumulative infiltration of moistube in the soil.
Water 10 00601 g005
Figure 6. Measured and predicted cumulative infiltration for two soils.
Water 10 00601 g006
Figure 7. Comparison between simulated and measured values of the wetting front distance.
Water 10 00601 g007
Figure 8. Comparison between simulated and measured values of water content distributions.
Water 10 00601 g008
Figure 9. Dynamic changes of wetting pattern for different soil textures.
Water 10 00601 g009
Figure 10. Volumetric water content distribution for different soil textures after irrigation cut-off.
Water 10 00601 g010
Figure 11. Dynamic changes of the wetting pattern for different soil initial water contents.
Water 10 00601 g011
Figure 12. Volumetric water content distribution for different soil initial water contents after irrigation cut-off.
Water 10 00601 g012
Figure 13. Dynamic changes of wetting pattern for different pressure heads.
Water 10 00601 g013
Figure 14. Volumetric water content distribution for different pressure heads after irrigation cut-off.
Water 10 00601 g014
Figure 15. Dynamic changes of the wetting pattern for different moistube lengths.
Water 10 00601 g015
Figure 16. Volumetric water content distribution for different moistube lengths after irrigation cut-off.
Water 10 00601 g016
Figure 17. Dynamic changes of the wetting pattern for different moistube buried depths.
Water 10 00601 g017
Figure 18. Volumetric water content distribution for different moistube buried depths after irrigation cut-off.
Water 10 00601 g018
Table 1. Basic physical properties of tested soils.
Soil TypeParticle Size/mmBulk Density (g/cm3)Saturated Soil Water Content (cm3/cm3)Field Capacity (cm3/cm3)Wilting Coefficient (%)
0.02~2.000.002~0.020~0.002
Aeolian sand97.692.310.001.600.430.0511.8
Silt loam24.3565.5510.101.300.500.2866.7
Table 2. The van Genuchten-Mualem Parameters of experimental soils.
Soil TypeResidual Soil Water Content (cm3/cm3)Saturated Soil Water Content (cm3/cm3)Parameter α in the Soil Water Retention Function (1/cm)Parameter n in the Soil Water Retention Function (-)Saturated Hydraulic Conductivity (cm/min)
Aeolian sand0.020.430.1622.240.4210
Silt loam0.020.500.0141.510.0143
Table 3. Simulation scenarios for vertical moistube-irrigation.
CaseSoil TextureInitial Water Content *Pressure Head **Moistube LengthBuried Depth***
aSilt loam50%1.52040
bLoam50%1.52040
cSandy loam50%1.52040
dLoam40%1.52040
eLoam60%1.52040
fLoam50%1.02040
gLoam50%2.02040
hLoam50%1.51040
iLoam50%1.53040
jLoam50%1.52030
kLoam50%1.52050
* Initial water content is the percentage of field capacity; ** Pressure head takes the water inlet; *** Buried depth represents distance between the bottom of moistube and soil surface.
Table 4. Physical properties of soils considered in HYDRUS simulations.
Soil TextureResidual Soil Water Content (cm3·cm−3)Saturated Soil Water Content (cm3·cm−3)Parameter α in the Soil Water Retention Function (cm−1)Parameter n in the Soil Water Retention Function (-)Saturated Hydraulic Conductivity (cm·min−1)
Silt loam0.0670.4500.0201.410.0075
Loam0.0780.4300.0361.560.0173
Sandy loam0.0650.4100.0751.890.0737

