Using SWAT-LUD Model to Estimate the Influence of Water Exchange and Shallow Aquifer Denitrification on Water and Nitrate Flux
Abstract
1. Introduction
2. Materials and Methods
2.1. SWAT-LUD Model
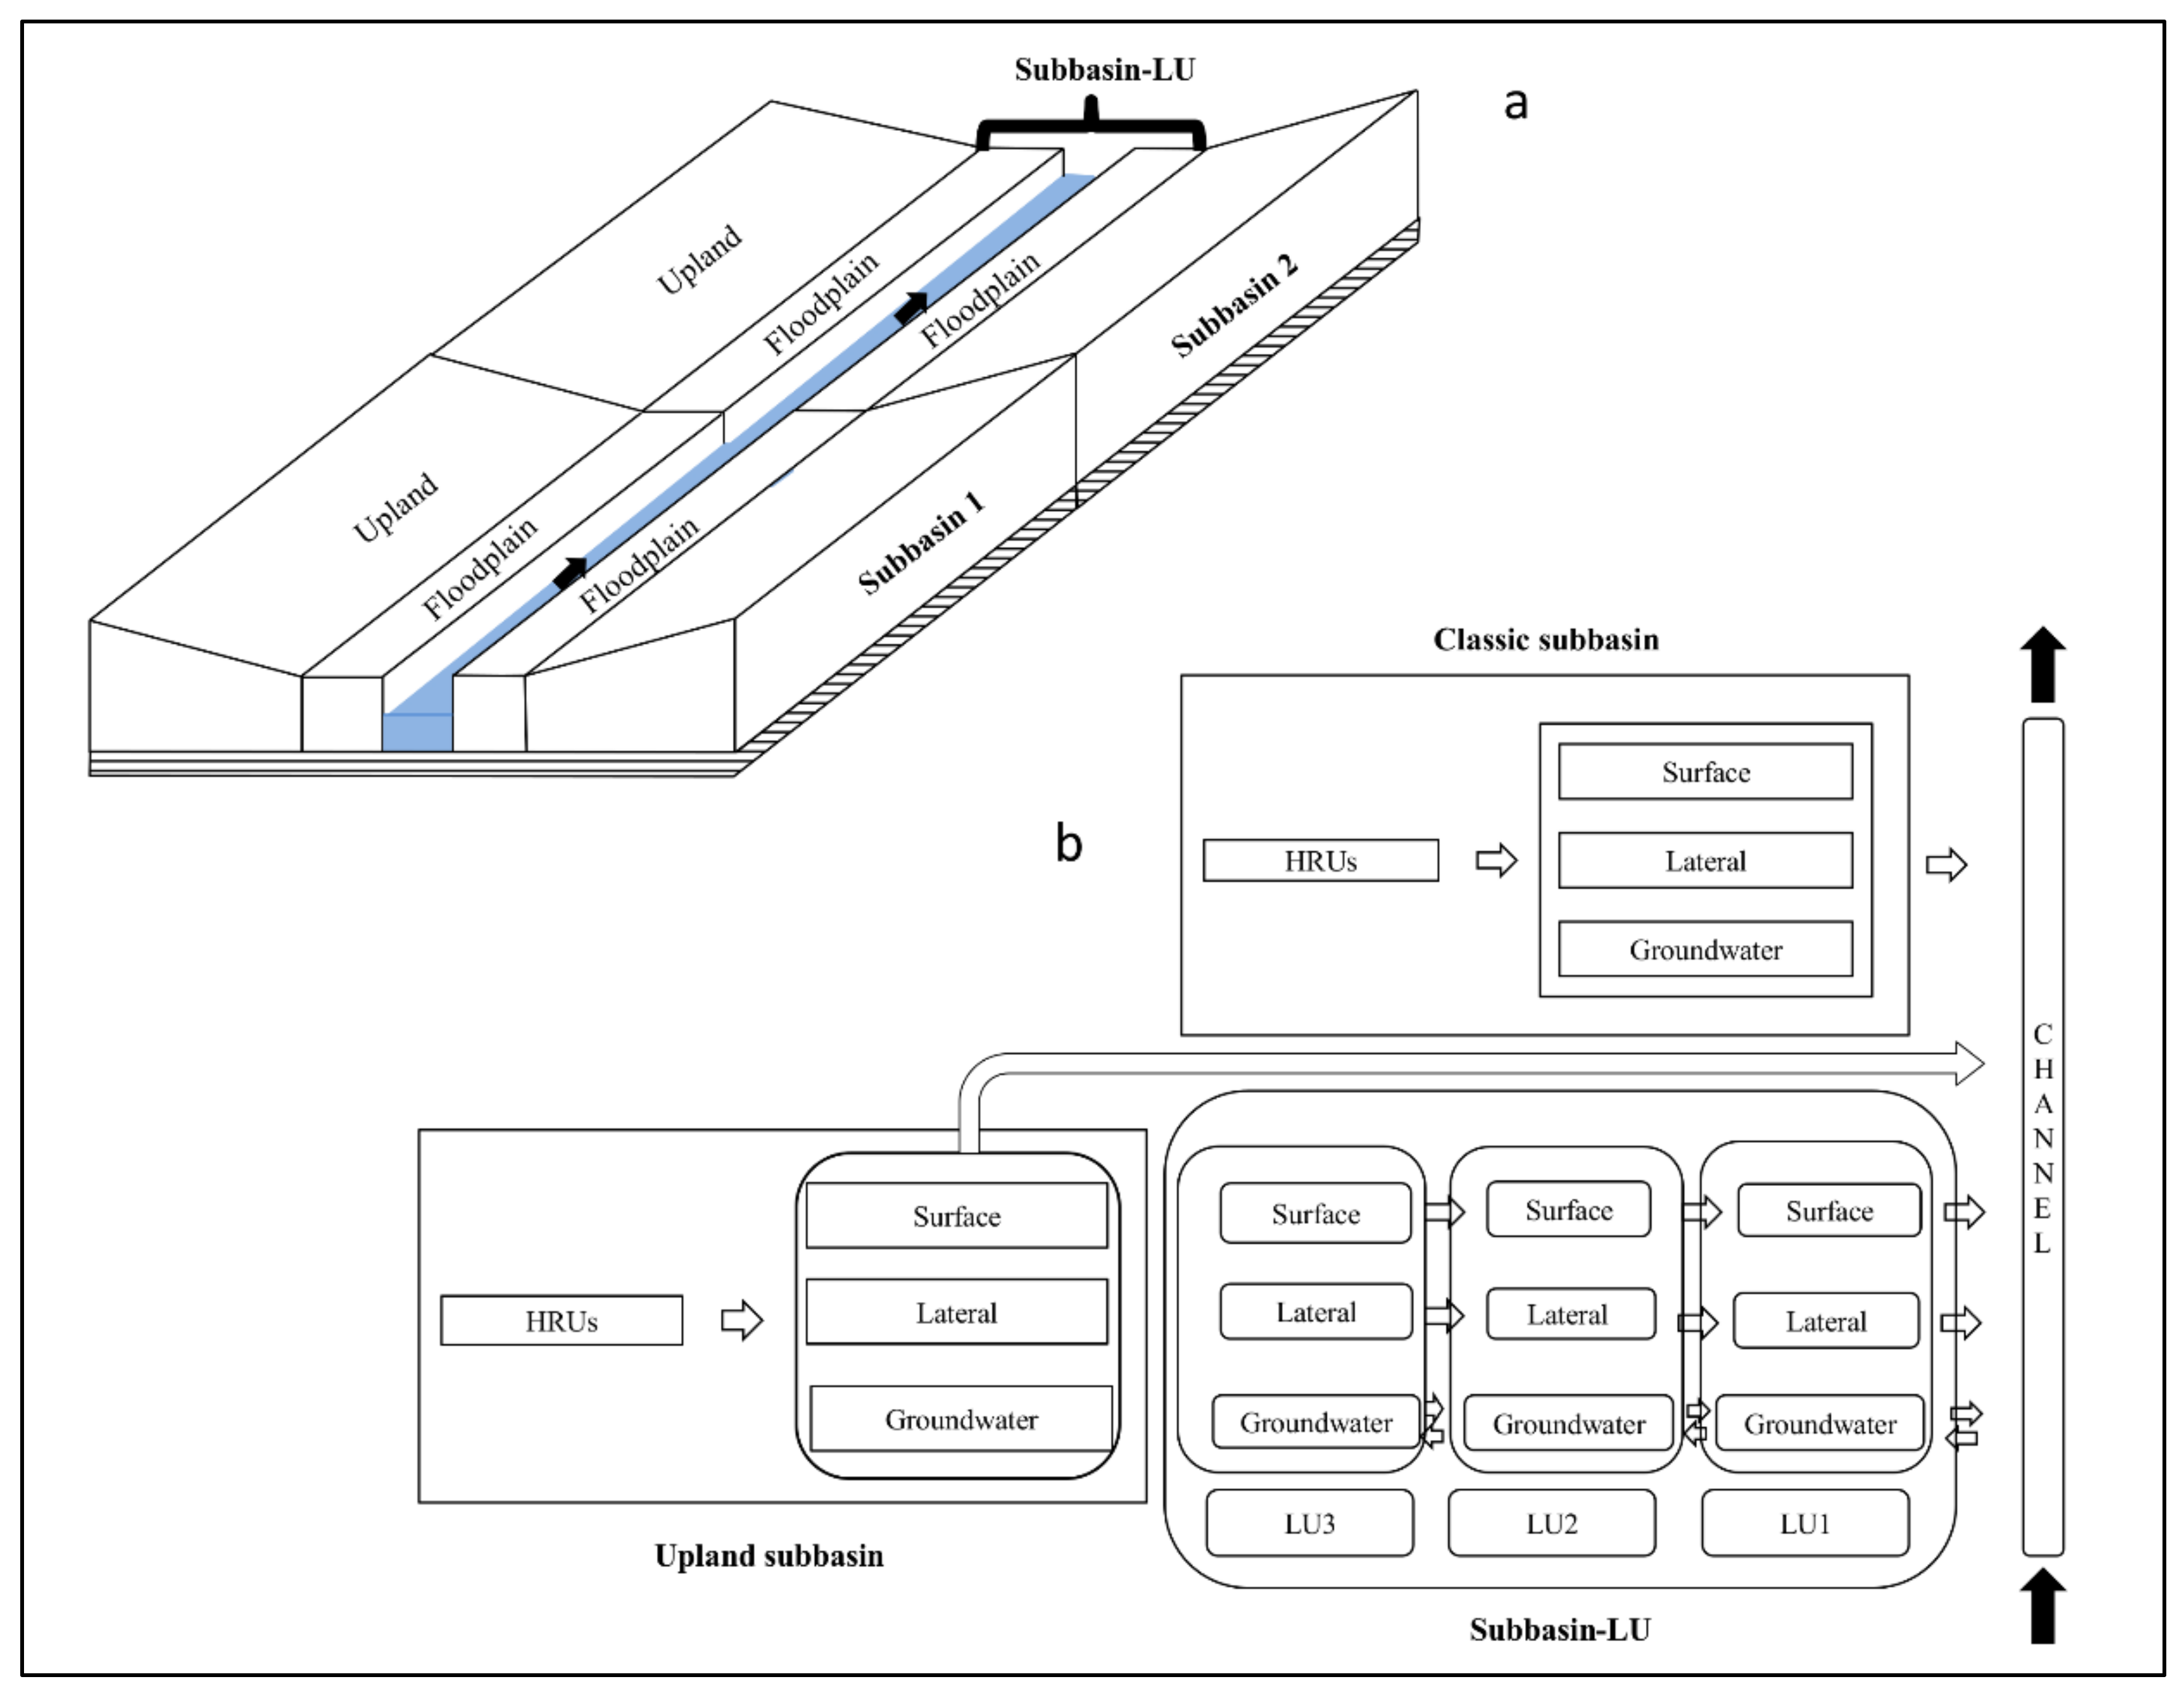
2.1.1. Hydrological Processes in the SWAT-LUD Model
2.1.2. Denitrification in the SWAT-LUD Model
2.2. Distribution of HRUs in LUs
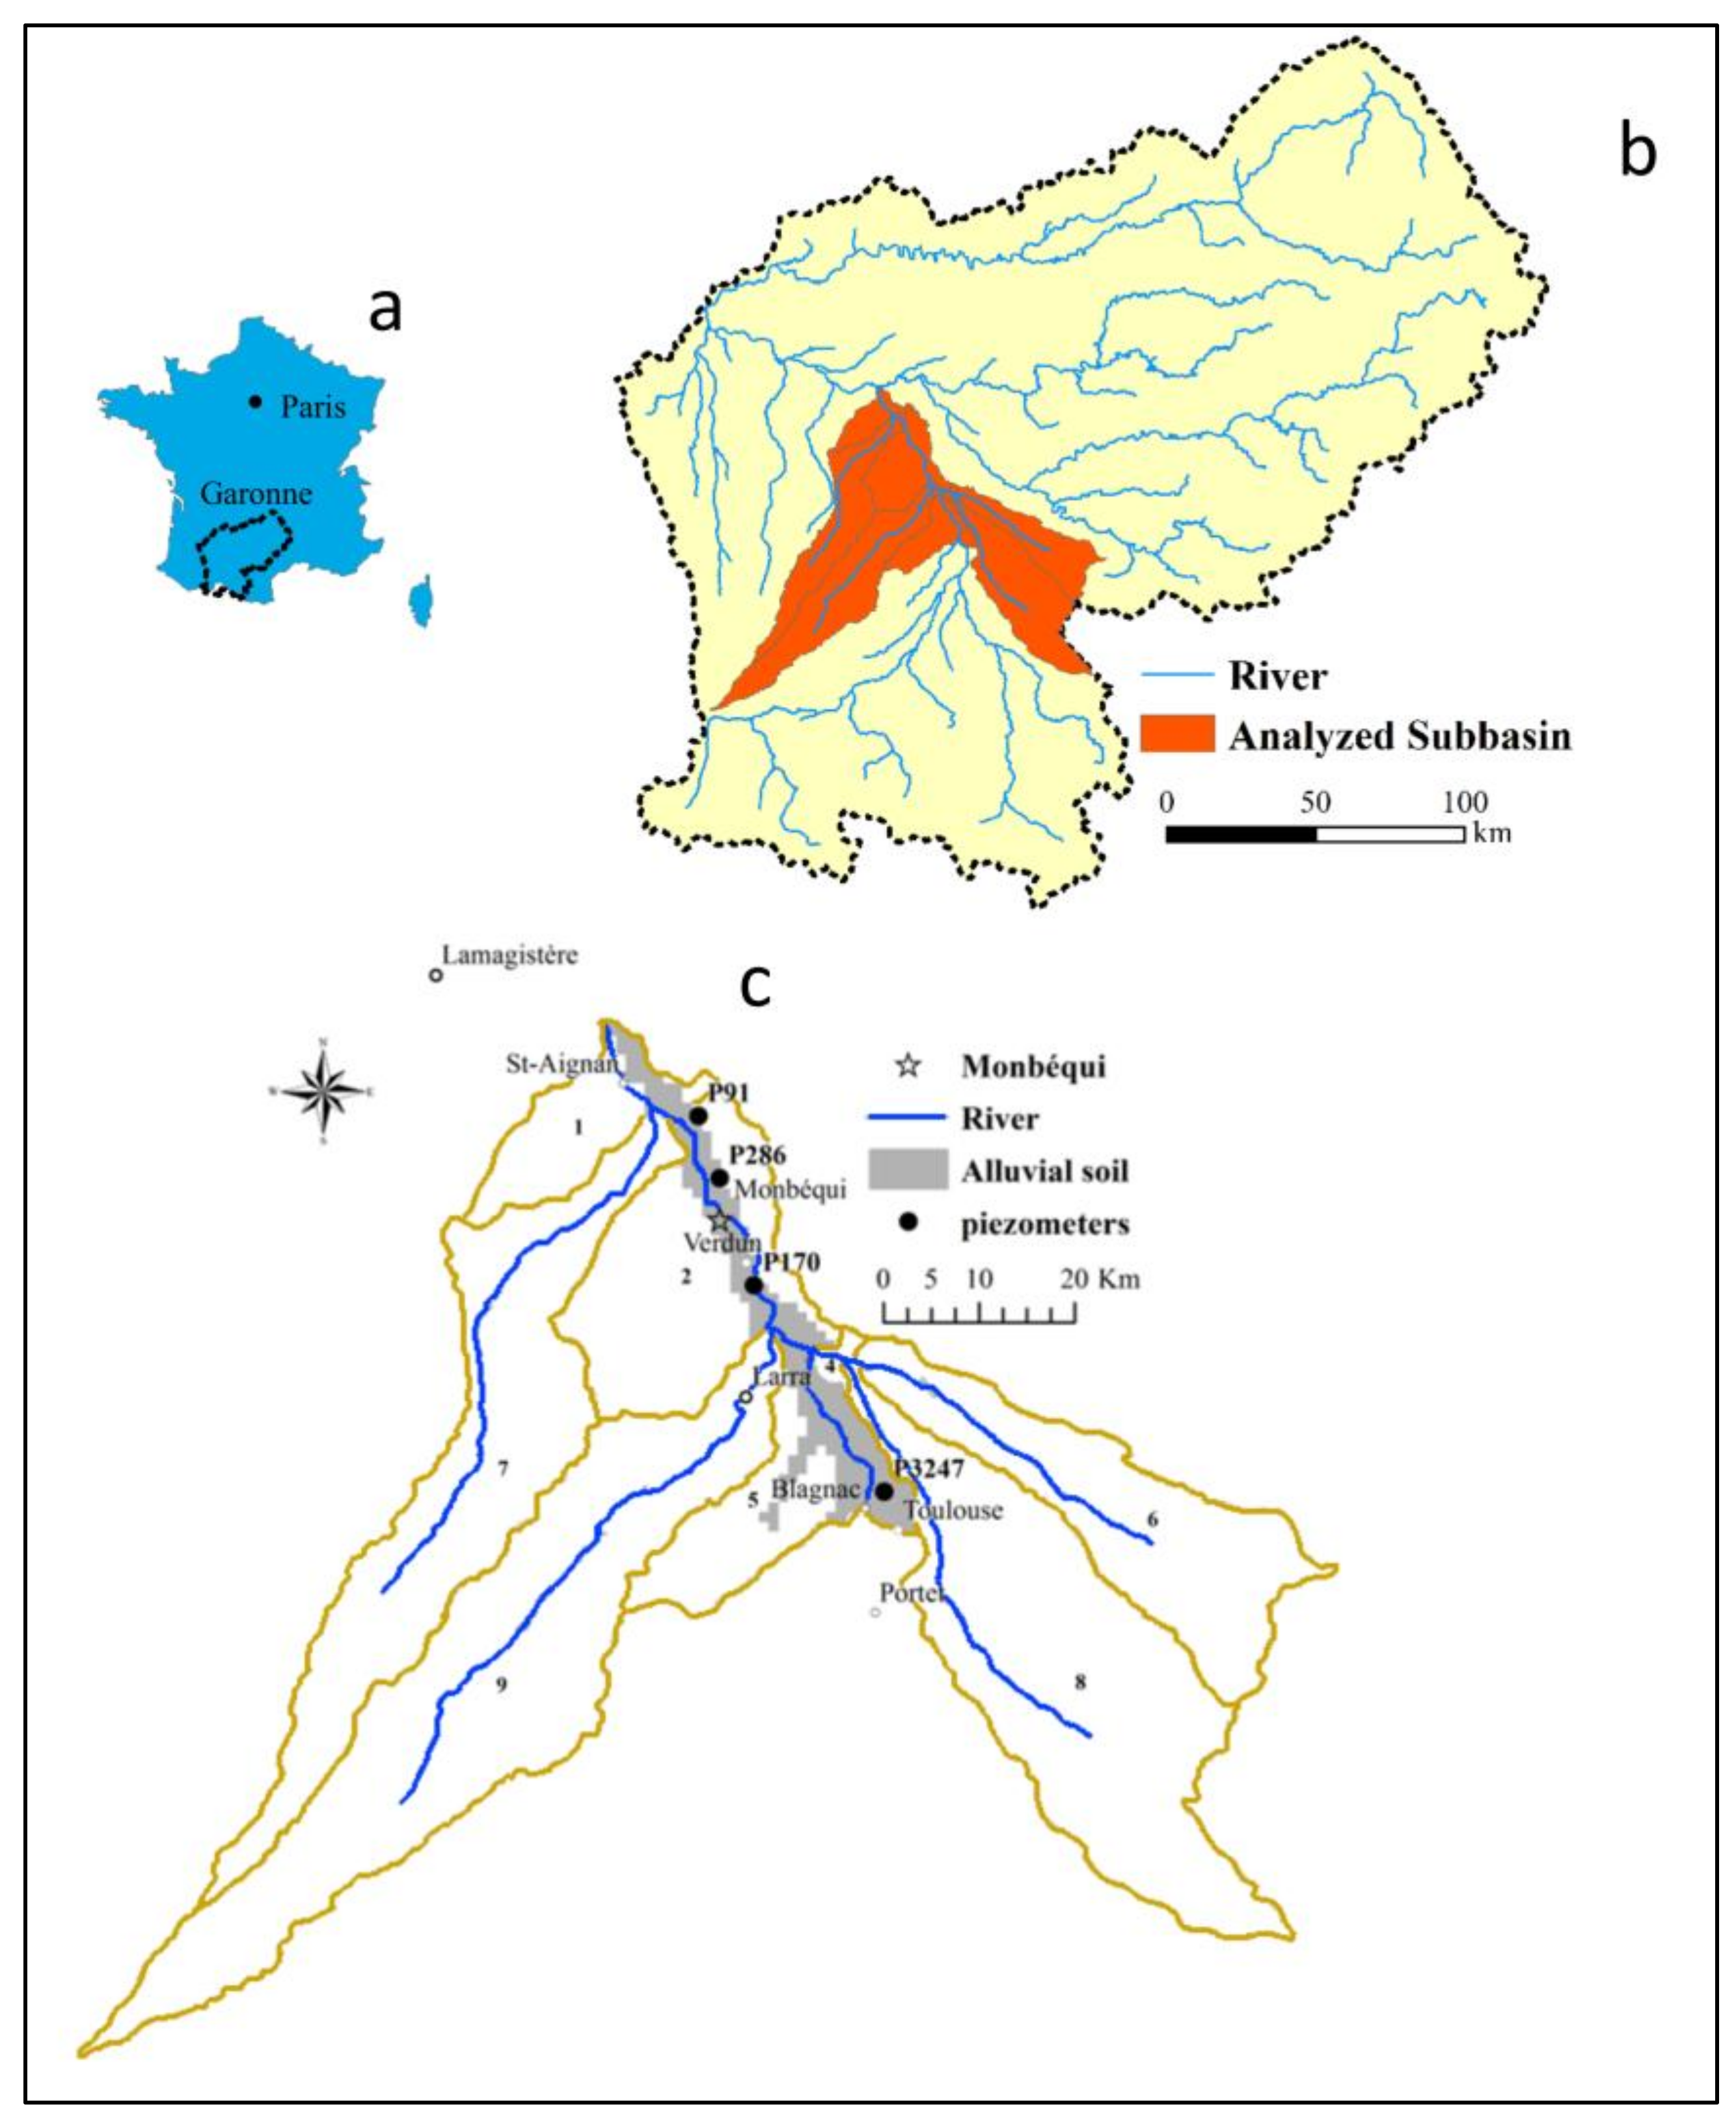
2.3. Study Site
2.4. Definition and Parameters of Subbasin-LUs and LUs
2.5. Calibration and Evaluation
3. Results
3.1. Calibrated Parameters
3.2. Surface Water–Groundwater Exchange
3.2.1. Groundwater Level
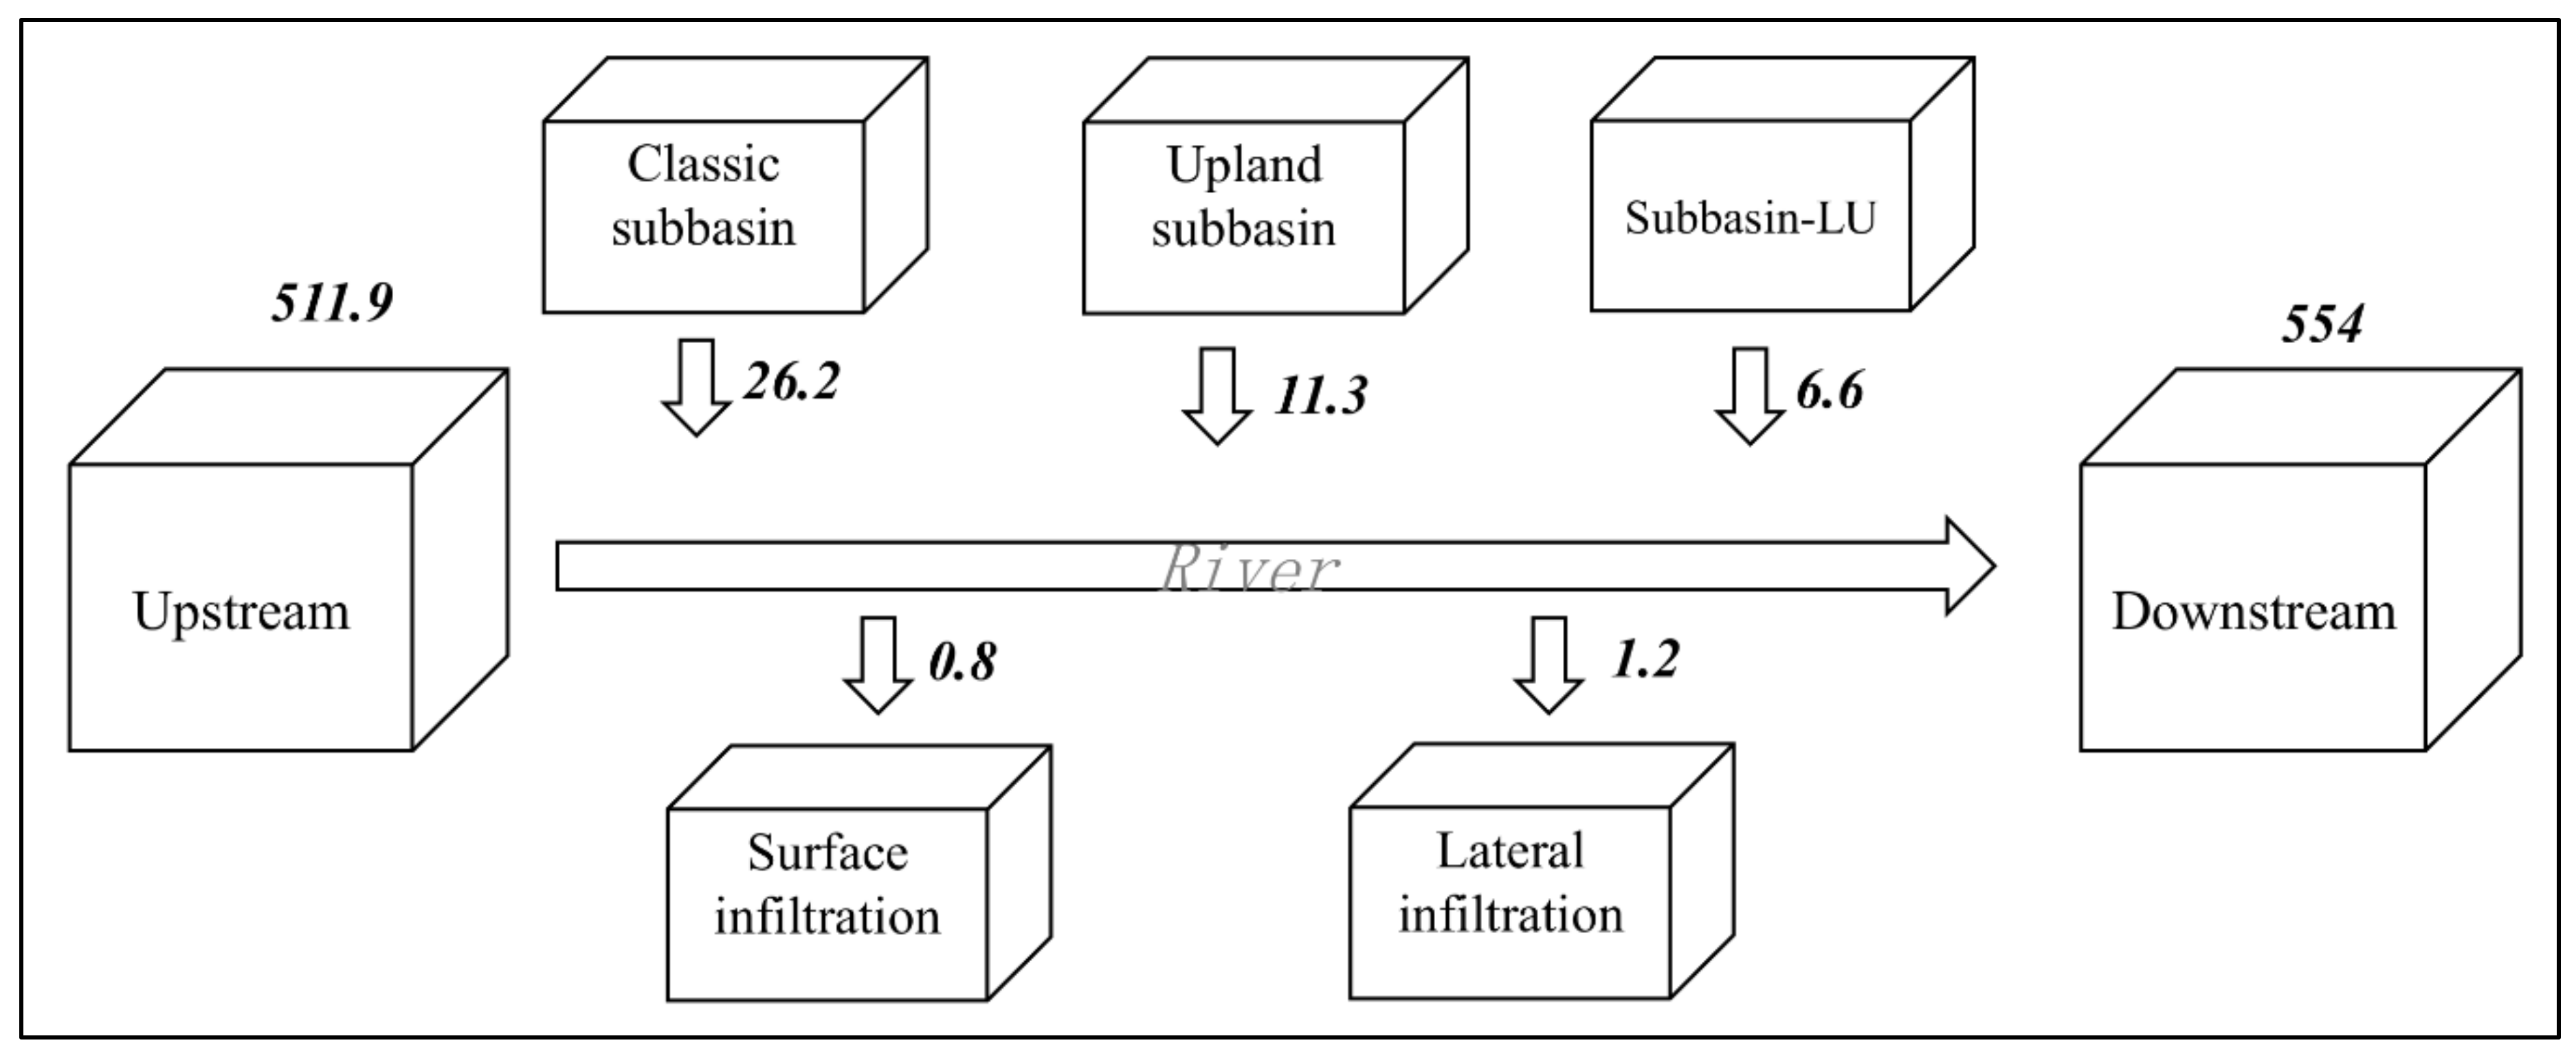
3.2.2. Water Balance in the Study Area
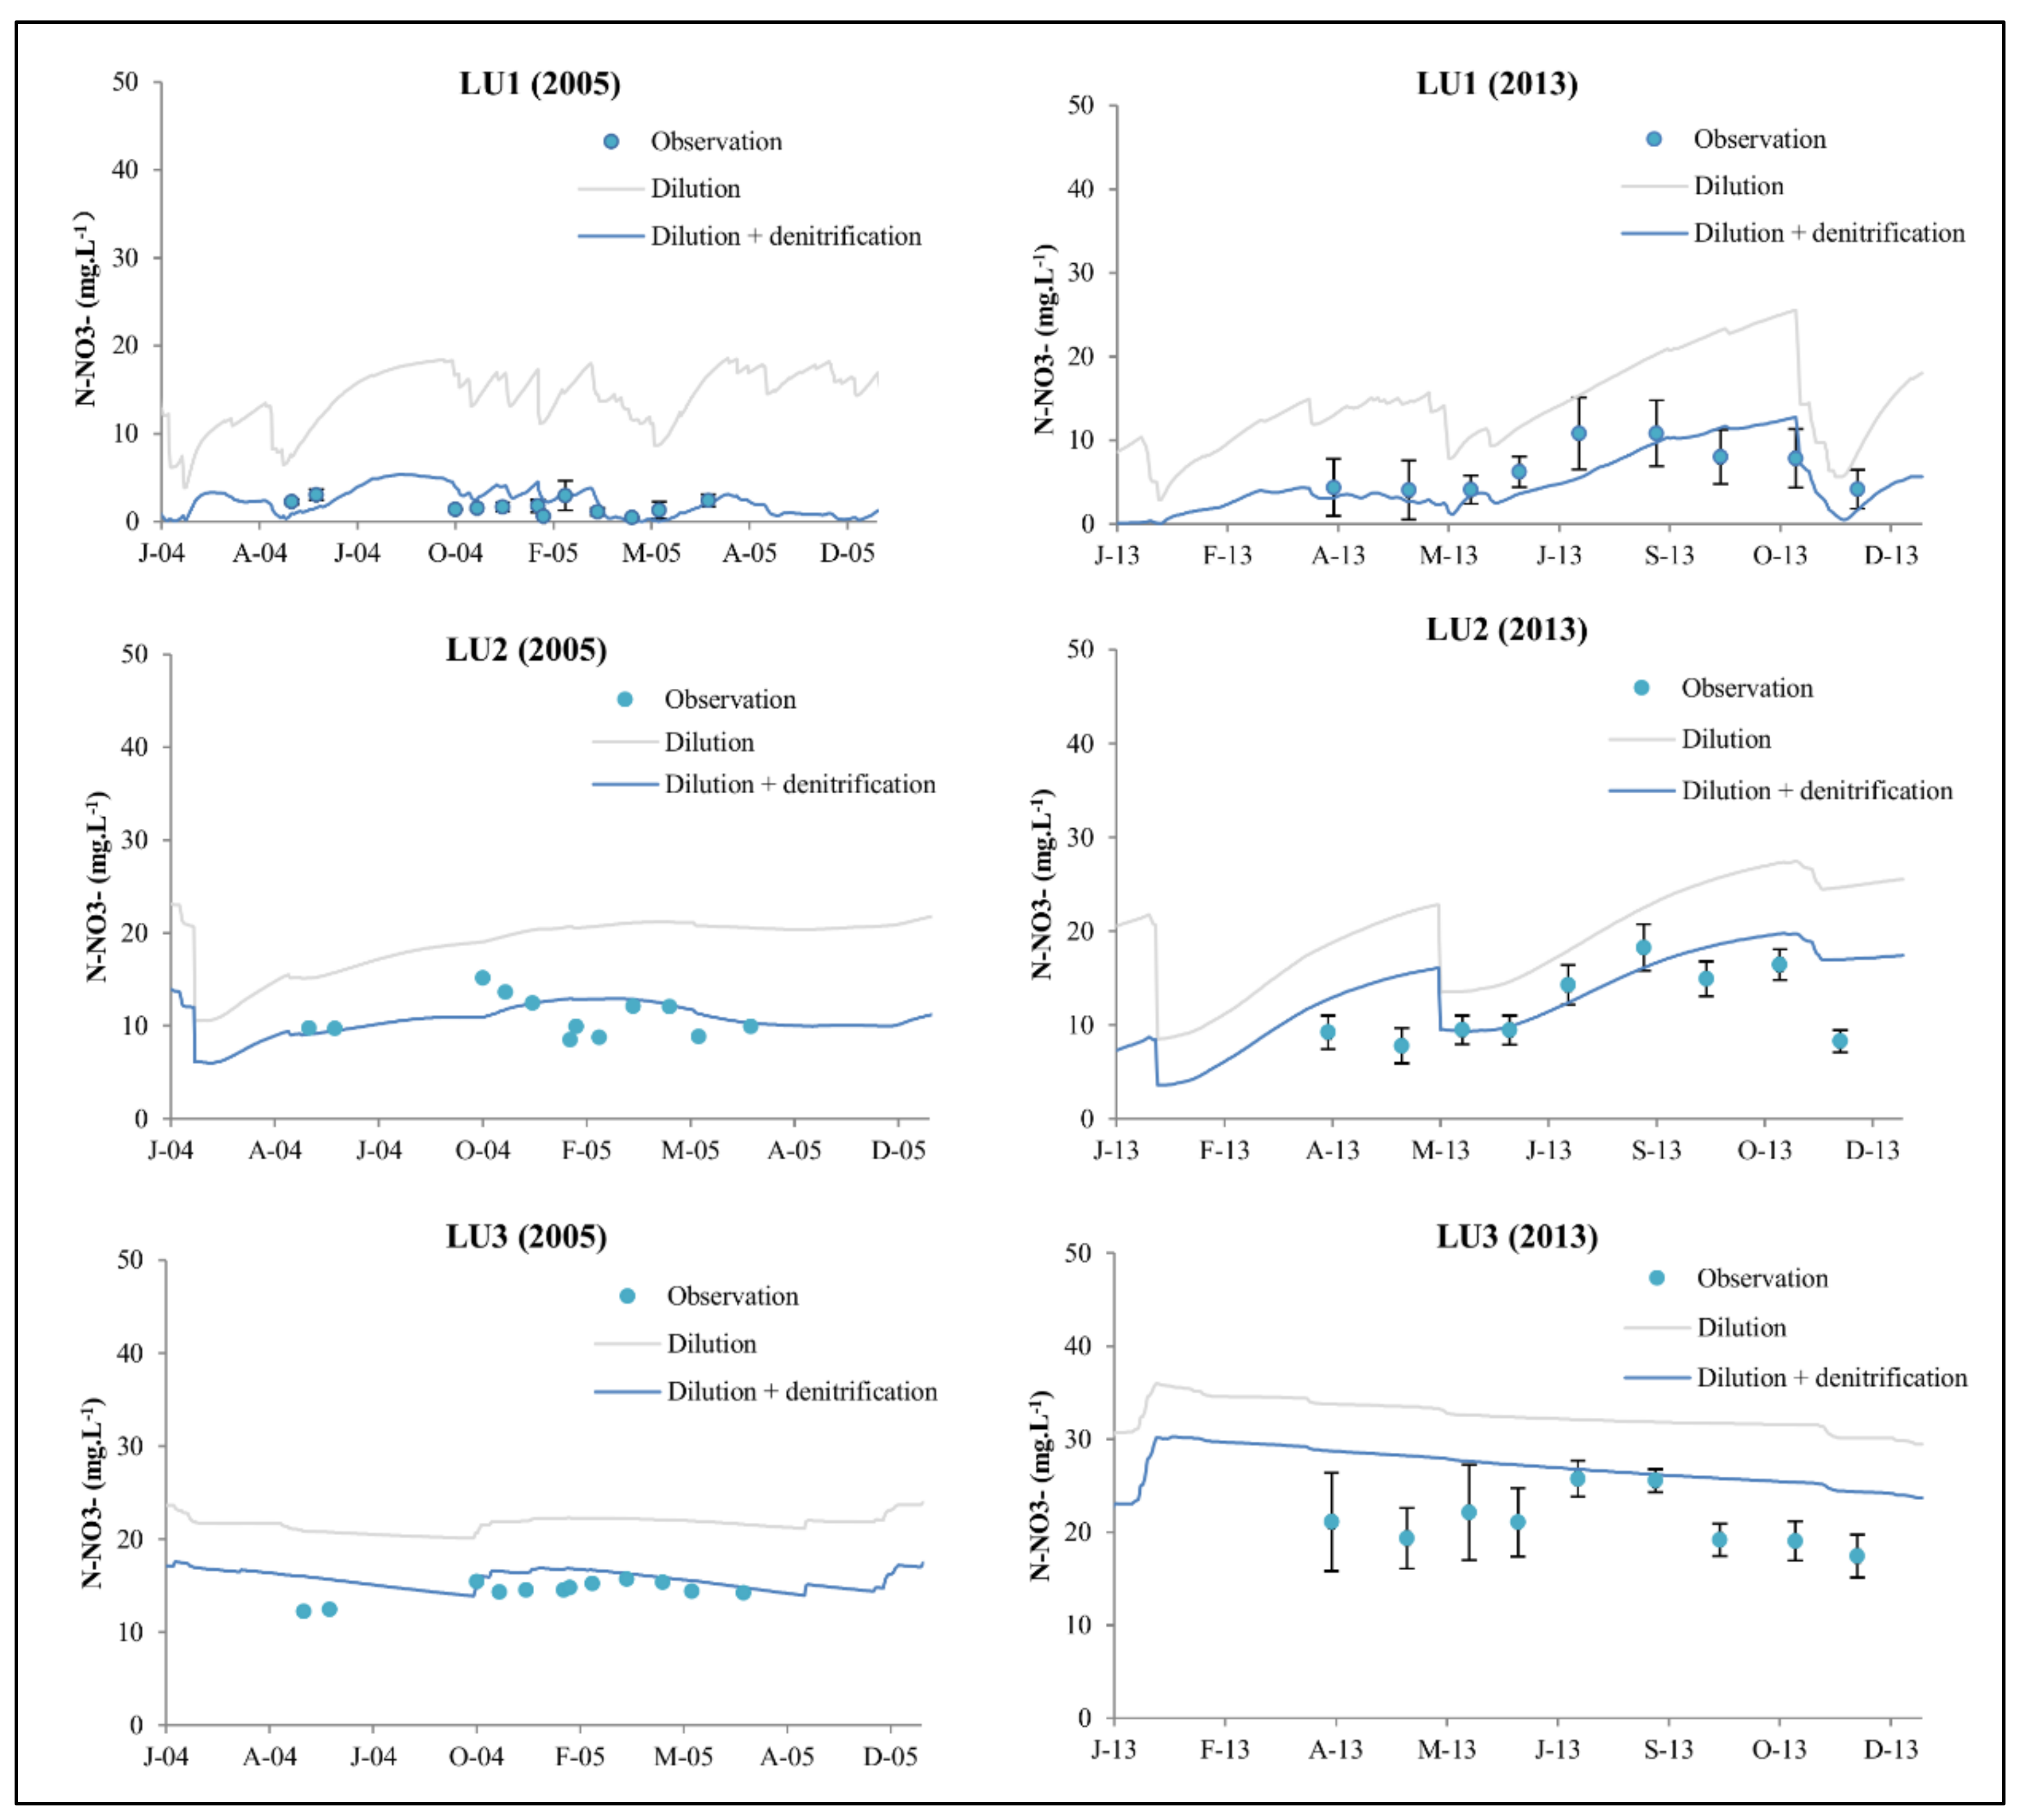
3.3. Nitrate Concentration in the Shallow Aquifer
3.4. Nitrate Balance
4. Discussion
4.1. SWAT-LUD Model
4.2. Surface Water and Groundwater Exchange
4.3. Nitrate Flux and the Influence of Denitrification
5. Conclusions
Acknowledgments
Author Contributions
Conflicts of Interest
References
- Cey, E.E.; Rudolph, D.L.; Aravena, R.; Parkin, G. Role of the riparian zone in controlling the distribution and fate of agricultural nitrogen near a small stream in southern Ontario. J. Contam. Hydrol. 1999, 37, 45–67. [Google Scholar] [CrossRef]
- Huan, H.; Wang, J.; Zhai, Y.; Xi, B.; Li, J.; Li, M. Quantitative evaluation of specific vulnerability to nitrate for groundwater resource protection based on process-based simulation model. Sci. Total Environ. 2016, 550, 768–784. [Google Scholar] [CrossRef] [PubMed]
- Hug, P.D.; Castella, E.; Slaveykova, V.I. Lateral and longitudinal patterns of water physico-chemistry and trace metal distribution and partitioning in a large river floodplain. Sci. Total Environ. 2017, 587–588, 248–257. [Google Scholar]
- Gregory, S.V.; Swanson, F.J.; McKee, W.A.; Cummins, K.W. An Ecosystem Perspective of Riparian Zones. BioScience 1991, 41, 540–551. [Google Scholar] [CrossRef]
- Hill, A.R. Nitrate Removal in Stream Riparian Zones. J. Environ. Qual. 1996, 25, 743. [Google Scholar] [CrossRef]
- Martin, T.L.; Kaushik, N.K.; Trevors, J.T.; Whiteley, H.R. Review: Denitrification in temperate climate riparian zones. Water Air Soil Pollut. 1999, 111, 171–186. [Google Scholar] [CrossRef]
- Maítre, V.; Cosandey, A.-C.; Desagher, E.; Parriaux, A. Effectiveness of groundwater nitrate removal in a river Riparian area: The importance of hydrogeological conditions. J. Hydrol. 2003, 278, 76–93. [Google Scholar] [CrossRef]
- Rassam, D.W.; Pagendam, D.E.; Hunter, H.M. Conceptualisation and application of models for groundwater—Surface water interactions and nitrate attenuation potential in Riparian zones. Environ. Model. Softw. 2008, 23, 859–875. [Google Scholar] [CrossRef]
- Vidon, P.; Hill, A.R. Denitrification and patterns of electron donors and acceptors in eight riparian zones with contrasting hydrogeology. Biogeochemistry 2005, 71, 259–283. [Google Scholar] [CrossRef]
- Iribar, A. Composition des Communautés Bactériennes Dénitrifiantes au Sein d’un Aquifère Alluvial et Facteurs Contrôlant Leur Structuration: Relation Entre Structure des Communautés et Dénitrification. Ph.D. Thesis, Université Toulouse III—Paul Sabatier, Toulouse, France, 2007. [Google Scholar]
- Sánchez-Pérez, J.M.; Vervier, P.; Garabétian, F.; Sauvage, S.; Loubet, M.; Rols, J.L.; Bariac, T.; Weng, P. Nitrogen dynamics in the shallow groundwater of a riparian wetland zone of the Garonne, SW France: Nitrate inputs, bacterial densities, organic matter supply and denitrification measurements. Hydrol. Earth Syst. Sci. Discuss. 2003, 7, 97–107. [Google Scholar] [CrossRef]
- Gold, A.J.; Groffman, P.M.; Addy, K.; Kellogg, D.Q.; Stolt, M.; Rosenblatt, A.E. Landscape Attributes as Controls on Groithd Water Nitrate Removal Capacity of Riparian Zones. J. Am. Water Resour. Assoc. 2001, 37, 1457–1464. [Google Scholar] [CrossRef]
- Sophocleous, M. Interactions between groundwater and surface water: The state of the science. Hydrogeol. J. 2002, 10, 52–67. [Google Scholar] [CrossRef]
- Heinen, M. Simplified denitrification models: Overview and properties. Geoderma 2006, 133, 444–463. [Google Scholar] [CrossRef]
- Sun, X.; Bernard-Jannin, L.; Garneau, C.; Volk, M.; Arnold, J.G.; Srinivasan, R.; Sauvage, S.; Sánchez-Pérez, J.M. Improved simulation of river water and groundwater exchange in an Alluvial plain using the SWAT model. Hydrol. Process. 2016, 30, 187–202. [Google Scholar] [CrossRef]
- Sun, X.; Bernard-Jannin, L.; Sauvage, S.; Garneau, C.; Arnold, J.G.; Srinivasan, R.; Sánchez-Pérez, J.M. Assessment of the denitrification process in alluvial wetlands at floodplain scale using the SWAT model. Ecol. Eng. 2017, 103, 344–358. [Google Scholar] [CrossRef]
- Arnold, J.G.; Srinivasan, R.; Muttiah, R.S.; Williams, J.R. Large Area Hydrologic Modeling and Assessment Part I: Model Development. J. Am. Water Resour. Assoc. 1998, 34, 73–89. [Google Scholar] [CrossRef]
- Lam, Q.D.; Schmalz, B.; Fohrer, N. Modelling point and diffuse source pollution of nitrate in a rural lowland catchment using the SWAT model. Agric. Water Manag. 2010, 97, 317–325. [Google Scholar] [CrossRef]
- Bosch, D.D.; Arnold, J.G.; Volk, M.; Allen, P.M.; Douglasmankin, K.R.; Srinivasan, R.; Arnold, J.G. Simulation of a low-gradient coastal plain watershed using the SWAT landscape model. Trans. ASABE 2010, 53, 1445–1456. [Google Scholar] [CrossRef]
- Caballero, Y.; Voirin-Morel, S.; Habets, F.; Noilhan, J.; LeMoigne, P.; Lehenaff, A.; Boone, A. Hydrological sensitivity of the Adour-Garonne river basin to climate change. Water Resour. Res. 2007, 43, W07448. [Google Scholar] [CrossRef]
- Lancaster, R.R. Fluvial Evolution of the Garonne River, France: Integrating Field Data with Numerical Simulations. Master’s Thesis, Louisiana State University, Baton Rouge, LA, USA, 2005. [Google Scholar]
- Peyrard, D.; Sauvage, S.; Vervier, P.; Sanchez-Perez, J.M.; Quintard, M. A coupled vertically integrated model to describe lateral exchanges between surface and subsurface in large alluvial floodplains with a fully penetrating river. Hydrol. Process. 2008, 22, 4257–4273. [Google Scholar] [CrossRef]
- Pinay, G.; Ruffinoni, C.; Wondzell, S.; Gazelle, F. Change in Groundwater Nitrate Concentration in a Large River Floodplain: Denitrification, Uptake, or Mixing? J. N. Am. Benthol. Soc. 1998, 17, 179–189. [Google Scholar] [CrossRef]
- Jego, G. Influence Des Activités Agricoles sur la Pollution Nitrique des Eaux Souterraines. Analyse par Modélisation des Impacts des Systèmes de Grande Culture sur les Fuites de Nitrate dans les Plaines Alluviales. Ph.D. Thesis, Université Toulouse III—Paul Sabatier, Toulouse, France, 2008. [Google Scholar]
- Sánchez-Pérez, J.M.; Trémolières, M.; Carbiener, R. Une station d’épuration naturelle des phosphates et nitrates apportés par les eaux de débordement du Rhin: La forêt alluviale à frêne et orme. Comptes Rendus de L'Académie des Sciences 1991, 312, 395–402. [Google Scholar]
- Seltz, R. Analyse et Modélisation D’une Zone Humide Riveraine de la Garonne; L’Ecole de Physique du Globe de Strasbourg: Strasbourg, France, 2001. [Google Scholar]
- Weng, P.; Sánchez-Pérez, J.M.; Sauvage, S.; Vervier, P.; Giraud, F. Assessment of the quantitative and qualitative buffer function of an alluvial wetland: Hydrological modelling of a large floodplain (Garonne River, France). Hydrol. Process. 2003, 17, 2375–2392. [Google Scholar] [CrossRef]
- Boithias, L. Modélisation des Transferts de Pesticides à L’échelle des Bassins Versants en Période de Crue. Ph.D. Thesis, Université Toulouse III—Paul Sabatier, Toulouse, France, 2012. [Google Scholar]
- Boithias, L.; Srinivasan, R.; Sauvage, S.; Macary, F.; Sánchez-Pérez, J.M. Daily Nitrate Losses: Implication on Long-Term River Quality in an Intensive Agricultural Catchment of Southwestern France. J. Environ. Qual. 2014, 43, 46. [Google Scholar] [CrossRef] [PubMed]
- Arango, C.P.; Tank, J.L.; Schaller, J.L.; Royer, T.V.; Bernot, M.J.; David, M.B. Benthic organic carbon influences denitrification in streams with high nitrate concentration. Freshw. Biol. 2007, 52, 1210–1222. [Google Scholar] [CrossRef]
- Dalzell, B.J.; Filley, T.R.; Harbor, J.M. Flood pulse influences on terrestrial organic matter export from an agricultural watershed. J. Geophys. Res. Biogeosci. 2005, 110. [Google Scholar] [CrossRef]
- Duan, S.; Bianchi, T.S.; Sampere, T.P. Temporal variability in the composition and abundance of terrestrially-derived dissolved organic matter in the lower Mississippi and Pearl Rivers. Mar. Chem. 2007, 103, 172–184. [Google Scholar] [CrossRef]
- Griffiths, N.A.; Tank, J.L.; Royer, T.V.; Warrner, T.J.; Frauendorf, T.C.; Rosi-Marshall, E.J.; Whiles, M.R. Temporal variation in organic carbon spiraling in Midwestern agricultural streams. Biogeochemistry 2012, 108, 149–169. [Google Scholar] [CrossRef]
- Hauer, F.R.; Lamberti, G.A. Methods in Stream Ecology; Academic Press: Cambridge, MA, USA, 2011; ISBN 9780080547435. [Google Scholar]
- Wagner, R.; Marxsen, J.; Zwick, P.; Cox, E.J. Central European Stream Ecosystems: The Long Term Study of the Breitenbach; John Wiley & Sons: Hoboken, NJ, USA, 2011; ISBN 9783527634668. [Google Scholar]
- Arnold, J.G.; Moriasi, D.N.; Gassman, P.W.; Abbaspour, K.C.; White, M.J.; Srinivasan, R.; Santhi, C.; Harmel, R.D.; Griensven, A.V.; Liew, M.W.V. SWAT: Model use, calibration, and validation. Trans. ASABE 2012, 55, 1345–1352. [Google Scholar] [CrossRef]
- Yang, J.; Reichert, P.; Abbaspour, K.C.; Xia, J.; Yang, H. Comparing uncertainty analysis techniques for a SWAT application to the Chaohe Basin in China. J. Hydrol. 2008, 358, 1–23. [Google Scholar] [CrossRef]
- Abbaspour, K.C. SWAT-CUP 2012: SWAT Calibration and Uncertainty Programs—A User Manual. Sci. Technol. 2014. [Google Scholar] [CrossRef]
- Grusson, Y.; Anctil, F.; Sauvage, S.; Pérez, J.M.S. Assessing the Climatic and Temporal Transposability of the SWAT Model across a Large Contrasted Watershed. J. Hydrol. Eng. 2017, 22, 04017004. [Google Scholar] [CrossRef]
- Derx, J.; Blaschke, A.P.; Blöschl, G. Three-dimensional flow patterns at the river-aquifer interface—A case study at the Danube. Adv. Water Resour. 2010, 33, 1375–1387. [Google Scholar] [CrossRef]
- Nützmann, G.; Levers, C.; Lewandowski, J. Coupled groundwater flow and heat transport simulation for estimating transient aquifer–stream exchange at the lowland River Spree (Germany). Hydrol. Process. 2014, 28, 4078–4090. [Google Scholar] [CrossRef]
- Harvey, J.; Gooseff, M. River corridor science: Hydrologic exchange and ecological consequences from bedforms to basins. Water Resour. Res. 2015, 51, 6893–6922. [Google Scholar] [CrossRef]
- Kiel, B.A.; Bayani Cardenas, M. Lateral hyporheic exchange throughout the Mississippi River network. Nat. Geosci. 2014, 7, 413–417. [Google Scholar] [CrossRef]
- Nadeau, T.-L.; Rains, M.C. Hydrological Connectivity Between Headwater Streams and Downstream Waters: How Science Can Inform Policy. J. Am. Water Resour. Assoc. 2007, 43, 118–133. [Google Scholar] [CrossRef]
- Krause, S.; Bronstert, A. The impact of groundwater–surface water interactions on the water balance of a mesoscale lowland river catchment in northeastern Germany. Hydrol. Process. 2007, 21, 169–184. [Google Scholar] [CrossRef]
- Bernard-Jannin, L.; Brito, D.; Sun, X.; Jauch, E.; Neves, R.; Sauvage, S.; Sánchez-Pérez, J.-M. Spatially distributed modelling of surface water-groundwater exchanges during overbank flood events—A case study at the Garonne River. Adv. Water Resour. 2016, 94, 146–159. [Google Scholar] [CrossRef]
- Bernard-Jannin, L.; Sun, X.; Teissier, S.; Sauvage, S.; Sánchez-Pérez, J.-M. Spatio-temporal analysis of factors controlling nitrate dynamics and potential denitrification hot spots and hot moments in groundwater of an alluvial floodplain. Ecol. Eng. 2017, 103, 372–384. [Google Scholar] [CrossRef]
- Chen, J.; Tang, C.; Sakura, Y.; Yu, J.; Fukushima, Y. Nitrate pollution from agriculture in different hydrogeological zones of the regional groundwater flow system in the North China Plain. Hydrogeol. J. 2005, 13, 481–492. [Google Scholar] [CrossRef]
- Shamrukh, M.; Corapcioglu, M.Y.; Hassona, F.A.A. Modeling the Effect of Chemical Fertilizers on Ground Water Quality in the Nile Valley Aquifer, Egypt. Ground Water 2001, 39, 59–67. [Google Scholar] [CrossRef]
- Opperman, J.J.; Galloway, G.E.; Fargione, J.; Mount, J.F.; Richter, B.D.; Secchi, S. Sustainable floodplains through large-scale reconnection to rivers. Science 2009, 326, 1487–1488. [Google Scholar] [CrossRef] [PubMed]
- Bryantmason, A.; Junxu, Y.; Altabet, M.A. Limited capacity of river corridor wetlands to remove nitrate: A case study on the Atchafalaya River Basin during the 2011 Mississippi River Flooding. Water Resour. Res. 2013, 49, 283–290. [Google Scholar] [CrossRef]
- Woltemade, C.J. Ability of Restored Wetlands to Reduce Nitrogen and Phosphorus Concentrations in Agricultural Drainage Water. J. Soil Water Conserv. 2000, 55, 303–309. [Google Scholar]
- Hester, E.T.; Hammond, B.; Scott, D.T. Effects of inset floodplains and hyporheic exchange induced by in-stream structures on nitrate removal in a headwater stream. Ecol. Eng. 2016, 97, 452–464. [Google Scholar] [CrossRef]



| Subbasin-LU | Area (km2) | Channel | LUs | |||||||
|---|---|---|---|---|---|---|---|---|---|---|
| Long (km) | Width (m) | Altitude (masl) | Slope (m/m) | Porosity | Area (km2) | HRUs | ||||
| Land Use | Fraction of LU (%) | |||||||||
| SL1 | 57.27 | 22.11 | 200 | 132.3–106.5 | LU1 | 0.002 | 0.1 | 5.73 | PAST | 0.1 |
| FRSD | 0.9 | |||||||||
| LU2 | 0.005 | 0.1 | 11.45 | PAST | 1.0 | |||||
| LU3 | 0.005 | 0.1 | 40.09 | PAST | 0.36 | |||||
| AGRR | 0.64 | |||||||||
| SL2 | 87.95 | 40.53 | 200 | 106.5–76.3 | LU1 | 0.002 | 0.1 | 8.79 | FRSD | 1.0 |
| LU2 | 0.005 | 0.1 | 17.59 | PAST | 0.5 | |||||
| FRSD | 0.35 | |||||||||
| AGRR | 0.15 | |||||||||
| LU3 | 0.005 | 0.1 | 61.56 | AGRR | 1.0 | |||||
| SL3 | 22.26 | 13.04 | 200 | 76.3–65.3 | LU1 | 0.002 | 0.1 | 2.23 | PAST | 0.7 |
| FRSD | 0.3 | |||||||||
| LU2 | 0.005 | 0.1 | 4.45 | PAST | 1.0 | |||||
| LU3 | 0.005 | 0.1 | 15.58 | PAST | 0.1 | |||||
| AGRR | 0.9 | |||||||||
| Year | Month | Day | Operation | Crop | Management and Fertilizer Type | Quantity | Unit |
|---|---|---|---|---|---|---|---|
| 1 | 7 | 25 | Tillage | Generic Conservation Tillage | |||
| 1 | 10 | 1 | Tillage | Generic Conservation Tillage | |||
| 2 | 1 | 31 | Tillage | Harrow 10 Bar Tine 36 Ft | |||
| 2 | 4 | 1 | Plant | Corn | |||
| 2 | 4 | 1 | Fertilization | 18-46-00 | 300 | kg·ha−1 | |
| 2 | 6 | 7 | Fertilization | 46-00-00 | 870 | kg·ha−1 | |
| 2 | 7 | 1 | Irrigation | 30 | mm | ||
| 2 | 7 | 10 | Irrigation | 30 | mm | ||
| 2 | 7 | 20 | Irrigation | 30 | mm | ||
| 2 | 8 | 1 | Irrigation | 30 | mm | ||
| 2 | 8 | 20 | Irrigation | 30 | mm | ||
| 2 | 9 | 1 | Irrigation | 30 | mm | ||
| 2 | 9 | 10 | Irrigation | 30 | mm | ||
| 2 | 10 | 15 | Harvest and kill | ||||
| 2 | 11 | 1 | Plant | Wheat | |||
| 3 | 1 | 25 | Fertilization | 15-15-00 | 400 | kg·ha−1 | |
| 3 | 3 | 10 | Fertilization | 33-00-00 | 400 | kg·ha−1 | |
| 3 | 7 | 10 | Harvest and kill | ||||
| 3 | 9 | 8 | Tillage | Generic Fall Plowing Operation | |||
| 4 | 4 | 1 | Tillage | Harrow 10 Bar Tine 36 Ft | |||
| 4 | 4 | 15 | Plant | Sunflower | |||
| 4 | 4 | 15 | Fertilization | 15-15-00 | 600 | kg·ha−1 | |
| 4 | 8 | 25 | Harvest and kill | ||||
| 4 | 11 | 1 | Plant | Wheat | |||
| 5 | 1 | 25 | Fertilization | 15-15-00 | 400 | kg·ha−1 | |
| 5 | 3 | 10 | Fertilization | 33-00-00 | 400 | kg·ha−1 | |
| 5 | 7 | 10 | Harvest and kill |
| Location | Sample Site | DOC (mg·L−1) (Measured) | DOC (mg·L−1) (Model Input) | AFDM (%) (Measured) | POC (>50 cm) (%) (Model Input) | POC (Top 50 cm) (%) (Model Input) |
|---|---|---|---|---|---|---|
| LU1 | simulated | 0.55 ± 0.03 | 0.275 | 1.5 | ||
| LU2 | P11 | 0.92 ± 0.15 | 0.85 | 0.65 ± 0.08 | 0.275 | 1.0 |
| P22 | 0.83 ± 0.09 | 0.46 ± 0.07 | ||||
| LU3 | P26 | 0.66 ± 0.11 | 0.65 | 0.56 ± 0.07 | 0.325 | 1.0 |
| P30 | 0.65 ± 0.13 | 0.74 ± 0.04 | ||||
| River | R1 | 1.72 ± 0.15 | 1.7 | |||
| R2 | 1.69 ± 0.20 | |||||
| River (flooding) | R1 | 2.56 (n = 1) | 3 | |||
| R2 | 3.12 (n = 1) | |||||
| Parameters | Description | File | Type | Default Value | Verdun | Larra | Lamagistère |
|---|---|---|---|---|---|---|---|
| Subbasin Numbers | |||||||
| 5, 4, 6, 8 | 9 | 1, 2, 7 | |||||
| CN2 | SCS runoff curve number | .mgt | r | -- | −0.014 | −0.040 | −0.048 |
| ALPHA_BF | Baseflow recession constant (1/days) | .gw | v | 0.048 | 0.44 | 0.89 | 0.35 |
| GW_DELAY | Groundwater delay time (days) | .gw | a | 31 | −27.33 | 59.49 | −23.19 |
| GWQMN | Threshold depth of water in the shallow aquifer required for return flow to occur (mm H2O) | .gw | a | 1000 | −43.67 | −77.67 | 181.67 |
| ESCO | Soil evaporation compensation factor | .hru | v | 0.95 | 0.72 | 0.72 | 0.93 |
| GW_REVAP | Groundwater “revap” coefficient | .gw | v | 0.02 | 0.062 | 0.028 | 0.072 |
| RCHRG_DP | Deep aquifer percolation fraction | .gw | a | 0.05 | 0.033 | 0.013 | 0.0073 |
| CANMX | Maximum canopy storage (mm H2O) | .hru | v | 0 | 22.65 | 28.25 | 13.65 |
| CH_K1 | Effetive hydraulic conductivity in tributary channel alluvium (mm/h) | .sub | r | 0 | 3.63 | 7.25 | 36.77 |
| SHALLST | Initial depth of water in the shallow aquifer (mm H2O) | .gw | v | 1000 | 595 | -- | 958.33 |
| DEEPST | Initial depth of water in the deep aquifer (mm H2O) | .gw | v | 2000 | 3241.67 | -- | 1865.00 |
| GW_SPYLD | Specific yield of the shallow aquifer (m3/m3) | .gw | r | 0.003 | 0.17 | -- | -- |
| GWHT | Initial groundwater height (m) | .gw | r | 1 | 0.31 | 7.91 | -- |
| CH_W1 | Average width of tributary channels (m) | .sub | r | -- | -- | −0.02 | 0.045 |
| CH_N1 | Manning’s N value for the tributary channels | .sub | r | 0.014 | -- | −0.011 | -- |
| Parameters | Description | Unit | Calibrated Values | ||
|---|---|---|---|---|---|
| SL1 | SL2 | SL3 | |||
| CH_N | Manning n | -- | 0.07 | 0.06 | 0.06 |
| KLU1 | Hydraulic conductivity of LU1 | m/day | 100 | 100 | 100 |
| KLU2 | Hydraulic conductivity of LU2 | m/day | 50 | 50 | 50 |
| KLU3 | Hydraulic conductivity of LU2 | m/day | 50 | 50 | 50 |
| KNO3 | Half-saturation concentration of nitrate | µ mol·L−1 | 30 | 30 | 30 |
| kPOC1 | Kpoc of LU1 | day−1 | 0.5 × 10⁻⁵ | 0.5 × 10⁻⁵ | 0.5 × 10⁻⁵ |
| kPOC2 | Kpoc of LU2 | day−1 | 0.6 × 10⁻⁵ | 0.6 × 10⁻⁵ | 0.6 × 10⁻⁵ |
| kPOC3 | Kpoc of LU3 | day−1 | 0.8 × 10⁻⁵ | 0.8 × 10⁻⁵ | 0.8 × 10⁻⁵ |
| kDOC1 | Kdoc of LU1 | day−1 | 0.005 | 0.005 | 0.005 |
| kDOC2 | Kdoc of LU2 | day−1 | 0.002 | 0.002 | 0.002 |
| kDOC3 | Kdoc of LU3 | day−1 | 0.002 | 0.002 | 0.002 |
| FNO3 | Percentage of leached nitrate from soil profile during flooding | % | 30 | 30 | 30 |
| Denitrification Rate | LU1 | LU2 | LU3 |
|---|---|---|---|
| Total denitrification rate (ton·year−1) | 348.29 ± 7.47 | 82.50 ± 1.16 | 40.27 ± 0.57 |
| Total denitrification per area (ton·ha−1·year−1) | 0.21 | 0.025 | 0.0034 |
| Percentage of the total denitrification (%) | 74 | 18 | 8 |
© 2018 by the authors. Licensee MDPI, Basel, Switzerland. This article is an open access article distributed under the terms and conditions of the Creative Commons Attribution (CC BY) license (http://creativecommons.org/licenses/by/4.0/).
Share and Cite
Sun, X.; Bernard-Jannin, L.; Grusson, Y.; Sauvage, S.; Arnold, J.; Srinivasan, R.; Sánchez Pérez, J.M. Using SWAT-LUD Model to Estimate the Influence of Water Exchange and Shallow Aquifer Denitrification on Water and Nitrate Flux. Water 2018, 10, 528. https://doi.org/10.3390/w10040528
Sun X, Bernard-Jannin L, Grusson Y, Sauvage S, Arnold J, Srinivasan R, Sánchez Pérez JM. Using SWAT-LUD Model to Estimate the Influence of Water Exchange and Shallow Aquifer Denitrification on Water and Nitrate Flux. Water. 2018; 10(4):528. https://doi.org/10.3390/w10040528
Chicago/Turabian StyleSun, Xiaoling, Léonard Bernard-Jannin, Youen Grusson, Sabine Sauvage, Jeffrey Arnold, Raghavan Srinivasan, and José Miguel Sánchez Pérez. 2018. "Using SWAT-LUD Model to Estimate the Influence of Water Exchange and Shallow Aquifer Denitrification on Water and Nitrate Flux" Water 10, no. 4: 528. https://doi.org/10.3390/w10040528
APA StyleSun, X., Bernard-Jannin, L., Grusson, Y., Sauvage, S., Arnold, J., Srinivasan, R., & Sánchez Pérez, J. M. (2018). Using SWAT-LUD Model to Estimate the Influence of Water Exchange and Shallow Aquifer Denitrification on Water and Nitrate Flux. Water, 10(4), 528. https://doi.org/10.3390/w10040528


