Analysis of Hydrochemical Characteristics and Three-Dimensional Fluorescence Spectra in the Semi-Arid Ebinur Lake Watershed, Xinjiang, China
Abstract
1. Introduction
2. Materials and Methods
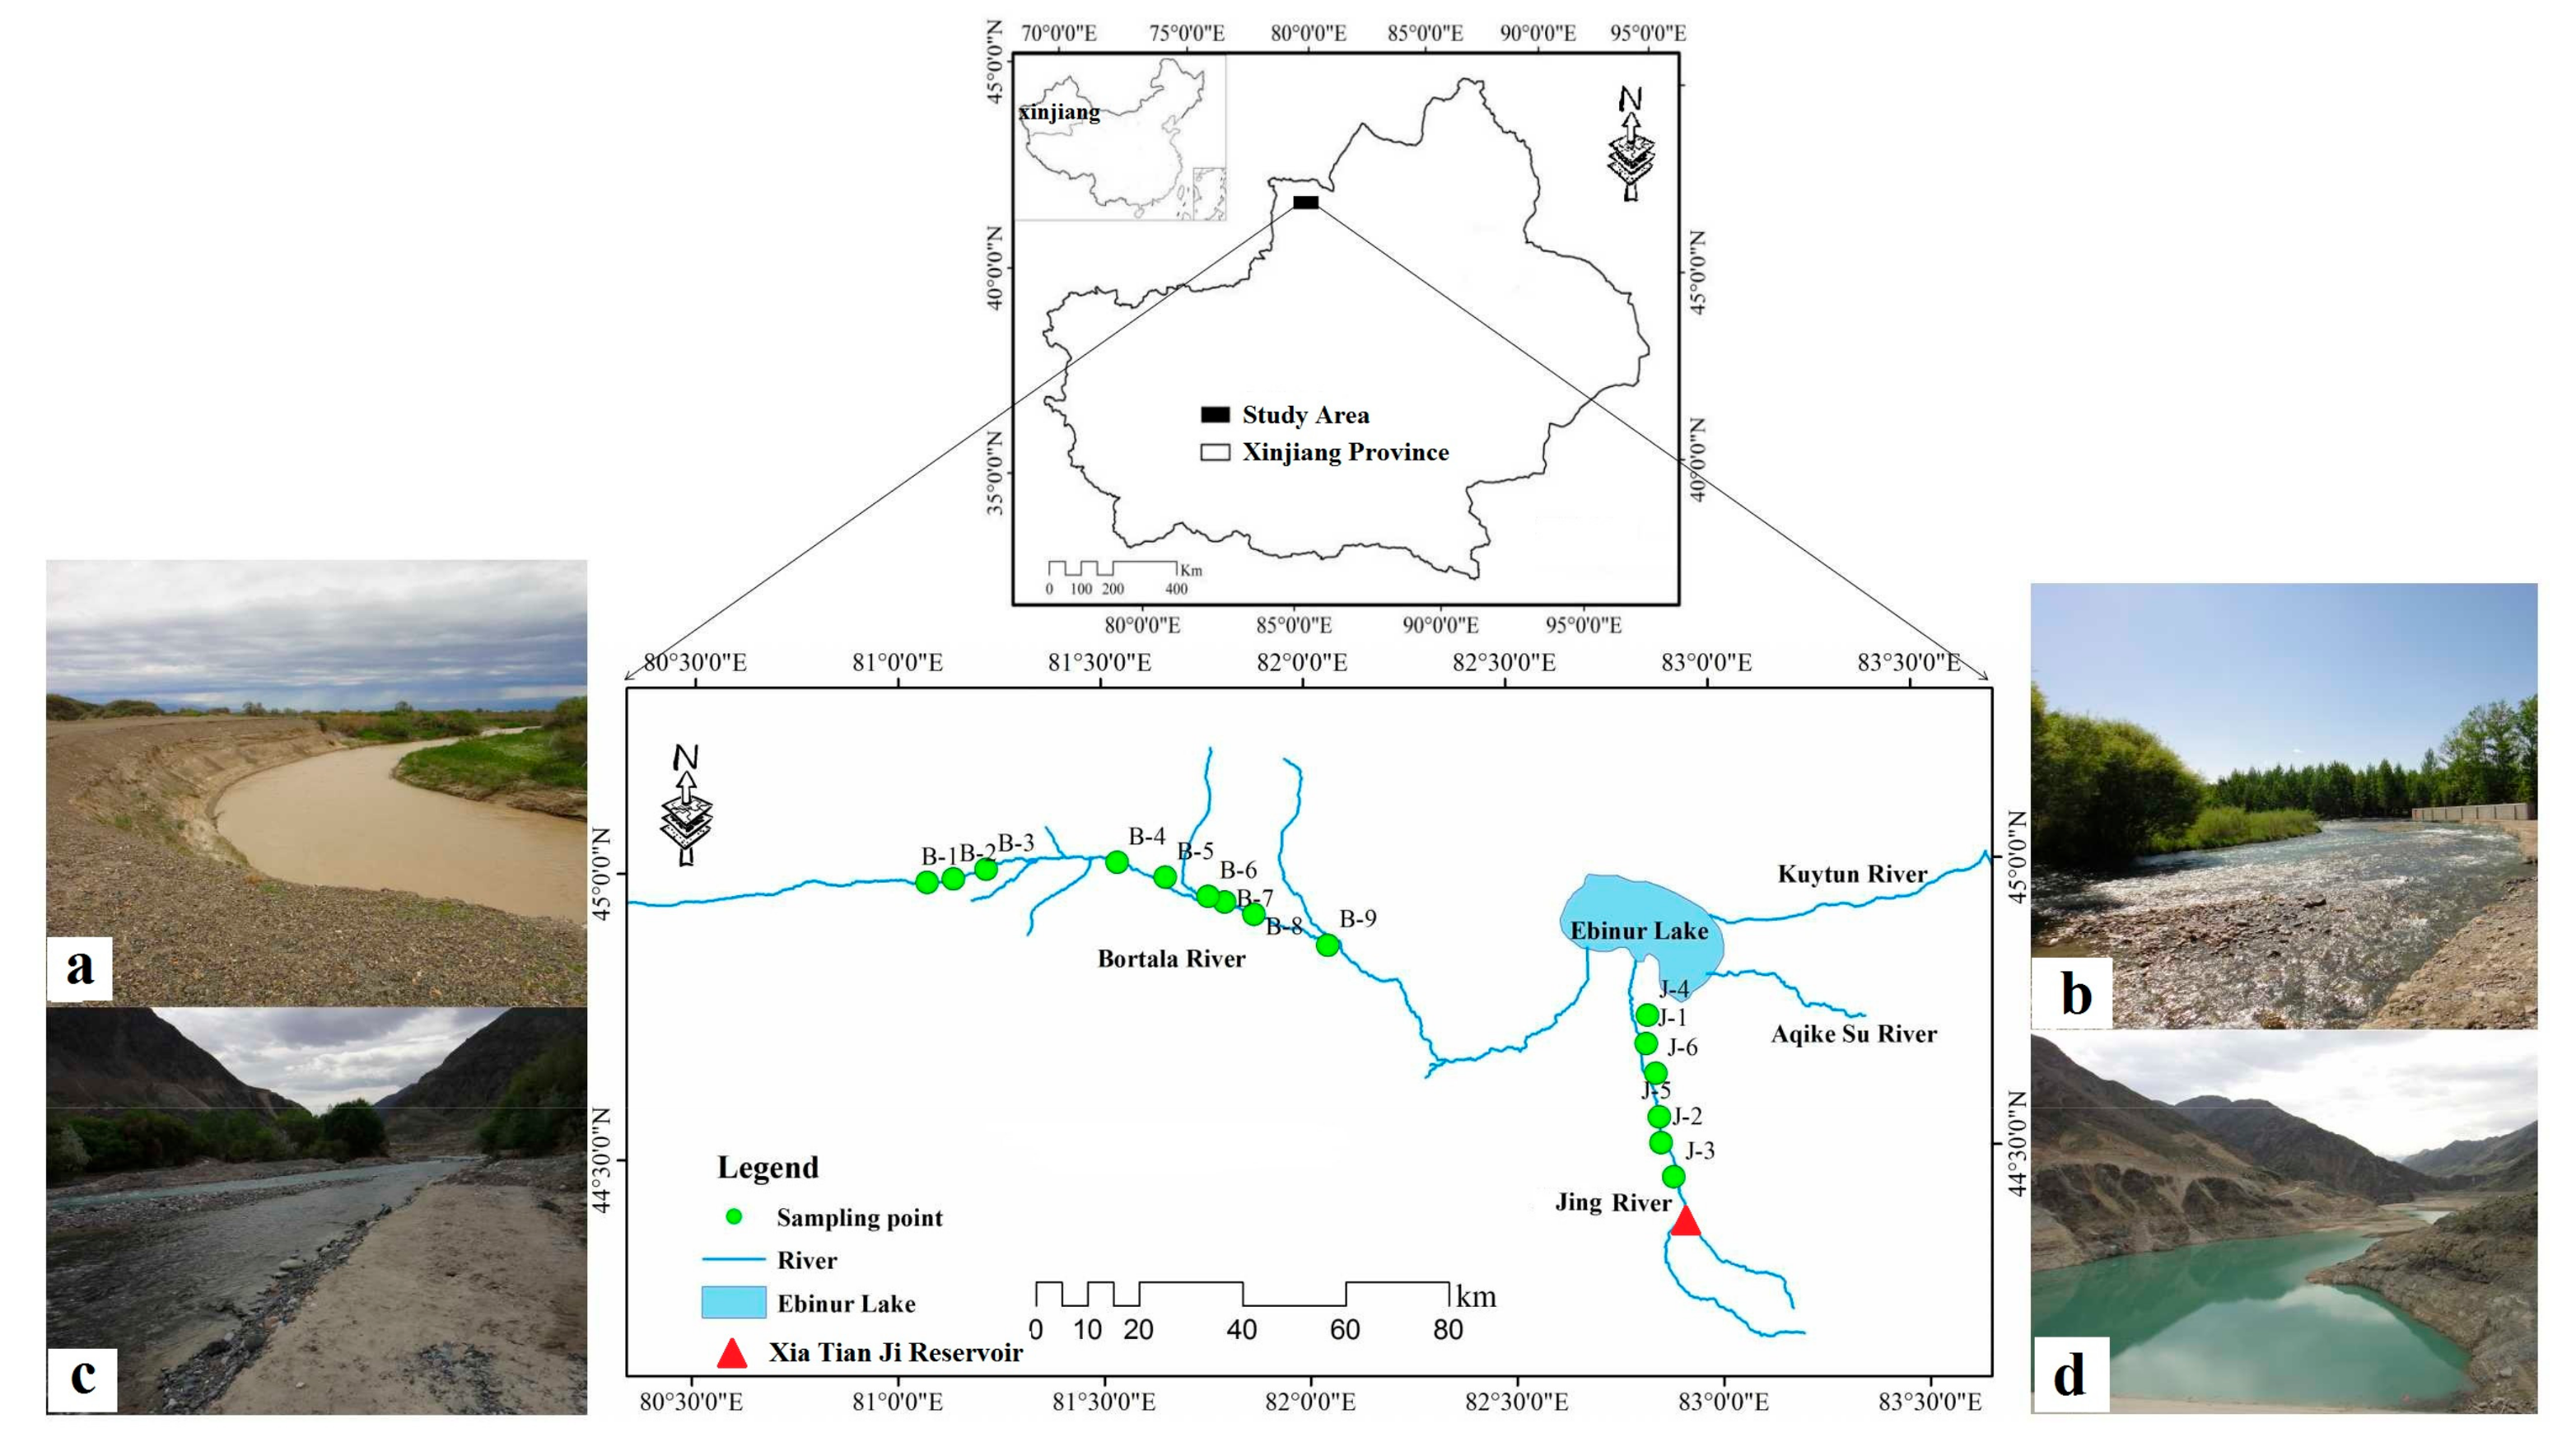
2.1. Description of the Study Area
2.2. Data Collection
2.3. Fluorescence Spectra
2.4. Analysis Methods
2.4.1. The Parallel Factor Method
2.4.2. The Fluorescence Regional Integration Method
2.5. Data Analysis and Processing
3. Results and Analysis
3.1. Hydrochemical Characteristic Analysis
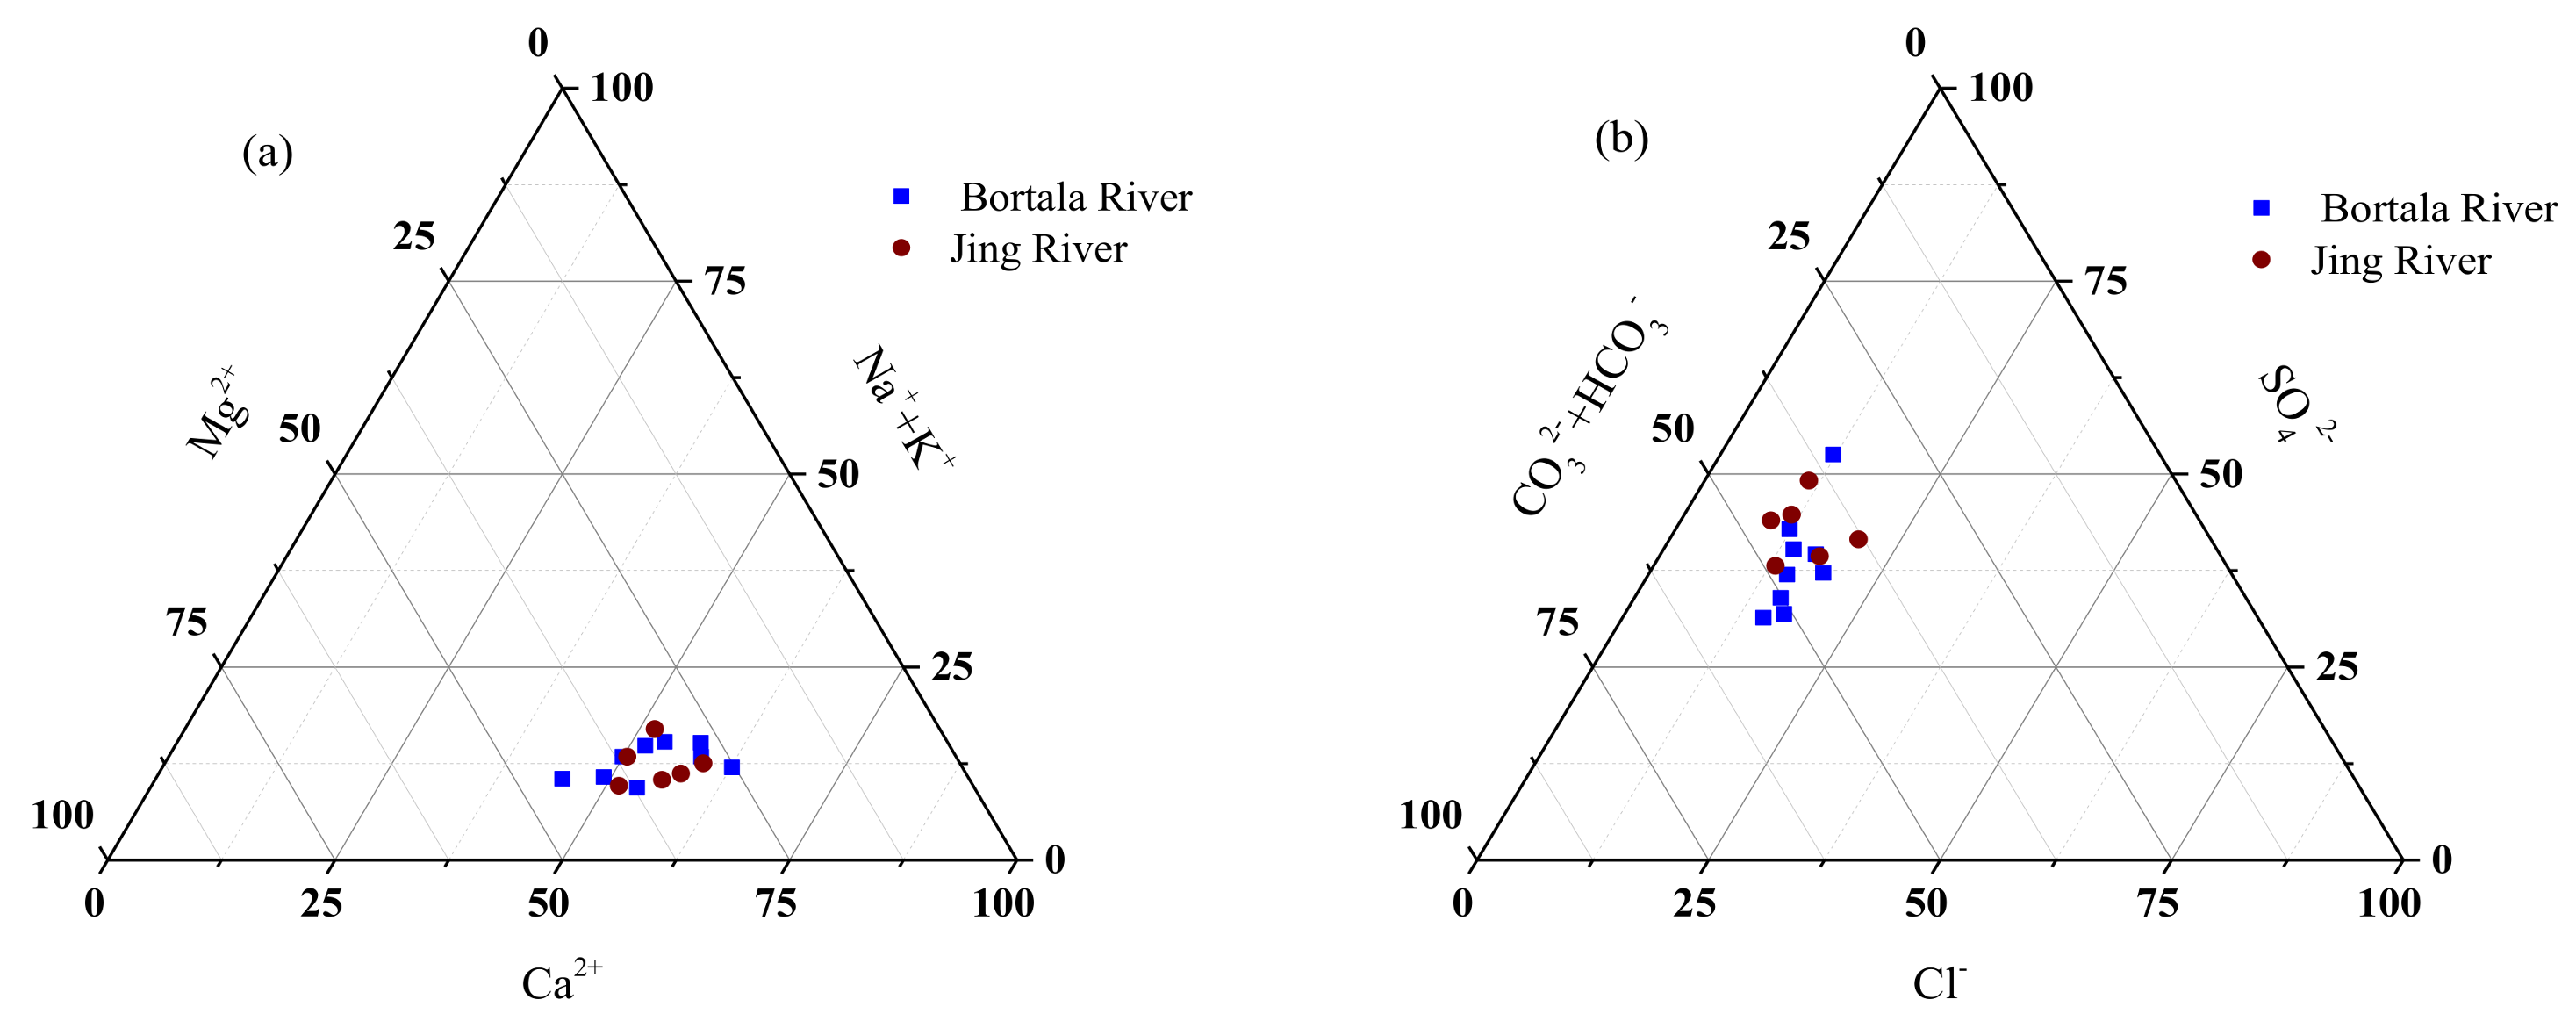
3.1.1. Analysis of Water Chemistry Characteristics and Ion Combination Ratios
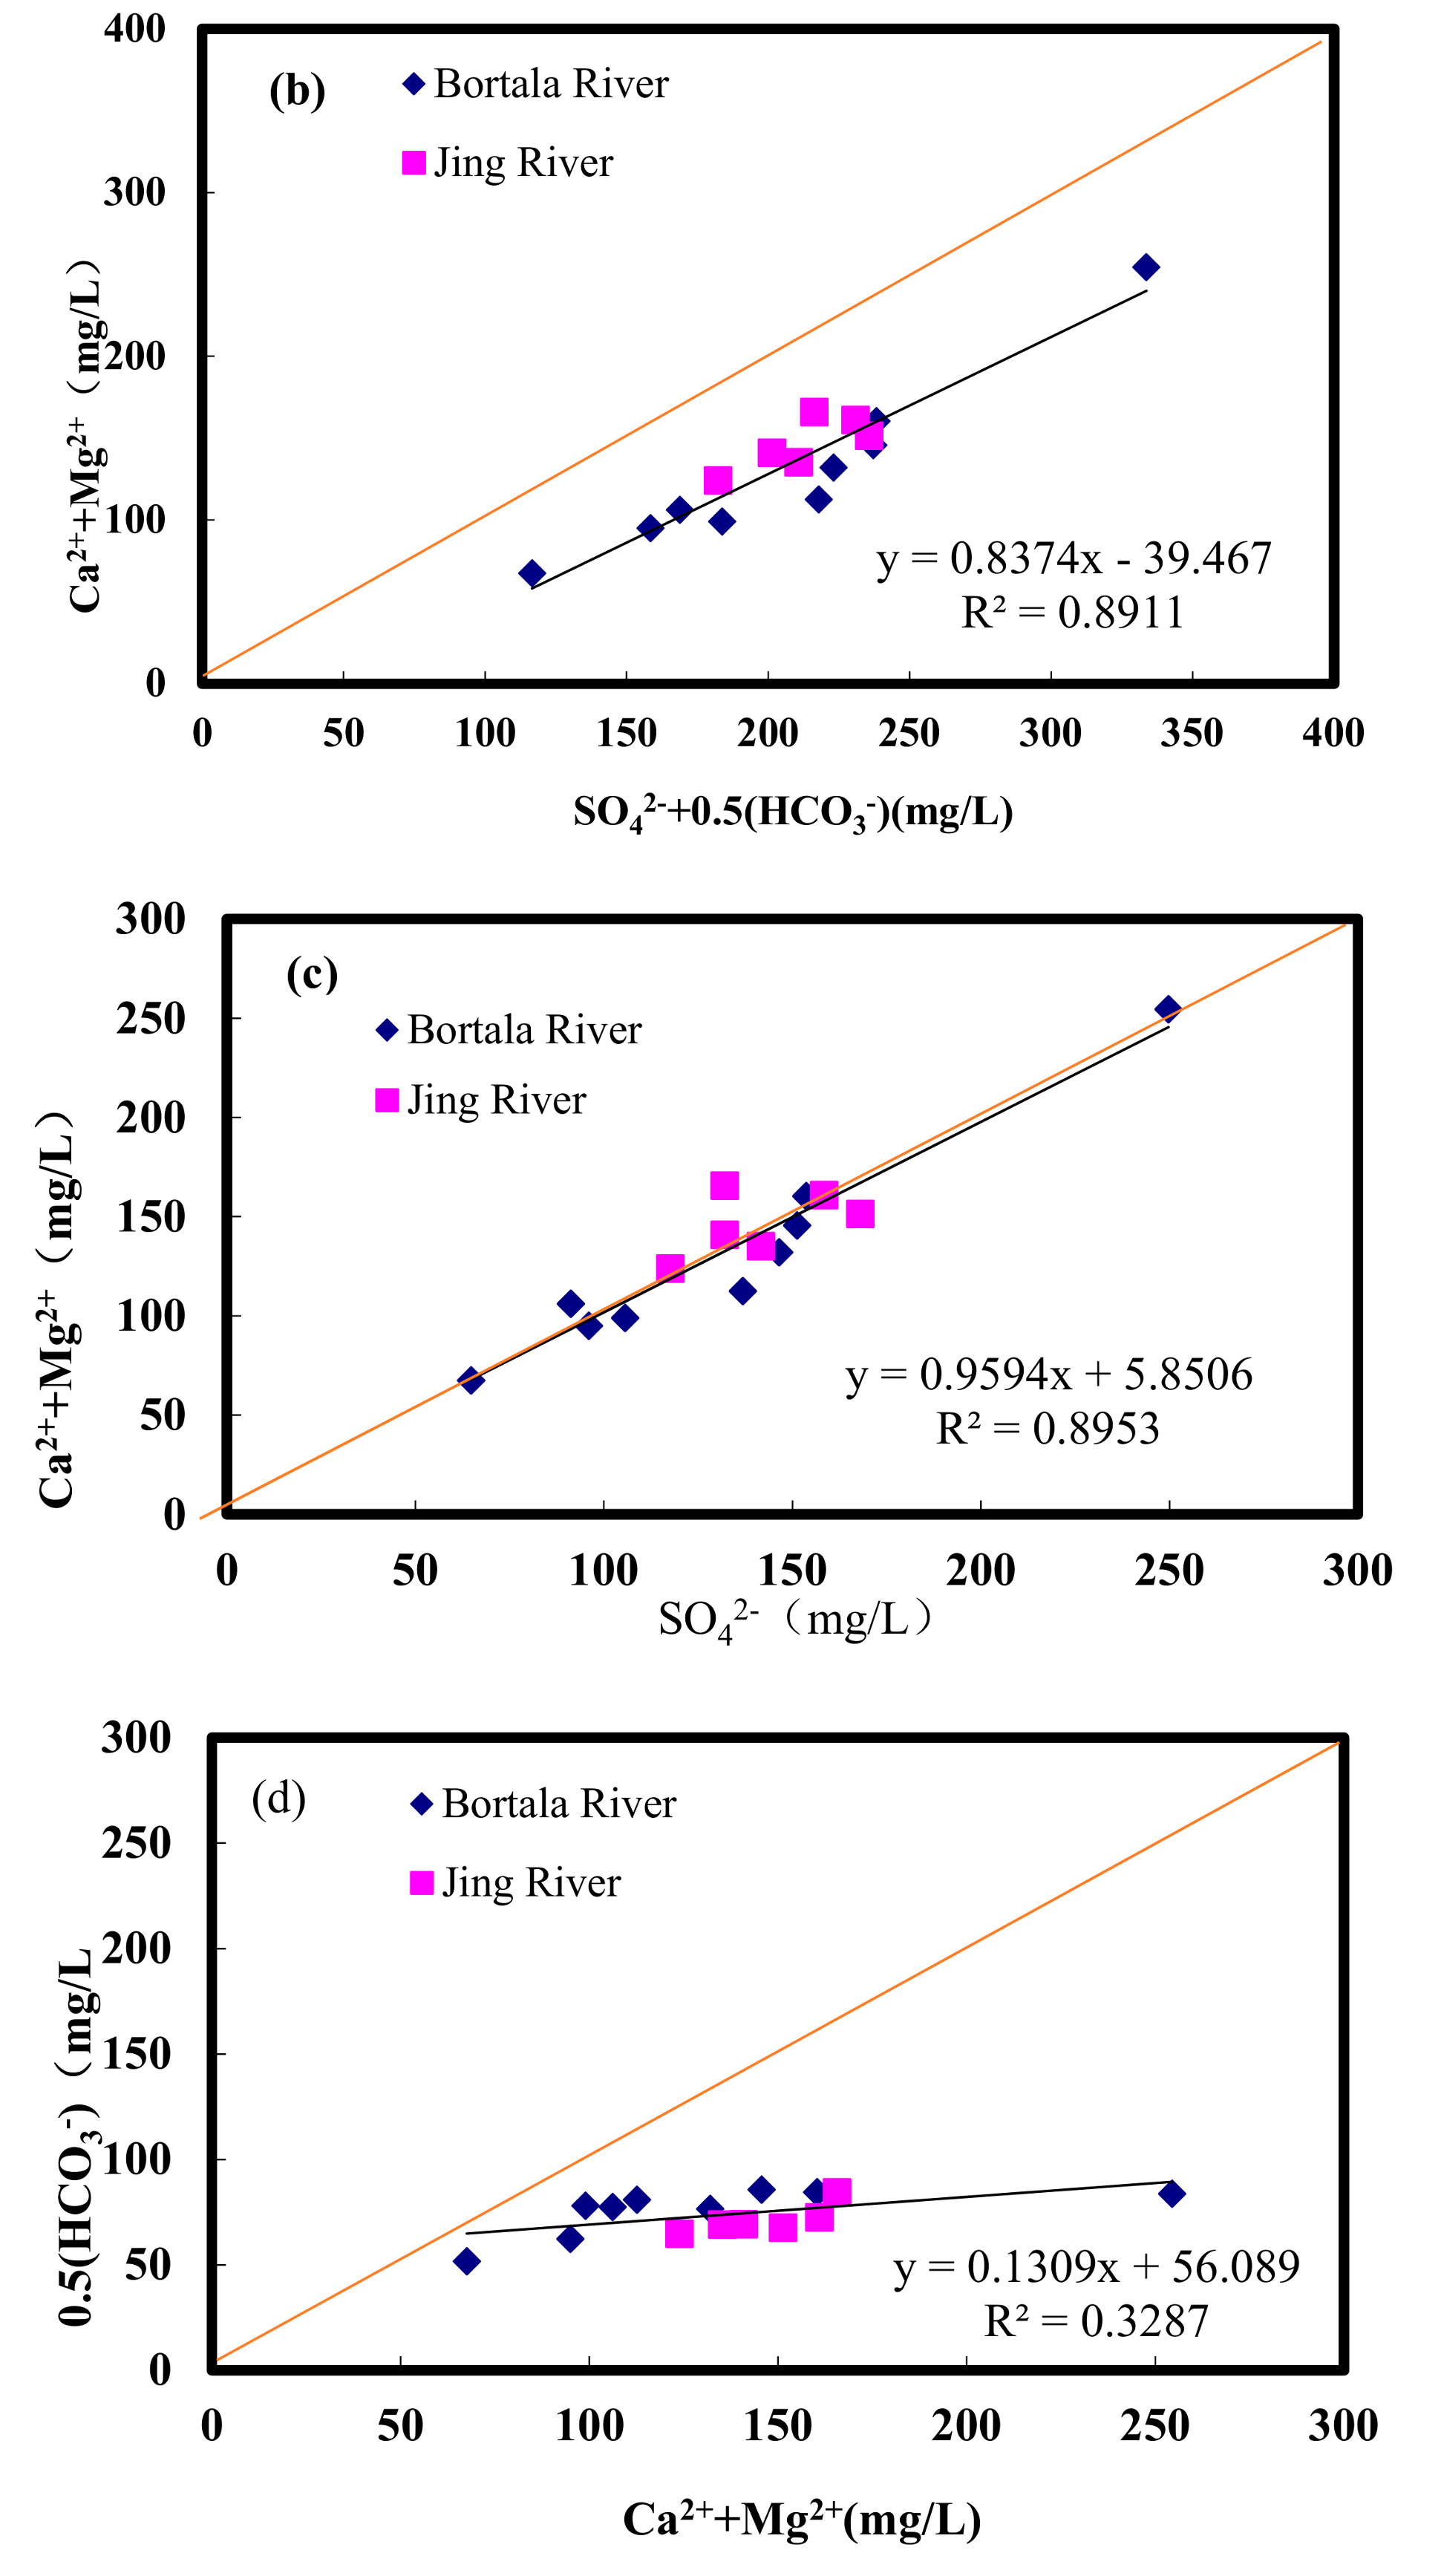
3.1.2. Analysis of Water Chemical Compositions by Rock End Element Control
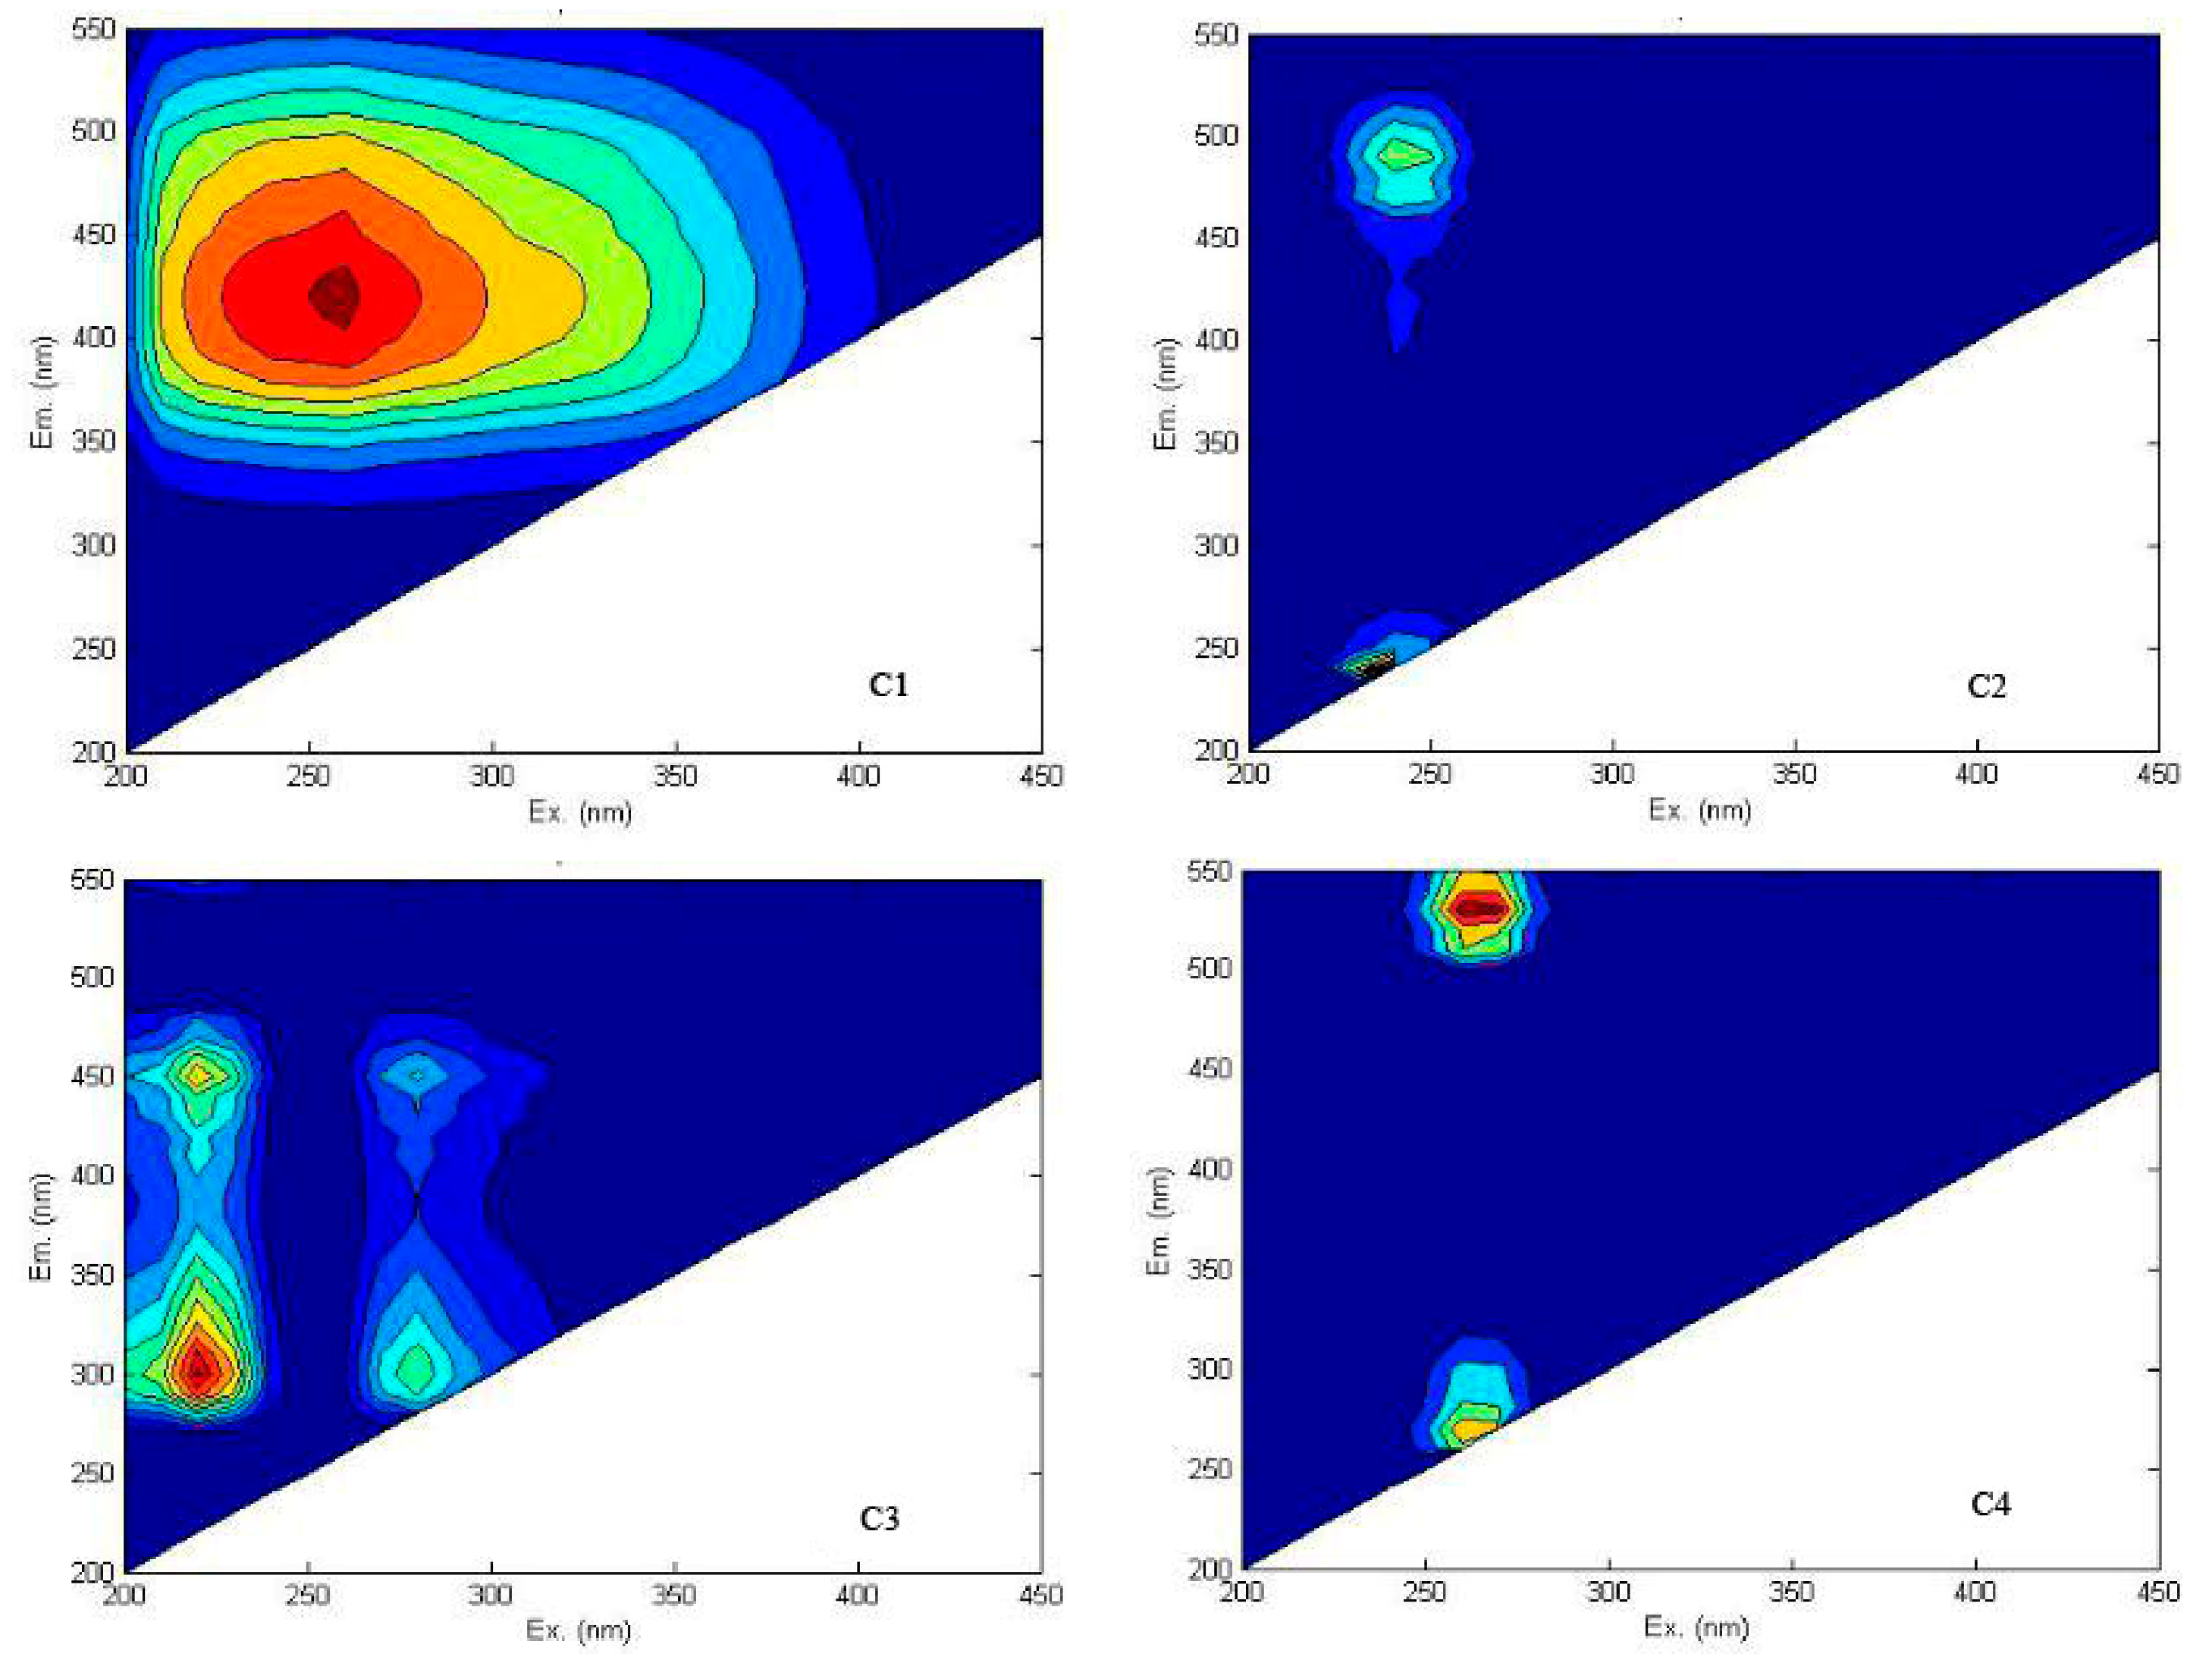
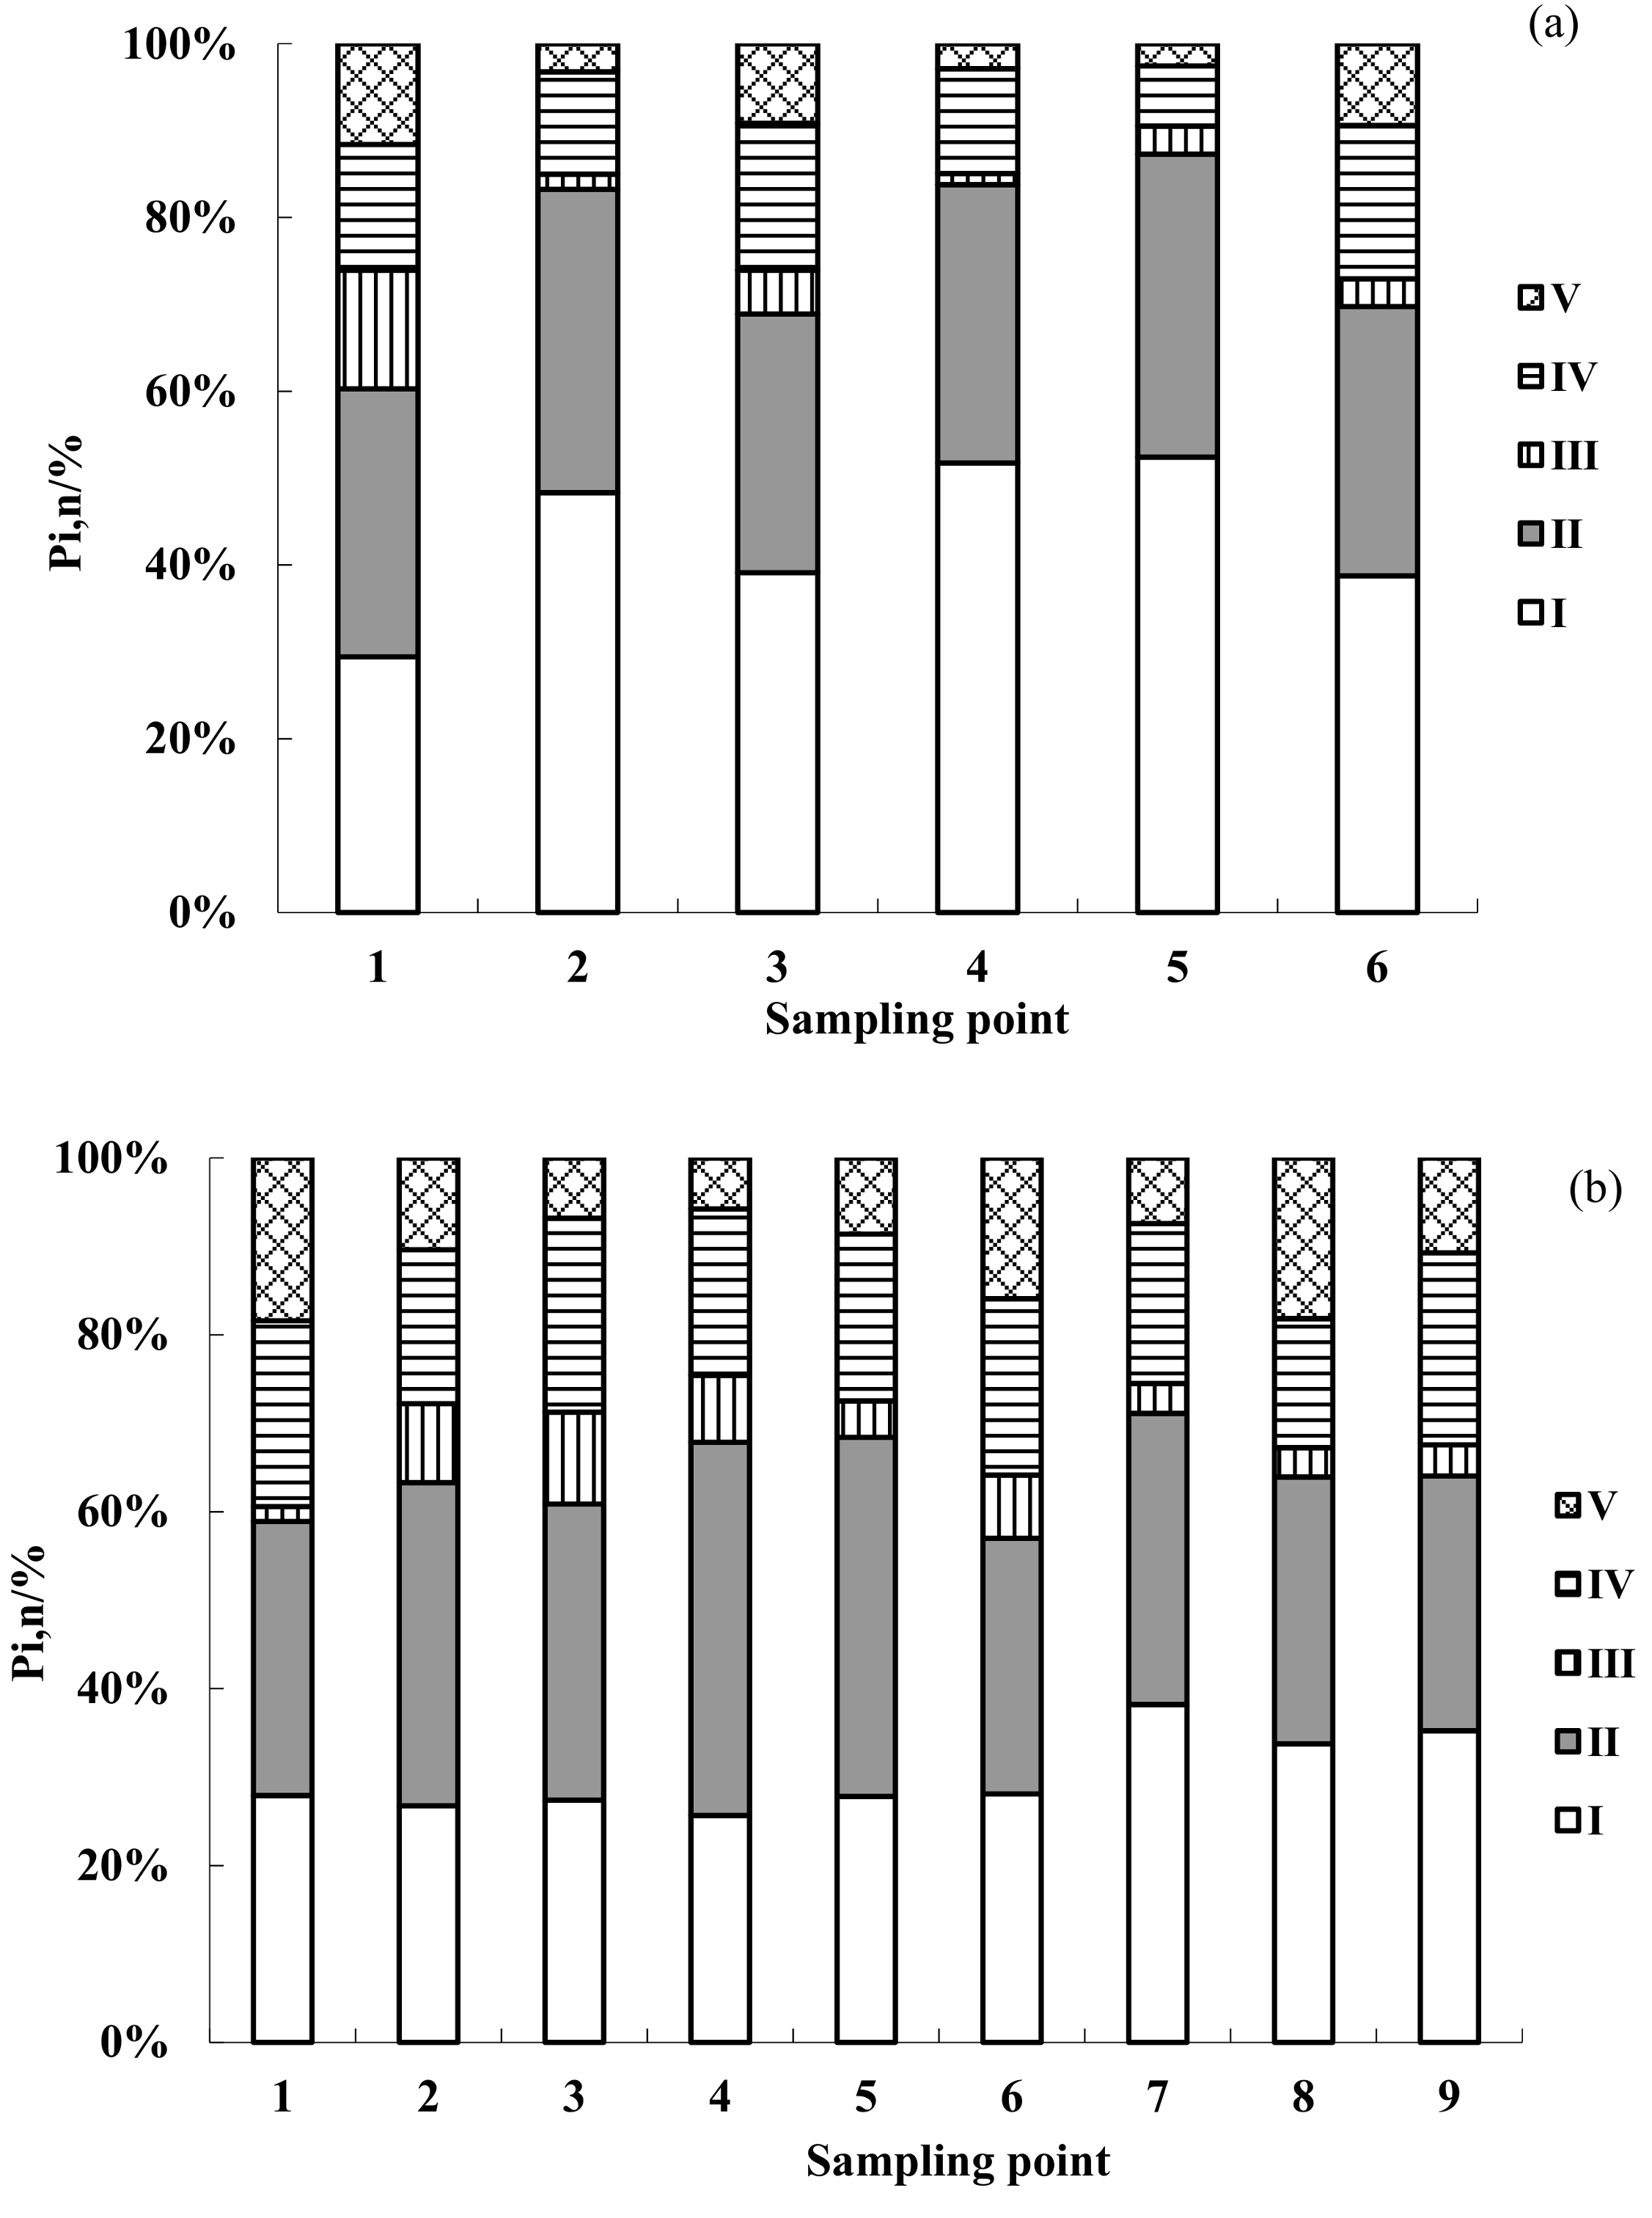
3.2. Distribution of EEM Regional Integration to Quantify Spectra for DOM
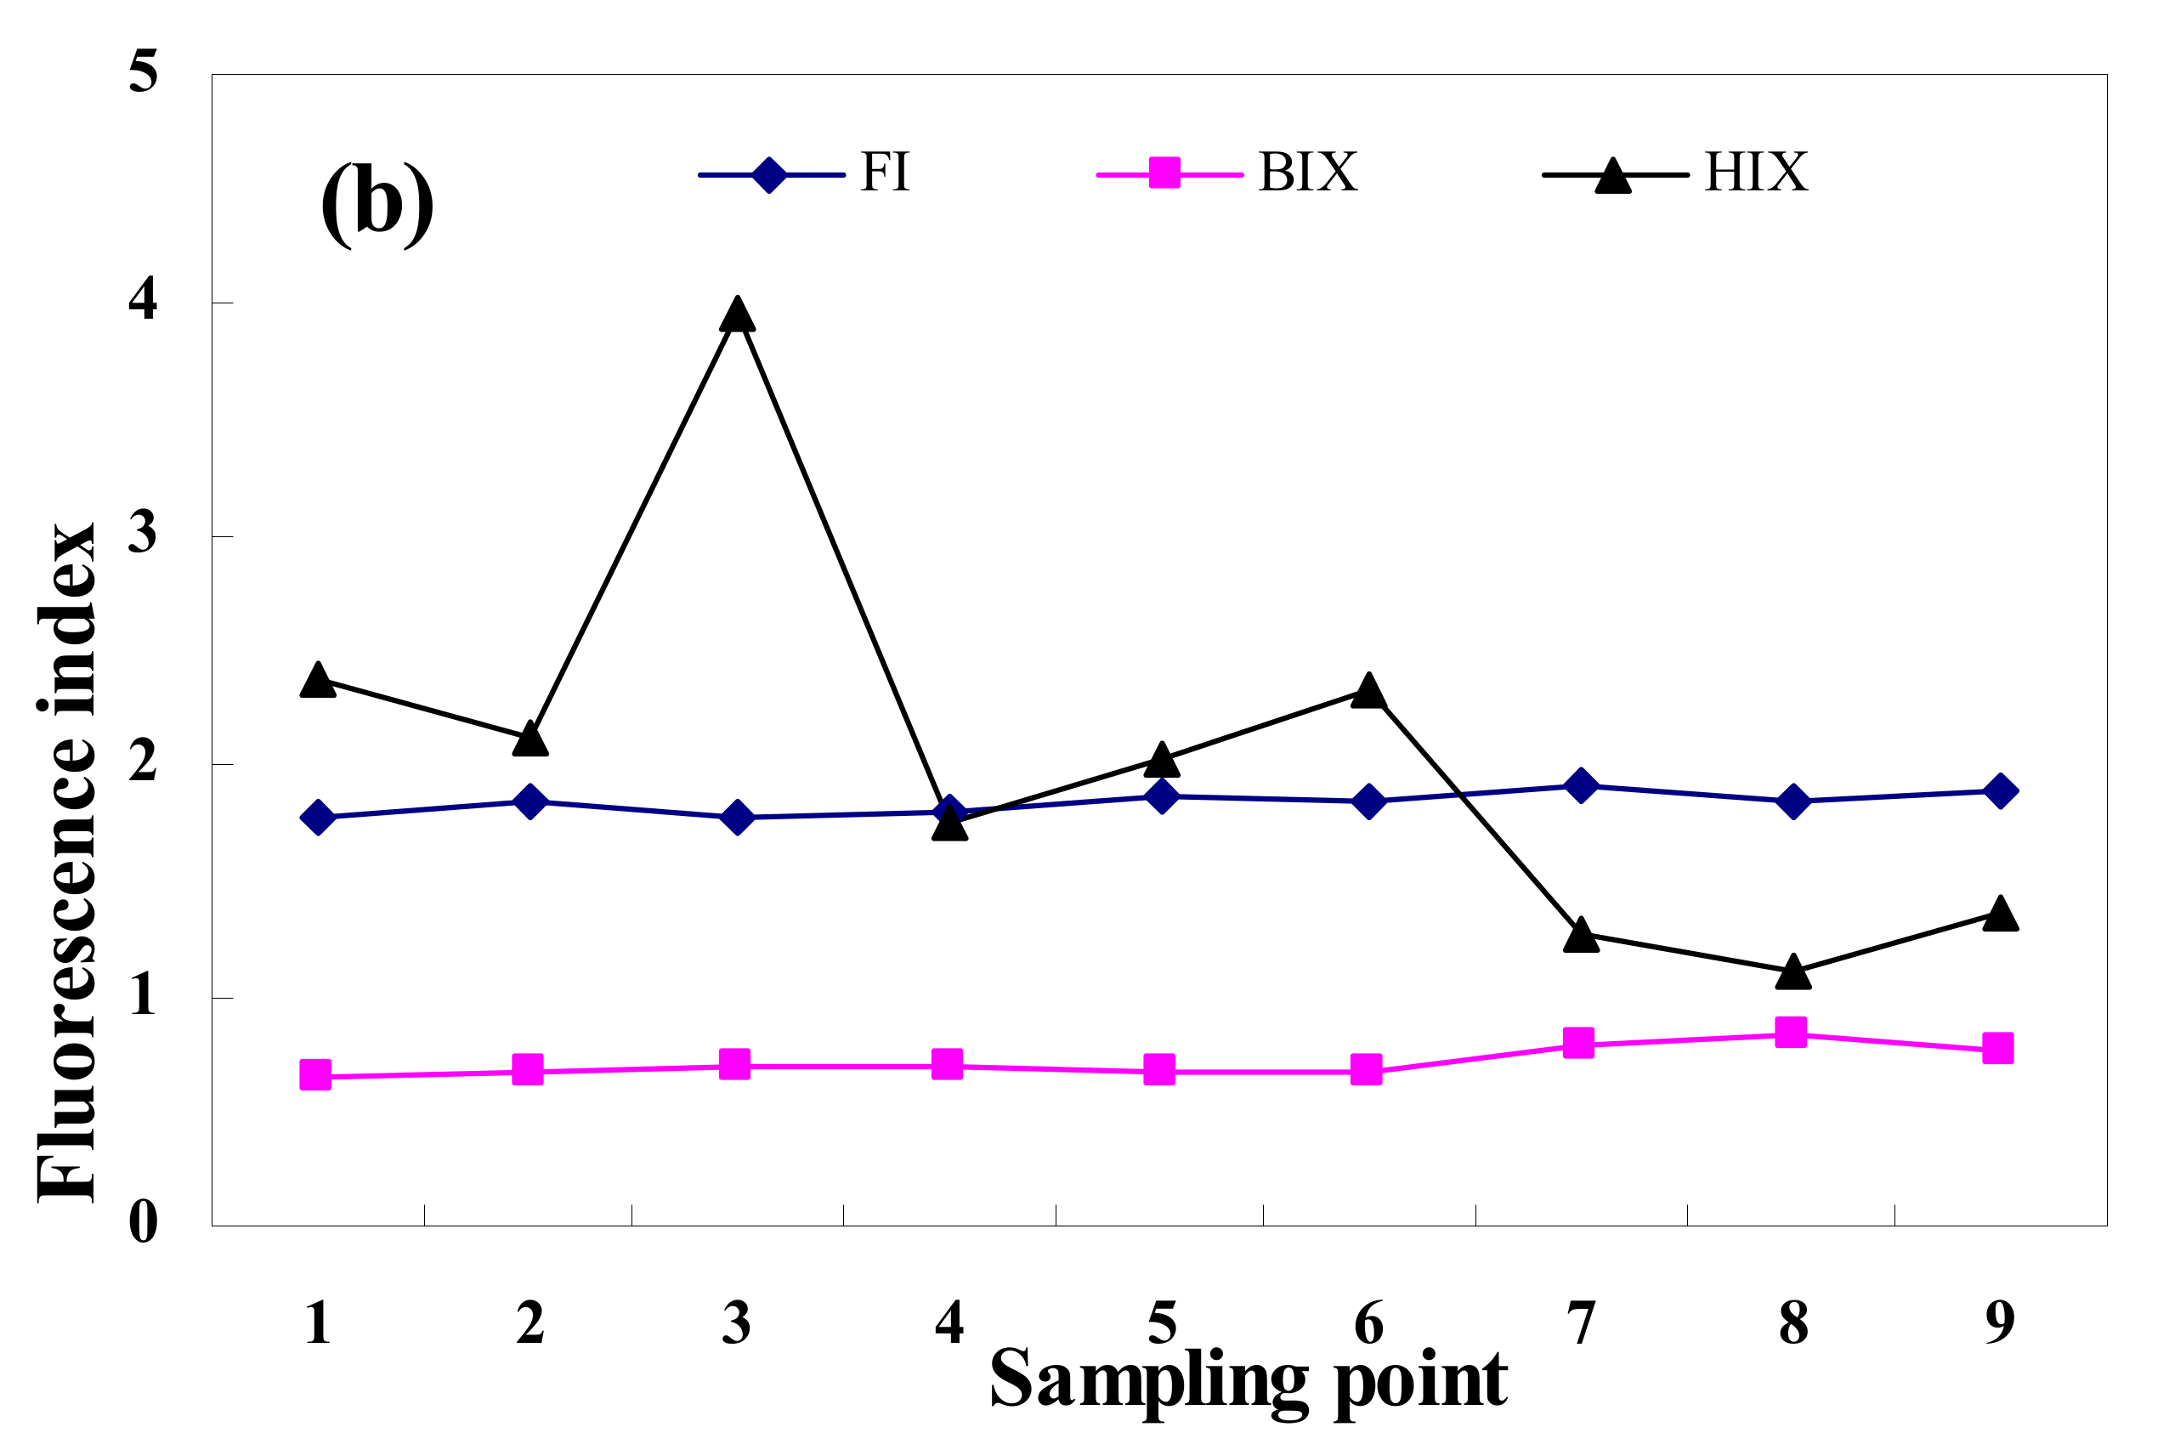
3.3. Fluorescence Index Analysis
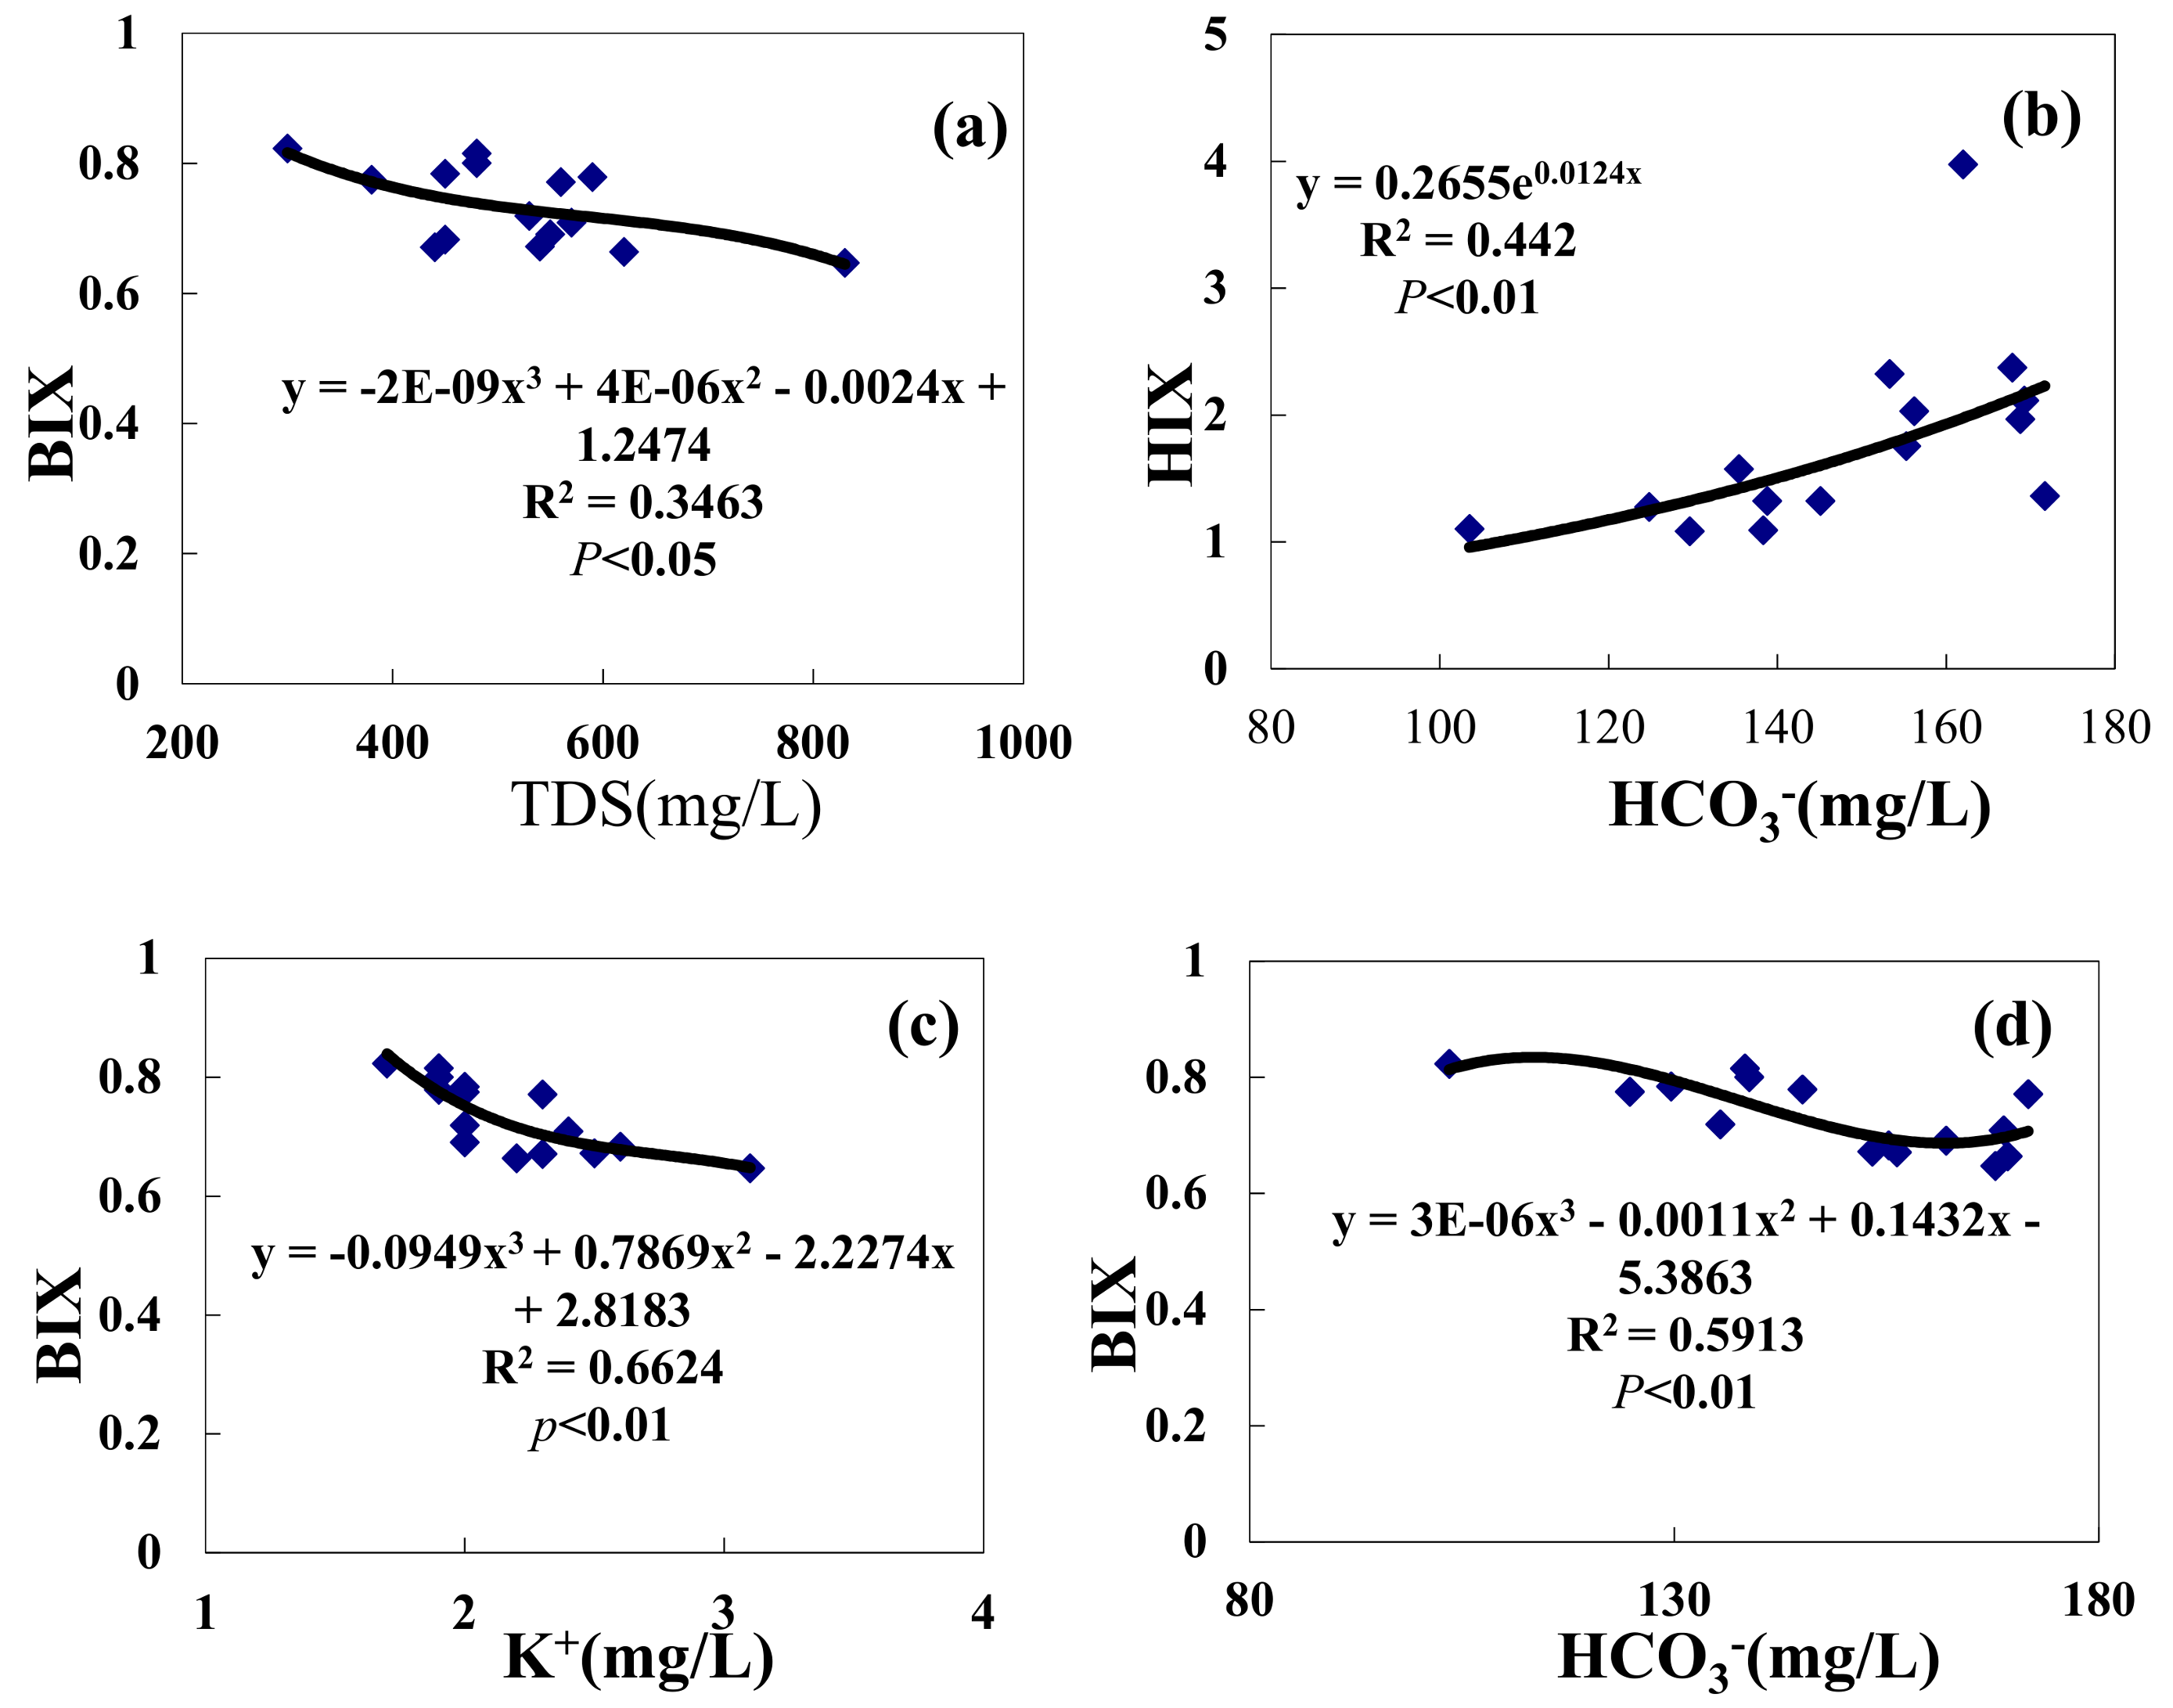
3.4. Analysis of the Relationship between Hydrochemical Factors and Fluorescence Indices
4. Discussion
5. Conclusions
- (1)
- Jing and Bortala River ions differ little. Anion contents are composed of [HCO3−] > [SO42−] > [Cl−], and cation contents are composed of [Ca2+] > [Mg2+] > [Na+] > [K+]. The Bortala and Jing Rivers include mainly SO42− and HCO3− anions. Cations are composed primarily of Ca2+. HCO3−-Ca2+ is the most common hydrochemical found in the Bortala and Jing Rivers. The ion composition of the Bortala and Jing Rivers is derived primarily from the weathering of rocks.
- (2)
- Both the Jing and Bortala Rivers contain the four components of humic acid and other organic matter (C1), UVC class humus (C2), protein organic matter (C3), and class humus (C4). Each component of DOM in the Jing River has the largest proportions of tryptophan and protein. The soluble zone includes the lowest levels of fulvic acid. The DOM of the Bortala River is similar to that of the Jing River. Proportions of protein-like organic matter are the largest here. The soluble zone includes the lowest levels of fulvic acid. For the two rivers, similar proteins, organic matter levels, and microbial metabolites account for dominant values of DOM components.
- (3)
- A correlation analysis of hydrochemical factors and fluorescence indices of main inflow lakes, BIX, HCO3−, and K+ shows that three-function fitting is the best approach. Fitting coefficients are valued at R = 0.789 and R = 0.8146 at the p < 0.01 level.
Acknowledgments
Author Contributions
Conflicts of Interest
References
- Nishanthiny, S.C.; Thushyanthy, M.; Barathithasan, T.; Saravanan, S. Irrigation water quality based on hydro chemical analysis, Jaffna, Sri Lanka. Am-Eurasian J. Agric. Environ. Sci. 2010, 7, 100–102. [Google Scholar]
- Muthanna, M. Quality assessment of Tigris River by using water quality index for irrigation purpose. Eur. J. Sci. Res. 2011, 57, 15–28. [Google Scholar]
- Yidana, S.M.; Banoeng-Yakubo, B.; Sakyi, P.A. Identifying key processes in the hydrochemistry of a basin through the combined use of factor and regression models. J. Earth Syst. Sci. 2012, 121, 491–507. [Google Scholar] [CrossRef]
- Grosbois, C.; Negrel, P.; Grimaud, D.; Fouillac, C. An overview of dissolved and suspended matter fluxes in the Loire River basin: Naturaland anthropogenic inputs. Aquat. Geochem. 2001, 7, 81–105. [Google Scholar] [CrossRef]
- Re, V.; Sacchi, E.; Mas-Pla, J.; Menció, A.; El, A.N. Identifying the effects of human pressure on groundwater quality to support water management strategies in coastal regions: A multi-tracer and statistical approach (Bou-Areg region, Morocco). Sci. Total Environ. 2014, 500–501, 211–223. [Google Scholar] [CrossRef] [PubMed]
- Huang, G.X.; Sun, J.C.; Zhang, Y.; Chen, Z.; Liu, F. Impact of anthropogenic and natural processes on the evolution of groundwater chemistry in a rapidly urbanized coastal area, South China. Sci. Total Environ. 2013, 463, 209–221. [Google Scholar] [CrossRef] [PubMed]
- Gibbs, R.J. Mechanisms controlling world water chemistry. Science 1970, 170, 1088–1090. [Google Scholar] [CrossRef] [PubMed]
- Wu, J.; Pons, M.N.; Potier, O. Waste water fingerprinting by UV-visible and synchronous fluorescence spectroscopy. Water Sci. Technol. 2006, 53, 449–456. [Google Scholar] [CrossRef] [PubMed]
- Baker, A.; Inverarity, R.; Charlton, M.; Richmond, S. Detecting River Pollution Using Fluorescence Spectrophotometry: Case Studies from the Ousebum NE England. Environ. Pollut. 2003, 124, 57–70. [Google Scholar] [CrossRef]
- Baker, A. Fluorescence Properties of Some Farm Wastes: Implications for Water Quality Monitoring. Water Res. 2002, 36, 189–195. [Google Scholar] [CrossRef]
- Zhang, Y.; Yin, Y.; Feng, L.; Zhu, G.; Shi, Z.; Liu, X.; Zhang, Y.Z. Characterizing chromophoric dissolved organic matter in Lake Tianmuhu and its catchment basin using excitation-emission matrix fluorescence and parallel factor analysis. Water Res. 2011, 45, 5110–5122. [Google Scholar] [CrossRef] [PubMed]
- Goldman, J.H.; Rounds, S.A.; Needoba, J.A. Applications of fluorescence spectroscopy for predicting percent wastewater in an urban stream. Environ. Sci. Technol. 2012, 46, 4374–4381. [Google Scholar] [CrossRef] [PubMed]
- Yu, H.; Song, Y.; Xiang, T.; Du, E.; Liu, R.; Peng, J. Assessing removal efficiency of dissolved organic matter in wastewater treatment using fluorescence excitation emission matrices with parallel factor analysis and second derivative synchronous fluorescence. Bioresour. Technol. 2013, 144, 595–601. [Google Scholar] [CrossRef] [PubMed]
- Wang, Q.L.; Jiang, T.; Zhao, Z.; Liang, J.; Mu, Z.J. Spectral Characteristics of Dissolved Organic Matter (DOM) in Waters of Typical Agricultural Watershed of Three Gorges Reservoir Areas. Environ. Sci. 2016, 37, 2082–2092. (In Chinese) [Google Scholar]
- Zhang, Z.Y.; Jilili, A.; Jiang, F.Q. Pollution and Potential Ecology Risk Evaluation of Heavy Metals in River Water, Top Sediments on Bed and Soils Along Banks of Bortala River, Northwest China. Environ. Sci. 2015, 36, 2422–2429. (In Chinese) [Google Scholar]
- Zhang, F.; Tiyip, T.; Johnson, V.C.; Kung, H.; Ding, J.; Zhou, M. Evaluation of land desertification from 1990 to 2010 and its causes in Ebinur lake region, Xinjiang China. Environ. Earth Sci. 2015, 73, 5731–5745. [Google Scholar] [CrossRef]
- Cui, Y.R.; Wu, Q.; Yang, M.S. Three-dimensional excitation-emission matrix fluorescence spectroscopy and fractions of dissolved organic matter change in landfill leachate by biological treatment. Environ. Sci. Pollut. Res. 2016, 23, 793–799. [Google Scholar] [CrossRef] [PubMed]
- Wang, S.H.; Wang, W.W.; Jiang, X.; Zhao, L.; Zhang, B. Distribution of chromophoric dissolved organic matter in Li hu Lake using excitation-emission matrix fluorescence and parallel factor analysis. China Environ. Sci. 2016, 36, 517–524. (In Chinese) [Google Scholar]
- Stedmon, C.A.; Bro, R. Characterizing dissolved organic matter fluorescence with parallel factor analysis: A tutorial. Limnol. Oceanogr. Methods 2008, 6, 572–579. [Google Scholar] [CrossRef]
- Maqbool, T.; Quang, V.L.; Cho, J.; Hur, J. Characterizing fluorescent dissolved organic matter in a membrane bioreactor via excitation-emission matrix combined with parallel factor analysis. Bioresour. Technol. 2016, 209, 31–39. [Google Scholar] [CrossRef] [PubMed]
- Huguet, A.; Vacher, L.; Relexans, S.; Saubusse, S.; Froidefond, J.M.; Parlanti, E. Properties of fluorescent dissolved organic matter in the Gironde Estuary. Org. Geochem. 2009, 40, 706–719. [Google Scholar] [CrossRef]
- Chen, W.; Westerhoff, P.; Leenheer, J.A.; Booksh, K. Fluorescence excitation–emission matrix regional integration to quantify spectra for dissolved organic matter. Environ. Sci. Technol. 2003, 37, 5701–5710. [Google Scholar] [CrossRef] [PubMed]
- Avid, R.M. Handbook of Hydrology; McGraw-Hill: New York, NY, USA, 1992. [Google Scholar]
- Sun, R.; Zhang, X.Q.; Wu, Y.H. Major Ion chemistry of water and its controlling factors in the Yamzhog Yumco Basin, South Tibet. J. Lake Sci. 2012, 24, 600–608. (In Chinese) [Google Scholar]
- Piper, A.M. A graphic procedure in the geochemical interpretation of water-analyses. Neurochem. Int. 1984, 6, 27–39. [Google Scholar] [CrossRef]
- Sheikhy, N.T.; Ramli, M.F.; Aris, A.Z.; Sulaiman, W.N.; Juahir, H.; Fakharian, K. Identification of the hydrogeochemical processes in groundwater using classic integrated geochemical methods and geostatistical techniques, in Amolbabol Plain, Iran. Sci. World J. 2014, 983–990. [Google Scholar] [CrossRef]
- Han, G.L.; Liu, C. Water geochemistry controlled by carbonate dissolution: A study of the River waters draining karst-dominated terrain, Guizhou Province, China. Chem. Geol. 2004, 204, 1–21. [Google Scholar] [CrossRef]
- Chen, J.S.; Wang, F.Y.; He, D.W. Geochemistry of water quality of the Yellow River basin. Earth Sci. Front. 2006, 13, 58–73. (In Chinese) [Google Scholar]
- Jin, H.; Cho, J. Prediction of BOD, COD, and Total Nitrogen Concentrations in a Typical Urban River Using a Fluorescence Excitation-Emission Matrix with PARAFAC and UV Absorption Indices. Sensors 2012, 12, 972–986. [Google Scholar]
- Feng, W.Y.; Wang, S.R.; Zhang, S. Effect of p H on the fluorescence characteristics of dissolved organic matter in the sediment and overlying water from Erhai Lake. Environ. Chem. 2014, 33, 229–235. (In Chinese) [Google Scholar]
- Cheng, Q.L.; Zheng, B.H.; Wang, S.R.; Jiao, L.X.; Huang, M.S. Optical signatures of Chromophoric dissolved organic matter in water body of Tien Lake. Spectrosc. Spectr. Anal. 2014, 34, 698–703. (In Chinese) [Google Scholar]
- Ma, L.N.; Zhang, H.; Tan, W.B.; Yu, M.D.; Huang, Z.G.; Gao, R.T. Evolution of dissolved organic matter properties in a constructed wetland of xiao River, Hebei. Spectrosc. Spectr. Anal. 2016, 36, 206–212. (In Chinese) [Google Scholar]
- Vodacek, A.; Hogel, F.E.; Swift, R.N.; Yungel, J.K.; Peltzer, E.T.; Blough, N.V. The in situ and airborne fluorescence measurements to determine UV absorption coefficients and DOC concentrations in surface waters. Limnol. Oceanogr. 1995, 40, 411–415. [Google Scholar] [CrossRef]
- Cory, R.M.; McKnight, D.M. Fluorescence spectroscopy reveals biquitous presence of oxidized and reduced quinones in dissolved organic matter. Environ. Sci. Technol. 2005, 39, 8142–8149. [Google Scholar] [CrossRef] [PubMed]
- Wang, Z.; Wu, Z.; Tang, S. Characterization of dissolved organic matter in a submerged membrane bioreactor by using three-dimensional excitation and emission matrix fluorescence spectroscopy. Water Res. 2009, 43, 1533–1540. [Google Scholar] [CrossRef] [PubMed]
- Matteo, B.; Pierre, B.; Philippe, C.; Ole, M.E.; Alessandro, G.; Alexandra, G.; Melike, G.; Bjørn, K.; Zoran, N.; Elena, P.; et al. Groundwater Pollution and Quality Monitoring Approaches at the European Level. Crit. Rev. Environ. Sci. Technol. 2012, 43, 323–408. [Google Scholar]
- Lapworth, D.J.; Baran, N.; Stuart, M.E.; Ward, R.S. Emerging organic contaminants in groundwater: A review of sources, fate and occurrence. Environ. Pollut. 2012, 163, 287–303. [Google Scholar] [CrossRef] [PubMed]
- Birdwell, J.E.; Engel, A.S. Characterization of dissolved organic matter in cave and spring waters using UV–Vis absorbance and fluorescence spectroscopy. Org. Geochem. 2010, 41, 270–280. [Google Scholar] [CrossRef]
- Lidén, A.; Keucken, A.; Persson, K.M. Uses of fluorescence excitation-emissions indices in predicting water treatment efficiency. J. Water Process Eng. 2017, 16, 249–257. [Google Scholar] [CrossRef]
- Zhao, X.; Zhang, Z.F.; Zhu, F.J. Pollution Characteristics of Parabens in Typical Sewage Wastewater. Environ. Sci. 2017. [Google Scholar] [CrossRef]
- Wang, X.P.; Zhang, F.; Kung, H.T.; Abduwasit, G.; Adam, L.; Trumbo, F.; Yang, J.Y.; Ren, Y.; Jing, Y.Q. Evaluation and estimation of surface water quality in an arid region based on EEM-PARAFAC and 3D fluorescence spectral index: A case study of the Ebinur Lake Watershed, China. Catena 2017, 155, 62–74. [Google Scholar] [CrossRef]




| Hydrochemical Factors | Instrument | Measurement Accuracy |
|---|---|---|
| Mg2+, Ca2+, K+, Na+ | Diane ICS1500 ion chromatograph analysis | 0.01 mg/L |
| TDS, HCO3−, Cl−, SO42− | Wantong MIC ion chromatograph analysis | 0.01 mg/L |
| River | Hydrochemical Ions | Min | Mean | Median | Mode | Std. Dev. | Variance | Skewness | Kurtosis |
|---|---|---|---|---|---|---|---|---|---|
| Jing River | TDS (mg/L) | 450.00 | 516.666 | 505.00 | 480 | 55.738 | 3106.667 | 0.266 | −1.868 |
| HCO3− (mg/L) | 129.60 | 142.657 | 138.5467 | 129.60 | 13.746 | 188.953 | 1.741 | 3.503 | |
| Cl− (mg/L) | 29.25 | 46.675 | 42.0969 | 29.25 | 17.181 | 295.22 | 1.422 | 2.332 | |
| SO42− (mg/L) | 117.67 | 141.688 | 136.8855 | 132.08 | 18.663 | 348.339 | 0.349 | −0.963 | |
| Mg2+ (mg/L) | 43.74 | 55.485 | 57.105 | 60.75 | 7.437 | 55.309 | −0.707 | −0.648 | |
| Ca2+ (mg/L) | 80.16 | 90.848 | 86.172 | 80.16 | 12.842 | 164.924 | 1.109 | 0.044 | |
| K+ (mg/L) | 1.90 | 2.0167 | 1.95 | 1.9 | 0.194 | 0.038 | 2.116 | 4.678 | |
| Na+ (mg/L) | 13.10 | 19.033 | 17.55 | 13.10 | 7.015 | 49.211 | 1.065 | 0.521 | |
| Bortala River | TDS (mg/L) | 300.00 | 518.888 | 540.00 | 300.00 | 153.414 | 23,536.11 | 0.769 | 1.331 |
| HCO3− (mg/L) | 103.49 | 151.522 | 156.19 | 103.49 | 22.796 | 519.68 | −1.501 | 1.562 | |
| Cl− (mg/L) | 35.01 | 50.5162 | 49.186 | 35.01 | 11.759 | 138.286 | 0.387 | −1.057 | |
| SO42− (mg/L) | 64.84 | 132.883 | 136.88 | 64.84 | 53.726 | 2886.485 | 1.199 | 2.3 | |
| Mg2+ (mg/L) | 19.44 | 52.38 | 43.740 | 38.88 | 28.831 | 831.279 | 1.388 | 1.877 | |
| Ca2+ (mg/L) | 48.1 | 77.933 | 74.816 | 76.15 | 26.969 | 727.345 | 1.659 | 3.667 | |
| K+ (mg/L) | 1.70 | 2.30 | 2.267 | 2.00 | 0.406 | 0.165 | 0.662 | 0.989 | |
| Na+ (mg/L) | 7.50 | 16.455 | 16.400 | 7.50 | 6.516 | 42.463 | 0.237 | −0.089 |
| Fluorescent Component | Peak Position λEx/Em | Description and Probable Source |
|---|---|---|
| C1 | 260/420 | Humic-like (Photodegradation) [28,29] |
| C2 | 240/240 | -- |
| 240/490 | UVC humus [30] | |
| C3 | 220/300 | Tyrosine fluorescence peak [31] |
| 220/450 | Tyrosine fluorescence peak of the visible region [31] | |
| 280/300 | Tryptophan [32] | |
| 280/450 | Humic-like acid [32] | |
| C4 | 260/270 | -- |
| 260/530 | Tryptophan-like [30] |
| TitleHydrochemical Ions | TDS | HCO3− | Cl− | SO42− | Mg2+ | Ca2+ | K+ | Na+ | FI | BIX | HIX |
|---|---|---|---|---|---|---|---|---|---|---|---|
| TDS | 1 | 0.736 ** | 0.546 * | 0.945 ** | 0.908 ** | 0.898 ** | 0.677 ** | 0.793 ** | −0.248 | −0.577 * | 0.43 |
| HCO3− | 1 | 0.505 | 0.546 * | 0.511 | 0.581 * | 0.676 ** | 0.600 * | −0.261 | −0.708 ** | 0.568 * | |
| Cl− | 1 | 0.394 | 0.304 | 0.366 | 0.164 | 0.597 * | 0.089 | −0.364 | 0.469 | ||
| SO42− | 1 | 0.932 ** | 0.873 ** | 0.559 * | 0.750 ** | −0.133 | −0.418 | 0.289 | |||
| Mg2+ | 1 | 0.818 ** | 0.589 * | 0.638 * | −0.212 | −0.437 | 0.153 | ||||
| Ca2+ | 1 | 0.602 * | 0.814 ** | −0.381 | −0.32 | 0.172 | |||||
| K+ | 1 | 0.47 | −0.116 | −0.764 ** | 0.362 | ||||||
| Na+ | 1 | −0.117 | −0.338 | 0.152 | |||||||
| FI | 1 | 0.01 | −0.17 | ||||||||
| BIX | 1 | −0.710 ** | |||||||||
| HIX | 1 |
© 2018 by the authors. Licensee MDPI, Basel, Switzerland. This article is an open access article distributed under the terms and conditions of the Creative Commons Attribution (CC BY) license (http://creativecommons.org/licenses/by/4.0/).
Share and Cite
Zhang, H.; Zhang, F.; Song, J. Analysis of Hydrochemical Characteristics and Three-Dimensional Fluorescence Spectra in the Semi-Arid Ebinur Lake Watershed, Xinjiang, China. Water 2018, 10, 426. https://doi.org/10.3390/w10040426
Zhang H, Zhang F, Song J. Analysis of Hydrochemical Characteristics and Three-Dimensional Fluorescence Spectra in the Semi-Arid Ebinur Lake Watershed, Xinjiang, China. Water. 2018; 10(4):426. https://doi.org/10.3390/w10040426
Chicago/Turabian StyleZhang, Haiwei, Fei Zhang, and Jia Song. 2018. "Analysis of Hydrochemical Characteristics and Three-Dimensional Fluorescence Spectra in the Semi-Arid Ebinur Lake Watershed, Xinjiang, China" Water 10, no. 4: 426. https://doi.org/10.3390/w10040426
APA StyleZhang, H., Zhang, F., & Song, J. (2018). Analysis of Hydrochemical Characteristics and Three-Dimensional Fluorescence Spectra in the Semi-Arid Ebinur Lake Watershed, Xinjiang, China. Water, 10(4), 426. https://doi.org/10.3390/w10040426


