Abstract
The characteristics of soil moisture content (SMC) distribution in an area are necessarily analyzed for the design and construction of sponge cities. Combining remote sensing data with experimental data, this paper establishes a machine learning model to reveal the characteristics of SMC. Taking Beijing as an example, the SMC distribution was obtained and the characteristics were analyzed after training and validating. When comparing different machine learning methods, it can be concluded that the support vector classifier (SVC) method trained with remote sensing and grayscale data can achieve the highest accuracy (76.69%). The calculation results show that the districts with the highest and lowest SMC value are Xicheng District (19.94%) and Daxing District (11.04%), respectively, in Beijing. The mean SMC value of Beijing is 15.65%. The SMC distribution characteristic in Beijing shows that the soil in the west and north are relatively wet, while the soil in the east and south are relatively dry. Therefore, it is suggested that the timely monitoring of the SMC of vegetation covered areas at the north and west should be carried out. Water conservation facilities also need to be established with the development of city constructions in the south and east areas.
1. Introduction
Modern cities should have functions of absorbing, purifying, and utilizing rainwater like sponges in order to prevent extreme rainfall, reduce runoff, and improve the ecological environment. “Sponge City” was initiated by the Chinese government in 2015, aiming to solve urban water resource problems, such as urban flooding and groundwater shortages [1,2,3,4,5]. The initiative seeks to reduce the intensity of the rainwater runoff by enhancing and distributing the seepage capacities more evenly across targeted areas. This approach not only reduces flooding, but also enhances groundwater replenishment by building wetlands (which will store rainwater) and laying down permeable roads. Soil moisture content (SMC) is one of most significant parameters that affect agriculture irrigation, civil engineering, and environmental protection especially factors such as the seepage volume in soil and runoff control for sponge city construction [6,7,8,9,10]. Under complex weather and climate conditions, soil moisture is not only widely used for potential runoff and flood control, but also for soil erosion, drought warning, water resources management, and other related fields [11,12,13,14]. In short, it makes great sense to obtain the SMC spatial and temporal distribution and analyze its characteristics.
Currently, there are three conventional manners to get SMC values. The first one is field sampling with lab tests. The direct drying method in the laboratory is the standard measurement method of SMC. The soil moisture content can be calculated by ascertaining the difference of the soil weight before and after drying. The second method is monitoring station measurements, which is an indirect measurement method that is used to measure the electromagnetic properties of soil water. Indirect measurement methods include resistivity method, time-domain reflectometry (TDR), ground-penetrating radar (GPR), and frequency-domain reflectometry (FDR) [15,16]. The third method is inversion by remote sensing technology. Remote sensing data have the ability to gain ground surface information in large areas and can meet the required spatial resolution and spatial coverage for practical applications. Pohn et al. first proposed to obtain SMC based on the thermal inertia model [17]. Pohn et al. utilized remote sensing technology to get the daily ranges of soil temperature and then calculated the soil temperature. The corresponding SMC values could be deduced according to the soil temperature and the theoretical methods. Wang et al. showed that there is a linear relationship between soil moisture and microwave emissivity on bare surfaces [18]. J. Zawadzki et al. also applied the Modified Soil Moisture Index (SMIm) data obtained from the SMOS satellites to solve the Standardized Precipitation Evapotranspiration Index (SPEI) at the objective area, and they indicated that SMIm could be a cheap supplementary tool for drought monitoring in large areas [19]. He successfully applied this method to the depression cone research of a mining located at Poland [20]. However, these three methods all have advantages and disadvantages. The field sampling method lacks timeliness with a complicated sampling process and a high cost, so it cannot meet the requirements when the SMC data of large areas are needed for practical applications. There is high measurement difficulty for the second method and it has a poor coverage ability due to space limitations. Currently, many scholars hope to analyze the relationship between remote sensing technology and SMC to obtain an SMC distribution of large areas. Even S. I. Seneviratne set a strong expectation for the combination of SMC and satellites technology in a review, and he indicated that this would be an effective way to reveal the SMC distribution [21]. However, if this method is not combined with experimental data from the above two methods, the calculation results will be questionable with a large deviation. Therefore, in our study, based on the experimental data and remote sensing technology, the SMC values in Beijing are inversed.
In recent years, machine learning, as a popular and significant technology of computer science, has been able to meet the demands of different academic disciplines and practical fields [22,23,24]. The inversion of SMC data on a regional scale by remote sensing data is essentially a special case of spatial data processing and pattern recognition. Therefore, different types of machine learning methods are utilized in remote sensing technology, such as the maximum likelihood method, k-nearest neighbors algorithm, artificial neural network, support vector classifier, decision tree learning, and so on. Based on remote sensing data, many scholars use machine learning algorithms to do research on the inversion of the physical properties of soil on a large scale. Based on error propagation and the learning back propagation (EPLBP) of the BP neural network, Liu et al. regarded the measured brightness temperature as the input nodes and the soil moisture content and plant water content as the output nodes, thus, obtaining an SMC distribution [25]. Rodriguez-Galiano et al. evaluated the performance of the random forest (RF) method in land cover classification in terms of mapping accuracy, sensitivity to data set size, and noise [26]. Therefore, the successful combination of machine learning and remote sensing data can give references for predicting the SMC distribution in Beijing, and then provide advice for the further development of sponge city construction.
There are four procedures to accomplish the SMC prediction by taking Beijing as a study case. First, couples of SMC data will be obtained by experimental tests after selecting the samples with the corresponding latitude and longitude recorded. In addition, by combining the experimental data, the machine learning model is established in terms of the corresponding data from the Landsat5-TM images of Beijing. Thirdly, the results of the SMC in Beijing and every district are discussed and we can figure out the characteristics of the SMC distribution. Last but not least, design advice for sponge city construction are presented according to the characteristics of the SMC distribution in Beijing. When combined with the machine learning algorithm, remote sensing data, and field sampling data, there is a new attempt to try to predict the SMC distribution and provide the theoretical fundamental for engineering construction further.
2. Materials and Methods
2.1. Study Area and Experimental Data
Beijing (39°28′–41°05′ N, 115°25′–117°30′ E), which is located in northern China, is the capital of the People’s Republic of China and is the world’s second most populous city proper and the most populous capital city. Beijing has mountains to the north, northwest, and west shielding the city; and northern China’s agricultural heartland from the encroaching desert steppes. It has 16 districts and six major central ones will be important targets in this research.
Beijing has a monsoon-influenced humid continental climate, which is characterized by higher humidity in the summers due to the East Asian monsoon, and colder, windier, drier winters that reflect the influence of the vast Siberian anticyclone. Precipitation averages around 570 mm annually, with close to three-fourths of that total falling during the period of June–August. In addition, the development of urbanization leads to the concentration of impervious areas, and frequent urban flooding in summer. In 2012, a flash flood hit the city of Beijing, and more than 1.6 million people were affected by the flood, overall [27].
The soil water on the ground surface mainly refers to the water located 5 cm below the surface. To be more specific, the soil moisture content in our study refers to the water weight per unit weight soil. Among the methods to measure SMC, the direct drying method is the standard measurement method. Its principle is to measure the water weight according to the weight difference of wet soil before and after drying. The water content is generally equal to the water weight released from soil during the drying process with temperatures of 105–110 °C. The value of SMC can be calculated, as shown in Equation (1):
where is SMC, and and are the wet soil weight and water weight, respectively.
There were 50 positions selected to obtain soil samples by the cutting ring method. Figure 1 shows the position points of the selected samples for lab tests on a map. The positions of chosen soil samples are random, while the screening process has principles. We set the approximate locations for easy sampling at central city zones with satellites pictures. When considering that the vegetation cover or buildings may affect the accuracy of experimental SMC, the soil samples were obtained at positions near approximate locations, where they were only covered by bare natural soil. The samples are collected by cutting a ring the size of 180 cm3 (φ 60 mm × 60 mm). The depth of the soil sample ranged from 5 cm to 10 cm. Then, the cutting rings with soil samples were weighed immediately. Because every cutting ring is weighed before soil sampling, the difference between two weights will be the wet soil weight at natural states. In the labs, the soil samples were put into the vacuum oven and heated to 110 °C. After 12 h, the samples were taken out and were weighed again. The difference between the dry samples and natural samples was the water weight . Figure 2 shows the total experimental procedures including obtaining and weighing the soil samples. Then, the SMC of every soil sample can be calculated using Equation (1) below, and the magnitudes of SMC obtained after calculation are shown in Figure 3. Intuitively, the results show that the scope of the SMC ranges mostly from 5 to 20%.
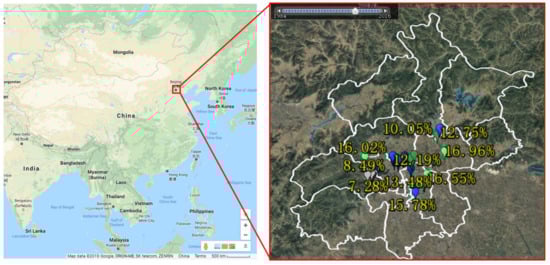
Figure 1.
The 50 position points of the selected samples for lab tests.

Figure 2.
The experimental procedures for obtaining soil samples and calculating the soil moisture content (SMC).
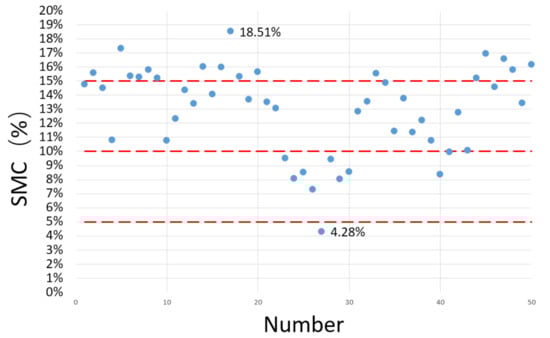
Figure 3.
The SMC values of samples of 50 different positions after lab tests.
2.2. Processing of Remote Sensing Images
When using machine learning algorithms to inverse SMC, the result accuracy is always directly proportional to the data quantity of the training set. Due to the fact that real-time remote sensing data cannot be obtained promptly, we can select the corresponding data with similar weather conditions within three days, which can be utilized easily and satisfy enough of the engineering demands. Therefore, we settled with X for the date of the remote sensing data because the date of obtaining soil samples was 2 August 2017. Furthermore, the remote sensing data that contained local SMC distribution characteristics can be regarded as the training set and validation set for machine learning.
The remote sensing data to inverse SMC are mostly concentrated on MODIS data and microwave remote sensing data [28,29]. MODIS data can be used for real-time dynamic monitoring on regional or national SMC, but its spatial resolution is small (0.25 km–1 km), which leads to large inversion errors. Although microwave remote sensing has high monitoring accuracy, microwave remote sensing data has a large error in the inversion accuracy due to vegetation, ground surface roughness, and soil texture [30]. The data sources, such as IKONOS and QUICKBIRD with high accuracy, are too expensive to be practical, which limits their application in monitoring SMC to some extent. Therefore, in our study, we use the most widely used data source Landsat5 with medium resolution (30 m) to inverse the SMC values. The remote sensing data image in this paper comes from Chinese geographic data space cloud (http://www.gscloud.cn/).
The Landsat5 data include six wave bands, where TM5 belonged to the mid-infrared wave band with wavelengths ranging from 1.55 μm to 1.75 μm. The wavelength of TM5 exactly matched the water absorption band (1.4–1.9 μm), so it is suitable for detecting the SMC distribution. Therefore, in our study, we established a linear mapping relationship between remote sensing data from TM5 and 8-bit grayscale data. Then, according to the relationship between SMC in field sampling positions and their corresponding grayscale data, the SMC values of the position points around field sampling were able to be deduced. Because other wavebands can also reflect SMC, so the inversion process is carried out with these six wave bands. At the same time, when considering that the increase of the training set array may be helpful to improve the accuracy of machine learning, we obtained six series of grayscale data from six wave bands and then compared the results of different training sets with or without grayscale data. This way, we were able to analyze the influence of different training sets on the results of machine learning. In order to eliminate the influence of the atmosphere and light on the reflection of objects and to obtain accurate physical parameters, such as object reflectivity, emissivity, or ground surface temperature, we used ENVI’s FLAASH module to make atmospheric corrections for the remote sensing images. FLAASH is an atmospheric correction module developed by the world-class optical imaging research institute—Spectral Sciences Inc. It is a widely used atmospheric correction model for the inversion of hyperspectral radiometric energy image reflectivity. FLAASH can precisely eliminate atmospheric effects, and it is applicable when the wavelength ranges from visible light to near infrared, and the maximum wavelength is 3 μm. Therefore, this model can be utilized for the atmospheric correction of the Landsat5 remote sensing data.
2.3. Machine Learning
2.3.1. Support Vector Classifier (SVC)
SVCs are frequently used in concentration prediction [31,32]. The structure of an SVC is illustrated in Figure 4. The training data for an SVC is usually represented as . The goal of an SVC is to find a function that has the most deviation from the actually obtained targets for all of the training data, and at the same time, makes it as flat as possible. It can be described as the following linear functions: . The flatness means that one seeks a small . Then, a convex optimization problem introducing slack variables is given as
here, and are slack variables. The constant determines the trade-off between the flatness of and the amount up to which deviations larger than are tolerated.
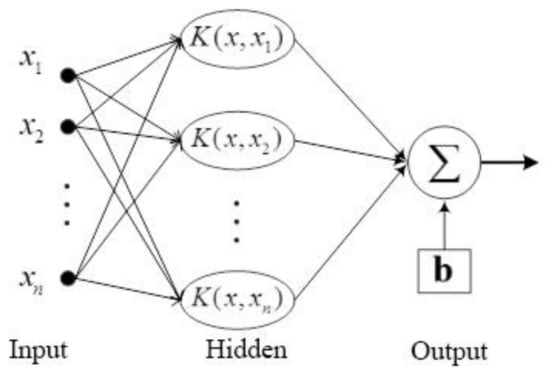
Figure 4.
The logical process of support vector classifier (SVC) machine learning.
A Lagrange function from the objective function and the corresponding constraints is constructed.
where and are Lagrange multipliers, and can be completely described as . Thus, the regression function is
In addition, the non-linearity can be resolved by simply preprocessing the training patterns by a map into a high dimensional feature space where linear regression is performed. The kernel approach is employed to address the curse of dimensionality. In this paper, we chose the Gaussian kernel function
where denotes the squared Euclidean distance between vectors and is a free parameter. The non-linear representation can be given as
2.3.2. Decision Tree
A decision tree is a flowchart-like structure in which each internal node represents a “test” on an attribute, each branch represents the outcome of the test, and each leaf node represents a class label [33,34]. The paths from the root to leaf represent classification rules. In this paper, the decision tree algorithm is used for comparison with other experiments.
2.3.3. K-Nearest Neighbors Algorithm (k-NN)
In pattern recognition, k-nearest neighbors algorithm (k-NN) is a non-parametric method used for classification and regression [35,36]. In both cases, the input consists of the k closest training examples in the feature space. The output depends on whether k-NN is used for classification or regression. In k-NN classification, the output is a class membership. An object is classified by a majority vote of its neighbors, with the object being assigned to the class that is most common among its k nearest neighbors (k is a positive integer, typically small). If k = 1, then the object is simply assigned to the class of that single nearest neighbor. In the classification phase, k is a user-defined constant, and an unlabeled vector (a query or test point) is classified by assigning the label that is most frequent among the k training samples nearest to that query point.
k-NN is a type of instance-based learning and it is the simplest algorithm of machine learning. The training examples are vectors in a multidimensional feature space, each with a class label. The training phase of the algorithm consists only of storing the feature vectors and the class labels of the training samples. In this paper, the k-NN algorithm is used for comparison with other experiments.
3. Results
3.1. Results of the Three Methods and Two Data Resources
In this paper, with 2500 remote sensing data used as the training set and 502 remote sensing data used as the validation set, the machine learning is carried out on six wave bands of remote sensing data from Landsat4–5 covering the whole Beijing area in terms of the SVC algorithm, decision tree algorithm, and k nearest neighbor algorithm, respectively. The SMC values can be divided into four categories, including “<15%”, “15–20%”, “20–25%”, and “>25%”. The reason for this classification is that most of the SMC values are less than 25% according to the above experimental results and because the soil in which the SMC values are more than 25% can be treated as water. Additionally, the soil in which the SMC values are less than 15% can be treated as roads and buildings. The validation set results with the SVC are shown in Table 1. The accuracy results combining different algorithms with different training sets are shown in Figure 5.

Table 1.
The validation set with (or without) grayscale data and its calculated results by SVC.
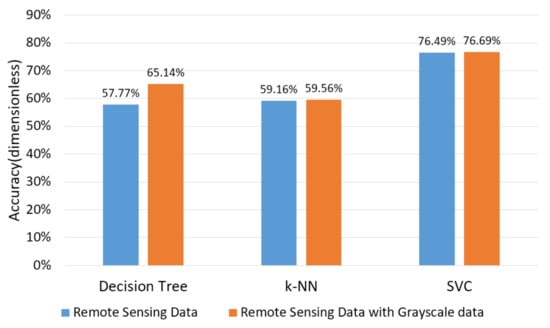
Figure 5.
The accuracy of the calculated results with different algorithms and training sets.
3.2. SMC Distribution in Beijing
Figure 6a shows the remote sensing image of Landset5 for the whole Beijing area. Figure 6b shows the distribution of SMC in the Beijing area after machine learning. The four different colors represent soils with different SMCs. When compared with Figure 6b, there is little difference for the locations of water in both images, indicating that machine learning can generally be suitable for the inversion of SMC distribution according to the six wave bands of remote sensing.
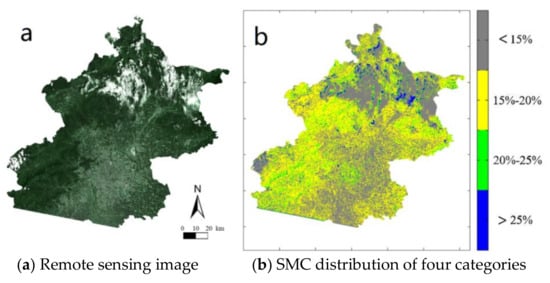
Figure 6.
The remote sensing image on the 2 August 2008 and SMC distribution in Beijing.
3.3. SMC Distribution for Different Districts in Beijing
The SMC distribution of urban districts in Beijing is one of the core issues for the Beijing sponge city research. The following figures show the characteristics of SMC distribution in six urban districts in Beijing. Figure 7, Figure 8, Figure 9, Figure 10, Figure 11 and Figure 12 show the SMC distributions and the corresponding remote sensing images in different urban districts, including the Dongcheng District, the Xicheng District, the Haidian District, the Chaoyang District, the Fengtai District, and the Shijingshan District, where subsection a of Figure 7, Figure 8, Figure 9, Figure 10, Figure 11 and Figure 12 show the remote sensing image of the Landset5 in the corresponding districts, and subsection b of Figure 7, Figure 8, Figure 9, Figure 10, Figure 11 and Figure 12 show the distribution of the SMC in the corresponding districts.
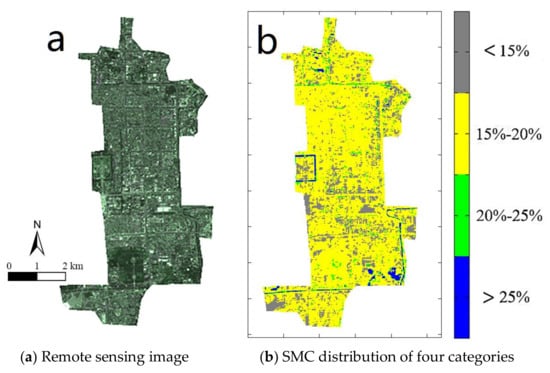
Figure 7.
(a) The remote sensing image and (b) SMC distribution in the Dongcheng District.
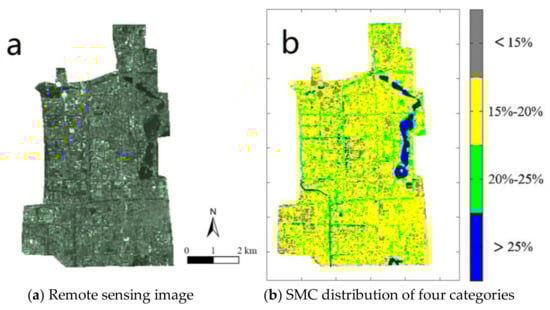
Figure 8.
(a) The remote sensing image and (b) SMC distribution in the Xicheng District.
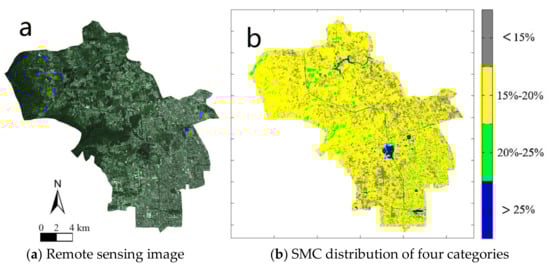
Figure 9.
(a) The remote sensing image and (b) SMC distribution in the Haidian District.
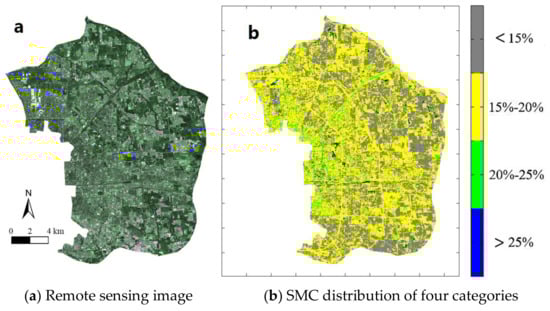
Figure 10.
The remote sensing image and SMC distribution in the Chaoyang District.
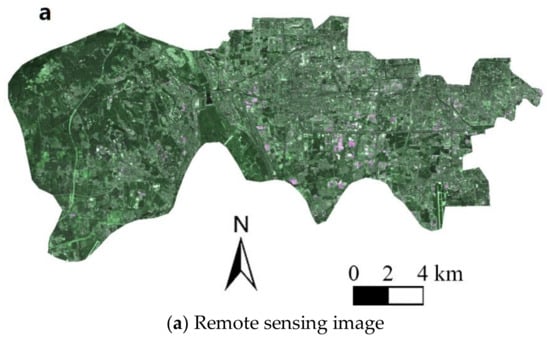
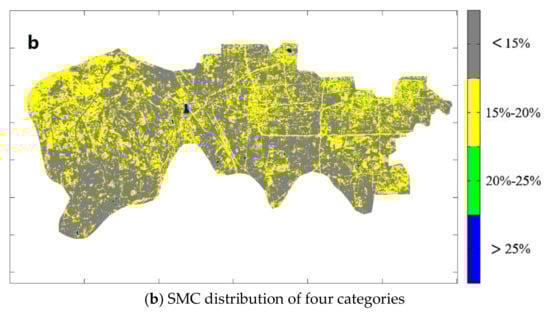
Figure 11.
(a) The remote sensing image and (b) SMC distribution in the Fengtai District.
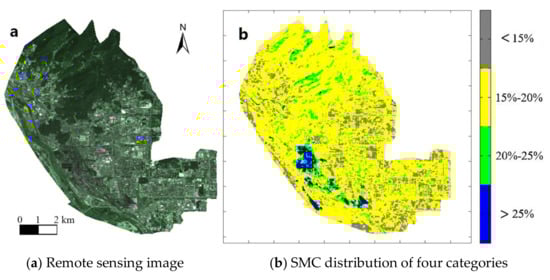
Figure 12.
The remote sensing image and SMC distribution in the Shijingshan District.
The figures above were listed as pairs and the characteristics of every district, such as the lakes, forests, buildings, and roads, can be strongly revealed. However, for example, the SMC at different positions of the same area of forest may be calculated as different results. These differences may only be obtained from machine learning, but they cannot be derived from the normal remote sensing data.
4. Discussion
From Figure 5, the accuracy of the validation set data is 76.69%, as obtained by the SVC method, which is 18% higher than other two methods, on average. The accuracy of the training set with grayscale data is 2.6% higher than that of the training set without grayscale data, on average.
Furthermore, based on the following Equation (7), the weighted arithmetic mean of SMC in the whole Beijing area can be obtained:
where is mean SMC, is the percentage of SMC soil area in the whole area, and is mean SMC of SMC soil. According to the above equation, the mean SMC value in the Beijing area is 15.65%.
In addition, the corresponding mean SMC values of nine urban districts in Beijing can also be obtained in terms of Equation (7). Table 2 shows the values of the mean SMC values of the nine districts.
Table 2.
The mean values of SMC in the nine districts and Beijing.
From Figure 6 and Table 2, we can know the SMC values in the entire Beijing area and in the nine urban districts. The SMC values of five districts (Dongcheng, Xicheng, Haidian, Shijingshan, and Changping) in the northwest of Beijing are relatively high; they are 16.92%, 19.94%, 16.94%, 17.79%, and 18.09%, respectively. The SMC values of the Chaoyang District and Tongzhou District in the east are moderate; they are 14.78% and 14.13%, respectively. However, the SMC values of the Fengtai District and Daxing District are relatively low; they are 11.52% and 11.04%, respectively. The districts with the highest and lowest SMC values in Beijing are Xicheng District 19.94% and Daxing District 11.04%, respectively. The reason leading to this kind of SMC distribution may be that there is a relatively large green area in the northwest districts, while in the southeast, the green area is relatively small. Therefore, it is suggested that the proportion of the artificial landscape construction should be increased in the western and northern areas, while in the southern area of Beijing, there should be more water-holding facilities, such as reservoirs and parks to protect the water resources in the soil.
Machine learning is not a theoretical calculation which is a summary of actual physical laws, but an intelligent exploration for unknown relationships between physical variables, so there is an uncertainty during the machine learning process. Similarly, the uncertainty exists during the field sample position selection and laboratory test processes. Therefore, for the entire analysis process, there are two uncertainty factors: the uncertainty of the experimental results and the numerical error during machine learning. Statistical analysis of the experimental data shows that the uncertainty of the experimental data is −10%–+10%, while the uncertainty of the machine learning process is the error of the calculation results, which is −24%–+24%. Therefore, the uncertainty of the entire analysis process is −34%–+34%.
5. Conclusions
By combining remote sensing data with experimental data, this paper introduces machine learning methods to traverse the SMC for the entire Beijing area and sets up a suitable machine learning model. Using the remote sensing data as the training and validation set, the SMC values were obtained and the SMC distribution characteristics were analyzed for the Beijing area, and then we put forward advice for the further development of sponge city construction in Beijing.
When comparing the three different machine learning methods, it can be concluded that the SVC method trained using remote sensing and grayscale data can achieve the highest accuracy, which can reach 76.69%. Furthermore, the SMC distribution characteristics in Beijing can be analyzed. According to the weighted mean method, the mean SMC value for the Beijing area is 15.65%. The districts with the highest and lowest SMC value in Beijing are the Xicheng District (19.94%) and the Daxing District (11.04%), respectively. The SMC values in most of the districts northwest are relatively high, the SMC values of some districts in the east are moderate, and the SMC values of districts in the southeast and south are relatively low. Thus, the SMC distribution characteristics in Beijing show that the soil in the west and north are relatively wet, while the soil in east and south are relatively dry. In addition, based on an uncertainty analysis, the uncertainty of the machine learning model ranged in between −34% and +34% under a confidence interval of ±95%. The uncertainty results indicate that the model is feasible and acceptable for SMC analysis in the large-scale area, according to remote sensing data and field sampling data.
Therefore, according to the results above, the SMC at the forests in the north and west are generally high. The soil with high SMC will be much more soft and loose. Landslides and other disasters may probably occur in these areas under heavy precipitation conditions. Therefore, timely monitoring of the SMC for vegetation in mountain areas is suggested. The SMC values of the south and east are low. Most soils are covered by roads and buildings. This kind of soil is not suitable for rain seepage. Therefore, with the development of city construction and water conservation facilities, such as reservoirs and parks, need to be established in order to protect water resources. Furthermore, the city’s carrying capacity for heavy precipitation should be improved in order to reduce the risk of disaster events in the central city zones.
Acknowledgments
The authors are grateful for financial support from the Beijing Nova Program under Grant No. Z171100001117081 and the Fundamental Research Funds for the Central Universities under Grant No. FRF-TP-17-001C1.
Author Contributions
Hongqing Song and Yi Xing designed the project; Yue Qu performed the analysis and led the writing of this paper; Xu Qian and Zhengyi Li helped set up the mathematical model for the research; and Jinqiang Tan conducted related experiments and contributed to the writing of the paper.
Conflicts of Interest
The authors declare no conflict of interest.
References
- Li, H.; Ding, L.; Ren, M.; Li, C.; Wang, H. Sponge city construction in China: A survey of the challenges and opportunities. Water 2017, 9, 594. [Google Scholar] [CrossRef]
- Dai, L.; van Rijswick, H.F.; Driessen, P.P.; Keessen, A.M. Governance of the Sponge City Programme in China with Wuhan as a case study. Int. J. Water Resour. Dev. 2017, 12, 11–19. [Google Scholar] [CrossRef]
- Xia, J.; Zhang, Y.; Xiong, L.; He, S.; Wang, L.; Yu, Z. Opportunities and challenges of the Sponge City construction related to urban water issues in China. Sci. China Earth Sci. 2017, 60, 652–658. [Google Scholar] [CrossRef]
- Jia, H.; Wang, Z.; Zhen, X.; Clar, M.; Shaw, L.Y. China’s Sponge City construction: A discussion on technical approaches. Front. Environ. Sci. Eng. 2017, 11, 18. [Google Scholar] [CrossRef]
- Li, T.; He, B.; Chen, Z.; Zhang, Y.; Liang, C.; Wang, R. Effects of gravel on infiltration, runoff, and sediment yield in landslide deposit slope in Wenchuan earthquake area, China. Environ. Sci. Pollut. Res. 2016, 23, 12075–12084. [Google Scholar] [CrossRef] [PubMed]
- Brye, K.R.; McMullen, R.L.; Silveira, M.L.; Motschenbacher, J.M.D.; Smith, S.F.; Gbur, E.E.; Helton, M.L. Environmental controls on soil respiration across a southern US climate gradient: A meta-analysis. Geoderma Reg. 2016, 7, 110–119. [Google Scholar] [CrossRef]
- Park, J.; Baik, J.; Choi, M. Satellite-based crop coefficient and evapotranspiration using surface soil moisture and vegetation indices in Northeast Asia. Catena 2017, 156, 305–314. [Google Scholar] [CrossRef]
- Feng, Q.; Zhao, W.; Fu, B.; Ding, J.; Wang, S. Ecosystem service trade-offs and their influencing factors: A case study in the Loess Plateau of China. Sci. Total Environ. 2017, 607, 1250–1263. [Google Scholar] [CrossRef] [PubMed]
- Beattie, R.E.; Henke, W.; Davis, C.; Mottaleb, M.A.; Campbell, J.H.; McAliley, L.R. Quantitative analysis of the extent of heavy-metal contamination in soils near Picher, Oklahoma, within the Tar Creek Superfund Site. Chemosphere 2017, 172, 89–95. [Google Scholar] [CrossRef] [PubMed]
- Zhang, Y.W.; Shangguan, Z.P. The coupling interaction of soil water and organic carbon storage in the long vegetation restoration on the Loess Plateau. Ecol. Eng. 2016, 91, 574–581. [Google Scholar] [CrossRef]
- Meng, S.; Xie, X.; Liang, S. Assimilation of soil moisture and streamflow observations to improve flood forecasting with considering runoff routing lags. J. Hydrol. 2017, 550, 568–579. [Google Scholar] [CrossRef]
- Pelletier, J.D.; Malamud, B.D.; Blodgett, T.; Turcotte, D.L. Scale-invariance of soil moisture variability and its implications for the frequency-size distribution of landslides. Eng. Geol. 1997, 48, 255–268. [Google Scholar] [CrossRef]
- Mueller, B.; Seneviratne, S.I. Hot days induced by precipitation deficits at the global scale. Proc. Natl. Acad. Sci. USA 2012, 109, 12398–12403. [Google Scholar] [CrossRef] [PubMed]
- Nicolai-Shaw, N.; Zscheischler, J.; Hirschi, M.; Gudmundsson, L.; Seneviratne, S.I. A drought event composite analysis using satellite remote-sensing based soil moisture. Remote Sens. Environ. 2017, 203, 216–225. [Google Scholar] [CrossRef]
- Huisman, J.A.; Sperl, C.; Bouten, W.; Verstraten, J.M. Soil water content measurements at different scales: Accuracy of time domain reflectometry and ground-penetrating radar. J. Hydrol. 2001, 245, 48–58. [Google Scholar] [CrossRef]
- Alamry, A.S.; van der Meijde, M.; Noomen, M.; Addink, E.A.; van Benthem, R.; de Jong, S.M. Spatial and temporal monitoring of soil moisture using surface electrical resistivity tomography in Mediterranean soils. Catena 2017, 157, 388–396. [Google Scholar] [CrossRef]
- Pohn, H.A.; Offield, T.W.; Watson, K. Thermal inertia mapping from satellite-discrimination of geologic units in Oman. J. Res. US Geol. Surv. 1974, 2, 147–158. [Google Scholar]
- Wang, J.R.; O’Neill, P.E.; Jackson, T.J.; Engman, E.T. Multifrequency measurements of the effects of soil moisture, soil texture, and surface roughness. IEEE Trans. Geosci. Remote Sens. 1983, 21, 44–51. [Google Scholar] [CrossRef]
- Kędzior, M.A.; Zawadzki, J. SMOS data as a source of the agricultural drought information: Case study of the Vistula catchment, Poland. Geoderma 2017, 306, 167–182. [Google Scholar] [CrossRef]
- Zawadzki, J.; Przeździecki, K.; Miatkowski, Z. Determining the area of influence of depression cone in the vicinity of lignite mine by means of triangle method and LANDSAT TM/ETM+ satellite images. J. Environ. Manag. 2016, 166, 605–614. [Google Scholar] [CrossRef] [PubMed]
- Seneviratne, S.I.; Corti, T.; Davin, E.L. Investigating soil moisture–climate interactions in a changing climate: A review. Earth Sci. Rev. 2010, 99, 125–161. [Google Scholar] [CrossRef]
- Yarkoni, T.; Westfall, J. Choosing prediction over explanation in Psychology: Lessons from machine learning. Perspect. Psychol. Sci. 2017, 12, 1100–1122. [Google Scholar] [CrossRef] [PubMed]
- Arevalillo, J.M.; Sztein, M.B.; Kotloff, K.L.; Levine, M.M.; Simon, J.K. Identification of immune correlates of protection in Shigella infection by application of machine learning. J. Biomed. Inform. 2017, 74, 1–9. [Google Scholar] [CrossRef] [PubMed]
- Jin, X.; Wang, J.; Chu, T.; Xia, J. Knowledge source strategy and enterprise innovation performance: Dynamic analysis based on machine learning. Technol. Anal. Strateg. Manag. 2018, 30, 71–83. [Google Scholar] [CrossRef]
- Liu, S.F.; Liou, Y.A.; Wang, W.J.; Wigneron, J.P.; Lee, J.B. Retrieval of crop biomass and soil moisture from measured 1.4 and 10.65 GHz brightness temperatures. IEEE Trans. Geosci. Remote Sens. 2002, 40, 1260–1268. [Google Scholar]
- Rodriguez-Galiano, V.F.; Ghimire, B.; Rogan, J.; Chica-Olmo, M.; Rigol-Sanchez, J.P. An assessment of the effectiveness of a random forest classifier for land-cover classification. ISPRS J. Photogramm. Remote Sens. 2012, 67, 93–104. [Google Scholar] [CrossRef]
- Wang, K.; Wang, L.; Wei, Y.M.; Ye, M. Beijing storm of July 21, 2012: Observations and reflections. Nat. Hazards 2013, 67, 969–974. [Google Scholar] [CrossRef]
- Cai, G.; Xue, Y.; Hu, Y.; Wang, Y.; Guo, J.; Luo, Y.; Wu, C.; Zhong, S.; Qi, S. Soil moisture retrieval from MODIS data in Northern China Plain using thermal inertia model. Int. J. Remote Sens. 2007, 28, 3567–3581. [Google Scholar] [CrossRef]
- Wigneron, J.P.; Calvet, J.C.; Pellarin, T.; Van de Griend, A.; Berger, M.; Ferrazzoli, P. Retrieving near-surface soil moisture from microwave radiometric observations: Current status and future plans. Remote Sens. Environ. 2003, 85, 489–506. [Google Scholar] [CrossRef]
- Bindlish, R.; Barros, A.P. Parameterization of vegetation backscatter in radar-based, soil moisture estimation. Remote Sens. Environ. 2001, 76, 130–137. [Google Scholar] [CrossRef]
- Xu, L.; He, J.; Duan, S.; Wu, X.; Wang, Q. Comparison of Machine Learning algorithms for concentration detection and prediction of formaldehyde based on Electronic Nose. Sens. Rev. 2016, 36, 207–216. [Google Scholar] [CrossRef]
- Tapkın, S.; Şengöz, B.; Şengül, G.; Topal, A.; Özçelik, E. Estimation of polypropylene concentration of modified bitumen images by using k-NN and SVM classifiers. J. Comput. Civ. Eng. 2013, 29, 04014055. [Google Scholar] [CrossRef]
- Parvin, H.; MirnabiBaboli, M.; Alinejad-Rokny, H. Proposing a classifier ensemble framework based on classifier selection and decision tree. Eng. Appl. Artif. Intell. 2015, 37, 34–42. [Google Scholar] [CrossRef]
- Liu, X.; Li, Q.; Li, T.; Chen, D. Differentially private classification with decision tree ensemble. Appl. Soft Comput. 2018, 62, 807–816. [Google Scholar] [CrossRef]
- Altman, N.S. An introduction to Kernel and Nearest-Neighbor Nonparametric Regression. Am. Stat. 1992, 46, 175–185. [Google Scholar]
- Ruan, Y.; Xue, X.; Liu, H.; Tan, J.; Li, X. Quantum Algorithm for K-Nearest Neighbors Classification Based on the Metric of Hamming Distance. Int. J. Theor. Phys. 2017, 56, 3496–3507. [Google Scholar] [CrossRef]
© 2018 by the authors. Licensee MDPI, Basel, Switzerland. This article is an open access article distributed under the terms and conditions of the Creative Commons Attribution (CC BY) license (http://creativecommons.org/licenses/by/4.0/).