1. Introduction
Economic assessment of climate adaptation has gained growing attention in recent years as a result of the increasing flood risk due to increases in climatic extremes in many regions of the world. Assessment of adaptation strategies often requires a comprehensive risk-based economic analysis to indicate the efficiency of proposed options [
1,
2,
3]. The core of such an analysis is a flood risk assessment framework employing a GIS-based risk model for assessing the Expected Annual Damage (EAD) based on a combined analysis of hazard and vulnerability [
4]. This type of risk model has been typically used for establishing the flood hazard and risk maps, as required in, e.g., the EU Floods Directives [
5]. External drivers, such as climate change impacts and development of socio-economic activities, are likely to influence the risk level over time and subsequently induce changes in the corresponding costs and benefits [
6]. Potential adaptation options, aiming to manage the changing risks, may influence both the external drives and the system risk level.
The analysis is complicated by the large uncertainties associated with the assessment of the present and future hazard and vulnerability conditions, and also relies heavily on the quality of the input data at the regional/local scale [
7,
8,
9]. As a result, the final estimate is in fact a very uncertain outcome representing a propagation of all associated uncertainties in the analysis [
10,
11]. To identify robust adaptation options in light of the information typically available, a better understanding of the roles and impacts of different uncertainties in the analysis is required. Especially, when planning adaptation strategies a comparative assessment between a number of scenarios is often constructed in order to identify the ‘best’ solution. Uncertainties of different scenarios may affect the decision making in different manners.
Our current work is inspired by Freni et al. [
12] who explored the uncertainty of predicting losses at 10 flood events recorded in an urban catchment in Italy by considering both hazards and vulnerabilities. They find that the damage costs are dominating the overall uncertainty. Several other studies have confirmed that this uncertainty is high [
13,
14], and is also compared to the uncertainty of modelling the hazards [
15]. Löwe et al. [
16] explored the overall uncertainty by defining a number of scenarios and possible variable outcomes and from that calculate both the overall uncertainty and the efficiency of different strategies by presenting resulting flood risk indicators as box plots as a measure of resulting resilience. Albano et al. [
15] used the same method for exploring the uncertainty, but focused on attributing the risk in relation to the uncertainty of the variables. Since they study a particular event, they considered the runoff volume as known, and hence the hazard uncertainty was only quantified by DEM resolution and the roughness of the surface. The uncertainty of the damage functions was explored by choosing among 14 different sets of depth-damage curves.
The purpose of this paper is to explore the overall uncertainty of making decisions and attribute this uncertainty to the epistemic and aleatory uncertainties that are inherent in flood risk assessments. It is accomplished by extending a previously published framework for flood risk assessments to estimate density functions for all the key inputs with the aim of exploring whether robust decision-making is possible even in light of large uncertainties. We assume that decision-making is often done in two separate steps, first, deciding if an action needs to be taken here and now, and secondly, by assessing what types of actions are feasible, which is also discussed by authors promoting flexible adaptation options [
17,
18].
2. Materials and Methods
The methodology estimates propagation of uncertainty sources through an urban flood risk framework that considers climate change impacts and adaptation costs and benefits based on calculations of Net Present Value (
NPV) of adaptation options, as described by Zhou et al. [
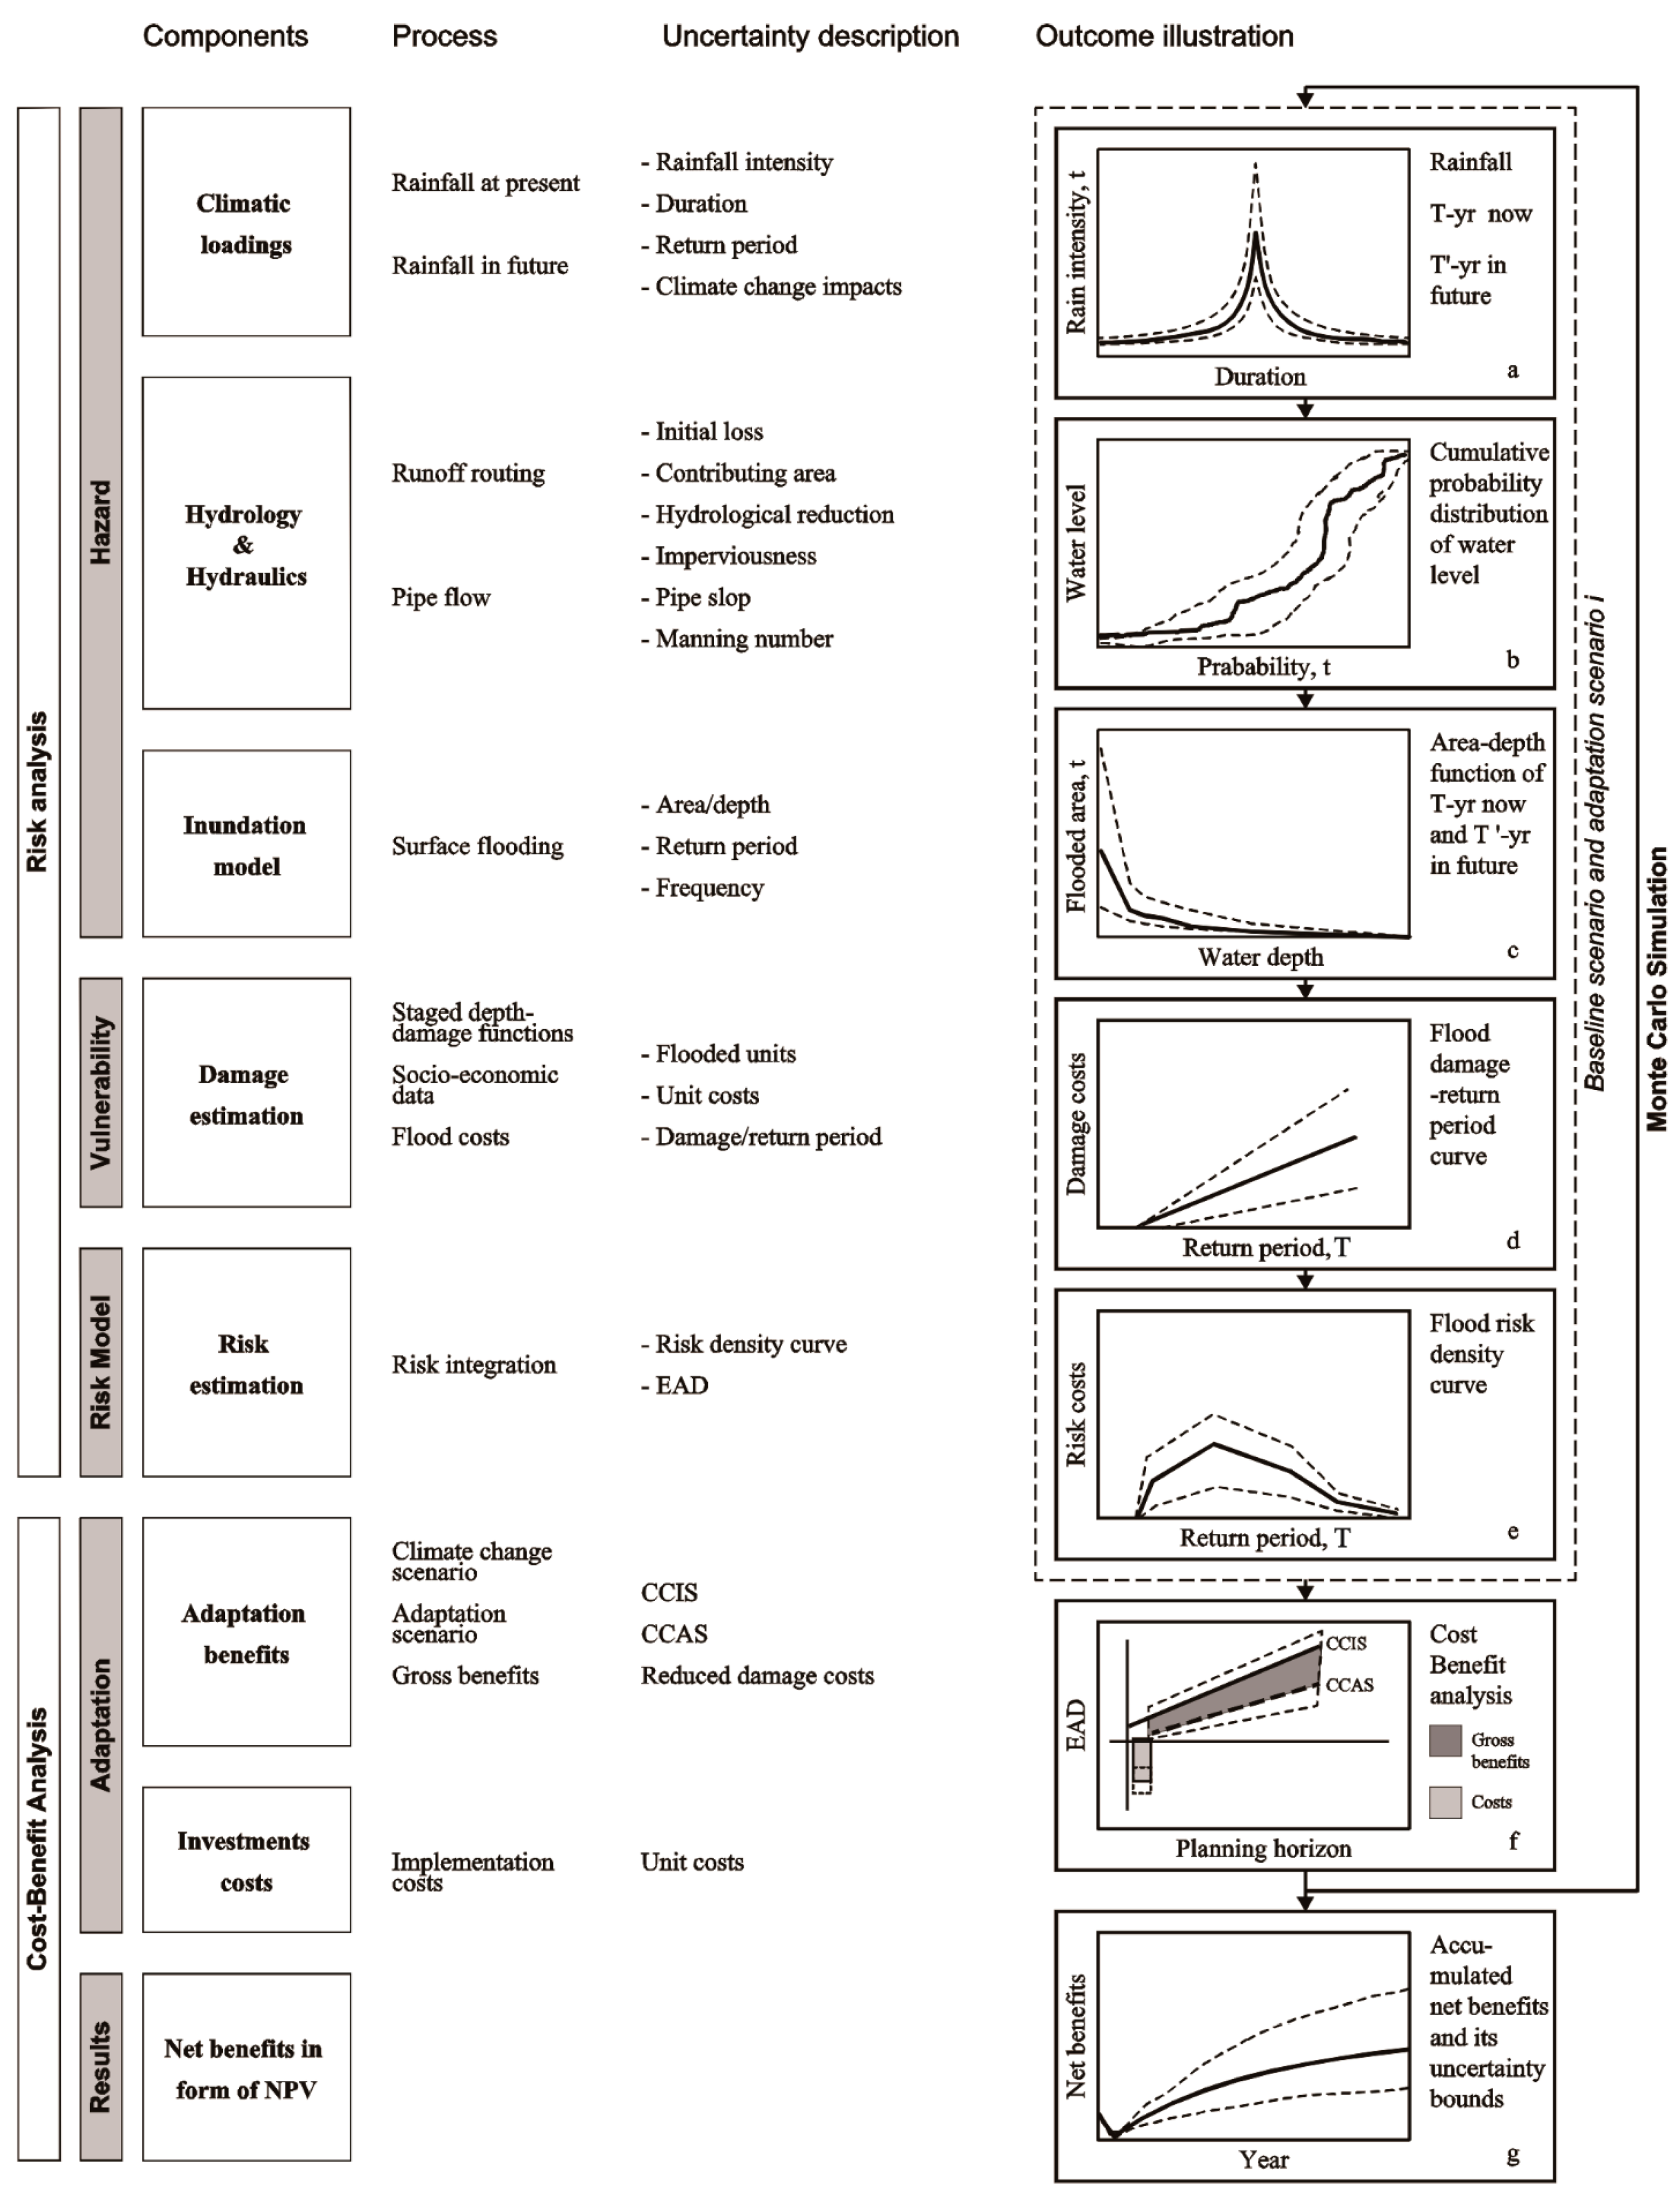
19]. The propagation is based on Monte Carlo simulations with variations in key aggregated processes and variables rather than varying all the variables individually. It is supplemented with a sensitivity analysis of what uncertainties matter the most in relation to key decision-making indicators. The entire method is illustrated in
Figure 1. In the following, it is described how each of the modeling steps in
Figure 1 is executed and the key indicators of decision-making are defined. In order to present the framework in as short a manner as possible, the data used to construct the uncertainty bounds are presented at the end of this section.
2.1. Hazard Assessment
2.1.1. Precipitation Loads under Present and Future Climate
Rainfall is the driving force of pluvial flooding. For typical urban drainage design, input rainfall is obtained from a regional intensity-duration-frequency (IDF) relationship, which is estimated based on a comprehensive statistical analysis of historical rainfall measurements from high-resolution rain gauges [
20]. In this study, design rainfalls based on the Chicago Design Storm (CDS) principle are derived for different return periods,
T, including uncertainty estimates by following the guidelines for the use of rainfall data in Denmark [
20,
21].
Precipitation extremes will be influenced by human emissions of greenhouse gases (GHG), leading to more frequent and extreme storms [
6]. This implies that a given extreme value will correspond to a decreasing return period as a function of time. Hence, it is possible to calculate the return period of any design storm in the future at time
t as a function of the current return period.
Often, the rate of change of the precipitation extremes are described by so-called climate factors,
Cf, a variable that explains the relative change of the amount of rainfall for a given duration, frequency, and projection horizon [
22]. There are considerable uncertainties related to the estimation of climate factors, including uncertainties from global and regional climate model simulations, the choice of temporal and spatial resolutions, the input parameters and scenarios, downscaling and extrapolation methods for urban hydrology applications [
23,
24].
Figure 1a addresses not only the uncertainty bounds of input rainfall intensities, but also the changes in return periods owing to climate change impacts.
2.1.2. Hydrological and Hydraulic Processes
The hydrological and hydraulic simulation is performed by means of the software Mike Urban [
25]. In terms of the hydrological runoff relationship, the input volumetric runoff and the catchment reaction speed are described by a few dominant parameters, such as the hydrological reduction factor, imperviousness, and time of concentration. The hydraulic response is computed by a sewer model based on the 1-D Saint Venant equation, where input Manning number and pipe slope have important impacts on the pipe flow conditions [
26,
27]. In many cases, the use of these hydrological and hydraulic parameters suffers from limited measurements and is therefore often adopted and interpreted for regional applications. As a result of the aggregated uncertainties from both the rainfall and the hydrological and hydraulic processes, the water level in manholes of a certain input return period at time
t can be described with a cumulative probability distribution, as indicated in
Figure 1b. The actual level of uncertainty will, to a high degree, be dependent on regional practices for setting up such models, and hence it seems reasonable to adopt regional estimates for this type of uncertainty.
2.1.3. Inundation Modelling
The surface flooding is computed using the software Mike Flood by coupling a 2D inundation model with the 1D sewer model. The modeling result is a snap shot depicting the extent and magnitude (maximum water depth calculated within the simulation period) of the overland flow at a given point in time. While mathematical methods have been improved for both models, in practice, simplified approaches are often adopted due to limited knowledge on system setup as well as heavy computing demand of the advanced methods [
12,
28,
29]. The digital terrain model (DTM) represents the catchment topography in a grid system and may introduce important uncertainties in flood modelling and hazard mapping due to, e.g., inaccurate illustrations of building polygons and linear elements [
9,
28]. The inundation maps, generated based on the input DTM, can therefore be uncertain in both depth and extent estimations of floods and lead to indirect uncertainties on inundation volume estimates. As shown in
Figure 1c, the outcome of a hazard analysis can be described by a stage-depth relationship, showing the flooded area as a function of flow depth for a given return period
T. Uncertainty bounds of such a relationship is therefore an accumulated result of uncertainty propagation throughout the entire hazard assessment.
2.2. Vulnerability Assessment
2.2.1. Stage-Damage Functions
Knowing the extent and magnitude of a flooding allows for the estimation of damage costs of a given climatic loading. This is typically done by applying a so-called staged depth-damage function relating flood damage with inundation depths [
10,
12]. Estimation of such functions is inherently uncertain, often due to limited observations, highly heterogeneous costs in urban areas, and poor knowledge of variation of studied damage. Hence, depth-damage functions are largely unavailable for many urban land use types. Additionally, for this reason, we have adopted a binary threshold approach as a simplification of the stage-damage functions by distinguishing between flooded and non-flooded assets based on a formulation of a single threshold,
Th [
19]. That means, for each damage class,
k, we only count the number of flooded units,
Nk, above a certain threshold,
Thk, and a uniform cost will be assigned accordingly, as discussed in the following section. Such a type of ‘threshold principle’ simplifies the distribution of damage costs across the area and therefore cannot fully represent the large variability in damage assessment of the various vulnerabilities.
2.2.2. Unit Costs
Unit costs,
Uk, are necessary to estimate economic losses on a basis of calculated flooded units. Insurance and governmental databases are the main sources of such types of data, which in general provide a meso-level estimation involving uncertainties due to regional aggregation [
9]. Damage caused by floods comes in different categories, such as tangible and intangible damage [
30]. On a local scale, it is often difficult to find accurate unit costs for the various damage categories due to the complexity of urban context and expert judgment is therefore used in many cases [
12]. In particular, when estimating the underlying economic value of intangible goods, a high uncertainty is associated with the measurement of people’s preferences and the conversion into monetary terms [
13].
2.2.3. Flood Damage-Return Period Curve
Based on evaluations of flooded units,
Nk, and unit costs,
Uk, the total damage costs of a given return period,
DT, can be calculated as a summary of costs of all damage categories,
k [
4]:
This calculation will be performed for a range of return periods to construct a flood damage-return period curve describing damage costs as a function of return periods. Calculation of the EAD can be based on only a few return periods when assuming a log-linear relationship between return periods and total damage costs [
19]. This approach in principle adds uncertainty to the overall framework, however, appears to be negligible [
4].
Figure 1d shows an example of the flood damage-return period curve and its associated uncertainty bounds.
2.3. Risk Assessment
Flood risk at year
t, expressed as the Expected Annual Damage,
EADt, for a given area,
A, can be calculated as:
where we introduce the exceedance probability,
p = 1/
T, and a new subscript on the damage cost of a given return period to highlight the dependence of flood risk over time.
As a result, with a probability description of the investigated return periods and the corresponding damage costs calculated from the damage-return period curves, it is possible to establish a flood risk density curve for any given point in time
t, see
Figure 1e. The area under the curve corresponds to the EAD in accordance with the terminology suggested by, e.g., Morita [
31]. The uncertainty quantified for the risk density curve (
Figure 1e) combines all uncertainties from the hazard and vulnerability assessments for present time as well as the projected future. The combined uncertainty is thus transformed into the EAD estimates used in the subsequent economic analysis of climate adaptation benefits.
2.4. Indicators of Feasibility of Climate Change Adaptations
A cost-benefit analysis (CBA) is applied to assess the net benefits of adaptation options by summarizing their gross benefits (
Bt) and costs (
Ct) into present values, see Equation (3). A planned adaptation will yield benefits in the form of reduced costs of damage from the climate change adaptation scenario (CCAS) when compared to the climate change impacts scenario (CCIS) where no adaptation measure is implemented. The cost of an adaptation,
C, refers to costs associated with implementing the planned adaptation. The Net Present Values of an adaptation measure
i,
NPVi, is hence calculated as:
where
t0 and
te are the start and end year of the project horizon, respectively, and
r denotes the applied discount rate in the assessment. Large uncertainties in the estimated benefits and costs cannot be avoided, as indicated in
Figure 1f. For example, benefits can be calculated only as the avoided physical damage due to adaptation, while benefits can also be assessed in a broader context by taking into account, e.g., traffic delay, human health, and environmental effects. Costs of adaptation are also highly context dependent. For instance, most sewer system managers regularly maintain and upgrade their sewer systems; whether and how to account for the impacts of the regular operation and maintenance (O&M) process in the CBA of adaptation has been one of the important discussions in the framework. In the context of the present analysis, it is assumed that Business-as-usual implies constant O&M costs. The implementation cost is hence calculated as both the actual cost of investment, as well as the changes in O&M due to the adaption measures.
When comparing different scenarios of climate change adaptation decision makers often favor adaptation options with high economic benefits and short payback time. In this study we therefore choose four economic indicators, two comparing the individual adaptation options to the BAU scenario and two describing the comparison between adaptation scenarios. For comparison against a BAU scenario, we use the overall societal gain of an adaption measure,
NPVi, and the time it takes until the investment cost has been recovered,
. Similarly, when comparing adaptation options
i and
j, we compare the net present values and the differences in cost recovery years, denoted
and
, respectively. The four indicators are calculated for each MC simulation, and therefore, the ensemble of MC simulations represents the probability distributions of the overall uncertainty of the indicators, as shown in
Figure 1g.
Furthermore, when calculating all adaptation options jointly for each MC simulation, the uncertainties that the different adaptation scenarios share do not influence the calculated uncertainty of and . These two indicators can hence be used to directly compare the efficiency of the different adaptation scenarios without inclusion of the uncertainties that describe the decision process of choosing between action and in-action, and hence the entire propagated uncertainty.
2.5. Sensitivity Analysis
The sensitivity analysis aims at assessing the relative importance of input variables on the indicators of feasibility of climate change adaption. In particular, the following questions seem relevant:
What are the key sources of uncertainty in the NPV calculation for an individual adaptation scenario?
In most cases, uncertainties associated with individual adaptation scenario are large; however, is it still possible to identify a relatively robust adaptation plan when comparing these scenarios and which variables are of most influence in the process?
The cost-recovery period is also essential for decision makers to take action. Thus, what are the key variables in respect to the cost-recovery period?
To answer these questions, we adopted the sensitivity approach published by Visser et al. and Merz and Thieken [
9,
32]. The relative importance of individual input variable is estimated based on its impacts on the final estimates (e.g.,
NPVi). First of all, we calculate the Maximum Uncertainty Range of the final estimate (
) when uncertainties of all input variables are taken into account. To assess the relative contribution of a certain input variable, the next step is to calculate the Reduced Uncertainty Range of the final estimate (
) by using the best estimate of variable of interest, while retaining all other uncertainties in the simulation. The relative contribution of the variable of interest can then be calculated as
. Any interaction between the variables and non-linear effects will result in the relative contributions not adding to unity.
There are many input variables in the framework, especially for calculating the hydrological and hydraulic responses for a given return period. All of these variables are concatenated into one variable. Hence, the following variables are included in the sensitivity analysis:
Volume: The critical volume of water leading to flooding. Dominant uncertainties include precipitation amounts under current climate, rainfall-runoff conversion, and hydraulic processes in the sewer system.
Threshold, Th: The stage-damage relationship, i.e., at what inundation level the items are damaged.
Climate factor, Cf: How much the climate is expected to change over the assessment period.
Unit costs, U: The economic cost that a damaged item will entail.
Investment costs, C: The cost of implementing a climate change adaptation scenario, including both initial capital costs and O&M.
Discount rate, r: The discount rate is a single input variable, as indicated in Equation (3), and represents the societal preference between present and future benefits and costs.
Within each of these groups of input, all variables are fully correlated, while there is no correlation with variables belonging to another group. For example, if one stage-damage relationship is assumed high, then all stage-damage relationships are high, while the value of a stage-damage relationship does not influence the amount of climate change.
Running the 1D-2D simulations and subsequent GIS operations for each Monte Carlo simulation is computationally prohibitive. Therefore simplifications are made in the computational setup. Two studies indicate that the uncertainties associated with rainfall and hydrological and hydraulic processes in state-of-the-art modeling of 1D sewer systems can be described by a coefficient of variation (CV) of the calculated flow throughout the sewer system [
26,
33]. As such, this aggregated uncertainty can be described as a change in loading of the entire system, and hence be described as a change of return period. This greatly reduces the amount of calculation time of the Monte Carlo simulations, because the uncertainties of both present and future precipitation and the hydrological and hydraulic uncertainties can be represented by interpolations within a limited set of 1D-2D simulations. In accordance with Hansen et al. [
33], we describe the aggregated uncertainty of volumetric runoff by a constant coefficient of variation (CV) of the calculated runoff volume in the present climate. The CV is slightly increased to account for the uncertainties related to the inundation modeling. For the calculation of damages, we similarly interpolate costs based on a limited set of inundation maps.
2.6. Case Study and Key Input Data
Choosing the same study area as in Zhou et al. [
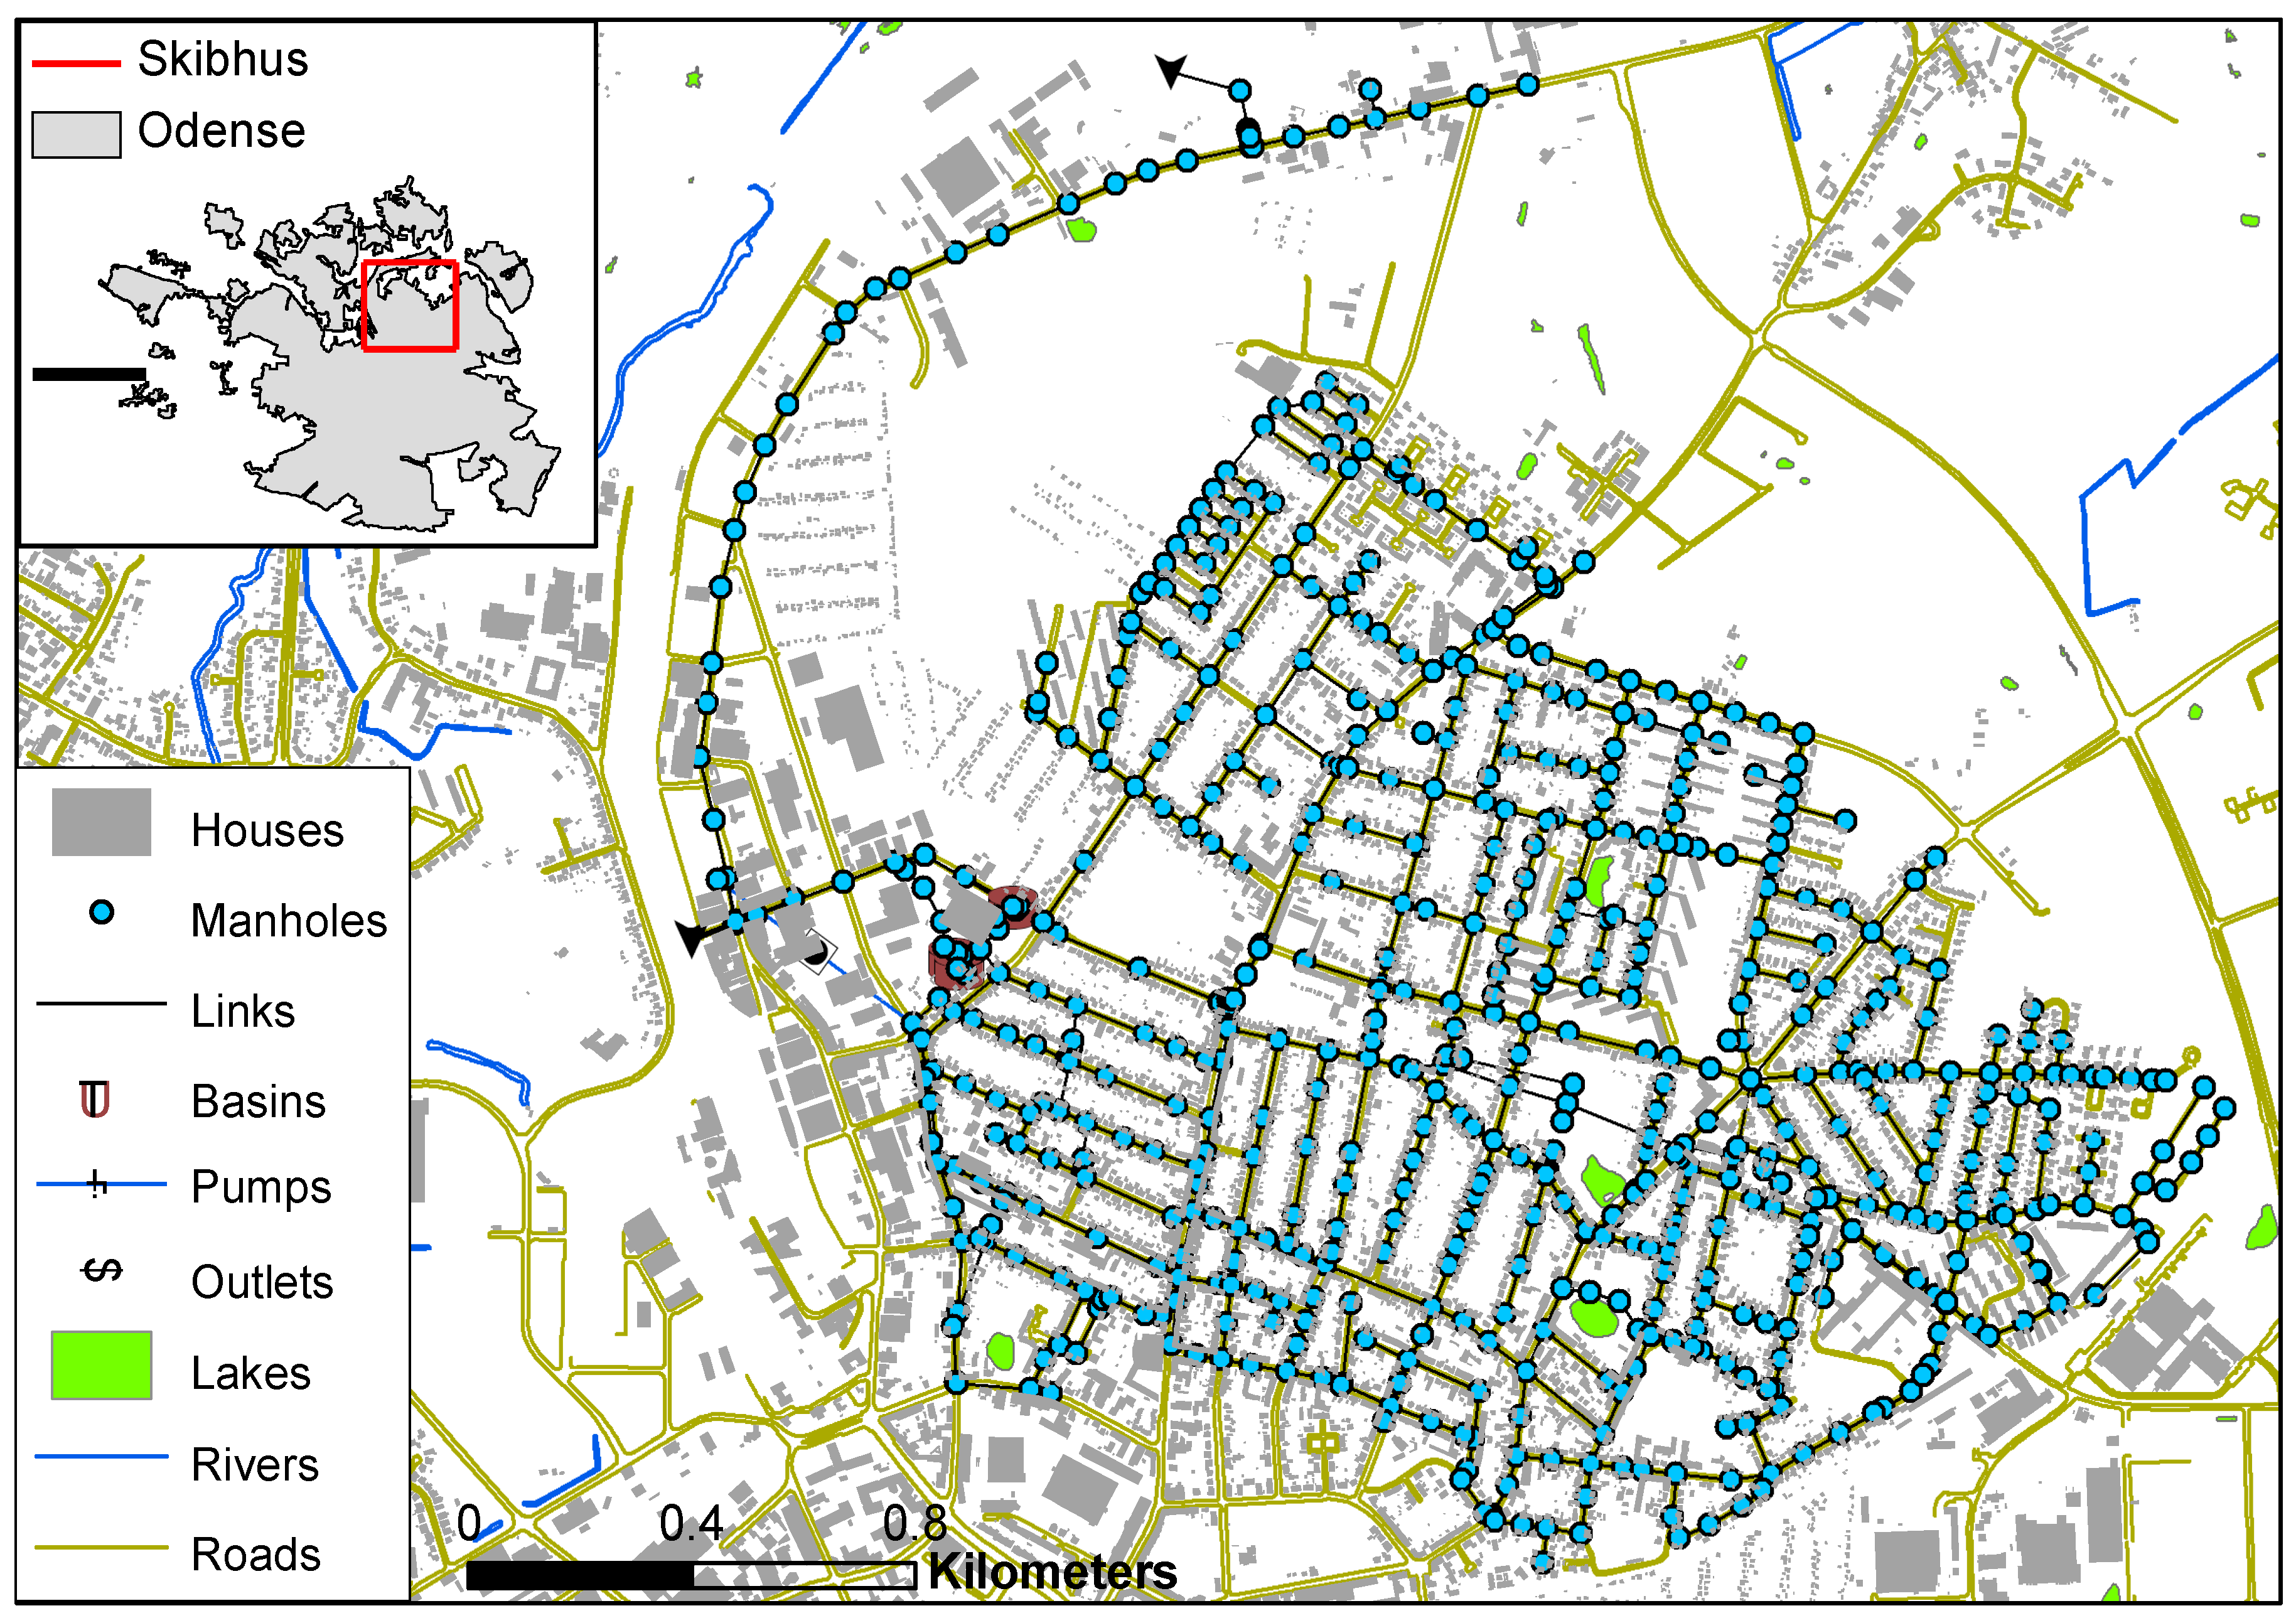
19] enables an examination of how the uncertainty assessments impact the recommendations relative to a framework where the uncertainty is not explicitly modeled. As shown in
Figure 2, the catchment of Skibhus is situated in the North center of Odense, Denmark, and has a drainage area of 390 ha. It is mainly a residential area with minor industrial and commercial activities. The catchment is equipped with a combined sewer system where several sewer surcharges are expected during extreme rainfall events. The sewer system contains 631 manholes, 4 basins, 9 weirs, 8 pumps, and 1 orifices. There are in total 673 pipelines with a total length of 42.4 km conveying water from East to West towards the 3 outlets near the Odense Harbor. The digital elevation model (DEM) is obtained using LIDAR technology and has a resolution of 1.6 × 1.6 m. The surface topography varies from 0 to 20 m above the mean sea level. The runoff generation is calculated using MOUSE runoff model A, i.e., a fixed initial loss as well as continuous losses as a function of volume for each of the events [
25]. The runoff model is calibrated and verified by the local utility company, as used without further modification. The inundation is calculated by use of MIKE FLOOD, a fully dynamic 1D2D simulation engine [
25].
The adaptation plan covers a period from year 2010 to 2100. Based on economic analyses previously made in Zhou et al., climate change is expected to have adverse impacts on flood risks in the area and the estimated EAD is anticipated to increase gradually from 3.9 to 9.3 MDKK in a 90-year planning horizon assuming a climate factor of 1.4 on extreme rainfall.
Two adaptation options are studied, namely pipe enlargement and local infiltration. Both are implemented to ensure that floods will not occur more frequently than 1 in 5 years in any part of the catchment. Both options were compared to a BAU scenario. Zhou et al. [
19] concluded from the performed CBA that pipe enlargement was more economically attractive in comparison with local infiltration in the catchment. However, no further information was provided regarding the uncertainty of the estimates and the robustness in relation to decision making. This study is therefore an extension of the former study and aimed to quantify the uncertainty bounds of the economic estimates.
Uncertainty of the volumetric runoff of the present climate is described by a coefficient of variation (CV) of 0.2 and 0.4, which is in agreement with the recommendation by Hansen et al. [
33]. Uncertainty bounds of climate factors for different return periods are obtained from Arnbjerg-Nielsen [
22,
34], see
Table 1. The density function is assumed to be a triangular distribution since this is often preferred when there is little information regarding the analyzed uncertainty distribution [
35]. The threshold criteria used to identify flooded units are given in
Table 2. The unit costs (
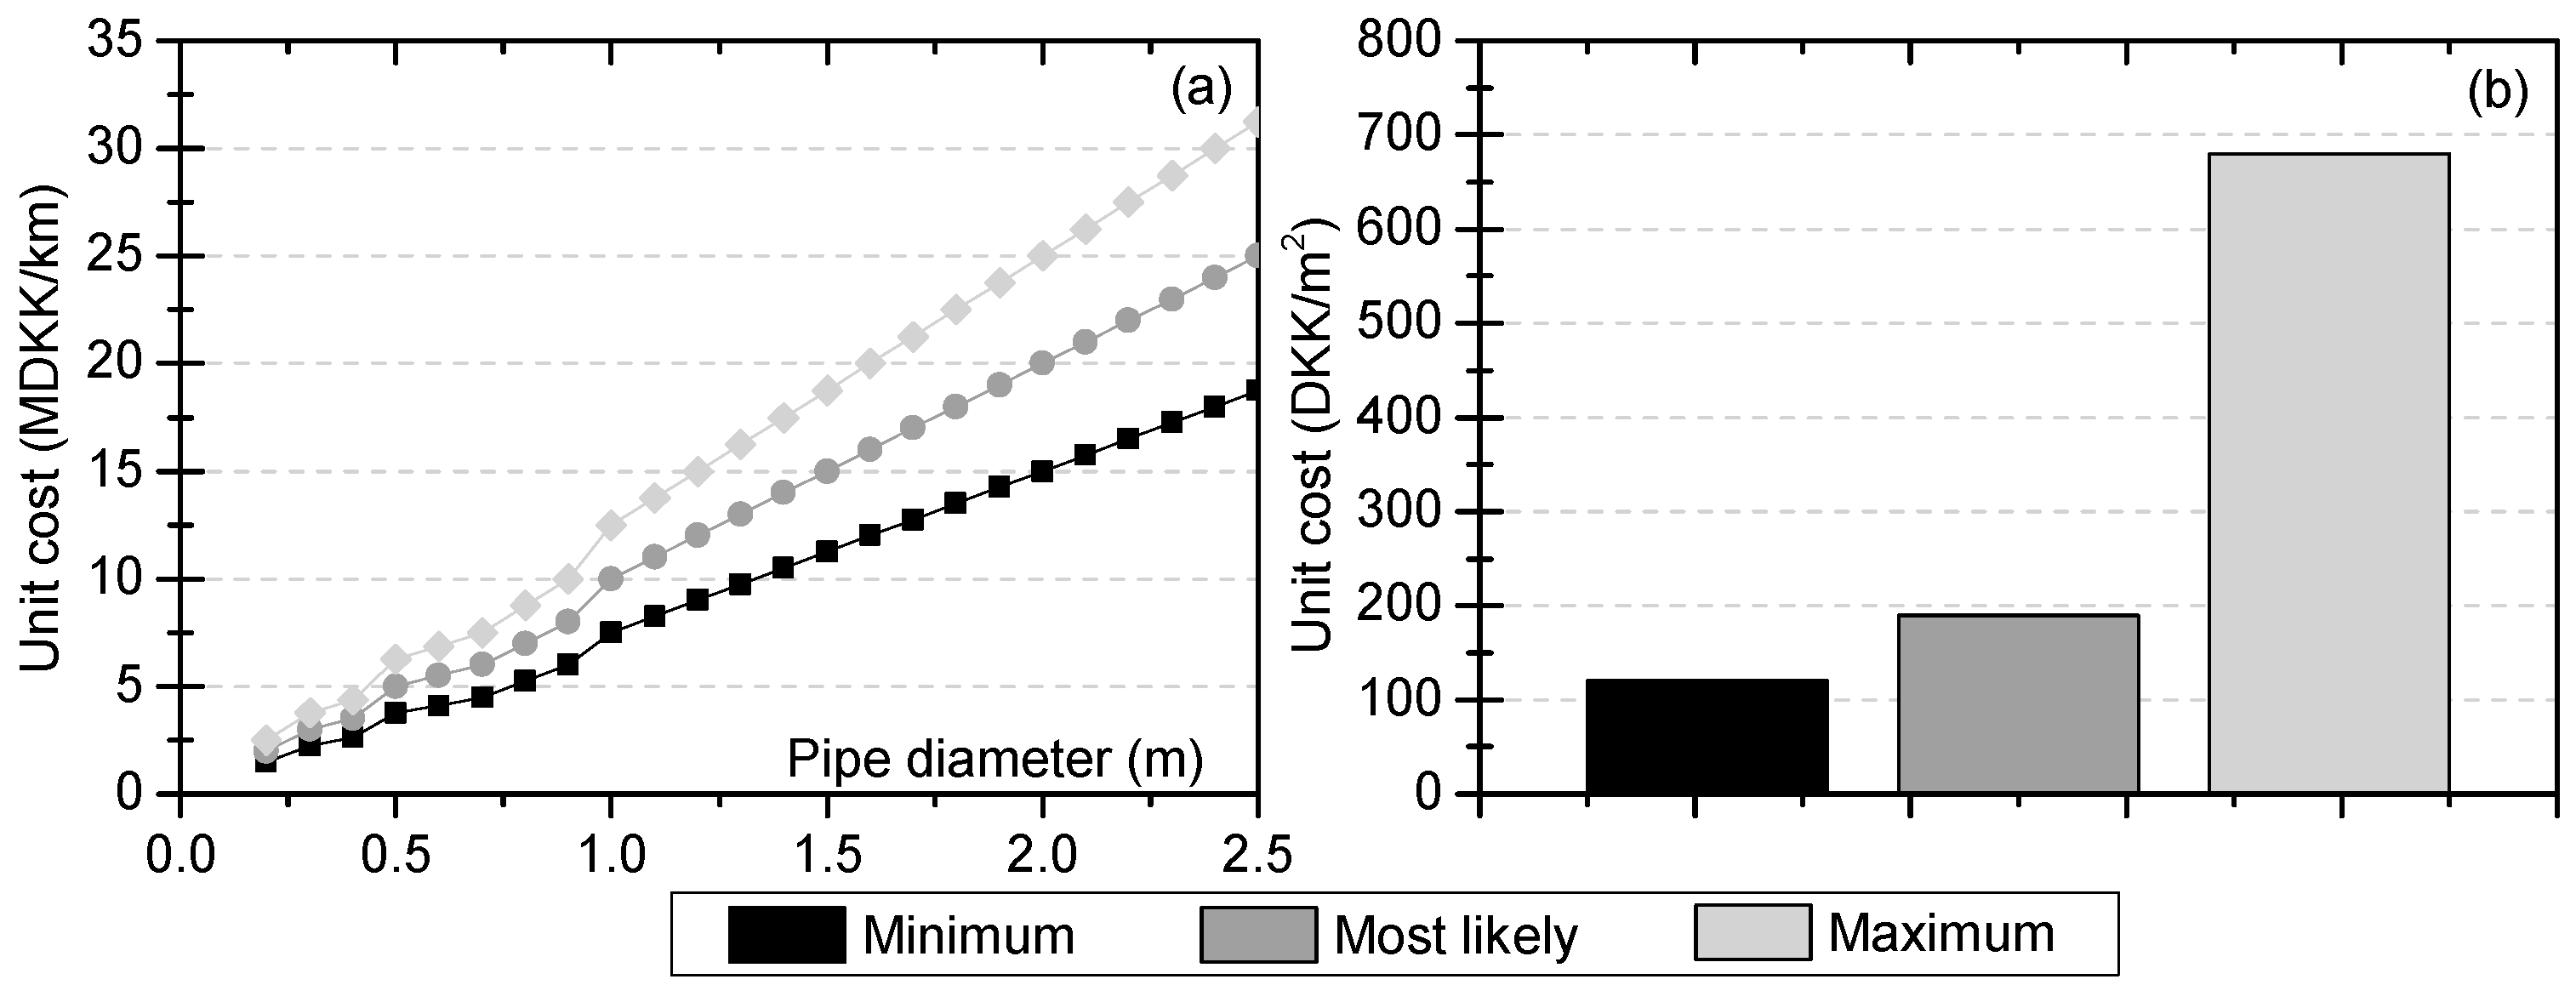
Table 3) of analyzed damage categories are described by a cumulative distribution with a set of points. Uncertainty ranges of implementation costs of pipe enlargement and infiltration are illustrated in
Figure 3 as inputs to the cost benefit analysis. All these input data are obtained based on a literature review of a number of Danish flood risk assessment studies including municipality projects and private companies.
3. Results
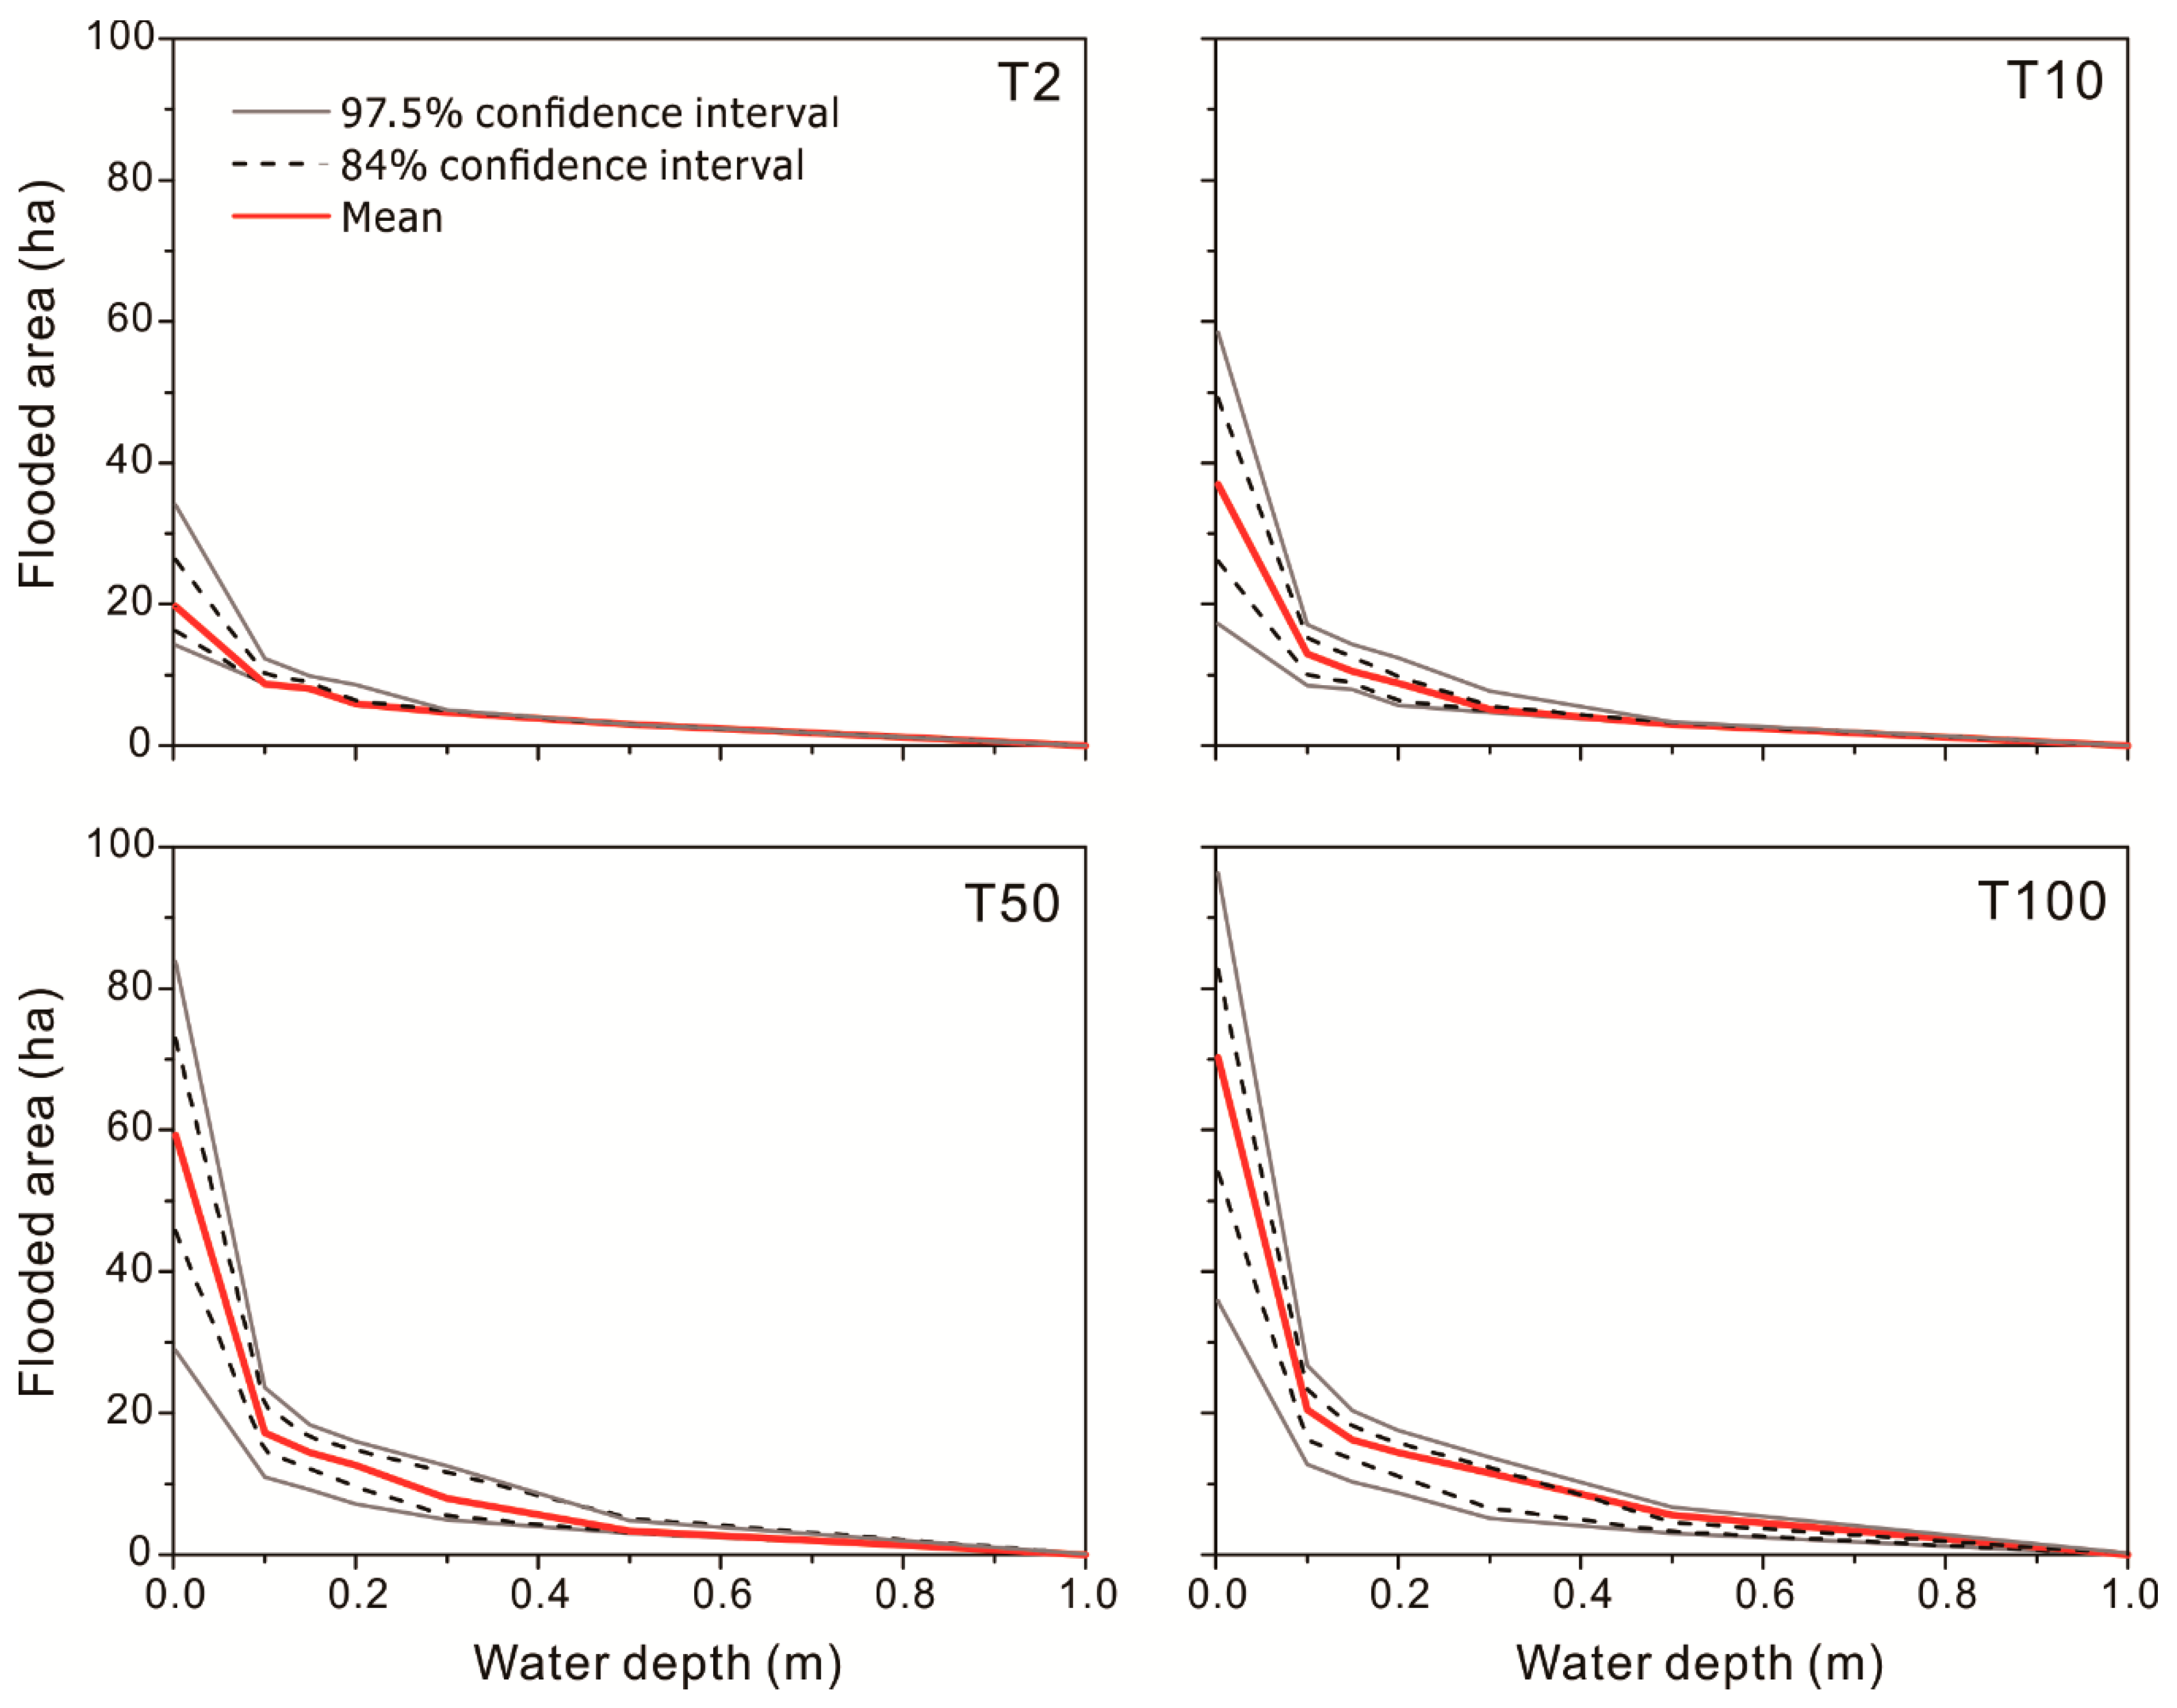
Figure 4 shows the assessed uncertainties associated with the area-depth curves as a result of joint effects from rainfall, hydrological, and hydraulic processes for the present climate. The resultant extent of inundated areas was categorized based on a set of preselected water depths obtained from the simulated hazard maps. The uncertainty is largest for water depths lower than 10 cm.
This depth interval is especially important for cost estimation of, e.g., basement damage, due to its low threshold level used in the vulnerability assessment. For areas covered by water depths greater than 50 cm, the areal extents were not affected significantly by the uncertainties. For water depths within the interval between 10 and 50 cm, the uncertainty impacts increased as a result of increased return periods. In summary, the results indicate that a variation in runoff volume will have different impacts on different damage categories and thus lead to indirect effects on flood costs and risks.
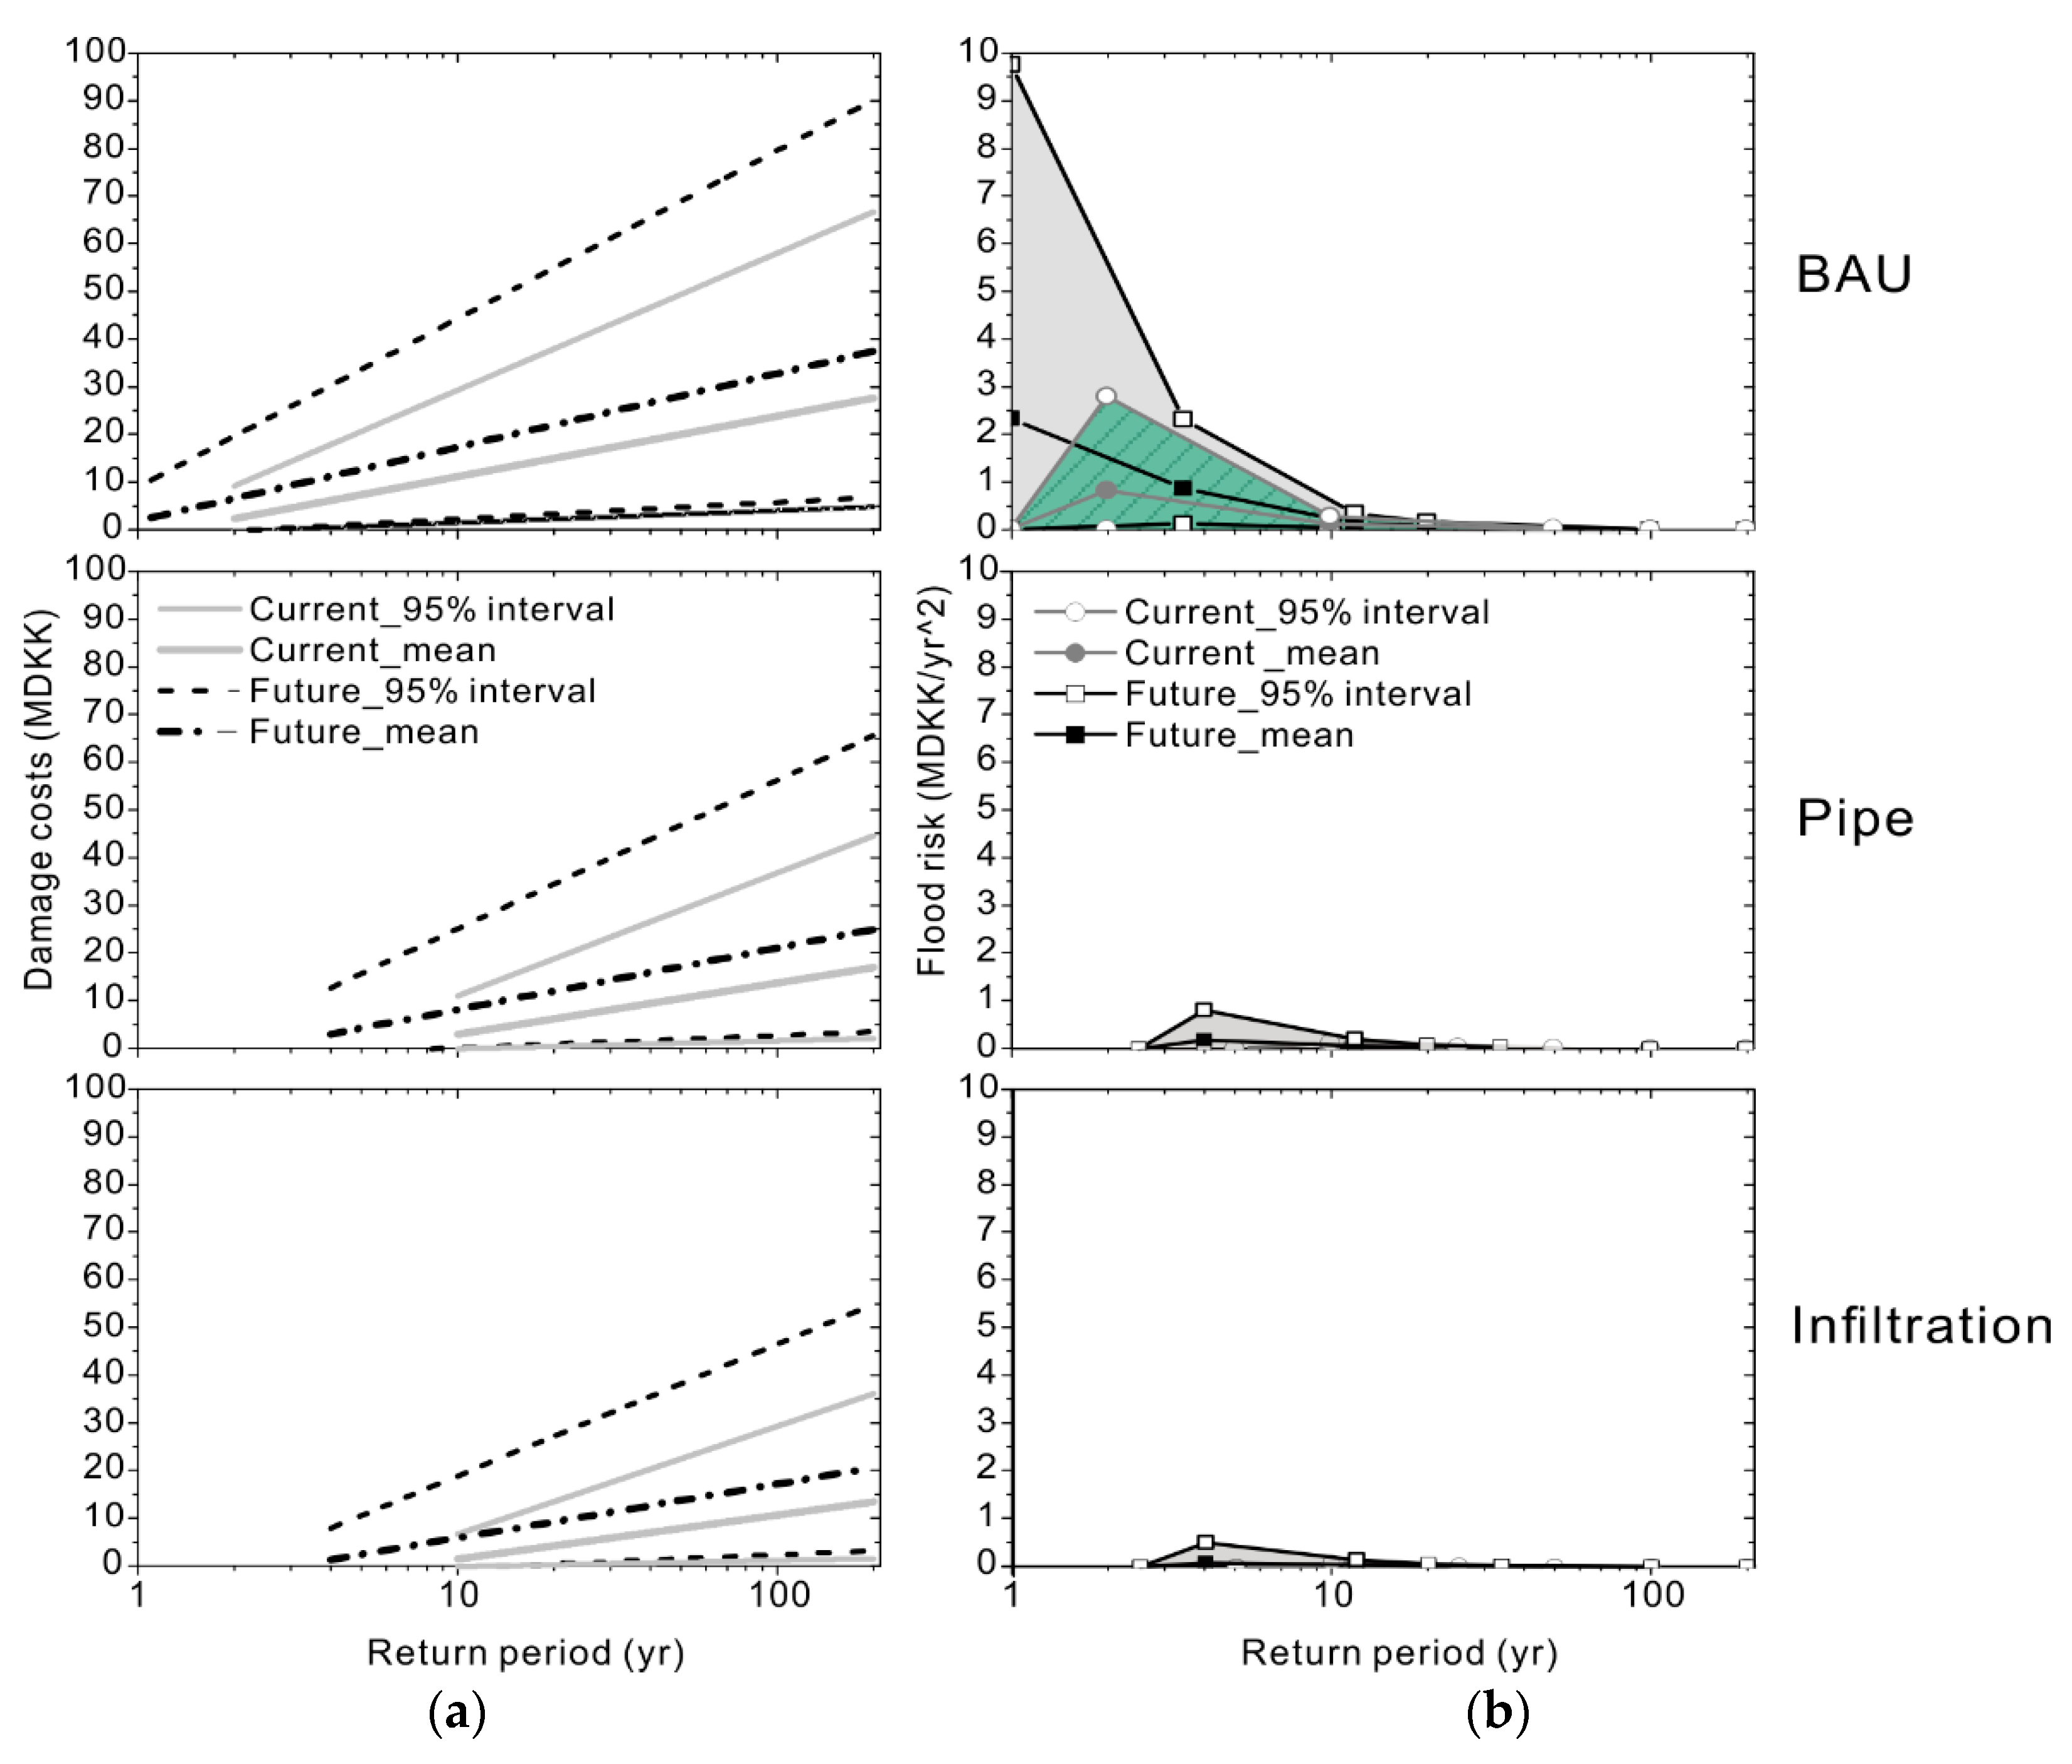
Figure 5a shows the assessed uncertainty bounds of flood damage-return period functions for the BAU and the two adaptation scenarios. The variation of damage costs in the vertical direction indicates the changes in unit costs and/or applied threshold criteria, where high unit costs and low threshold often result in high total damage costs. Furthermore, uncertainties were assessed, not only for the investigated rainfall events under present climate, but also for their corresponding return periods in a 90-year horizon assuming climate change impacts. It can be seen that climate change impacts will lead to an increase in the occurrence of flooding events. The results also show that there is a high uncertainty associated with the damage-return period functions. However, both adaptation measures help to reduce flood damage costs significantly, both in present and future climates compared to the present flood risk.
Risk density curves were subsequently calculated to indicate the risk level of flooding as a function of return periods, see
Figure 5b. In general, a high risk level is associated with larger uncertainties. Additionally, large risk reductions are achieved by both measures. It can be noted that the assessed future risk levels (the light grey shading) in year 2100 under both adaptations are even lower compared to the current risk level (the hatched area) under the BAU scenario. This indicates that, although there are still uncertainties associated with future flood risk, the proposed adaptation measures are fairly helpful and sufficient to maintain the risk at a level that is better than what is observed today. Therefore, future risks can be managed by the proposed adaptation even in the context of uncertainty. Especially, adapting by local infiltration has significant impacts on risk reduction in the area. This is because that a large number of infiltration measures are needed to comply with the 5-year service level, which to a great extent reduces the general hydrological loading of the system, thus achieving an overall reduction in flood hazards and risks. In contrast, pipe enlargement has more local impacts on the sewer system and therefore less investments in adaptation measures are needed to cope with the overloaded sewer system. However, as the rainfall loading of the system increases over time, this leads to a less robust system that may result in a need for further adaptation at a later stage.
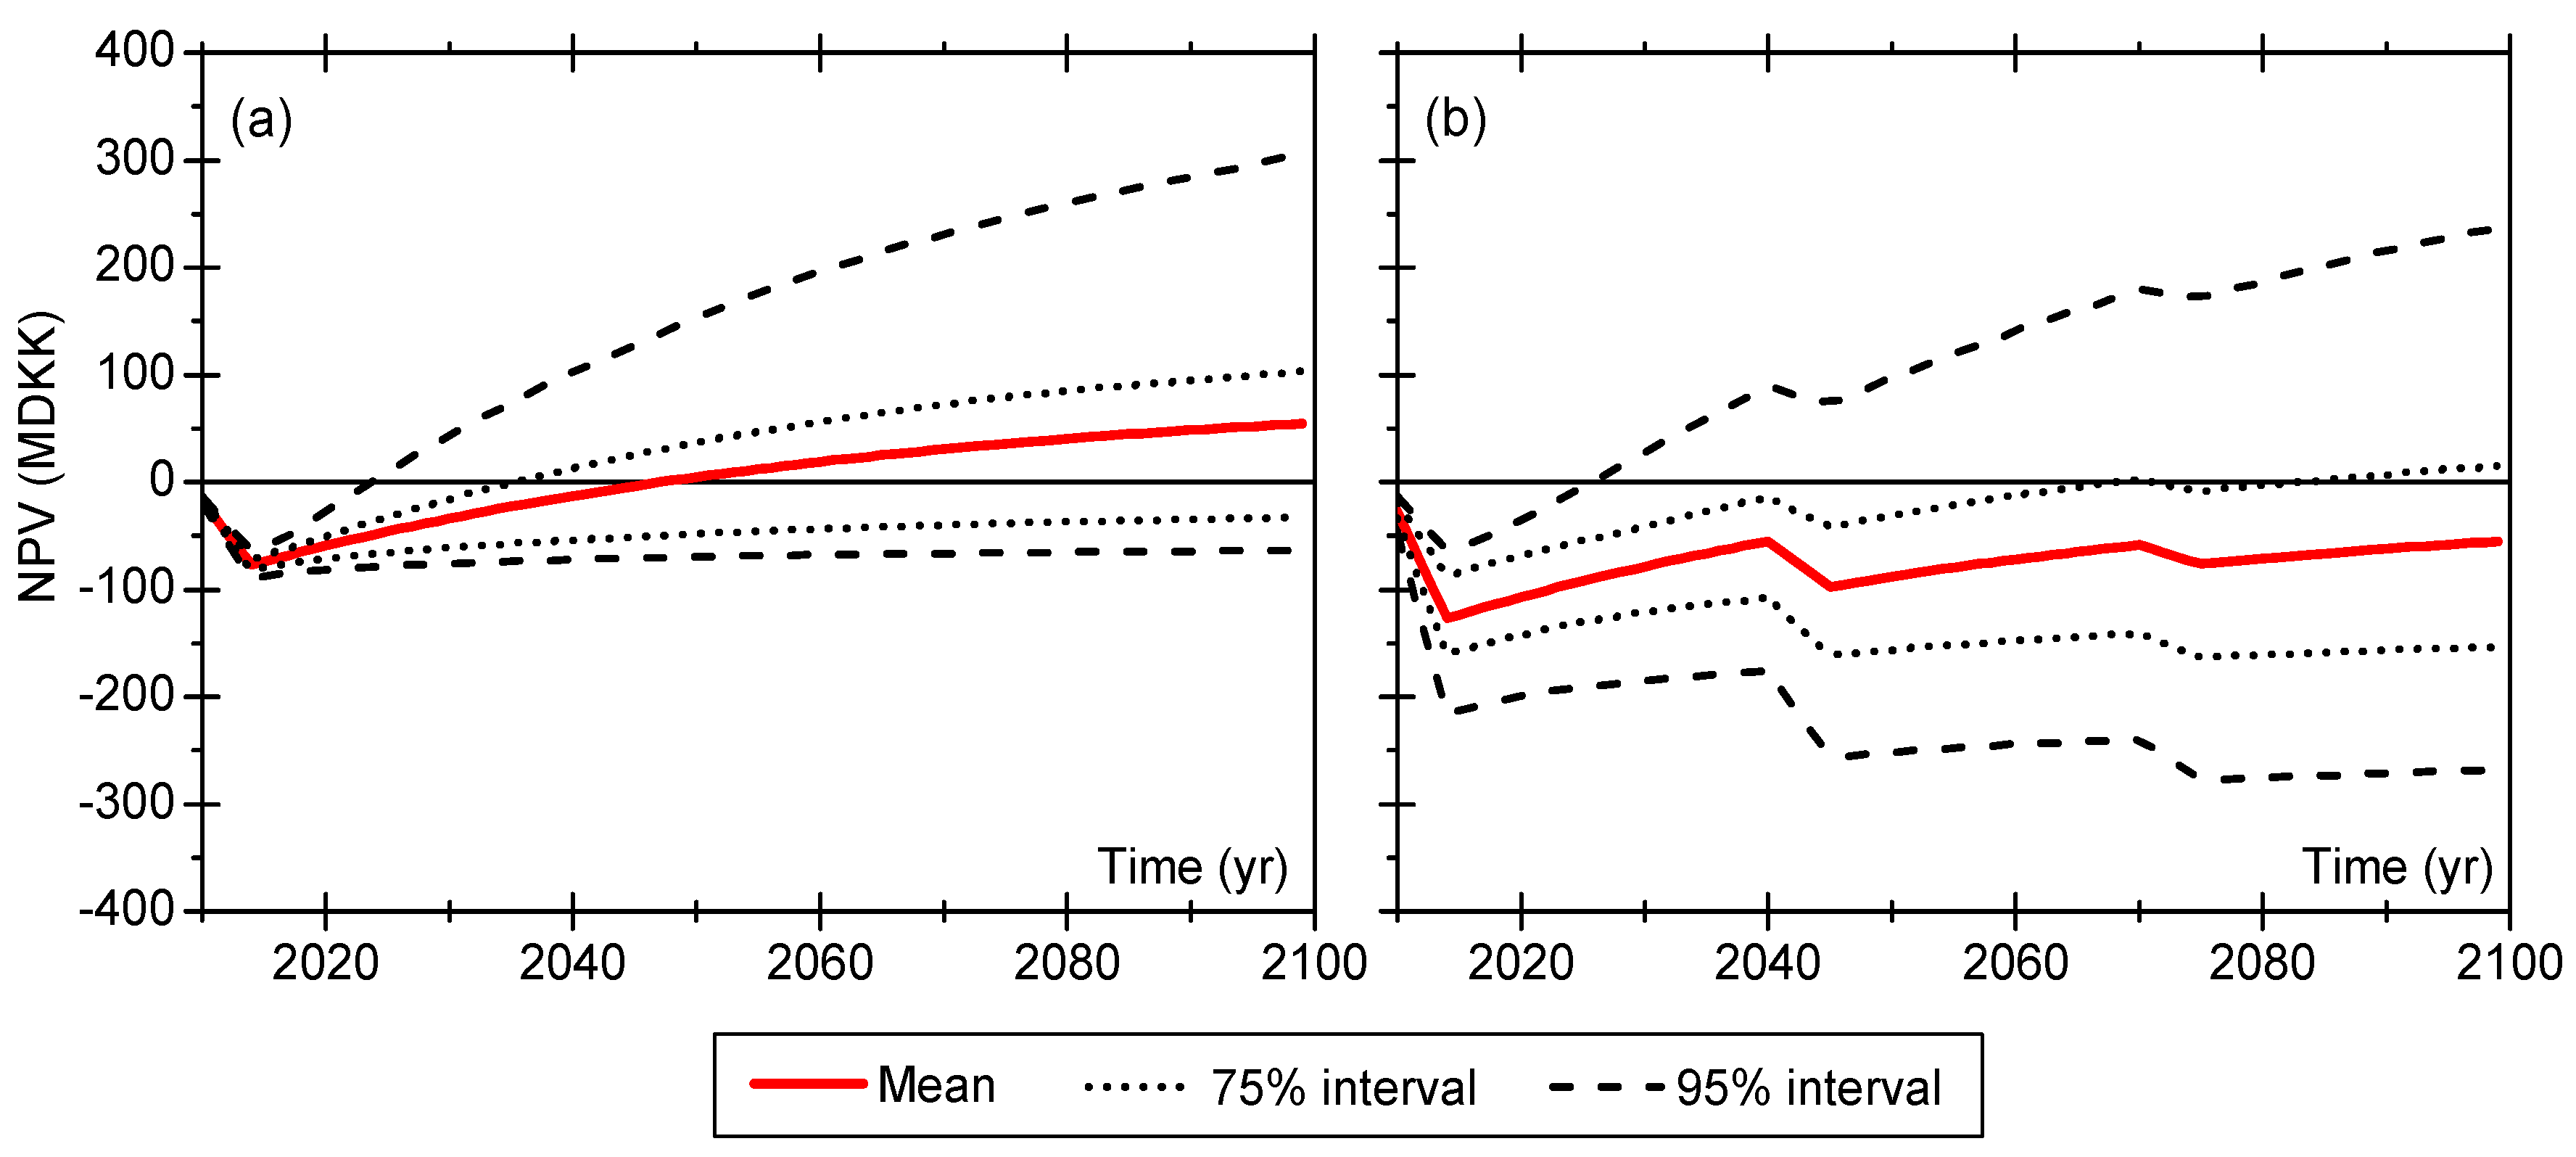
Figure 6 shows the calculated net benefits of the two adaptation options including all the uncertainties on the inputs. It is clear that the uncertainty is substantial; the results give a more realistic representation of the outcome in terms of net present value when comparing the proposed actions to the in-action scenario. Furthermore, it is noteworthy that, although adapting by infiltration has larger impacts on risk reduction (see
Figure 5b), its net benefits become much lower in comparison with pipe enlargement when taking into account the required investment and reinvestment costs. This indicates that neglecting investment costs in adaptation assessment could easily bias the decision making. The somewhat peculiar shape of the net benefits of the local infiltration is a result of two reinvestments in the planning horizon because the technical lifetime of the infiltration technologies are shorter than the assessment period.
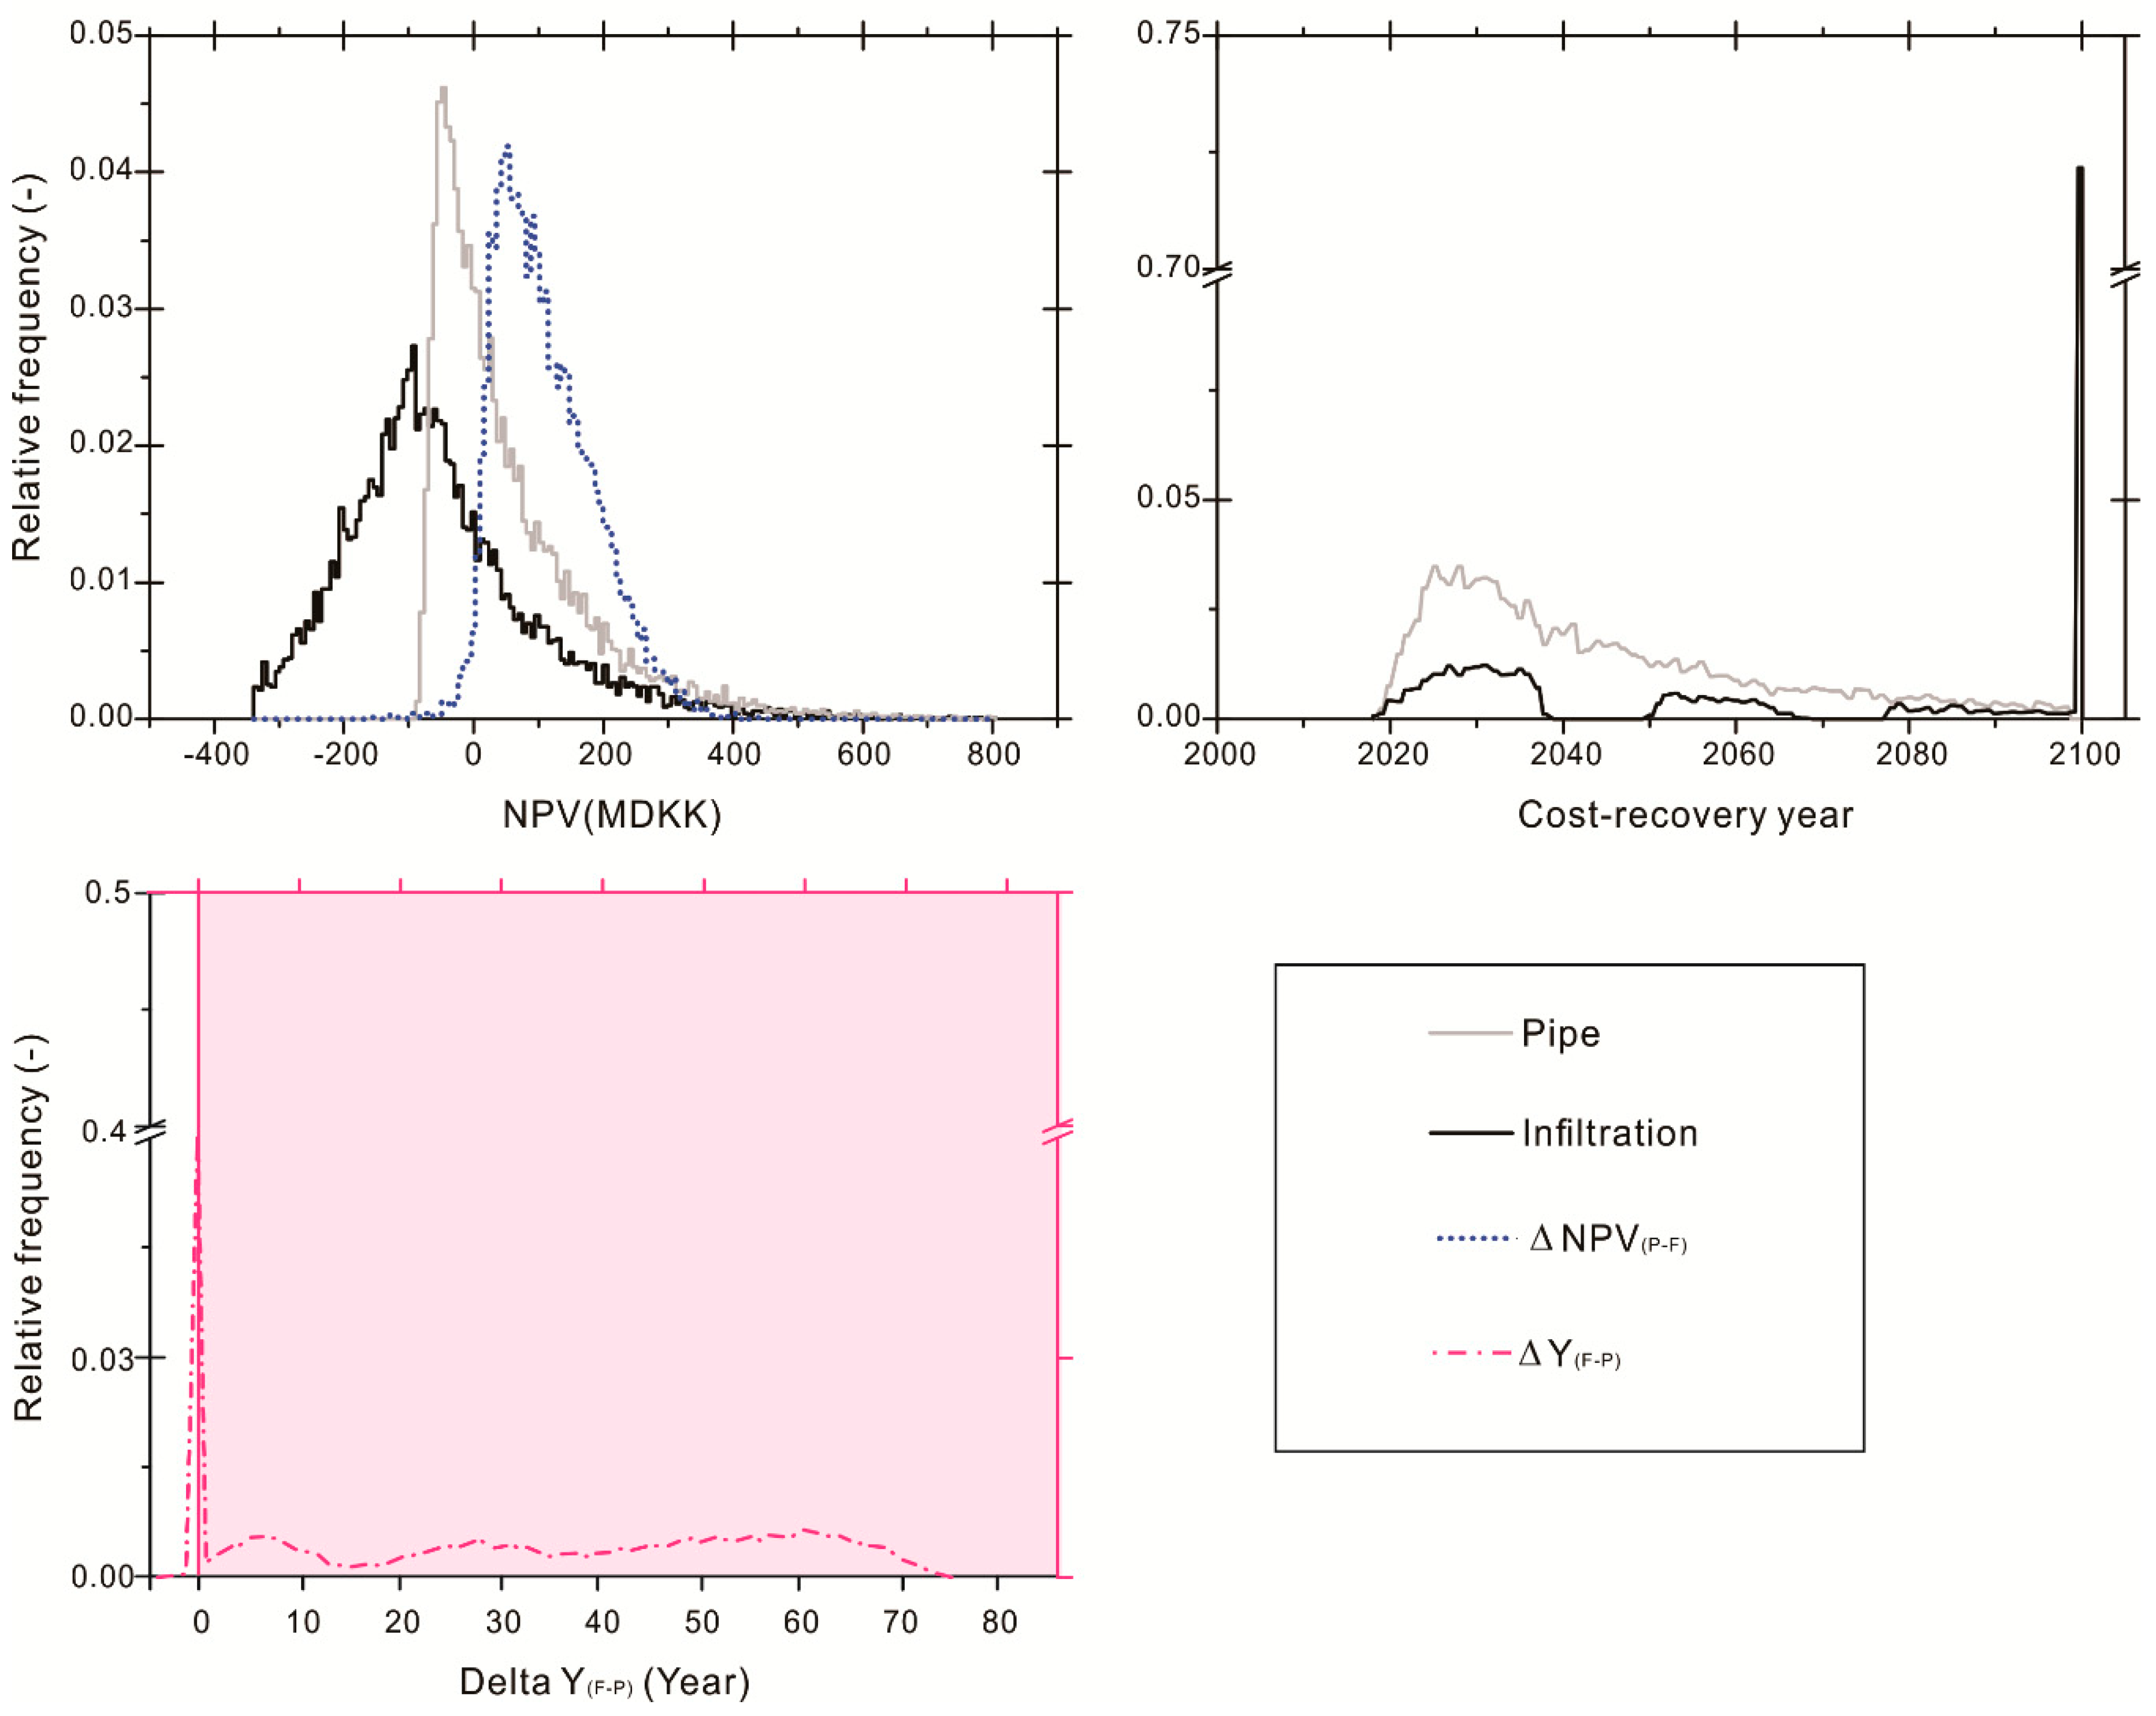
While the uncertainty of the
NPV of each individual scenario is very high, the comparison between the two options using the indicator
is very robust. It can be seen from
Figure 7 that an overwhelming proportion of this indicator is positive, indicating pipe enlargement outperforms local infiltration regardless of the uncertainties associated with the evaluation process, given that action should be taken. The comparison of the cost-recovery year between the two scenarios,
, also indicates that traditional sewer enlargements are preferable, although there is still some probability that infiltration systems may outperform sewer systems, primarily if the net benefits become positive before reinvestments are needed.
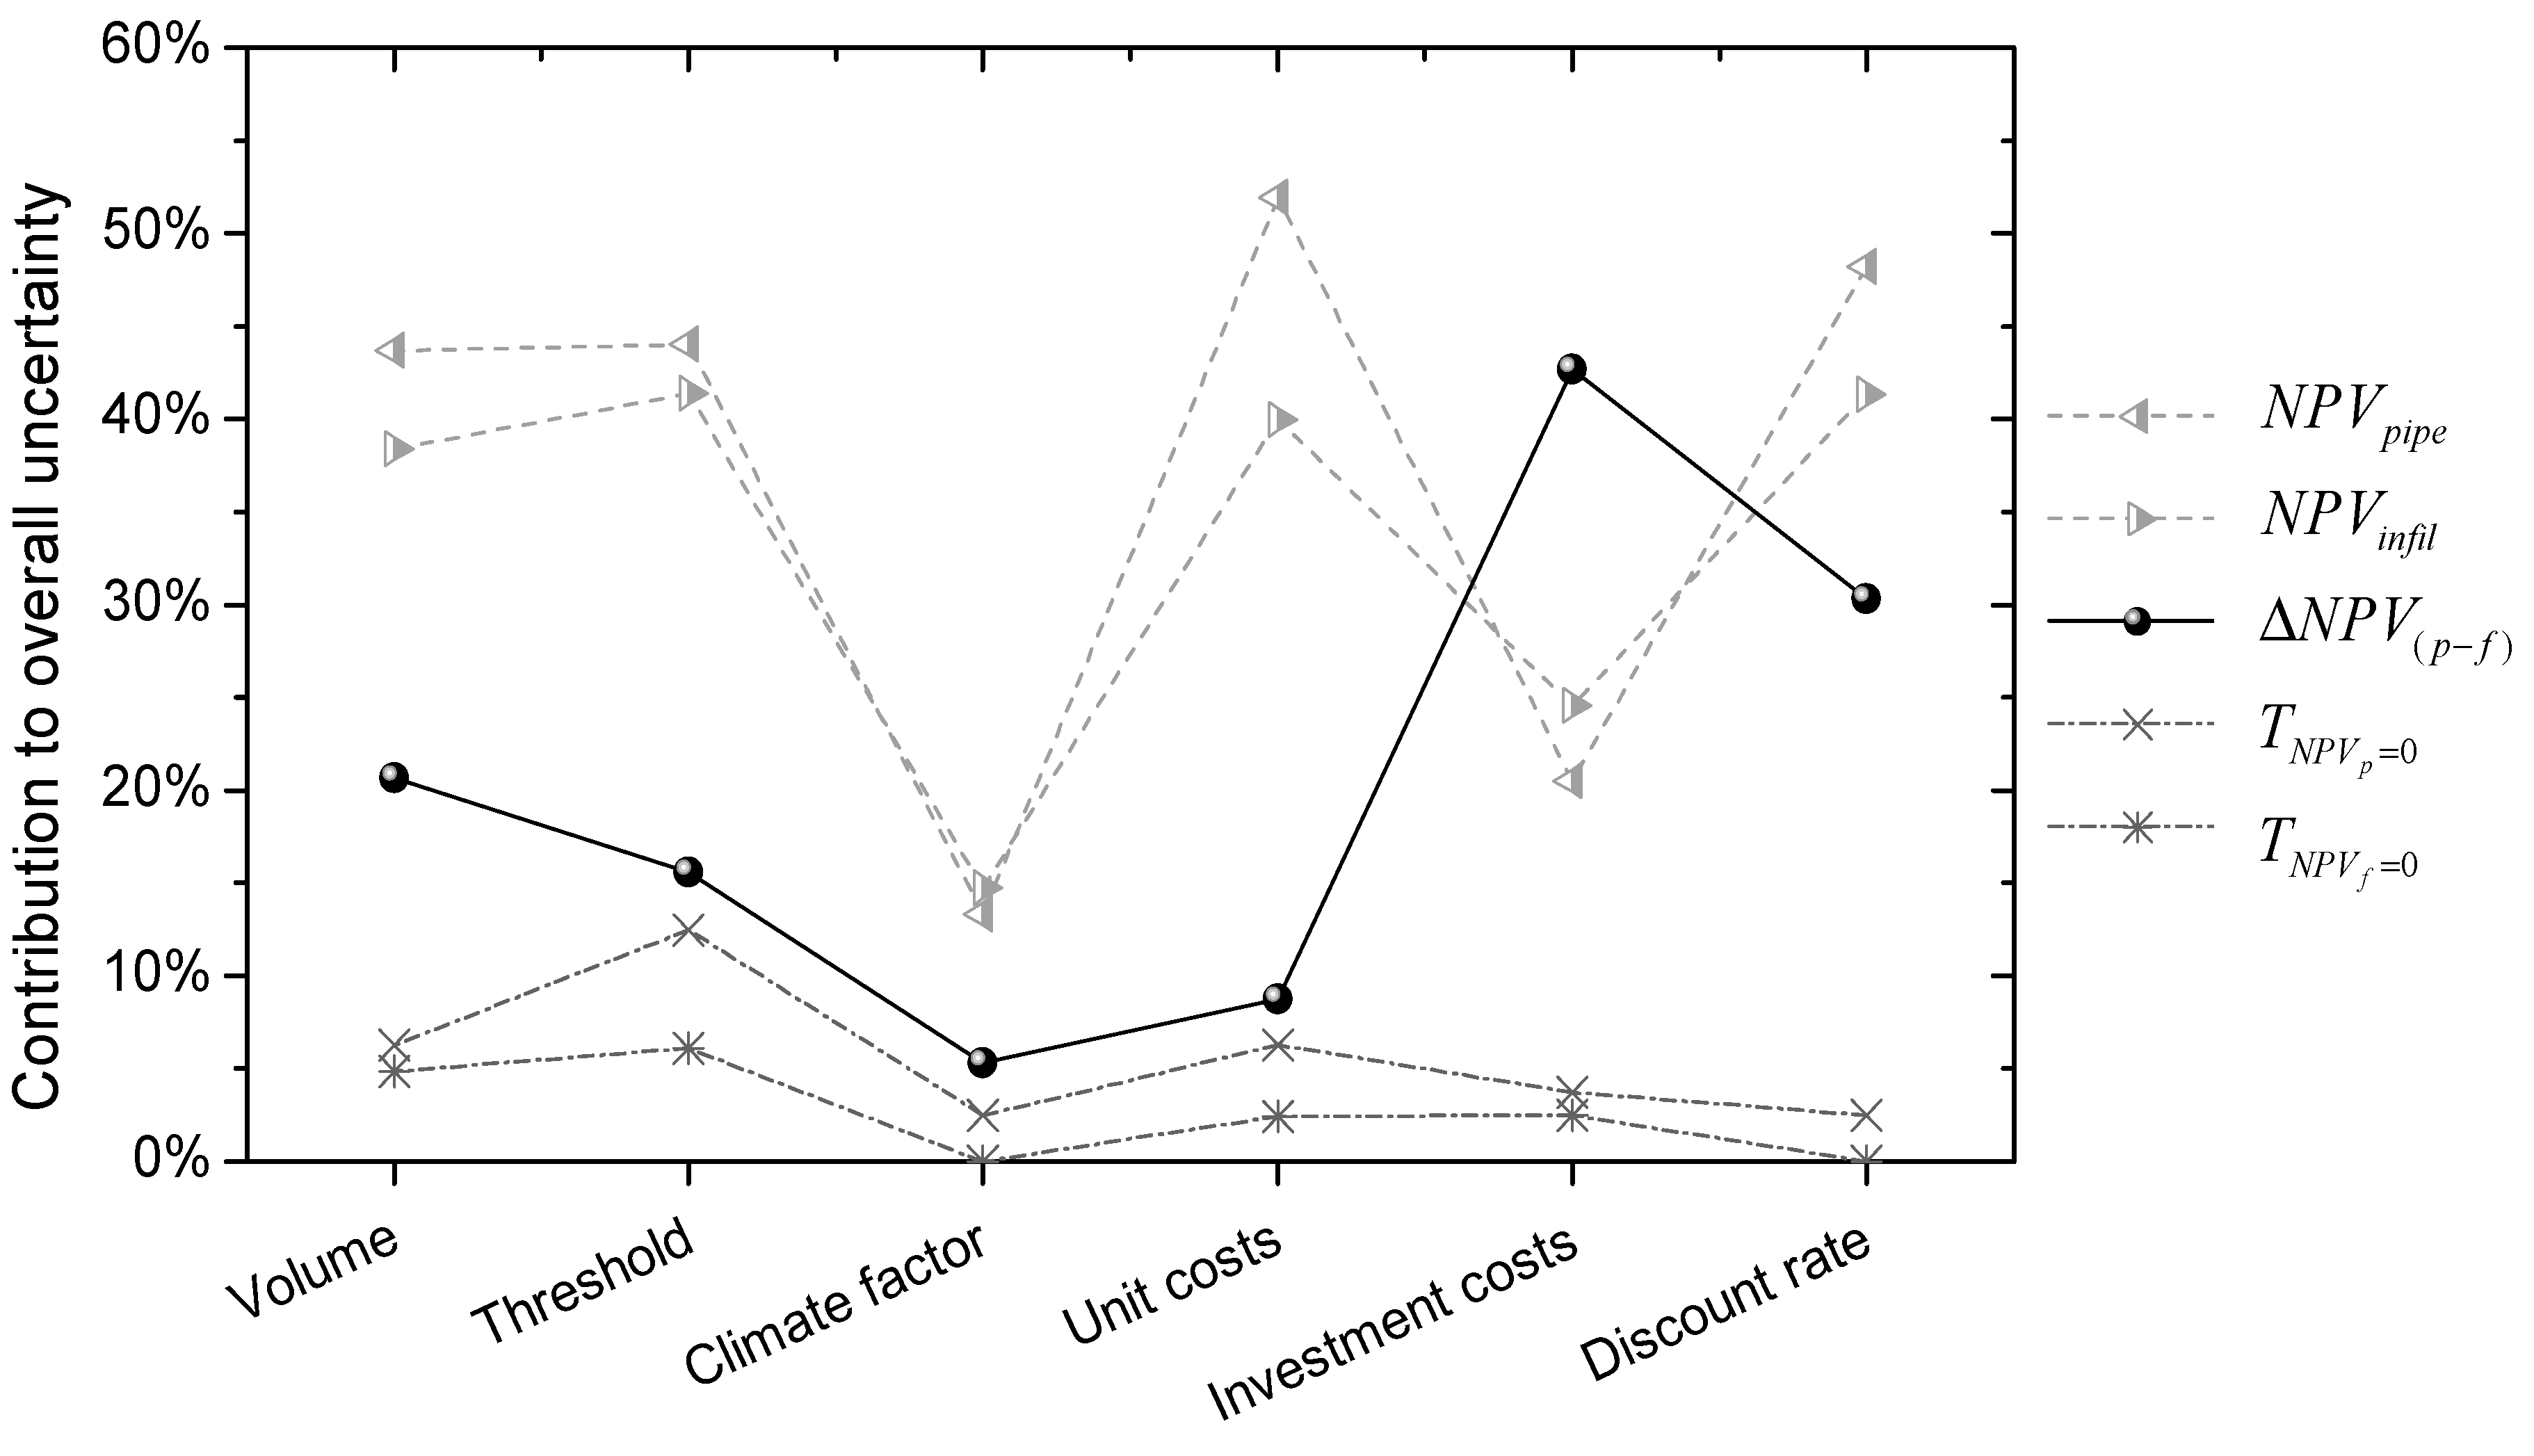
The sensitivity analysis shows that the overall uncertainty is dominated by the present uncertainties in relation to assessing the current hazard and vulnerability conditions, see
Figure 8. For the
NPV estimates comparing action to in-action, uncertainties associated with input runoff volume, threshold criteria, unit costs, and discounting rate demonstrate the most significant impacts. The two largest uncertainty contributions are related to the damage cost functions, thereby confirming the results of previous studies that highlight the importance of this uncertainty contribution [
12,
15]. Climate factors and investment costs are relatively less important in this case study. Regarding the uncertainty of comparing between adaptation options, Δ
NPV, the investment costs, discount rate, and input runoff volume are found to be important for decision making, whereas the other levels of uncertainty seems to be of less importance. This seems likely since the uncertainties related to costing of floods and climate impacts will be leveled out when comparing the options, thus being the major reason for the reduced uncertainty. To be more specific, uncertainties of costing and climate mainly affect the calculated EAD curves to a similar degree (see CCIS and CCAS in
Figure 1f as examples), which means that the net impact is reduced much less than the change in the actual flood risk. Hence, although this uncertainty dominates the calculation of the flood risk, it does not dominate the uncertainty when comparing different adaptation scenarios. Whereas, the discounting rate represents a scaling effect that can directly influence the value of the Δ
NPV. Further, the adaptation scenarios affect the hazard calculations in different ways (adding detention vs. conveyance) [
18], also contributing to why the runoff volumes are more important than the damage functions. For payback time, the impacts of input variables are in general small. This is due to the high investment costs required in both scenarios and a high degree of non-linearity between the uncertainty of the input and resulting calculated payback time, especially for the infiltration measure.
4. Conclusions
Pluvial flood risk assessments are inherently uncertain. A quantification of these uncertainties and their influences on various scenarios should be conveyed to decision makers when adapting to climate change impacts. The approach presented in this study allows us to perform an integrated uncertainty and sensitive analysis to quantify the overall and net uncertainties associated with climate change adaptation assessment, as well as to identify and communicate the important sources of uncertainties in the evaluation.
The study provides a general guidance on uncertainty assessment of climate change adaptation and can be applied to other contexts of risk assessment. The modeling approaches and the categories/levels of uncertainty applied in the framework can be adapted or altered, depending on the context in question. In particular the calculated results for the case study may be impacted by the fact that the hazard models are well calibrated and verified, while the vulnerability models are not calibrated, but are based on literature values. Hence, the uncertainty of the hazard is mainly aleatory, while the uncertainty of the vulnerability contains both aleatory and epistemic components. We also proposed a simplified approach by using subsampling when integration of all models is not feasible (e.g., due to computational limitations). This enables an efficient Monte Carlo simulation for such a comprehensive integrated analysis. Furthermore, descriptions of correlation structures between input variables are considered to be important to obtain a correct description of the resulting uncertainties.
The uncertainty analysis gives a good description of the anticipated risk level in the future by providing the entire risk density functions for both current and future climates, which can be utilized as a performance evaluation of proposed adaptation options. The case study shows that both adaptation measures are able to maintain the future risk at a low level. The design criteria favors one of the scenarios more than the other, but the results could look different if the design criteria were changed. In any case, the results show that the uncertainty bounds of calculated net benefits are in general high; however, they provide more insights on the economic consequences to decision makers.
More importantly, the proposed method is particularly useful to reduce the degree of complexity of adaptation assessment. The study allows for a better understanding that the key to successful decision making, in many cases, is recognizing and obtaining the information of the most important indicators, and discarding uncertainties that are not important for the decision-making in question. The results show that having calculated the net uncertainties, we are able to identify a robust adaptation option even when a large uncertainty of individual scenario exists. Additionally, it is recognized that the sensitivity analysis contributes to a better understanding of the impacts of input uncertainty levels and applied assumptions in the assessment. This is especially important to guide decision makers’ efforts on further investigation when resources are limited. It is concluded that uncertainties in the quantitative flood risk framework related to assessing the present hazards and vulnerabilities (runoff volume, threshold for damage and costing of floods) are the main contributors to the overall uncertainty and therefore influence the choice between action and in-action. However, these uncertainties will, to a great extent, be leveled out when comparing adaptation scenarios. This implies that the net uncertainty related to scenario comparisons is lower than when comparing action to in-action. The sensitivity analysis indicates that, in the case study, the uncertainties of investment costs, discount rate, and input runoff volume influence the decision most when comparing adaptation alternatives, but we do not expect this result to be generally applicable. In any case the results indicate, at least for the particular case, that the impact of climate change on decision making is smaller than was anticipated prior to the study.
We are also aware of the limitations in the paper. The simplifications suggested in the computational framework are needed to make the study feasible, but may still to some extent bias the results and conclusions. For instance, the risk quantification did not cover the entire range of potential socio-economic impacts. Additionally, the uncertainty propagation through the framework might be subjective, especially with the simplified sampling from the inundation and GIS operation processes, based on assumptions that the city development is negligible. Nevertheless, this paper advises a general procedure for characterizing and quantifying the potential uncertainty in the climate change adaptation assessment, which provides an important tool for decision makers to ensure robust adaptation decisions in situations of uncertainty.


