Water Quality Control Options in Response to Catchment Urbanization: A Scenario Analysis by SWAT

Abstract
1. Introduction
2. Materials and Methods
2.1. Study Area
2.2. Input Data
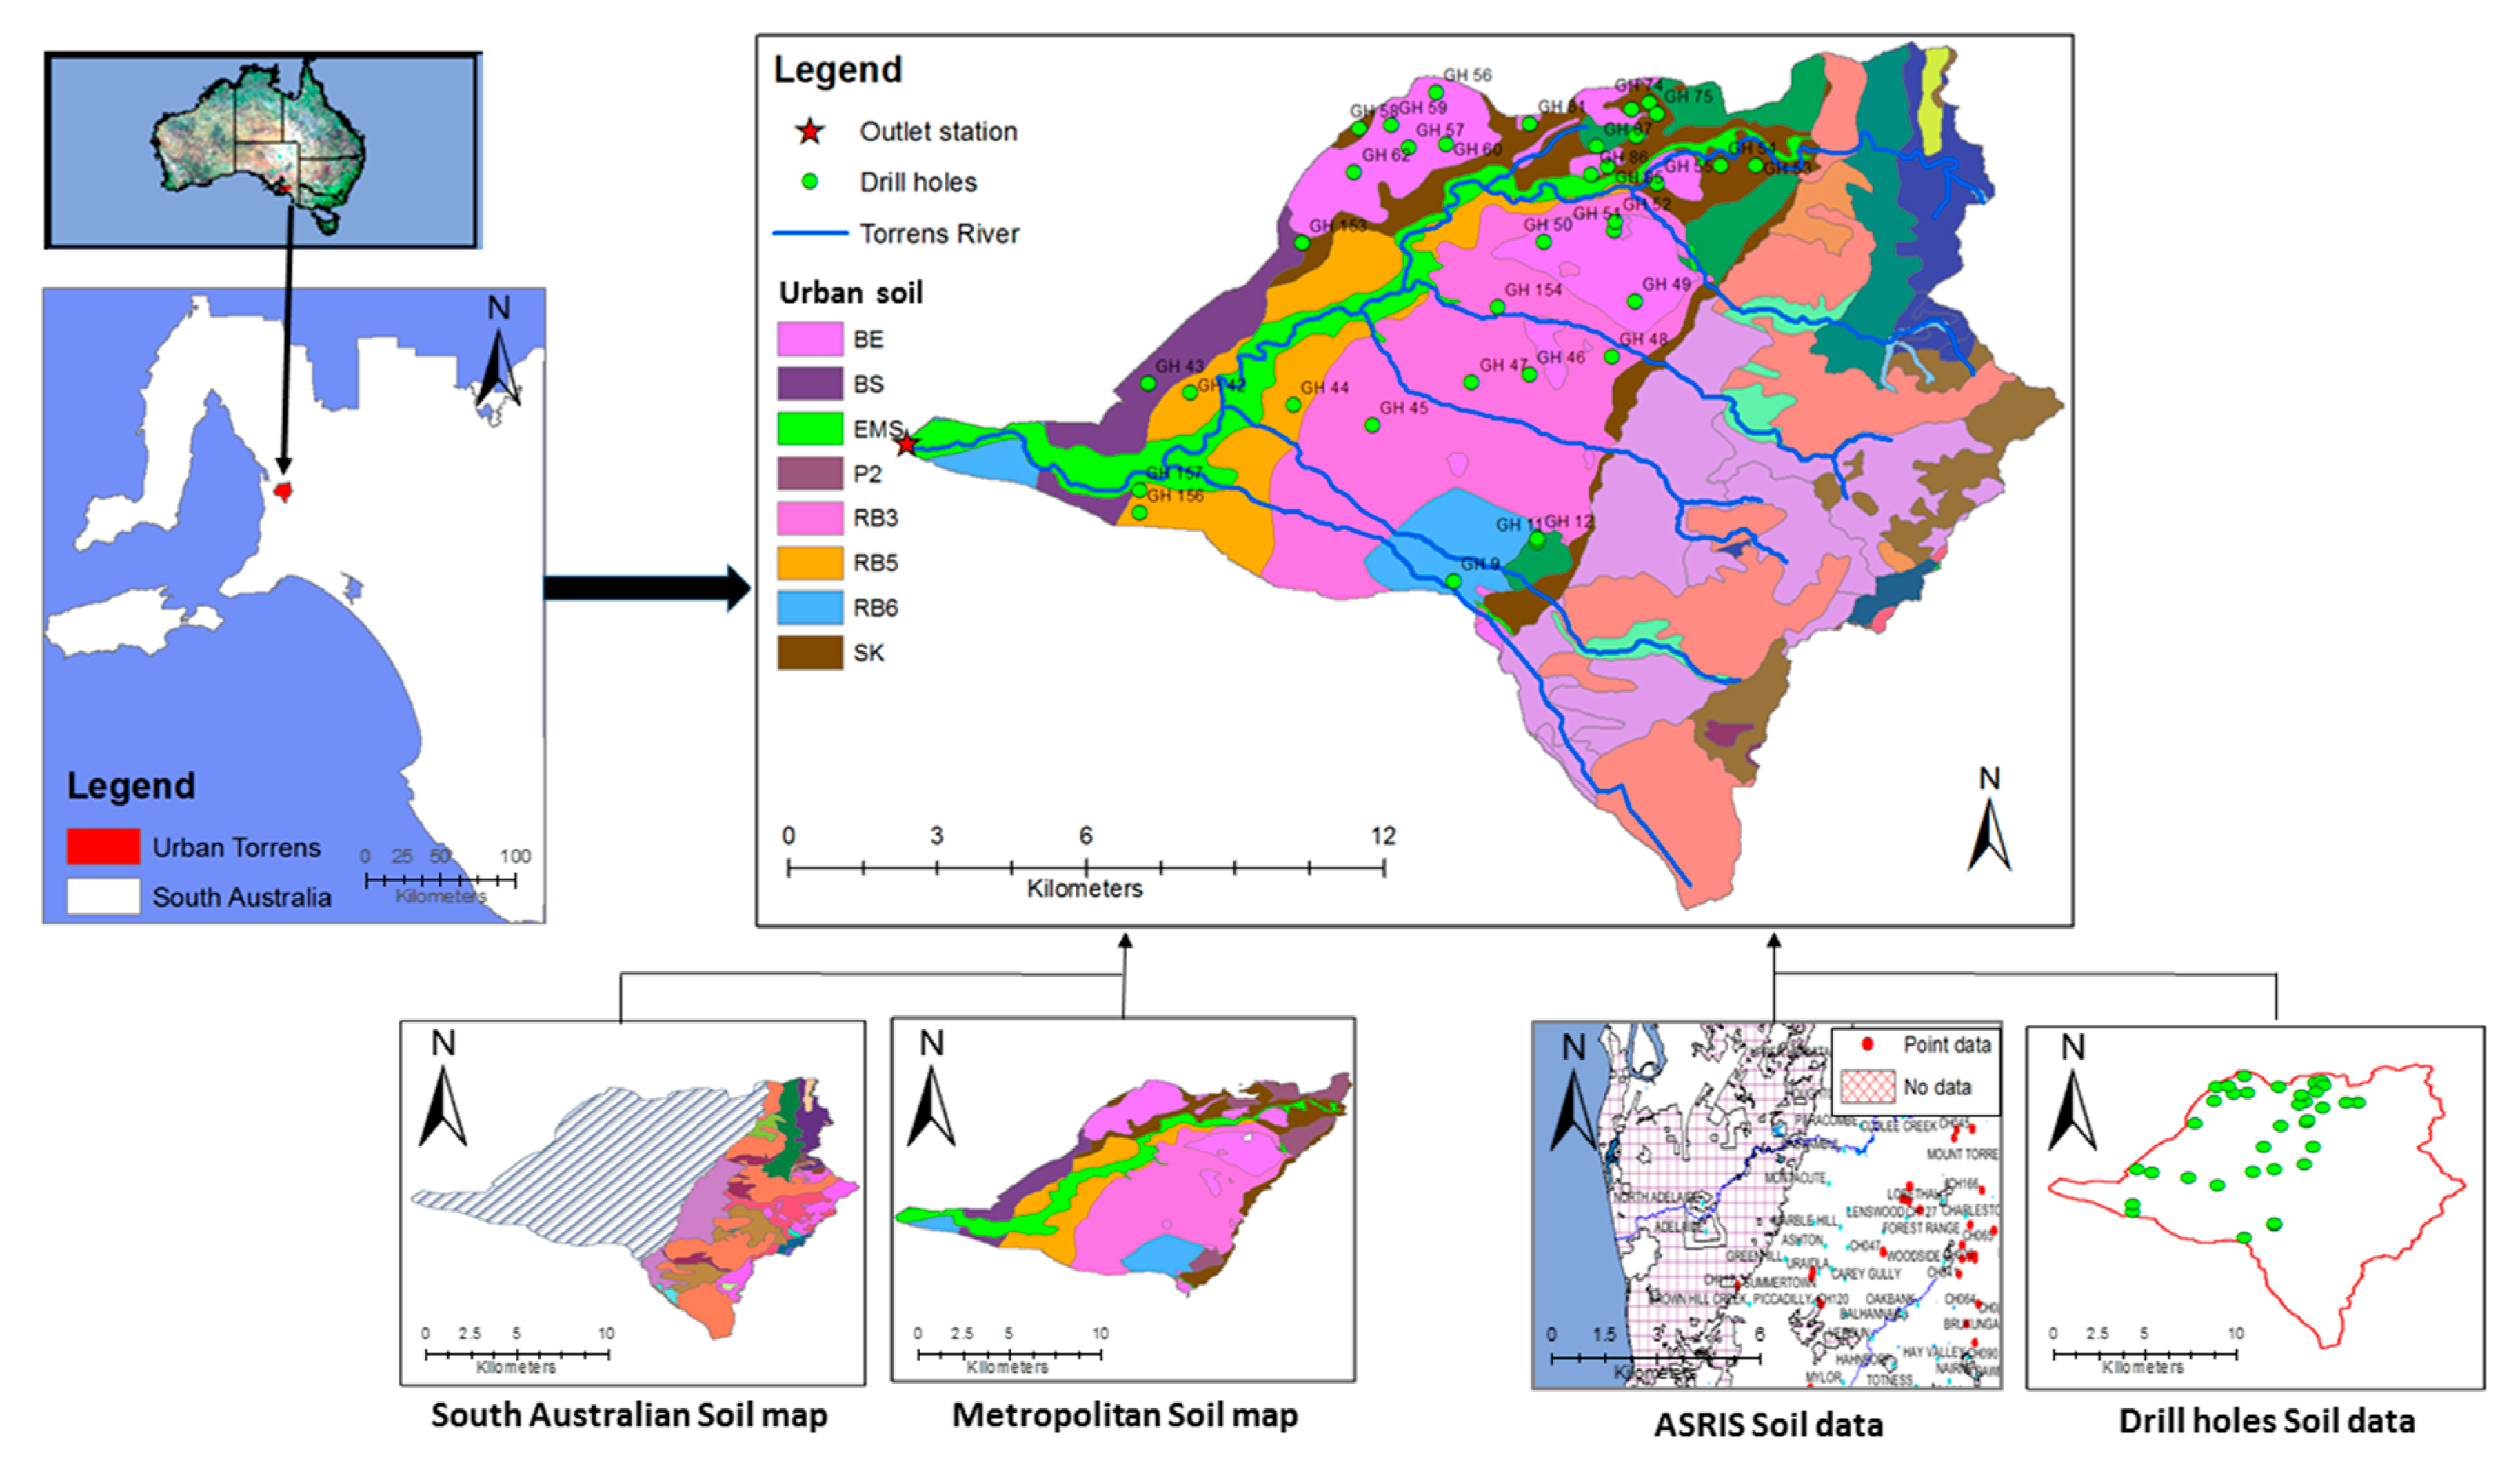
2.2.1. Soil Data
2.2.2. Other Input Data
- Digital elevation model (DEM): the 10 m resolution DEM was interpolated from a 10 m contour map provided by the SA Water Corporation.
- Flow burn-in layer: The river network was superimposed onto the DEM to adjust the location of some downstream urban creeks that were not well predicted by DEM due to modification effects from urban land development. The burn-in river layer was provided by the SA Water Corporation.
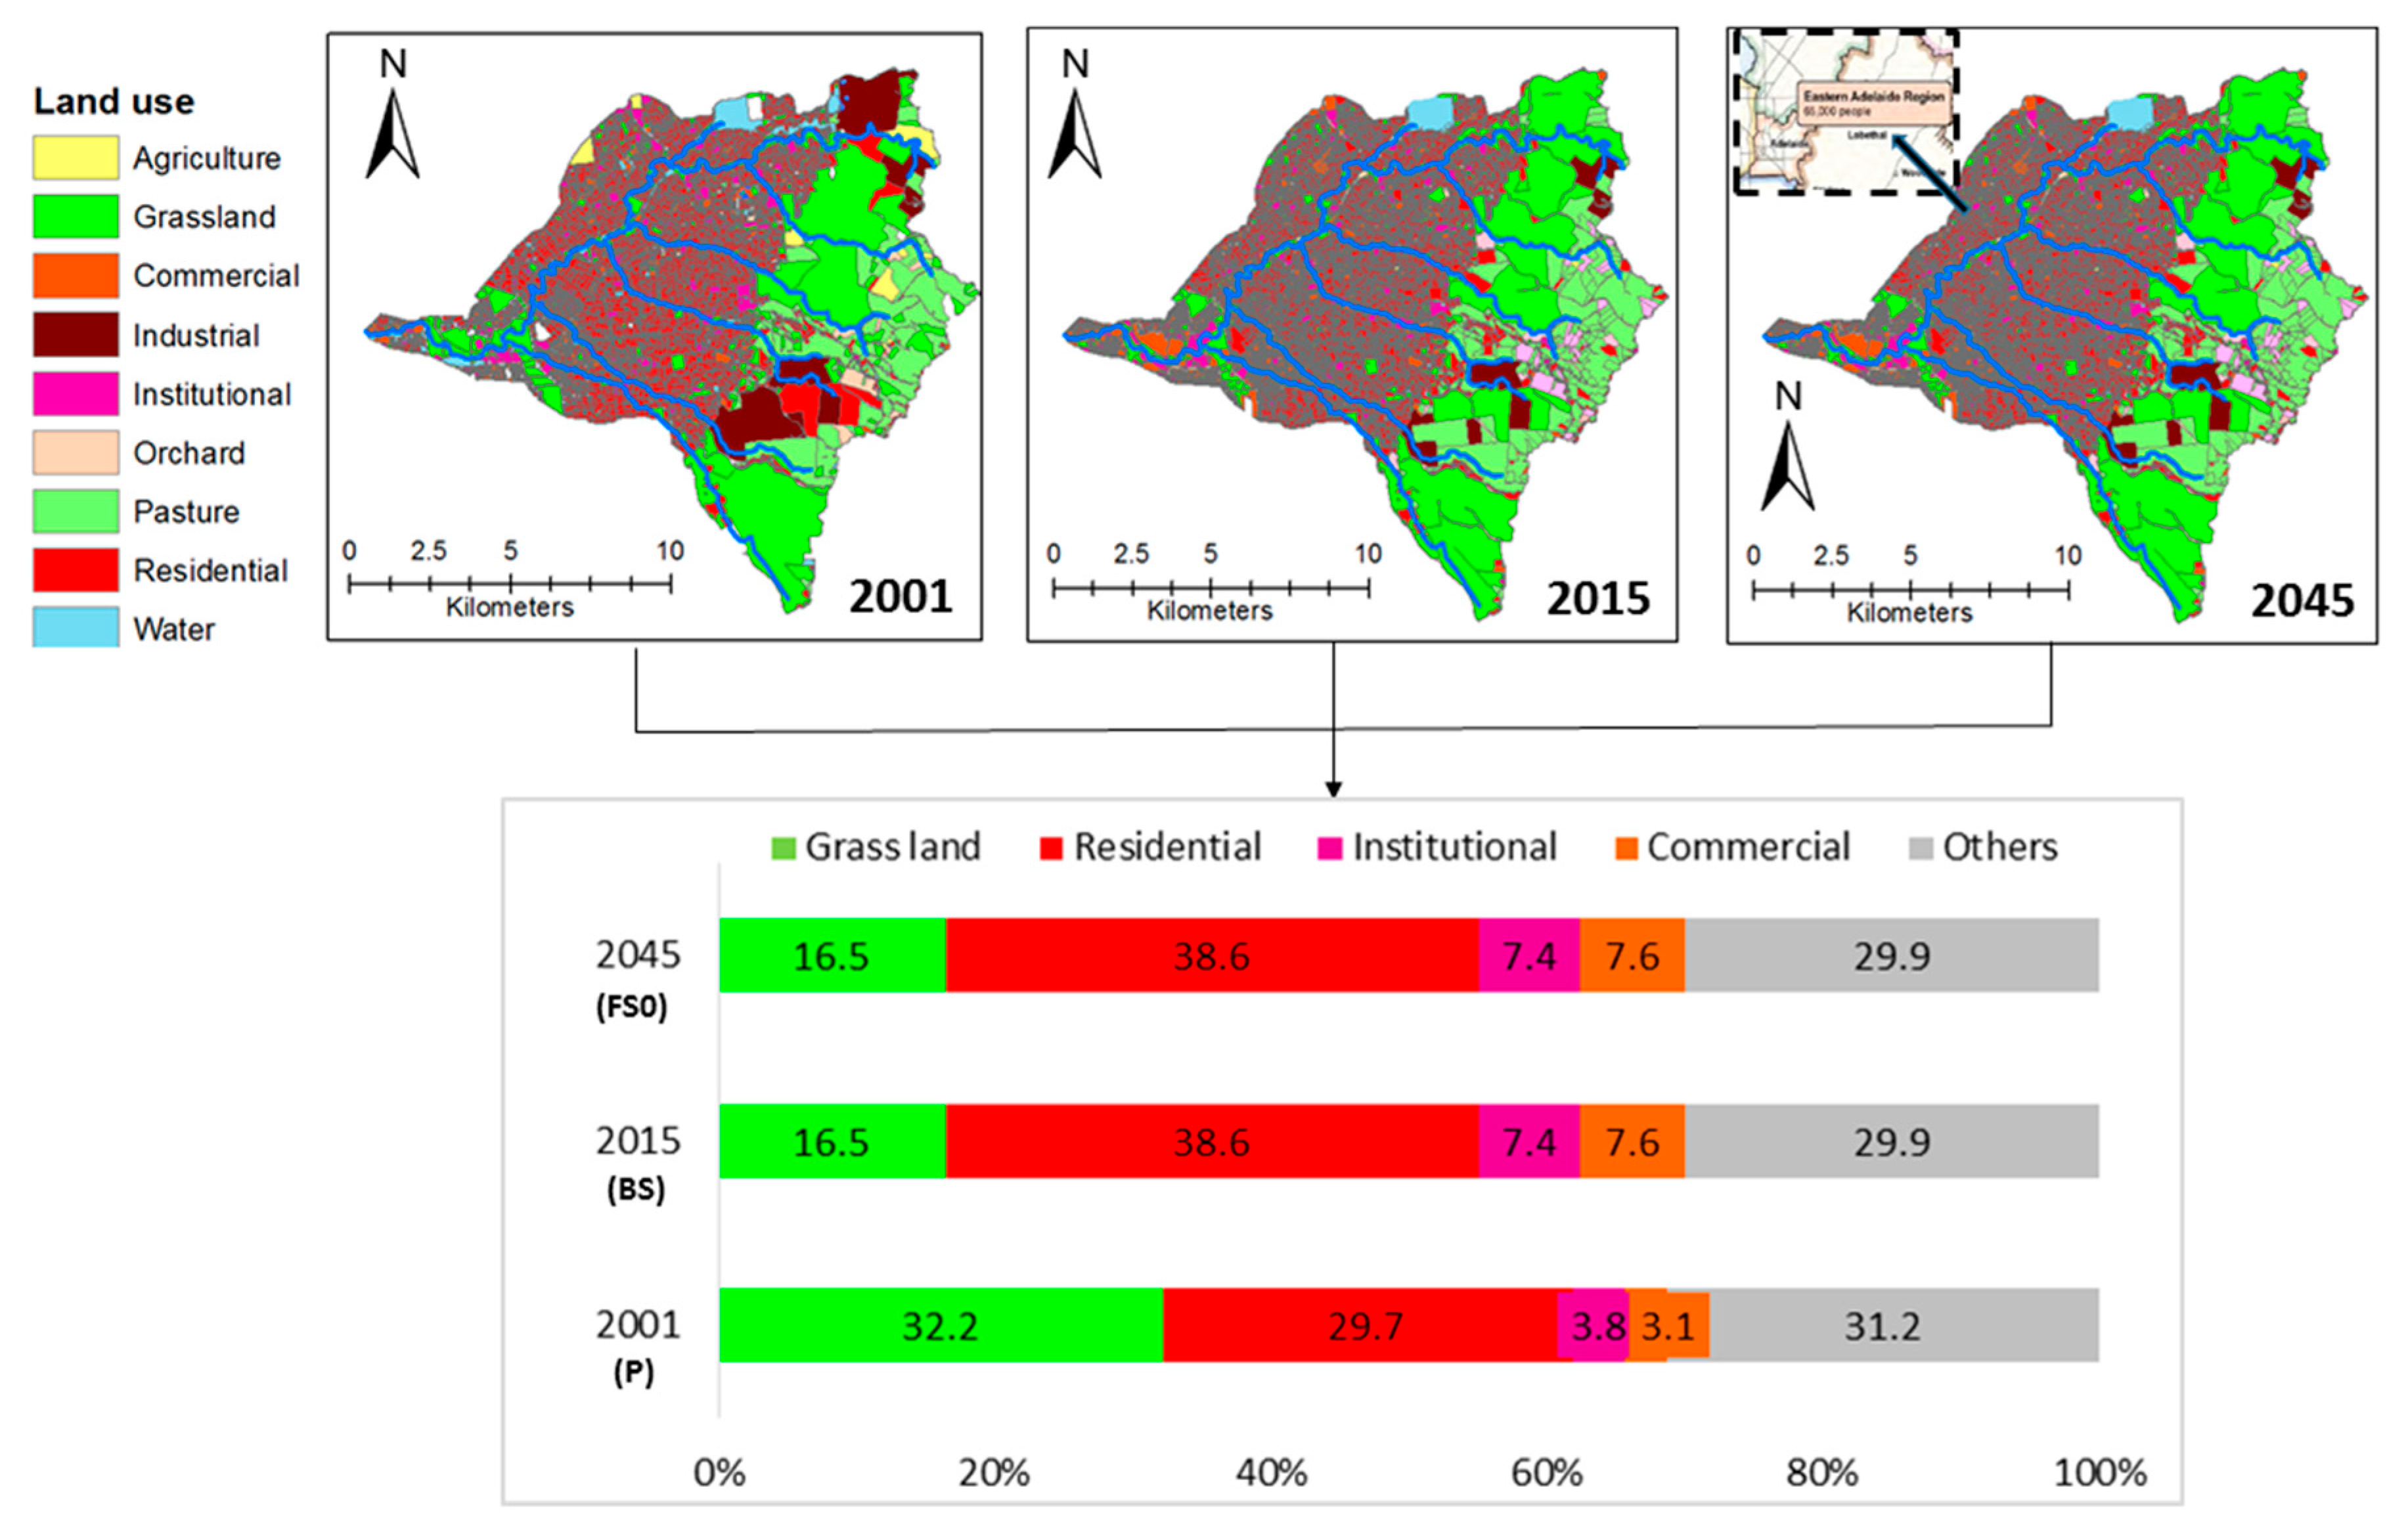
- Land use maps: a historical land use map at a scale of 1:100,000, which was completed in 2007 and updated with recent data on locations and land uses of the Torrens catchment, was provided by the Department of Environment, Water and Natural Resources. The map classifies the catchment into urban residential, commercial, institutional, industrial, transportation, water, and grassland land uses. For the past land use scenario, a historical map of 2001 of the whole South Australia was provided by the Department of Planning, Transport and Infrastructure.
- Climate data: this includes maximum and minimum air temperature, rainfall, relative humidity, and solar radiation. The daily data for these variables from 2008 to 2015 from five weather stations was extracted from the Scientific Information for Land Owners (SILO) website [35].
- Streamflow and nutrient data: data of daily streamflow and monthly composite Total Nitrogen (TN) and Total Phosphorous (TP) loads at the outlet of the study area (Holbrooks Road Station, A5040529) were provided by the Adelaide and Mount Lofty Ranges Natural Resources Management Board [36]. Data were extracted for the period from 2008 to 2015.
2.3. Soil and Water Assessment Tool (SWAT) Model Set-Up
2.3.1. Parameter Sensitivity Analysis
2.3.2. Model Calibration, Validation and Uncertainty
2.4. Scenario Analysis
- Scenario ‘Buffer strip application’ (S2) was set up by extending the 30-m width of the filter strip of alfa grass along the main river using the FILTERW parameter in SWAT ‘.mgt’ input file [51].
- Scenario ‘Wetland development’ (S3) was represented by a wetland with a maximum surface of 3445 m2 and volume of 3700 m3 in the ‘.pnd’ input file, as suggested by Kasan [52]. The nitrogen and phosphorous settling rates were set to 20 m/year using the maximum default value in the ‘.pnd’ input file for systems with high removal efficiency [38]. The bottom hydraulic conductivity was set at 2.3 mm/h [53], and sediment concentration in the wetland was defined at 10 mg/L. The same parameter values were applied to all wetland scenarios of this study.
- Combined scenario (Sm) which simulated together the three aforementioned scenarios.
3. Results
3.1. Model Sensitivity
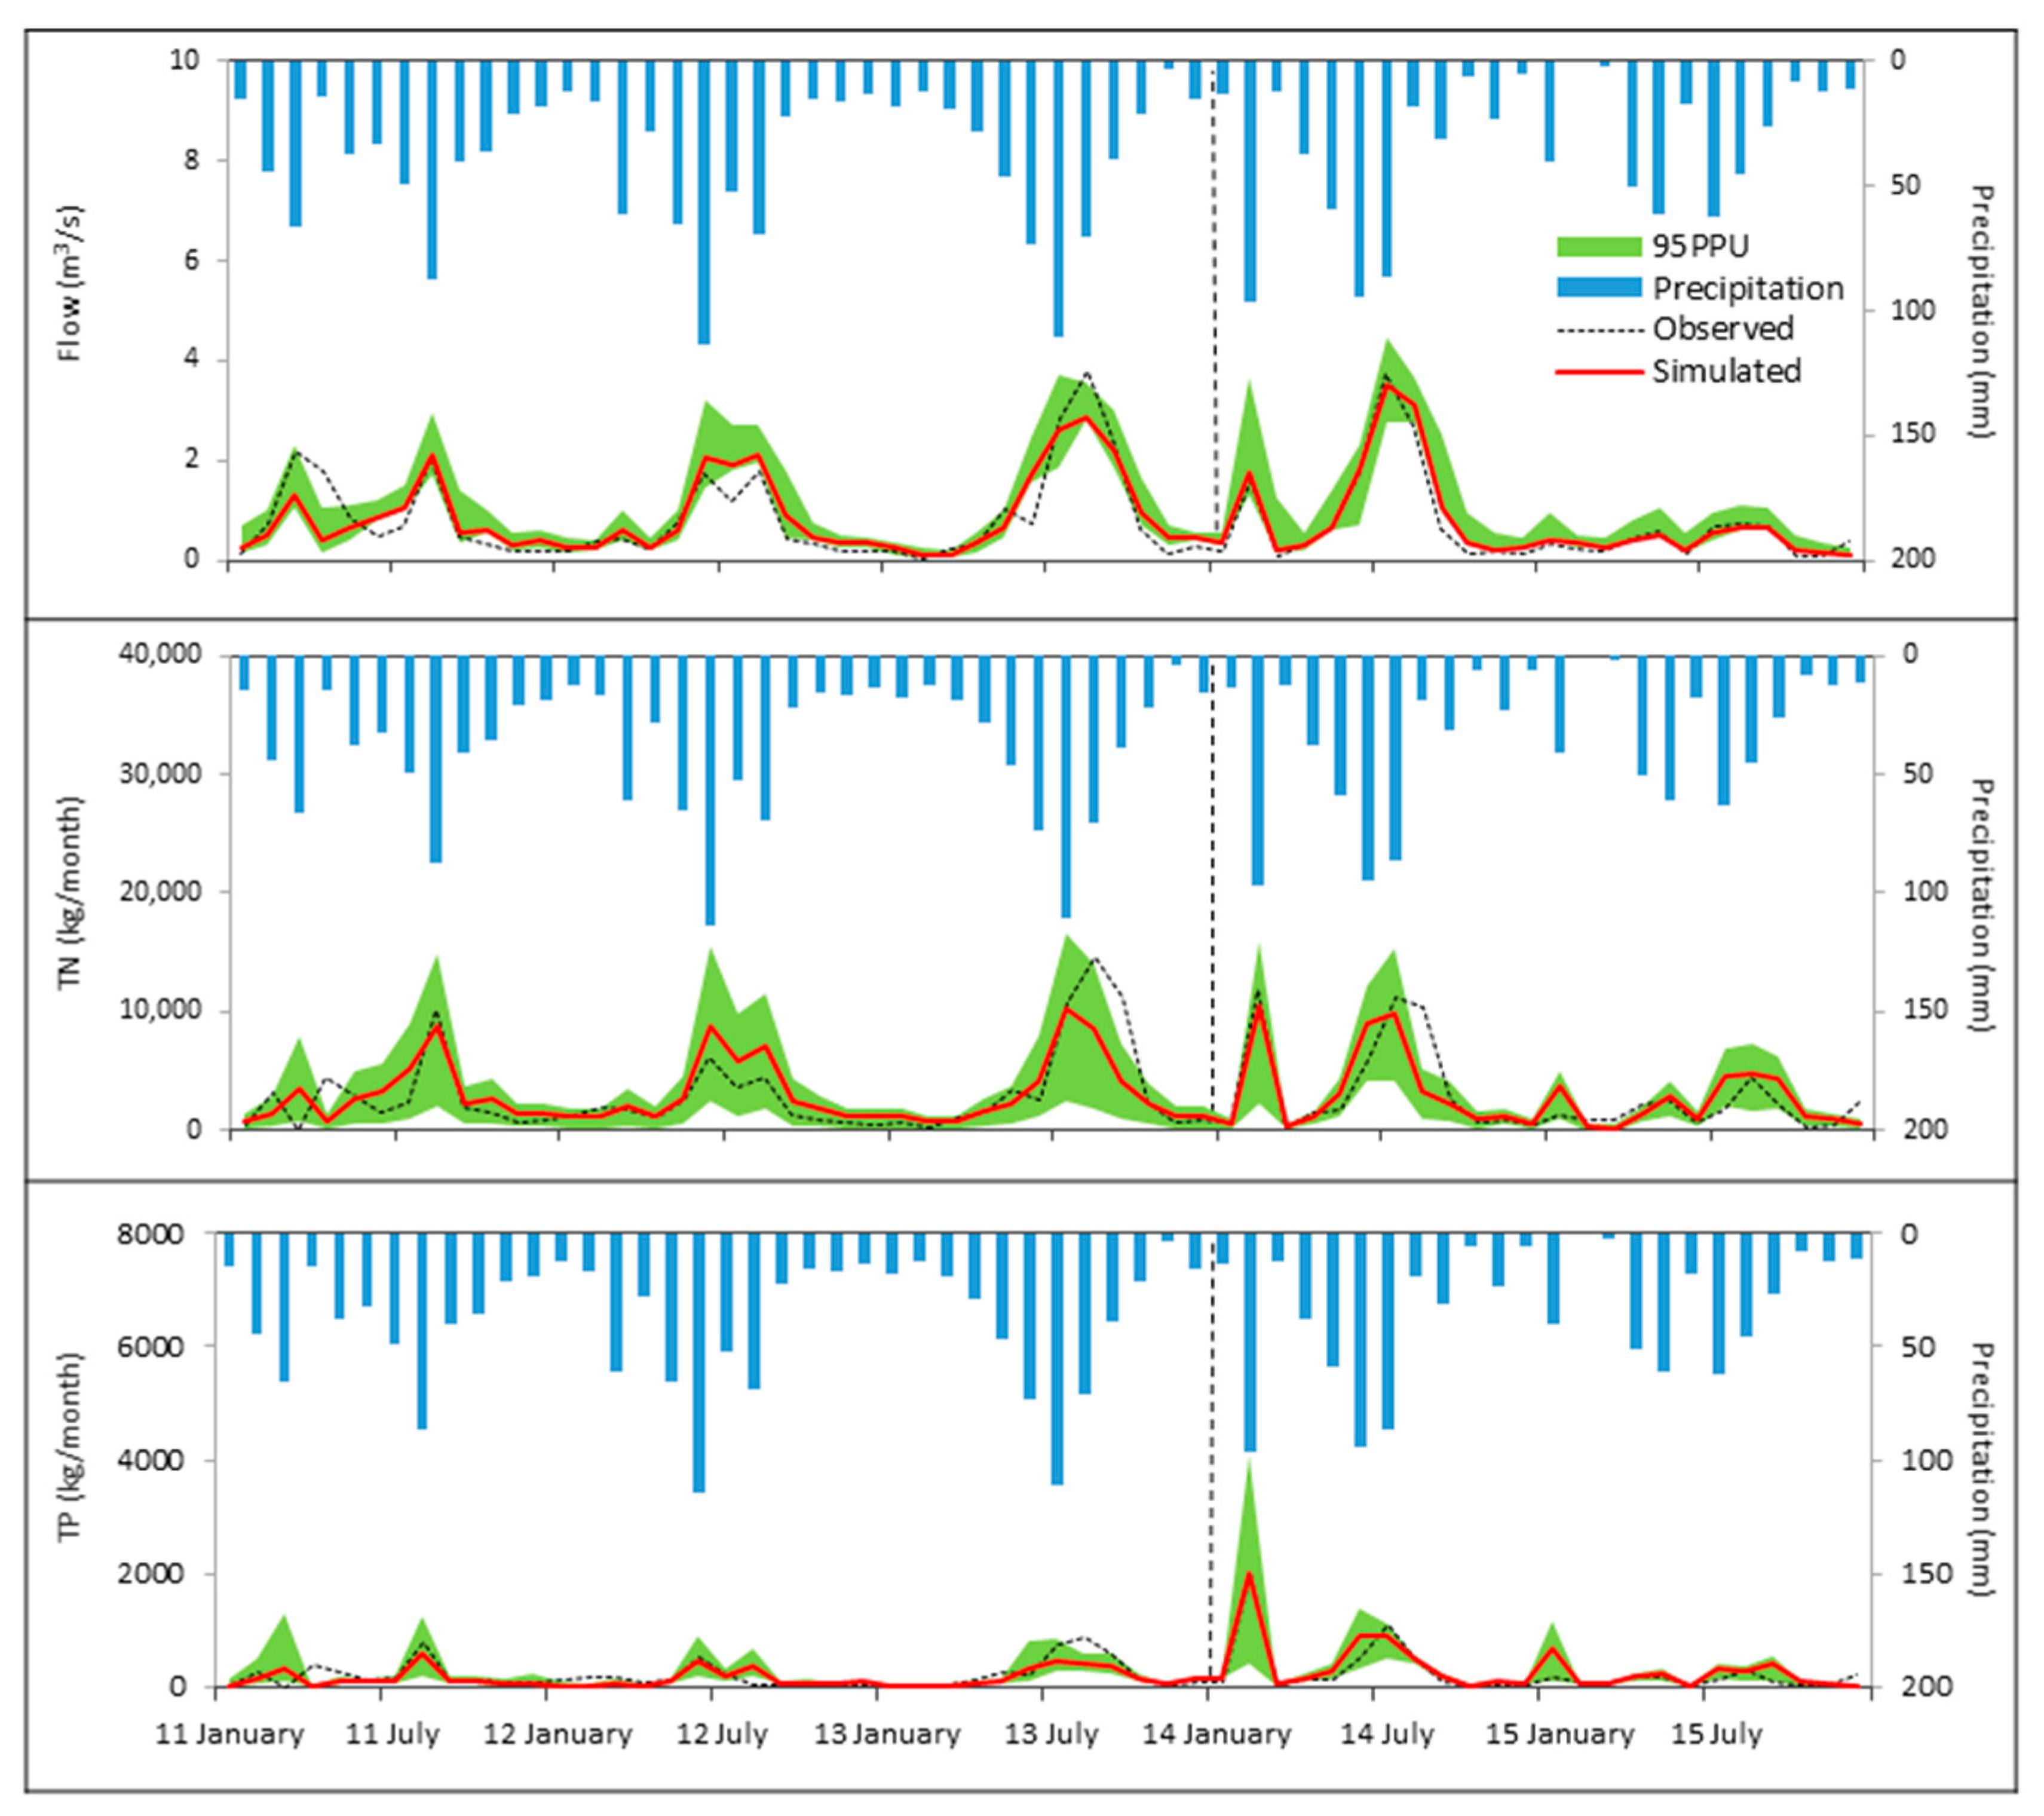
3.2. Model Calibration, Validation and Uncertainty
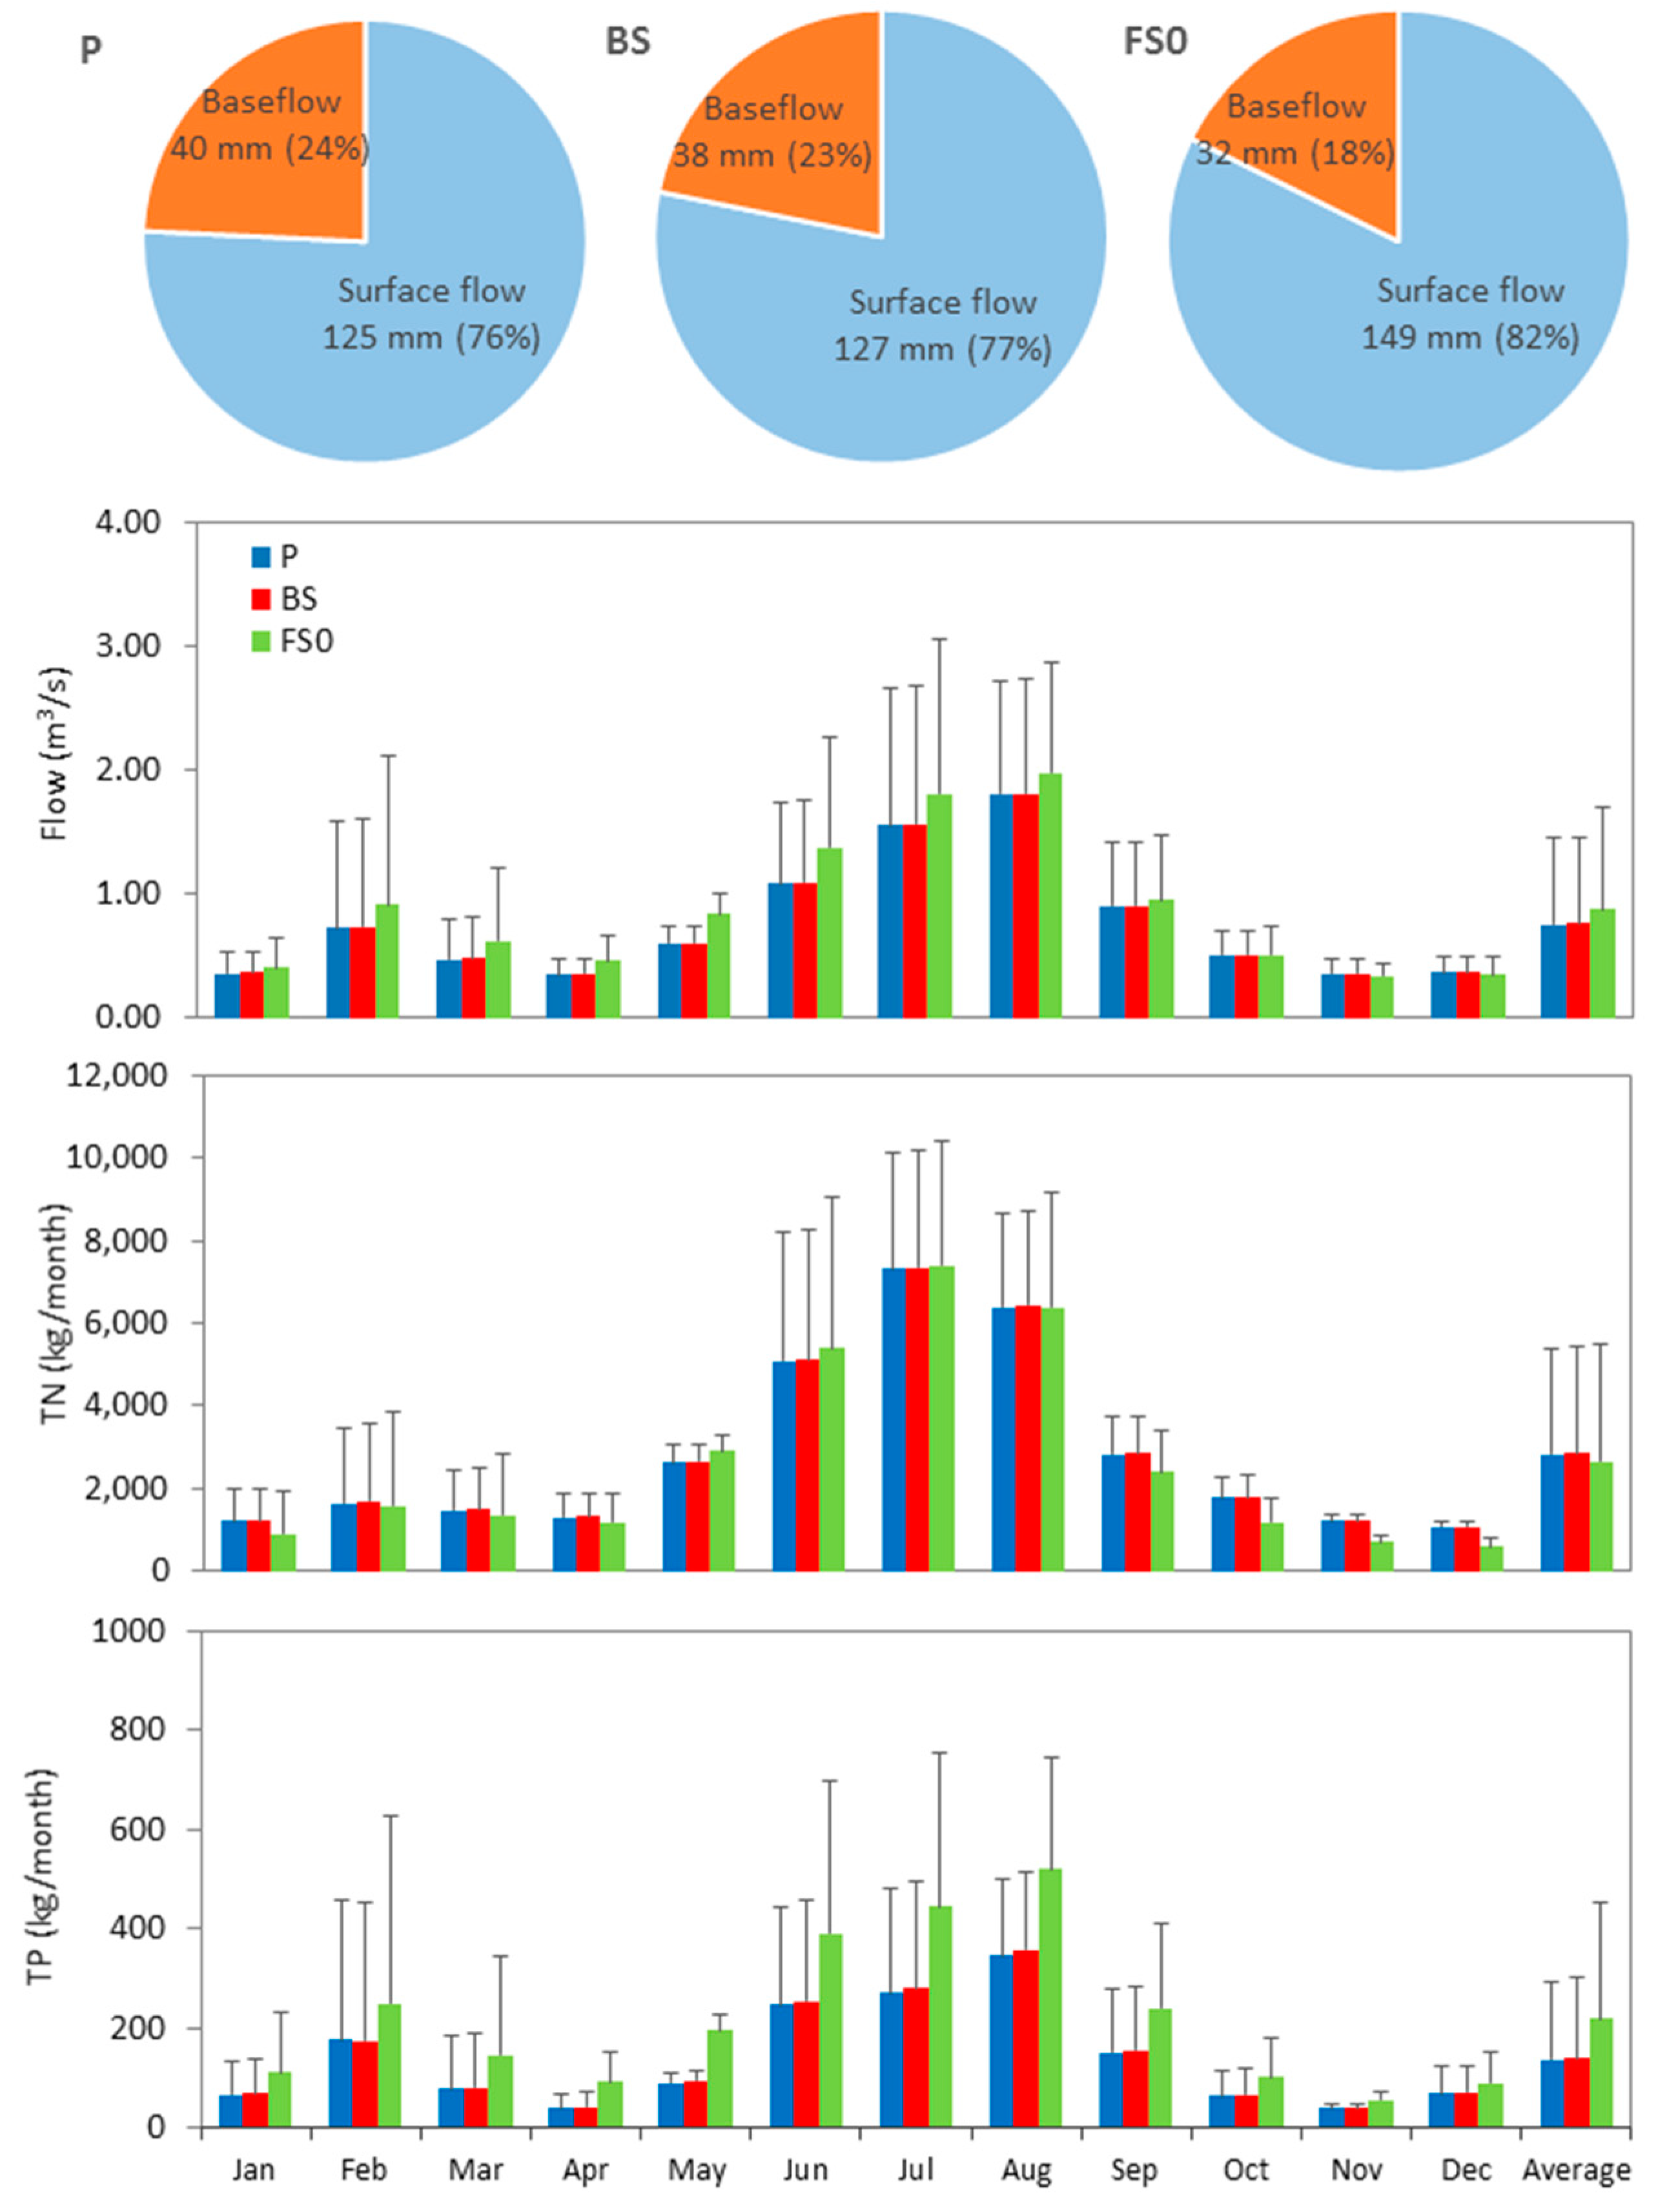
3.3. Urbanization Scenarios
3.4. Scenarios of Management Practices
4. Discussion
5. Conclusions
- Growing urbanization increases surface flow and TP loads whereas baseflow and TN loads decrease due to extending impervious area.
- Expanded buffer zones and stabilized river banks can retain nutrients while constructing adjacent wetlands may reduce run-off from tributaries to the main stream.
- A combined application of the three management options at pinpointed tributaries and river sites may prove to be the best management practice (BMP) in response to urbanization of the Torrens catchment.
Author Contributions
Funding
Acknowledgments
Conflicts of Interest
References
- United Nations. Urban and Rural Areas 2007; United Nations: New York, NY, USA, 2007; Available online: http://wwwunorg/esa/population/publications/wup2007/2007_urban_rural_chartpdf (accessed on 1 May 2017).
- Saier, M.H. Are megacities sustainable? Water Air Soil Pollut. 2007, 178, 1–3. [Google Scholar] [CrossRef]
- Xian, G.; Crane, M.; Junshan, S.J. An analysis of urban development and its environmental impact on the Tampa Bay watershed. J. Environ. Manag. 2007, 85, 965–976. [Google Scholar] [CrossRef] [PubMed]
- Evans, C.V.; Fanning, D.S.; Short, J.R. Human-influenced soils. In Managing Soils in an Urban Environment; Brown, R.B., Huddleston, J.H., Anderson, J.L., Eds.; ASSA-CSSA-SSSA Publishers: Madison, WI, USA, 2000; pp. 33–67. ISBN 0891181431. [Google Scholar]
- Doichinova, V.; Zhiyanski, M.; Hursthouse, A. Impact of urbanization on soil characteristics. Environ. Chem. Lett. 2006, 3, 160–163. [Google Scholar] [CrossRef]
- Whitehead, P.G.; Lapworth, D.J.; Skeffington, R.A.; Wade, A. Excess nitrogen leaching and C/N decline in the Tillingbourne catchment, southern England: INCA process modelling for current and historic time series. Hydrol. Earth Syst. Sci. 2002, 6, 455–466. [Google Scholar] [CrossRef]
- Zhang, Y.; Xia, J.; Shao, Q.; Zhai, X. Water quantity and quality simulation by improved SWAT in highly regulated Huai River Basin of China. Stoch. Environ. Res. Risk Assess. 2013, 27, 11–27. [Google Scholar] [CrossRef]
- Ilman, M.A.; Gell, P.A. Sediments, Hydrology and Water Quality of the River Torrens: A Modern and Historical Perspectives; Three Projects for the River Torrens; Water Catchment Management Board; Department of Geographical and Environmental Studies, University of Adelaide: Adelaide, Australia, 1998; pp. 10–53. [Google Scholar]
- Clark, T.; Humphrey, G.; Frazer, A.; Sanderson, A.; Maier, H. Effectiveness of flow management in reducing the risk of cyanobacterial blooms in rivers. In Proceedings of the Hydrology and Water Resources Symposium, Melbourne, Australia, 20–23 May 2002; Institution of Engineers: Barton, Australia, 2002. [Google Scholar]
- Brookes, J.D. River Torrens Water Quality Improvement Trial—Summer 2011/12; Goyder Institute for Water Research Technical Report Series No. 12/4; The Goyder Institute for Water Research: Adelaide, Australia, 2012. [Google Scholar]
- Wong, T.H.F. Australian Runoff Quality—A guide to Water Sensitive Urban Design Engineers Australia; Engineers Media for Australian Runoff Quality Authorship Team: Queensland, Australia, 2006. [Google Scholar]
- Zoppou, C. Review of urban storm water models. Environ. Model. Softw. 2001, 16, 195–231. [Google Scholar] [CrossRef]
- Arnold, J.G.; Srinivason, R.; Muttiah, R.R.; Williams, J.R. Large area hydrologic modeling and assessment Part I: Model development. J. Am. Water Resour. Assoc. 1998, 34, 73–89. [Google Scholar] [CrossRef]
- Gassman, P.W.; Reyes, M.R.; Green, C.H.; Arnold, J.G. The soil and water assessment tool: Historical development, applications, and future research directions. Trans. Am. Soc. Agric. Eng. 2007, 50, 1211–1250. [Google Scholar] [CrossRef]
- Neitsch, S.L.; Arnold, J.G.; Kinir, J.R.; Wiliams, J.R. Soil and Water Assessment Tool: Theoretical Documentation; Technical report no 406; Texas Water Resources Institute-Texas A&M University: College Station, TX, USA, 2011. [Google Scholar]
- Richards, C.E.; Munster, C.L.; Vietor, D.M.; Arnold, J.G.; White, R. Assessment of a turfgrass sod best management practice on water quality in a suburban watershed. J. Environ. Manag. 2008, 86, 229–245. [Google Scholar] [CrossRef]
- Zhou, F.; Xu, Y.; Chen, Y.; Xu, C.Y.; Gao, Y.; Du, J. Hydrological response to urbanization at different spatio-temporal scales simulated by coupling of CLUE-S and the SWAT model in the Yangtze River Delta region. J. Hydrol. 2013, 485, 113–125. [Google Scholar] [CrossRef]
- Qiu, Z.; Wang, L. Hydrological and Water quality assessment in a Suburban watershed with mixed land uses using the SWAT model. J. Hydrol. Eng. 2014, 19, 816–828. [Google Scholar] [CrossRef]
- Sunde, M.; He, H.S.; Hubbart, J.A.; Scroggins, C. Forecasting streamflow response to increased imperviousness in an urbanizing Midwestern watershed using a coupled modeling approach. Appl. Geogr. 2016, 72, 14–25. [Google Scholar] [CrossRef]
- Schütte, S.; Schulze, R.E. Projected impacts of urbanisation on hydrological resource flows: A case study within the uMngeni Catchment, South Africa. J. Environ. Manag. 2017, 196, 527–543. [Google Scholar] [CrossRef]
- Jordan, Y.C.; Ghulam, A.; Hartling, S. Traits of surface water pollution under climate and land use changes: A remote sensing and hydrological modeling approach. Earth-Sci. Rev. 2014, 128, 181–196. [Google Scholar] [CrossRef]
- Wang, R.; Kalin, L. Combined and synergistic effects of climate change and urbanization on water quality in the Wolf Bay watershed, southern Alabama. J. Environ. Sci. 2018, 64, 107–121. [Google Scholar] [CrossRef]
- Lee, T.; Wang, X.; White, M.; Tuppad, P.; Srinivasan, R.; Narasimhan, B.; Andrews, D. Modeling Water-quality loads to the reservoirs of the Upper Trinity River basin, Texas, USA. Water 2015, 7, 5689–5704. [Google Scholar] [CrossRef]
- El-Khoury, A.; Seidou, O.; Lapen, D.R.; Que, Z.; Mohammadian, M.; Sunohara, M.; Bahram, D. Combined impacts of future climate and land use changes on discharge, nitrogen and phosphorus loads for a Canadian river basin. J. Environ. Manag. 2015, 15, 76–86. [Google Scholar] [CrossRef] [PubMed]
- Saha, P.P.; Zeleke, K. Rainfall-Runoff Modelling for Sustainable Water Resources Management: SWAT Model Review. In Sustainability of Integrated Water Resources Management Water Governance, Climate and Ecohydrology; Setegn, S.G., Donoso, M.C., Eds.; Springer International Publishing: Basel, Switzerland, 2015. [Google Scholar]
- Vanderkruk, K.; Owen, K.; Grace, M.; Thompson, R. Review of Existing Nutrient, Suspended Solid and Metal Models. Scientific Review for Victorian Department of Sustainability and Environment. Available online: https://ensymdsevicgovau/docs/DSE_EnSym_WQ_Review_RT051009_final_correctionpdf (accessed on 5 January 2017).
- Shrestha, M.K.; Recknagel, F.; Frizenschaf, J.; Meyer, W. Assessing SWAT models on single and multi-site calibration for the simulation of flow and nutrients loads in the semi-arid Onkaparinga catchment in South Australia. Agric. Water Manag. 2016, 175, 61–71. [Google Scholar] [CrossRef]
- Nguyen, H.H.; Recknagel, F.; Meyer, W.; Frizenschaf, J.; Shrestha, M.K. Modelling the impacts of altered management practices, land use and climate changes on the water quality of the Millbrook catchment—Reservoir system of South Australia. J. Environ. Manag. 2017, 202, 1–11. [Google Scholar] [CrossRef]
- Gale, R.J.B.; Gale, S.J.; Winchester, H.P.M. Inorganic pollution of the sediments of the River Torrens, South Australia. Environ. Geol. 2006, 50, 62–75. [Google Scholar] [CrossRef]
- Shread, M.J.; Borrman, G.M. Soils, Stratigraphy and Engineering Geology of near Surface Materials of the Adelaide Plains; Department of Mines and Energy South Australia: Adelaide, Australia, 1996. [Google Scholar]
- Australian Soil Resources Information System (ASRIS). Available online: http://www.asris.csiro.au/mapping/viewer.htm (accessed on 1 March 2015).
- Ritchie, J.T.; Gerakis, A.; Suleiman, A. Simple model to estimate field measured soil water limits. Trans. ASAE 1999, 42, 1609–1614. [Google Scholar] [CrossRef]
- Suleiman, A.; Ritchie, J.T. Estimating saturated hydraulic conductivity from soil porosity. Trans. ASAE 2001, 44, 235–239. [Google Scholar] [CrossRef]
- Meyer, W.S. Land use potential for forestry (Radiata Pine and Blue Gum). In South East Water Science Review: Prepared for Lower Limestone Coast Taskforce; South Australian Department of Water, Land and Biodiversity Conservation (DWLBC): Adelaide, Australia, 2010; p. 32. [Google Scholar]
- Scientific Information for Land Owners (SILO). Available online: https://www.longpaddock.qld.gov.au/silo/ppd/index.php (accessed on 15 July 2016).
- AMLR. Available online: http://amlr.waterdata.com.au/Amlr.aspx (accessed on 10 March 2016).
- Winchell, M.; Srinivasan, R.; Di Luzio, M.; Arnold, J. ArcSWAT Interface for SWAT 2012, User’s Guide; United States Academic Decathlon (USDA): Mankato, MN, USA, 2013. [Google Scholar]
- Arnold, J.G.; Moriasi, D.N.; Gassman, P.W.; Abbaspour, K.C.; White, M.J.; Srinivasan, R.; Santhi, C.; Harmel, R.D.; van Griensven, A.; Van Liew, M.W.; et al. SWAT: Model use, calibration, validation. Trans. ASABE Am. Soc. Agric. Eng. 2012, 55, 1491–1508. [Google Scholar] [CrossRef]
- Abbaspour, K.C.; Johnson, C.; van Genuchten, M.T. Estimating uncertain flow and transport parameters using a sequential uncertainty fitting procedure. Vadose Zone J. 2004, 3, 1340–1352. [Google Scholar] [CrossRef]
- Abbaspour, K.C.; Rouholahnejad, E.; Vaghefi, S.; Srinivasan, R.; Yang, H.; Kløve, B. A continental-scale hydrology and water quality model for Europe: Calibration and uncertainty of a high-resolution large-scale SWAT model. J. Hydrol. 2015, 524, 733–752. [Google Scholar] [CrossRef]
- Ficklin, D.L.; Lue, Y.; Zhang, M. Watershed modelling of hydrology and water quality in the Sacramento River watershed, California. Hydrol. Process. 2013, 27, 236–250. [Google Scholar] [CrossRef]
- Nash, J.E.; Sutcliffe, J.V. River flow forecasting through conceptual models: Part I A discussion of principles. J. Hydrol. 1970, 10, 282–290. [Google Scholar] [CrossRef]
- Beven, K.J. Binley, A.M. The future of distributed models: Model calibration and uncertainty prediction. Hydrol. Proc. 1992, 6, 279–298. [Google Scholar] [CrossRef]
- Moriasi, D.N.; Arnold, J.G.; Van Liew, M.W.; Bingner, R.L.; Harmel, R.D.; Veith, T.L. Model evaluation guidelines for systematic quantification of accuracy in watershed simulations. Trans. ASABE 2007, 50, 885–900. [Google Scholar] [CrossRef]
- Abbaspour, K.C. SWAT-CUP: SWAT Calibration and Uncertainty Programs—A User Manual; Swiss Federal Institute of Aquatic Science and Technology: Dübendorf, Switzerland, 2015. [Google Scholar]
- DPLG. The 30-Year Plan for Greater Adelaide. A Volume of the South Australian Planning Strategy, Department of Planning and Local Government, 2010. Available online: https://livingadelaidesagovau/__data/assets/pdf_file/0007/278332/The_30-Year_Plan_for_Greater_Adelaide_2010_compressedpdf (accessed on 10 January 2017).
- Nguyen, H.H.; Recknagel, F.; Meyer, W. Modelling the runoff, nutrient and sediment loadings in the Torrens river catchment, South Australia using SWAT. In Proceedings of the 22nd International Congress on Modelling and Simulation, Tasmania, Australia, 3–8 December 2017; pp. 1–7. [Google Scholar]
- Tuppad, P.; Kannan, N.; Srinivasan, R.; Rossi, C.; Arnold, J. Simulation of agricultural management alternatives for watershed protection. Water Resour. Manag. 2010, 24, 3115–3144. [Google Scholar] [CrossRef]
- Moriasi, D.N.; Steiner, J.L.; Arnold, J.G. Sediment Measurement and Transport Modeling: Impact of Riparian and Filter Strip Buffers. J. Environ. Qual. 2011, 40, 807–814. [Google Scholar] [CrossRef] [PubMed]
- Motsinger, J.; Kalita, P.; Bhattarai, R. Analysis of Best Management Practices Implementation on Water Quality Using the Soil and Water Assessment Tool. Water 2016, 8, 145. [Google Scholar] [CrossRef]
- Nielsen, A.; Trolle, D.; Wang, M.; Luo, L.; Han, B.P.; Liu, Z.; Olesen, J.E.; Jeppesen, E. Assessing ways to combat eutrophication in a Chinese drinking water reservoir using SWAT. Mar. Freshw. Res. 2013, 64, 475–492. [Google Scholar] [CrossRef]
- Kasan, N.A. Nutrient Retention Capacity of a Constructed Wetland in the Cox Creek Sub-Catchment of the Mt. Bold Reservoir, South Australia. Ph.D. Thesis, University of Adelaide, Adelaide, Australia, 2011. [Google Scholar]
- White, J.D.; Prochnow, S.J.; Filstrup, C.T.; Byars, B.W. A combined watershed-water quality modeling analysis of the Lake Waco reservoir: II. Watershed and reservoir management options and outcomes. Lake Reserv. Manag. 2010, 26, 159–167. [Google Scholar] [CrossRef]
- Fleming, N.; Cox, J.; He, Y.; Thomas, S.; Frizenschaf, J. Analysis of Constituent Concentrations in the Mount Lofty Ranges for Modelling Purposes; Technical Report; eWater Cooperative Research Centre: Adelaide, Australia, 2010; pp. 1–37. [Google Scholar]
- Brun, S.E.; Band, L.E. Simulating runoff behavior in an urbanizing watershed. Comput. Environ. Urban Syst. 2000, 24, 5–22. [Google Scholar] [CrossRef]
- Tasdighi, A.; Arabi, M.; Harmel, D. A probabilistic appraisal of rainfall-runoff modeling approaches within SWAT in mixed land use watersheds. J. Hydrol. 2018, 564, 476–489. [Google Scholar] [CrossRef]


| Soil Profile | Layer (s) | Soil Parameters * | Data Source | |||||||||
|---|---|---|---|---|---|---|---|---|---|---|---|---|
| SOL_Z | SOL_BD | SOL_AWC | SOL_K | SOL_CBN | CLAY | SILT | SAND | SOL_ALB | USLE_K | |||
 | 1 | 975 | 1.379 | 0.131 | 21.6 | 2.25 | 43 | 27 | 30 | 0.17 | 0.051 | Drill holes [30] |
| 2 | 4071 | 1.389 | 0.132 | 23.3 | 0.50 | 43 | 30 | 27 | 0.17 | 0.051 | ||
 | 1 | 126 | 1.403 | 0.129 | 31.0 | 2.76 | 16 | 18 | 66 | 0.18 | 0.051 | ASRIS [31] |
| 2 | 217 | 1.503 | 0.126 | 20.7 | 0.73 | 16 | 13 | 71 | 0.18 | 0.051 | ||
| 3 | 349 | 1.428 | 0.132 | 7.0 | 0.49 | 43 | 37 | 20 | 0.18 | 0.058 | ||
| 4 | 498 | 1.437 | 0.132 | 7.1 | 0.25 | 38 | 36 | 25 | 0.18 | 0.058 | ||
| 5 | 876 | 1.344 | 0.130 | 4.8 | 0.14 | 26 | 25 | 38 | 0.18 | 0.050 | ||
| Parameters | Description | Unit | Fitted Value | Parameter Sensitivity | ||
|---|---|---|---|---|---|---|
| t-Stat | p-Value | Rank | ||||
| Streamflow | ||||||
| CN2.mgt | Moisture condition II runoff curve number | - | −0.25 b | −63.56 | 0.00 | 1 |
| ALPHA_BNK.rte | Baseflow alpha factor for bank storage | - | 0.72 | 29.20 | 0.00 | 2 |
| SOL_BD (1,2) a.sol | Moist bulk density | g/cm3 | −0.19 b | −24.50 | 0.00 | 3 |
| GWQMN.gw | Threshold depth of water in the shallow aquifer required for return flow to occur | mm H2O | 1854 | 17.00 | 0.00 | 4 |
| ESCO.hru | Soil evaporation compensation factor | - | 0.75 | −11.91 | 0.00 | 5 |
| SOL_K (1,2) a.sol | Saturated hydraulic conductivity | mm/h | −0.17 b | −8.66 | 0.00 | 6 |
| SOL_AWC (1,2) a | Available water capacity of the soil layer | mm H20/mm soil | −0.02 b | 7.40 | 0.00 | 7 |
| CH_K2.rte | Effective hydraulic conductivity in main channel alluvium | mm/h | 59.6 | −7.08 | 0.00 | 8 |
| CH_N2.rte | Manning’s "n" value for the main channel | - | 0.04 | −5.98 | 0.00 | 9 |
| GW_REVAP.gw | Groundwater "revap" coefficient | mm H2O | 0.19 | 3.66 | 0.00 | 10 |
| GW_DELAY.gw | Groundwater delay | days | 221.3 | 3.51 | 0.00 | 11 |
| RCHRG_DP.gw | Deep aquifer percolation fraction | - | 0.17 | −2.94 | 0.00 | 12 |
| Total Suspended Solid Load | ||||||
| USLE_P.mgt | USLE equation support practice factor | - | 0.39 | −63.26 | 0.00 | 1 |
| CH_COV1.rte | Channel erodibility factor | - | 0.32 | 1.98 | 0.05 | 2 |
| SPEXP.bsn | Exponent parameter for calculating sediment re-entrained in channel sediment routing | - | 1.12 | 1.76 | 0.08 | 3 |
| CH_EROD.rte | Channel erodibility factor | - | 0.56 | 1.30 | 0.19 | 4 |
| SPCON.bsn | Linear parameter for calculating the maximum amount of sediment that can be reentrained during channel sediment routing | - | 0.006 | 0.38 | 0.70 | 5 |
| CH_COV2.rte | Channel cover factor | - | 0.62 | 0.04 | 0.97 | 6 |
| Total Nitrogen Load | ||||||
| LAT_ORGN.gw | Organic N in the baseflow | mg/L | 6.33 | −167.44 | 0.00 | 1 |
| CDN.bsn | Denitrification exponential rate coefficient | - | 0.56 | −7.49 | 0.00 | 2 |
| SDNCO.bsn | Denitrification threshold water content | - | 0.73 | 3.8 | 0.00 | 3 |
| ERORGN.hru | Organic nitrogen enrichment ratio | - | 1.27 | −1.08 | 0.28 | 4 |
| NPERCO.bsn | Nitrogen percolation coefficient | - | 0.15 | −0.23 | 0.82 | 5 |
| Total Phosphorous Load | ||||||
| PHOSKD.bsn | Phosphorus soil partitioning coefficient | - | 187.03 | −0.88 | 0.38 | 1 |
| PSP.bsn | Phosphorus sorption coefficient | - | 0.06 | −0.78 | 0.43 | 2 |
| ERORGP.hru | Organic phosphorus enrichment ratio | - | 2.51 | 0.49 | 0.62 | 3 |
| Scenarios | Flow | TN Load | TP Load | |||
|---|---|---|---|---|---|---|
| Mean Values (m3/s) | Relative Change (%) | Mean Values (tons/year) | Relative Change (%) | Mean Values (tons/year) | Relative Change (%) | |
| River bank stabilization—S1 | 0.88 | <1 | 31.65 a | −1.22 | 2.57 a | −2.73 |
| 30-m buffer strips—S2 | 0.88 | <1 | 25.67 a | −19.88 | 2.53 a | −4.13 |
| Wetland development—S3 | 0.86 a | −2.27 | 31.76 a | −0.87 | 2.58 a | −2.44 |
| Combined BMPs—Sm | 0.86 a | −2.28 | 25.21 a | −21.30 | 2.47 a | −6.40 |
© 2018 by the authors. Licensee MDPI, Basel, Switzerland. This article is an open access article distributed under the terms and conditions of the Creative Commons Attribution (CC BY) license (http://creativecommons.org/licenses/by/4.0/).
Share and Cite
Nguyen, H.H.; Recknagel, F.; Meyer, W. Water Quality Control Options in Response to Catchment Urbanization: A Scenario Analysis by SWAT. Water 2018, 10, 1846. https://doi.org/10.3390/w10121846
Nguyen HH, Recknagel F, Meyer W. Water Quality Control Options in Response to Catchment Urbanization: A Scenario Analysis by SWAT. Water. 2018; 10(12):1846. https://doi.org/10.3390/w10121846
Chicago/Turabian StyleNguyen, Hong Hanh, Friedrich Recknagel, and Wayne Meyer. 2018. "Water Quality Control Options in Response to Catchment Urbanization: A Scenario Analysis by SWAT" Water 10, no. 12: 1846. https://doi.org/10.3390/w10121846
APA StyleNguyen, H. H., Recknagel, F., & Meyer, W. (2018). Water Quality Control Options in Response to Catchment Urbanization: A Scenario Analysis by SWAT. Water, 10(12), 1846. https://doi.org/10.3390/w10121846