Projected Changes in Hydrological Variables in the Agricultural Region of Alberta, Canada


Abstract
1. Introduction
2. Methodology
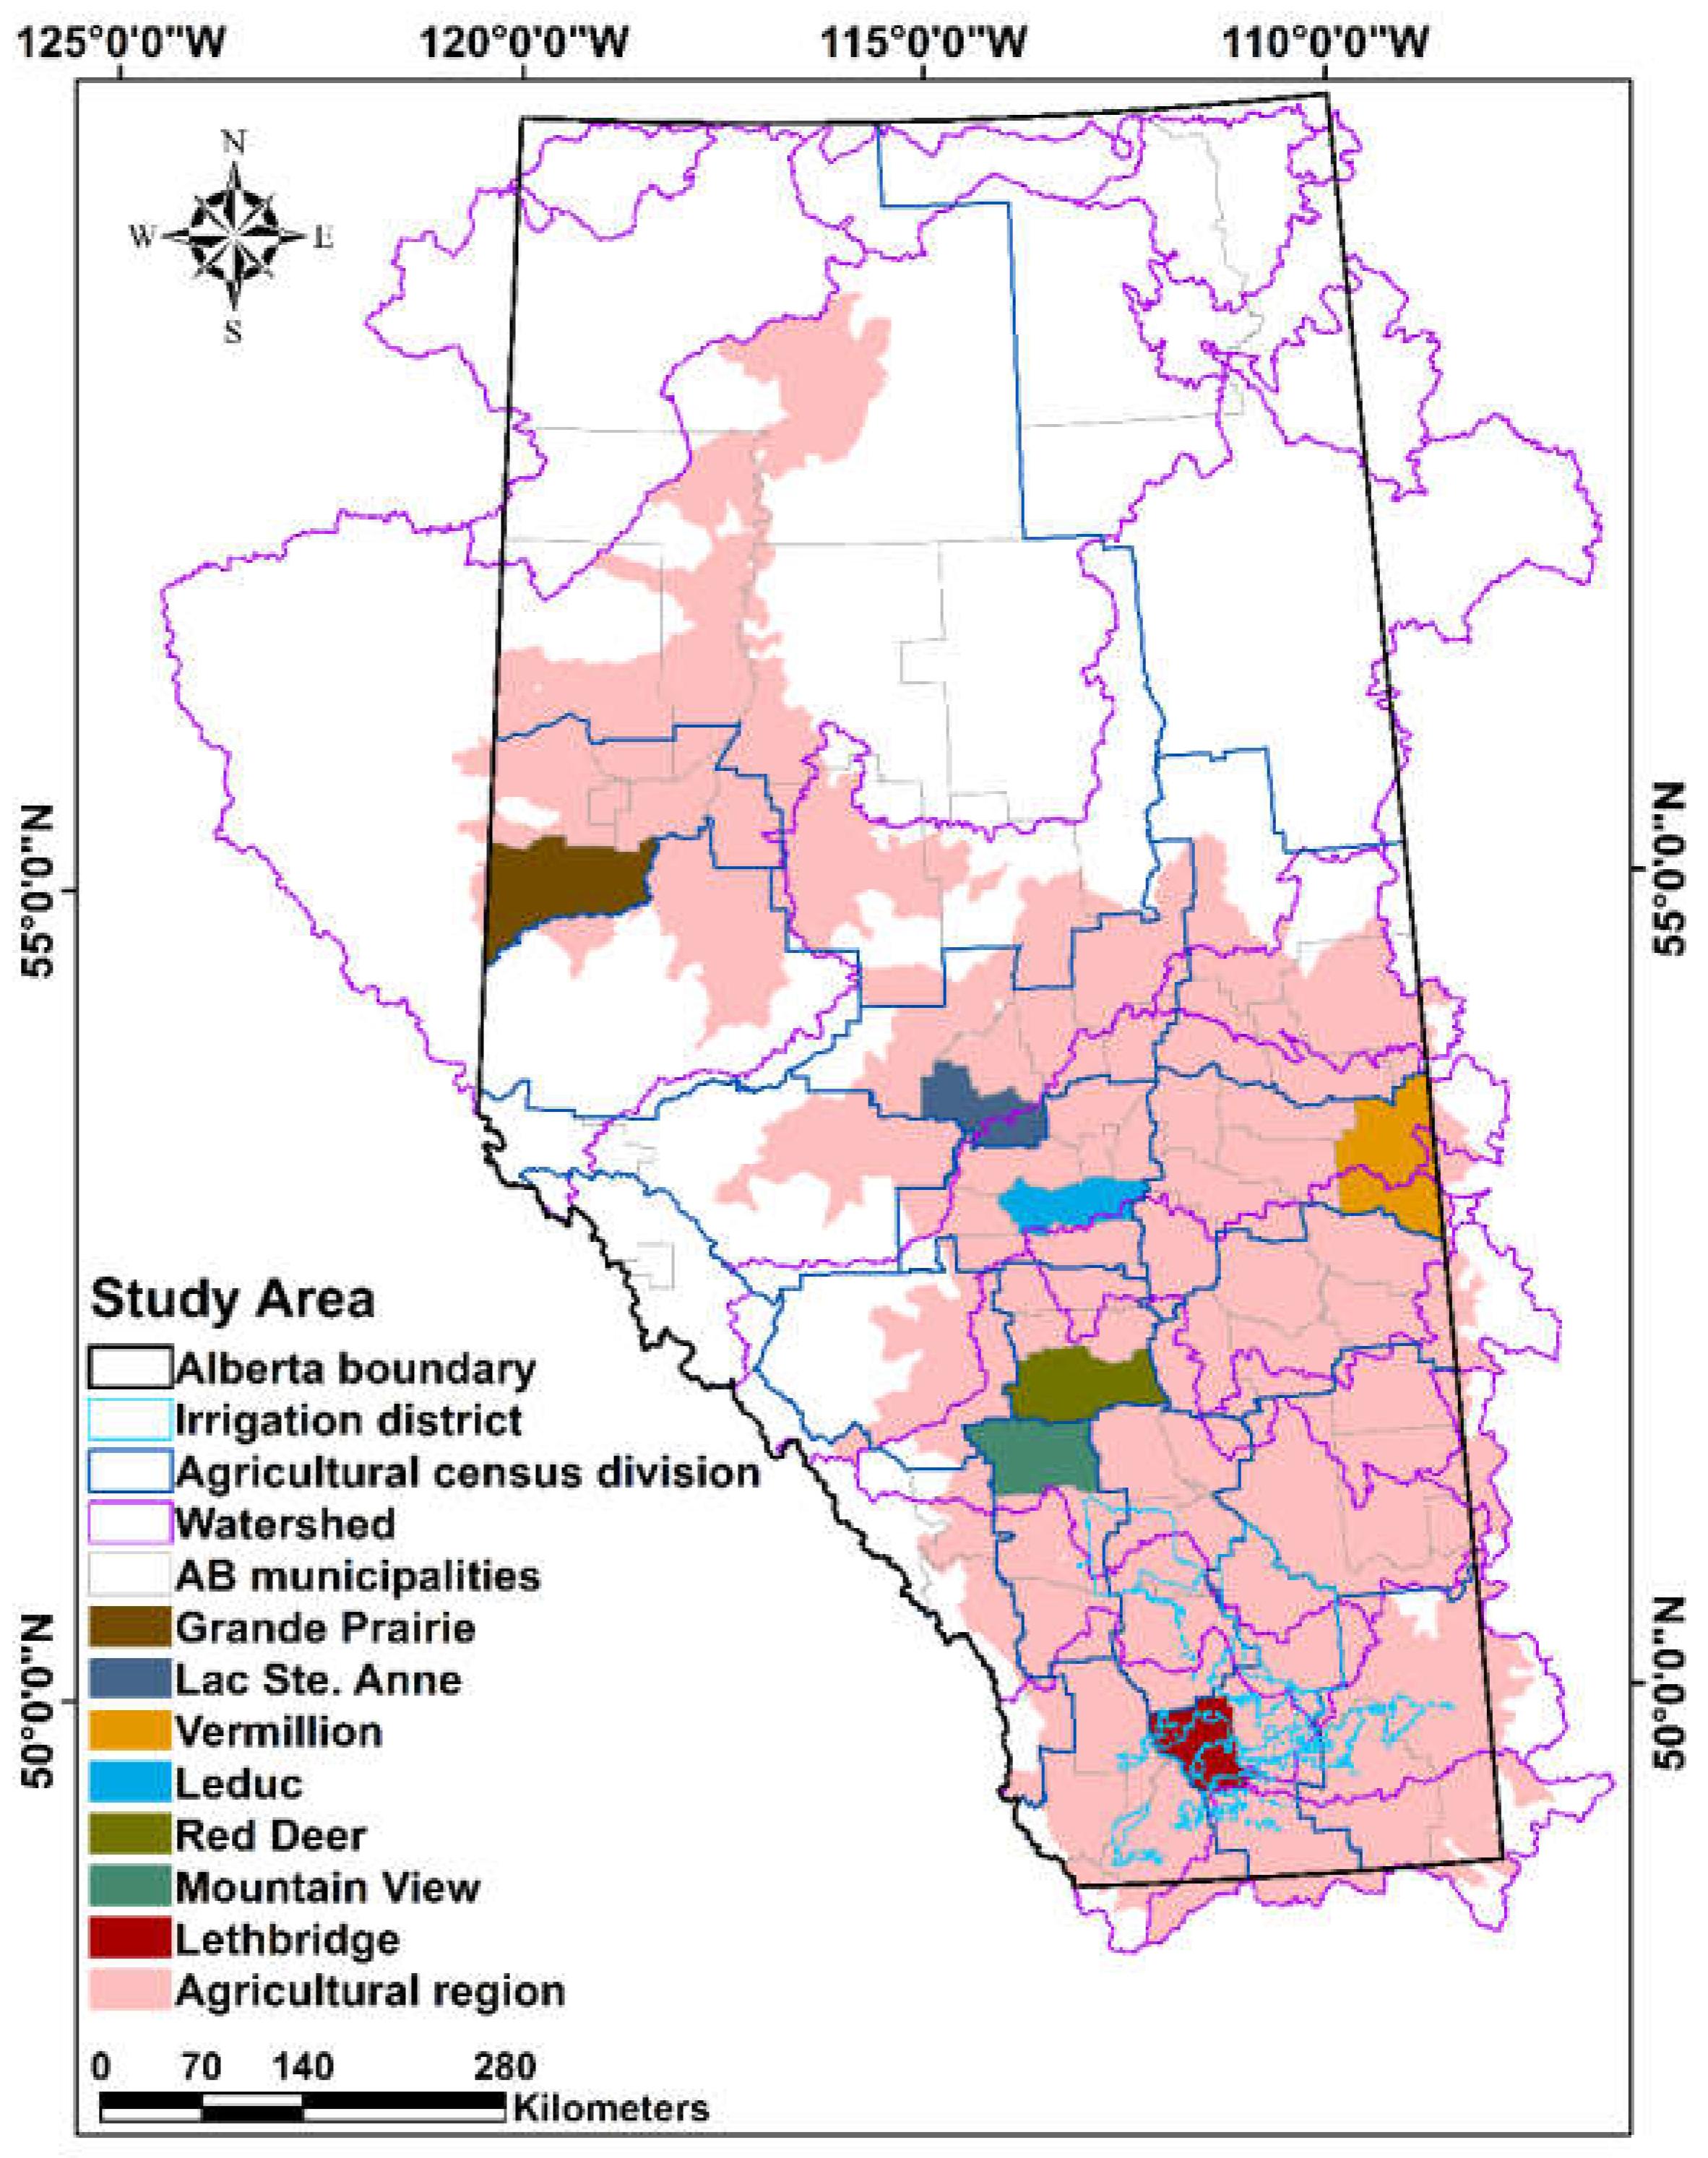
2.1. Study Area
2.2. Data Collection
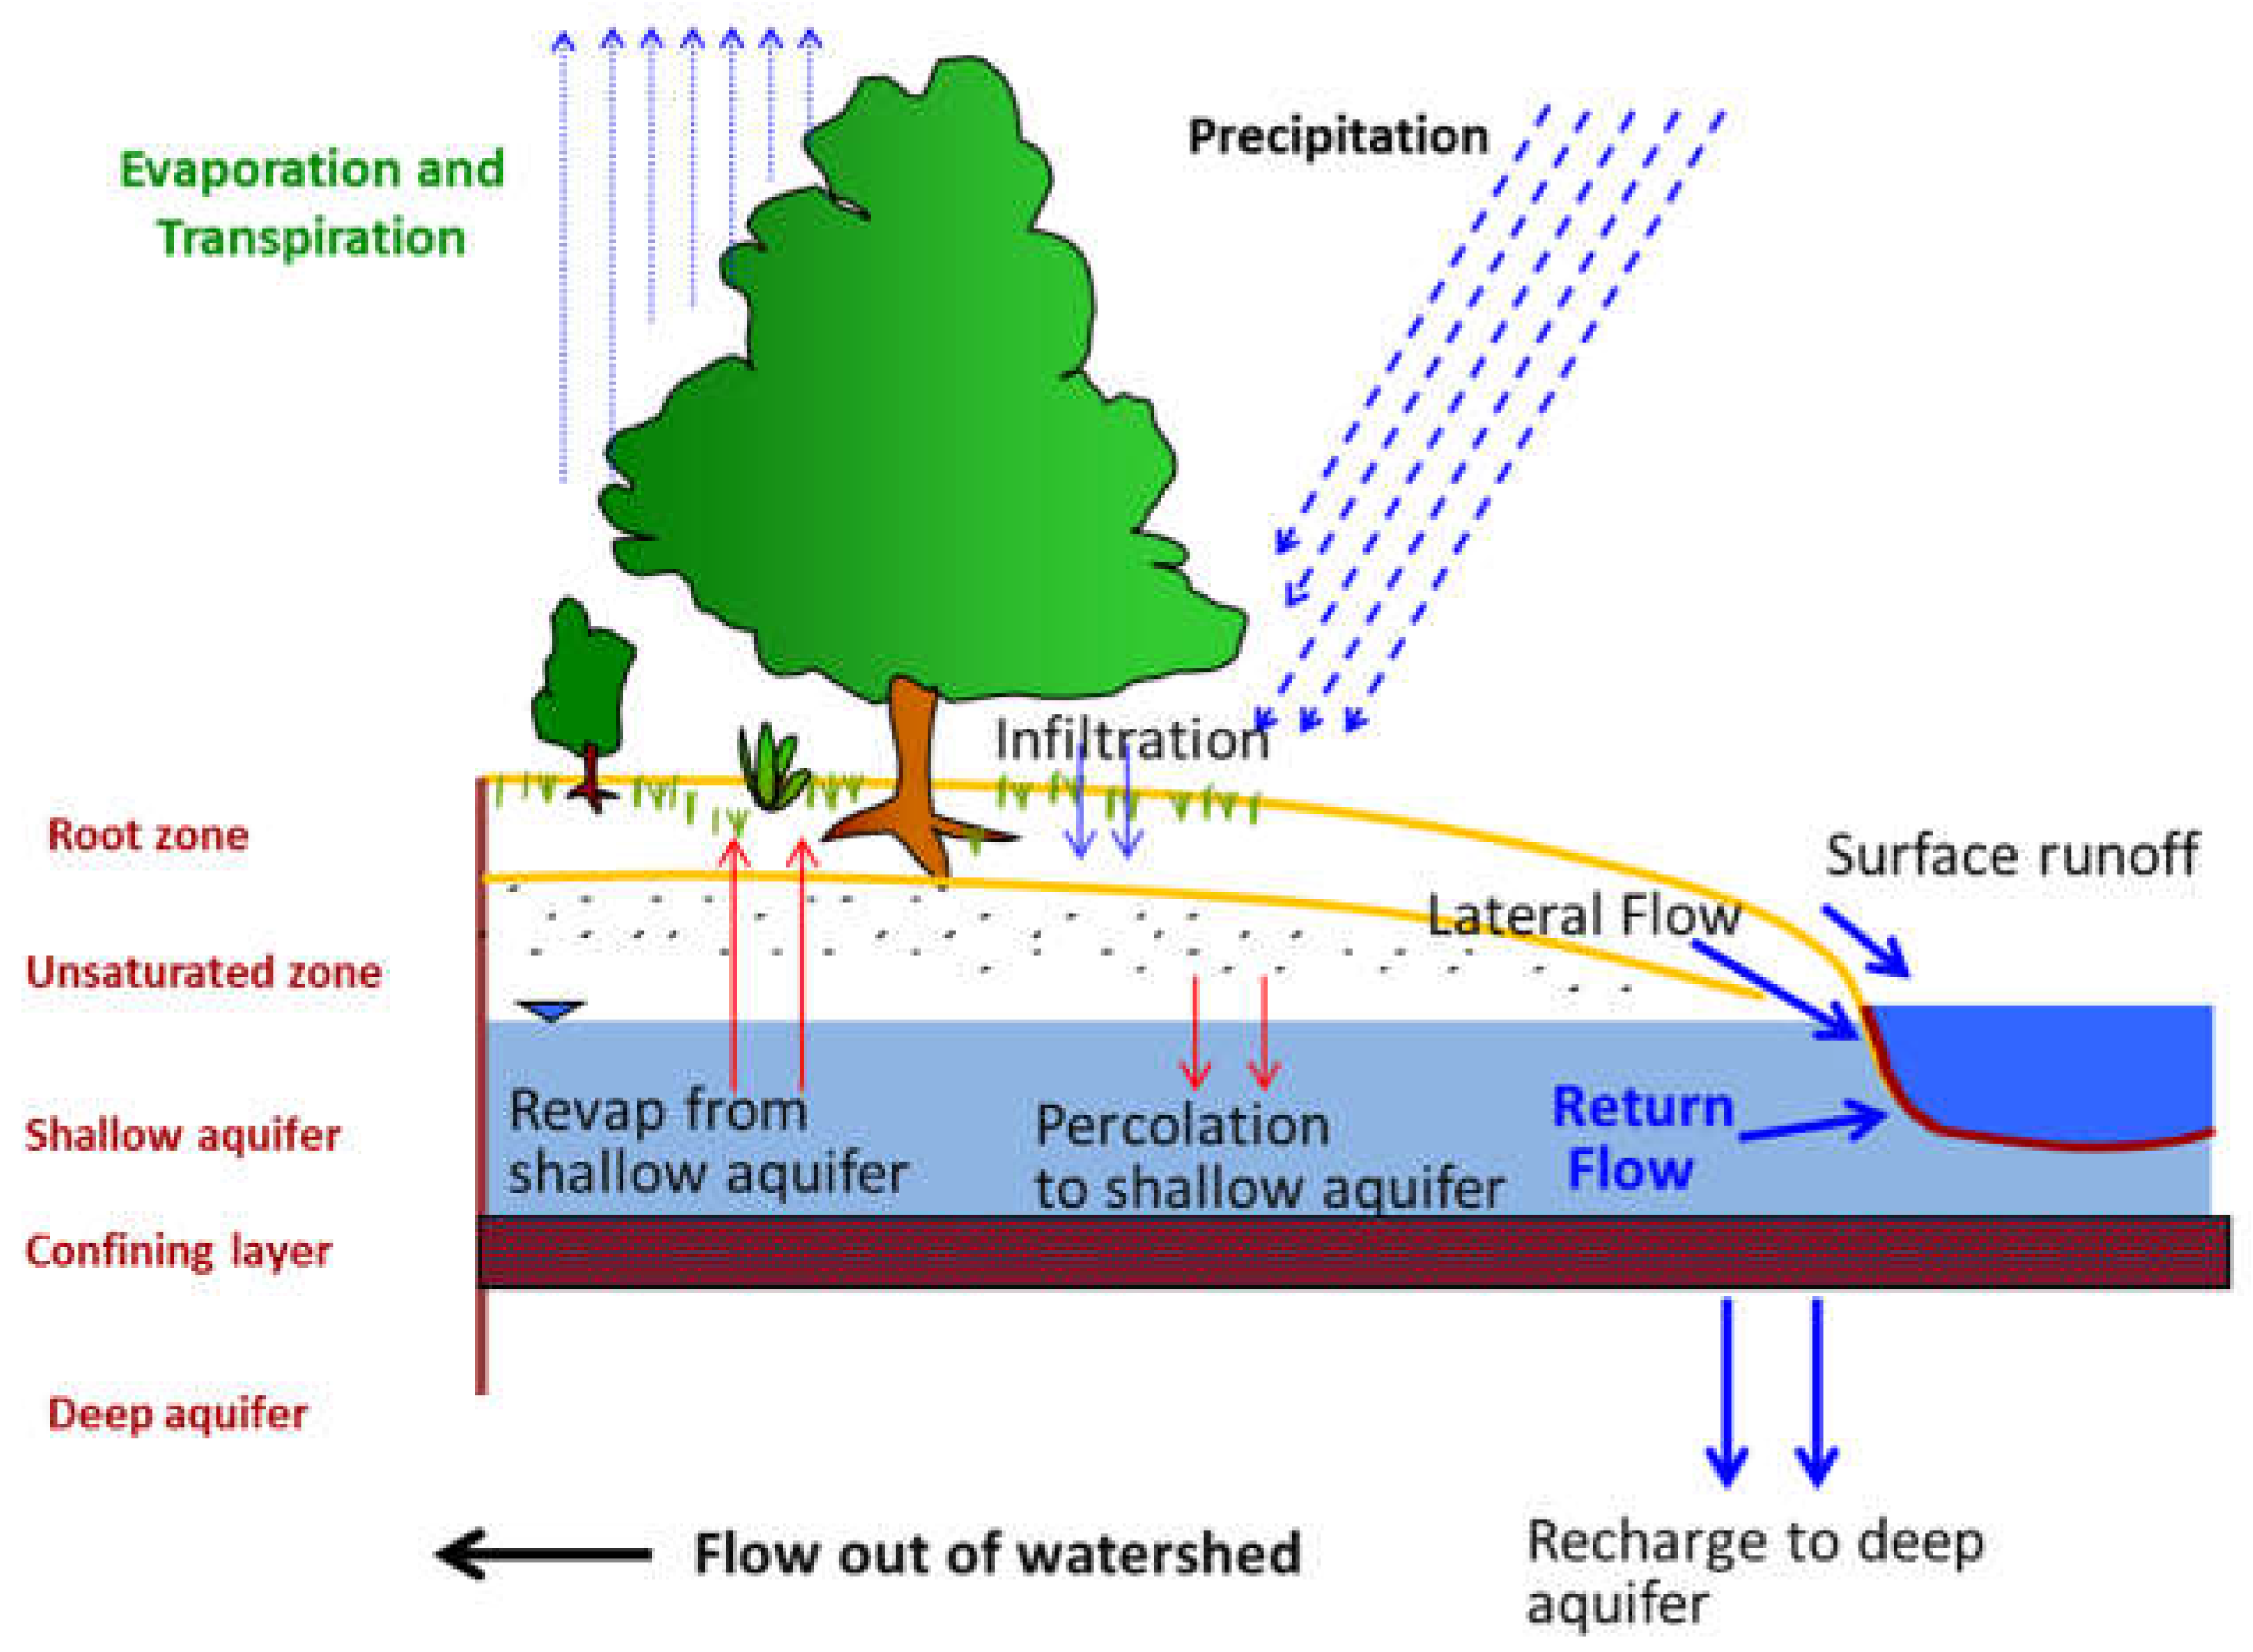
2.3. The SWAT Model
2.4. Assessment of Hydrological Variables
2.5. Trends of Hydrological Variables
2.6. Potential Land Use Type and Water Source
3. Results
3.1. The SWAT Model Performance
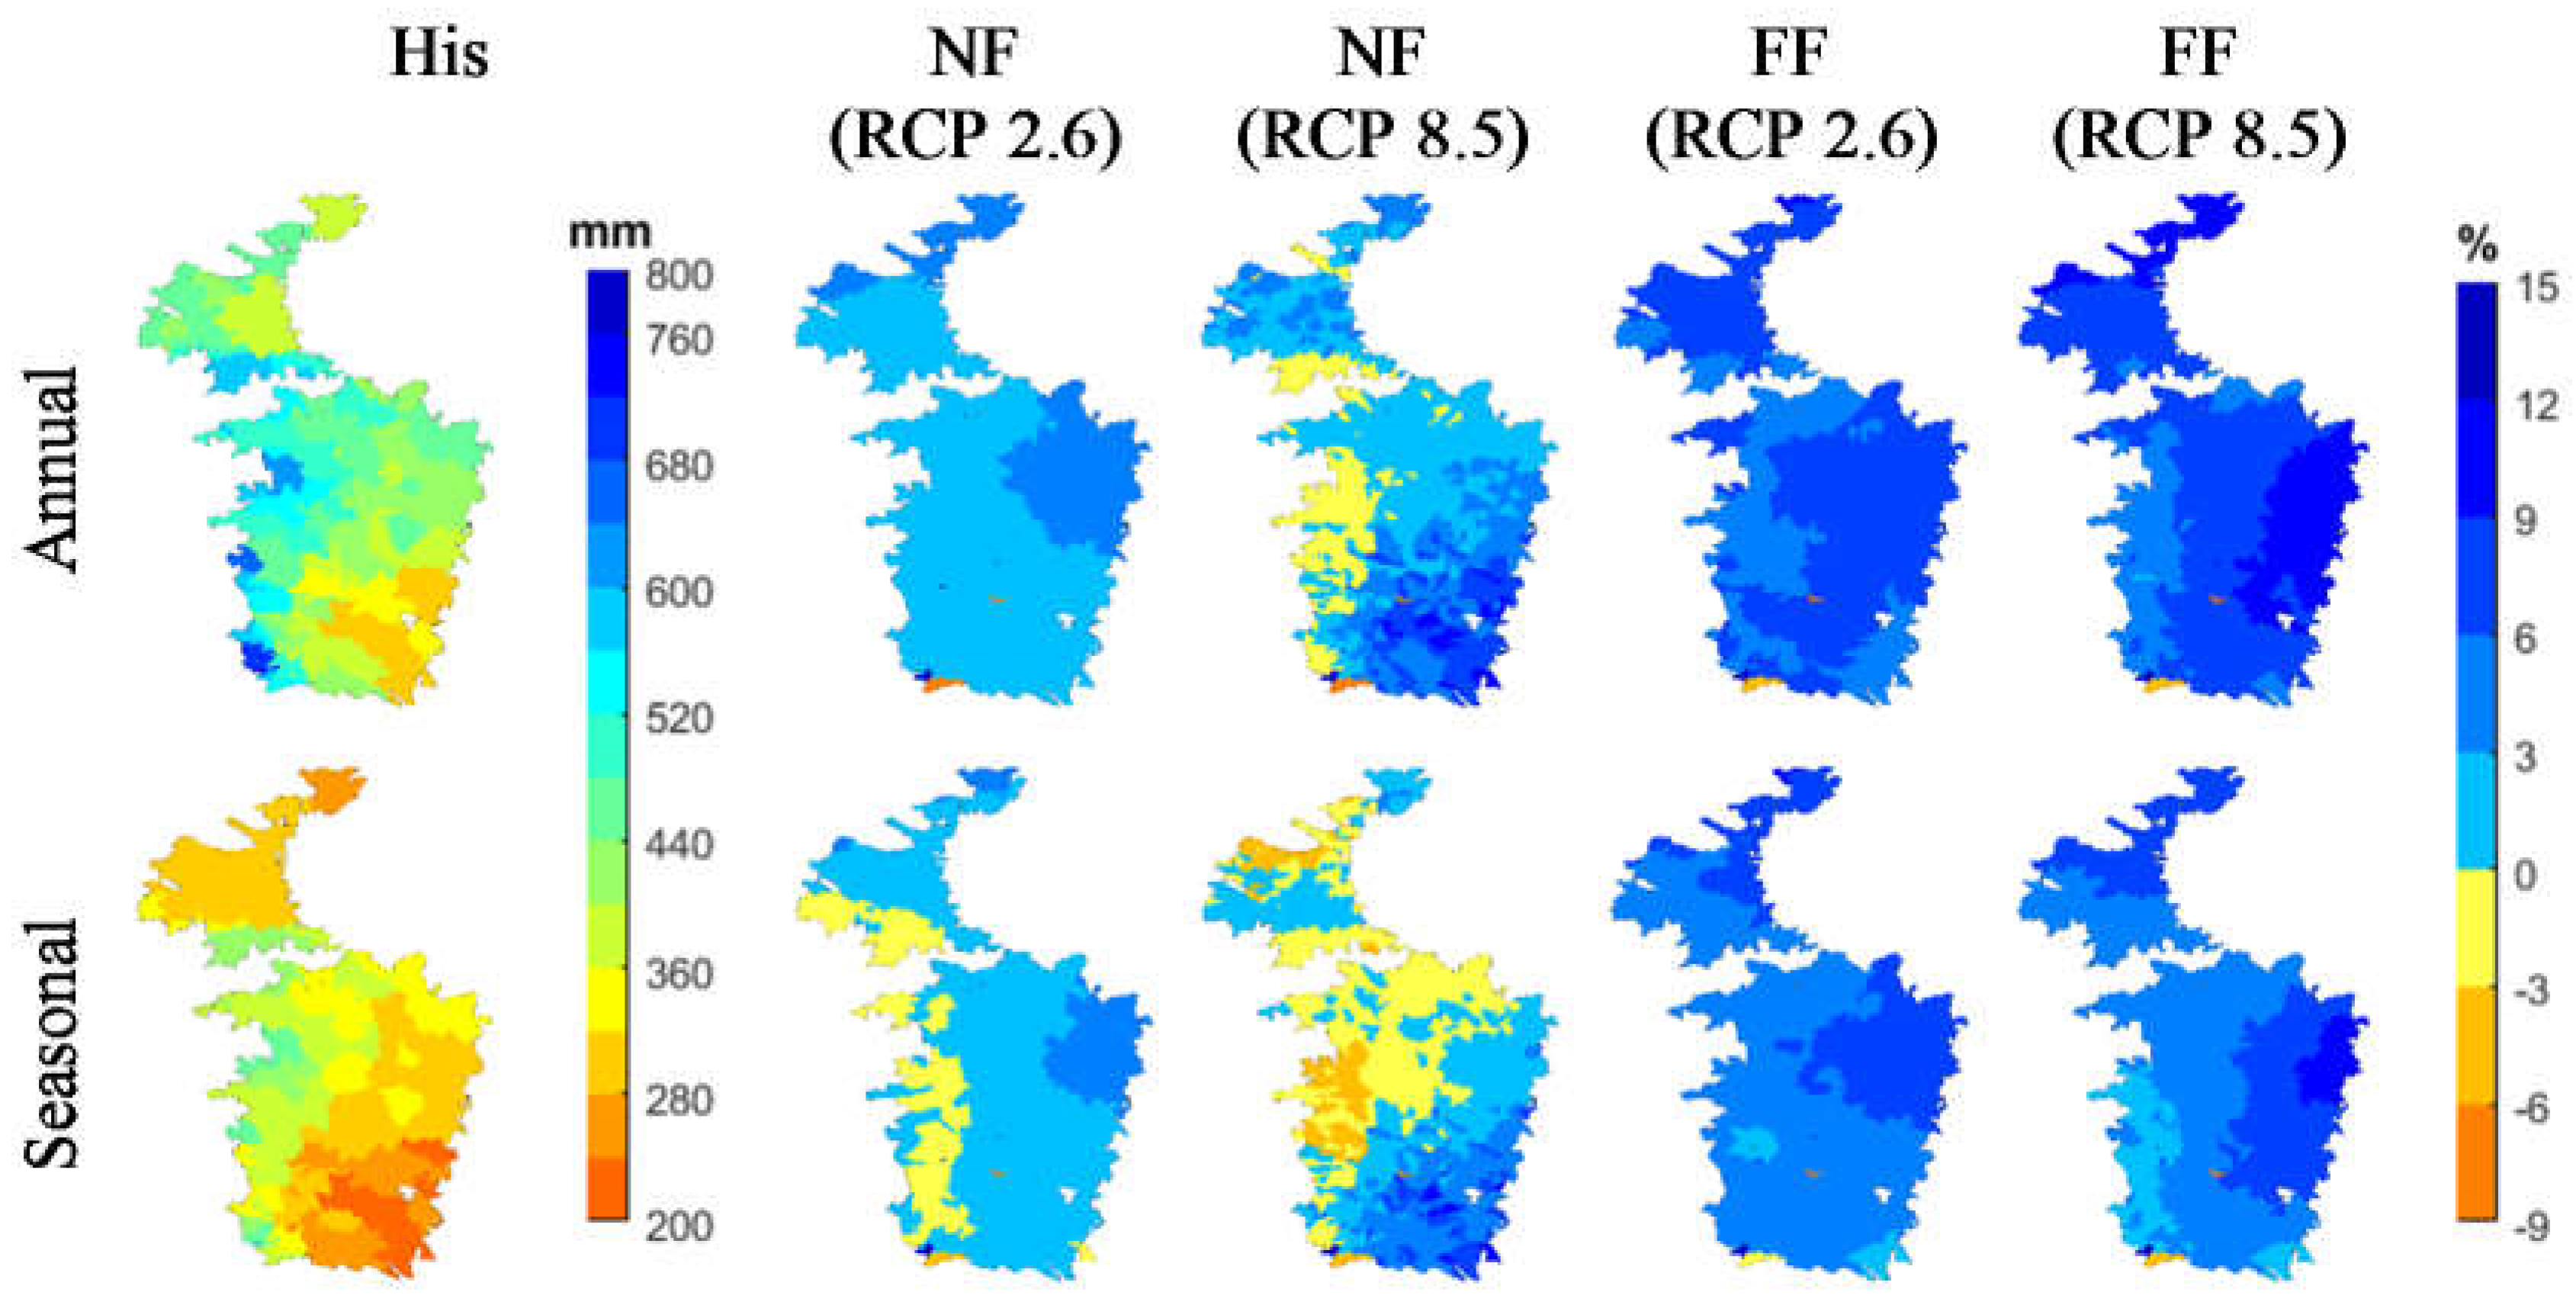
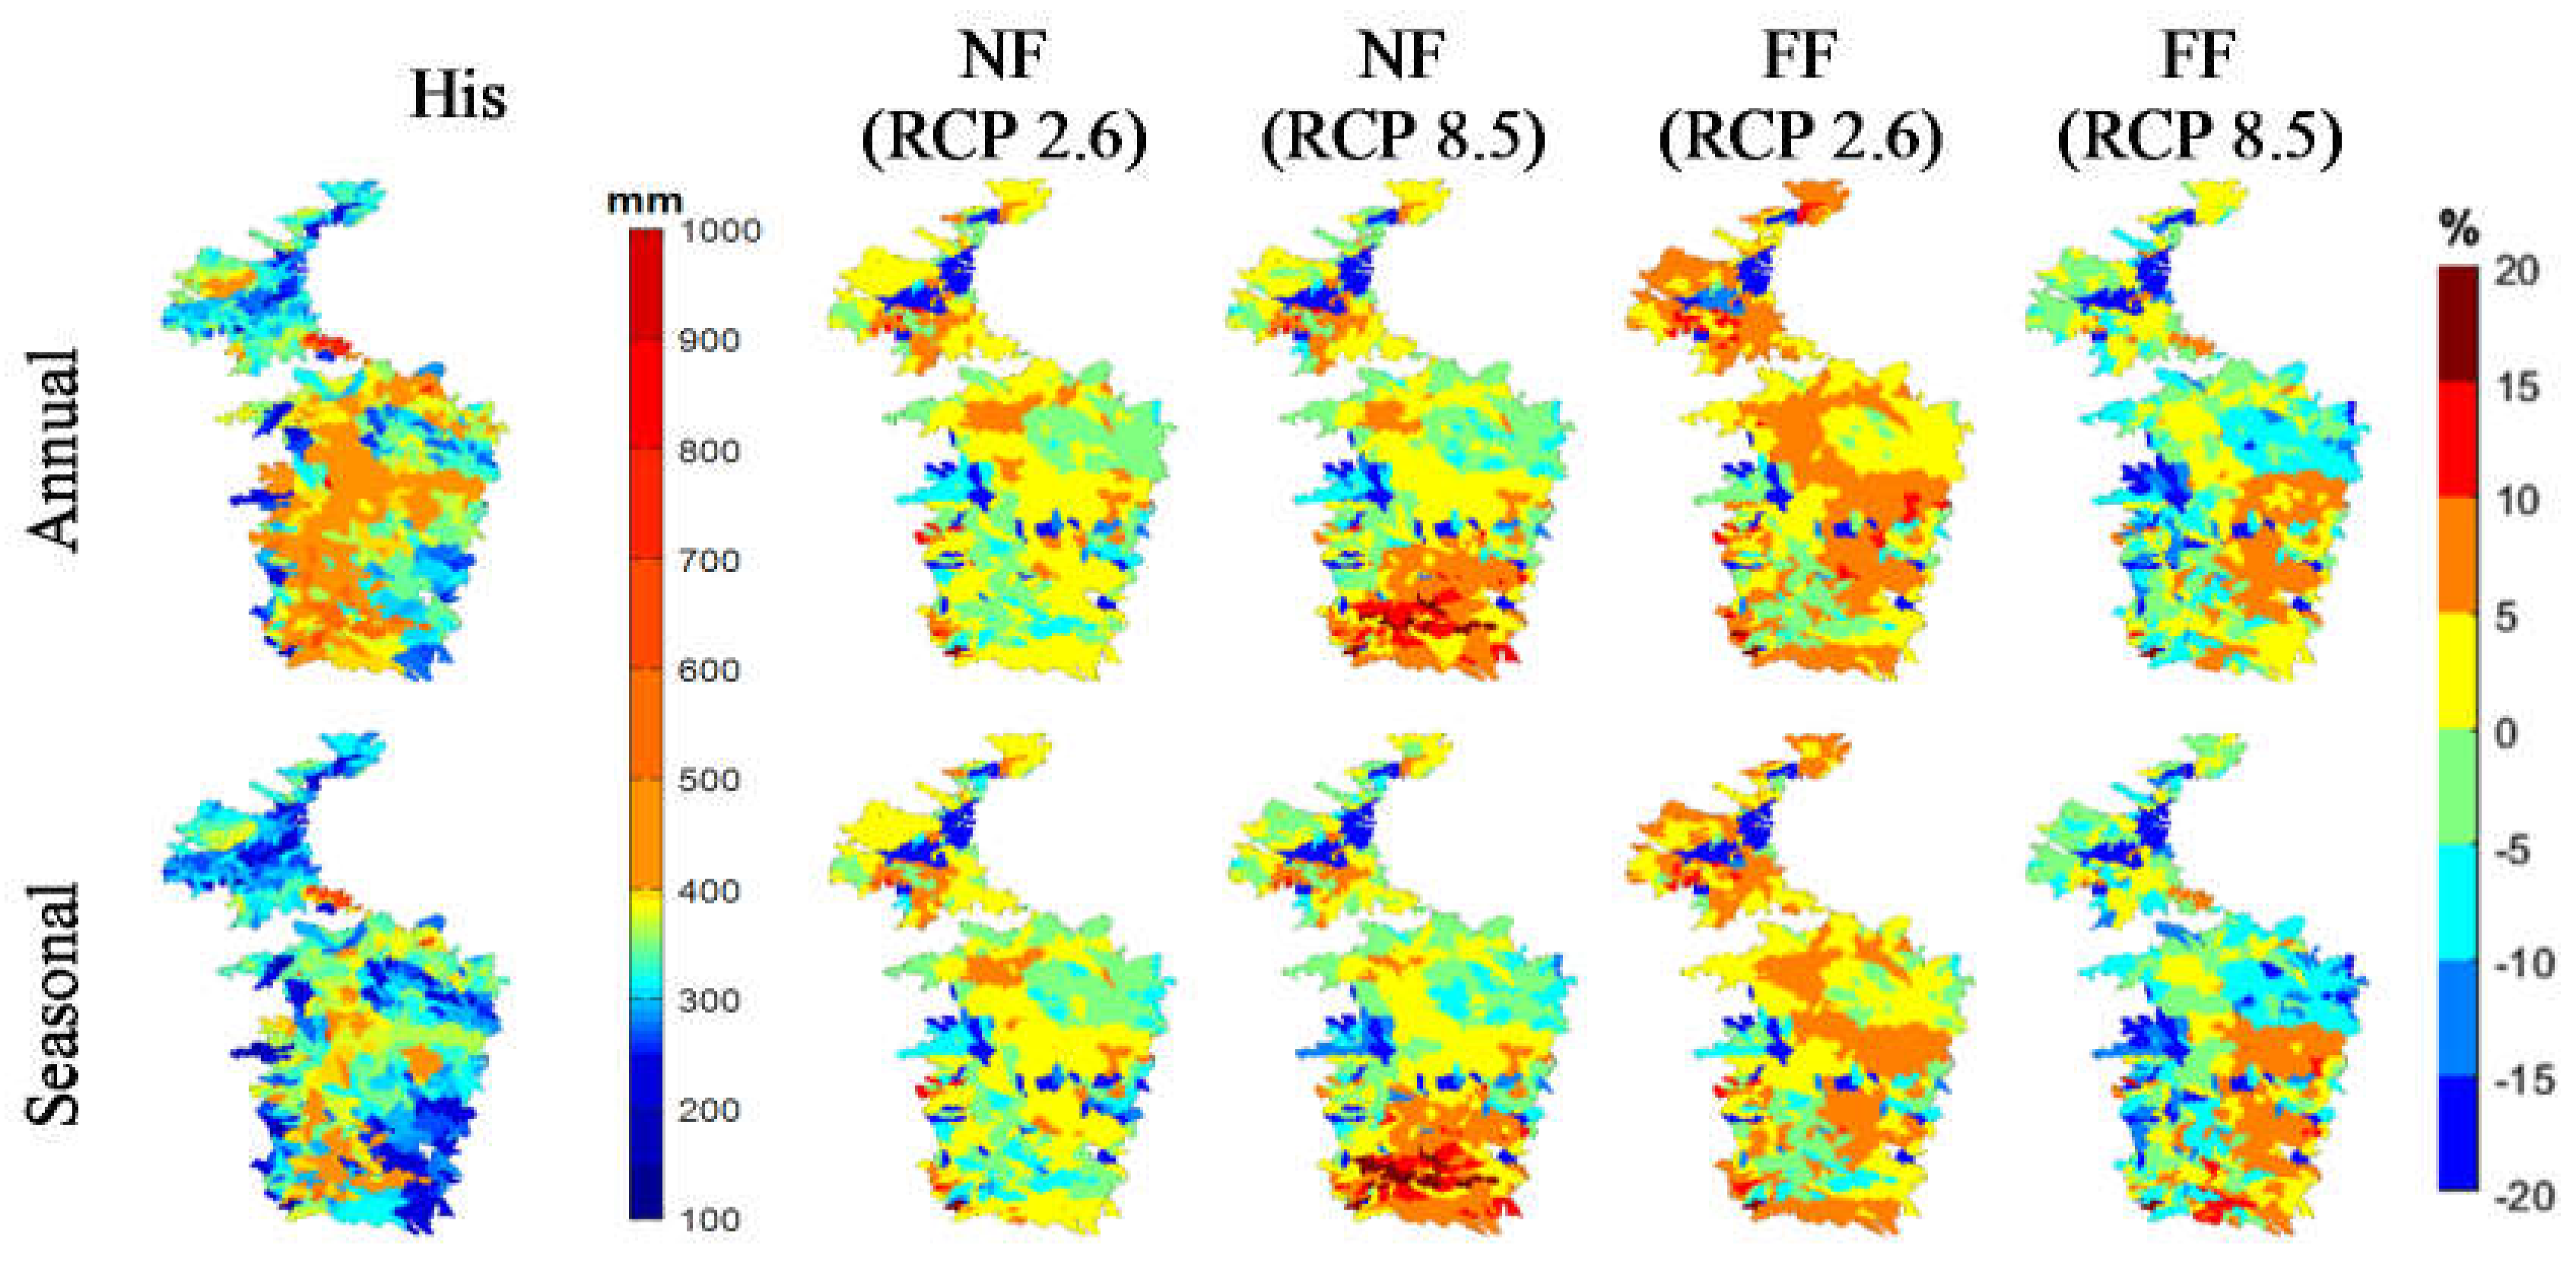
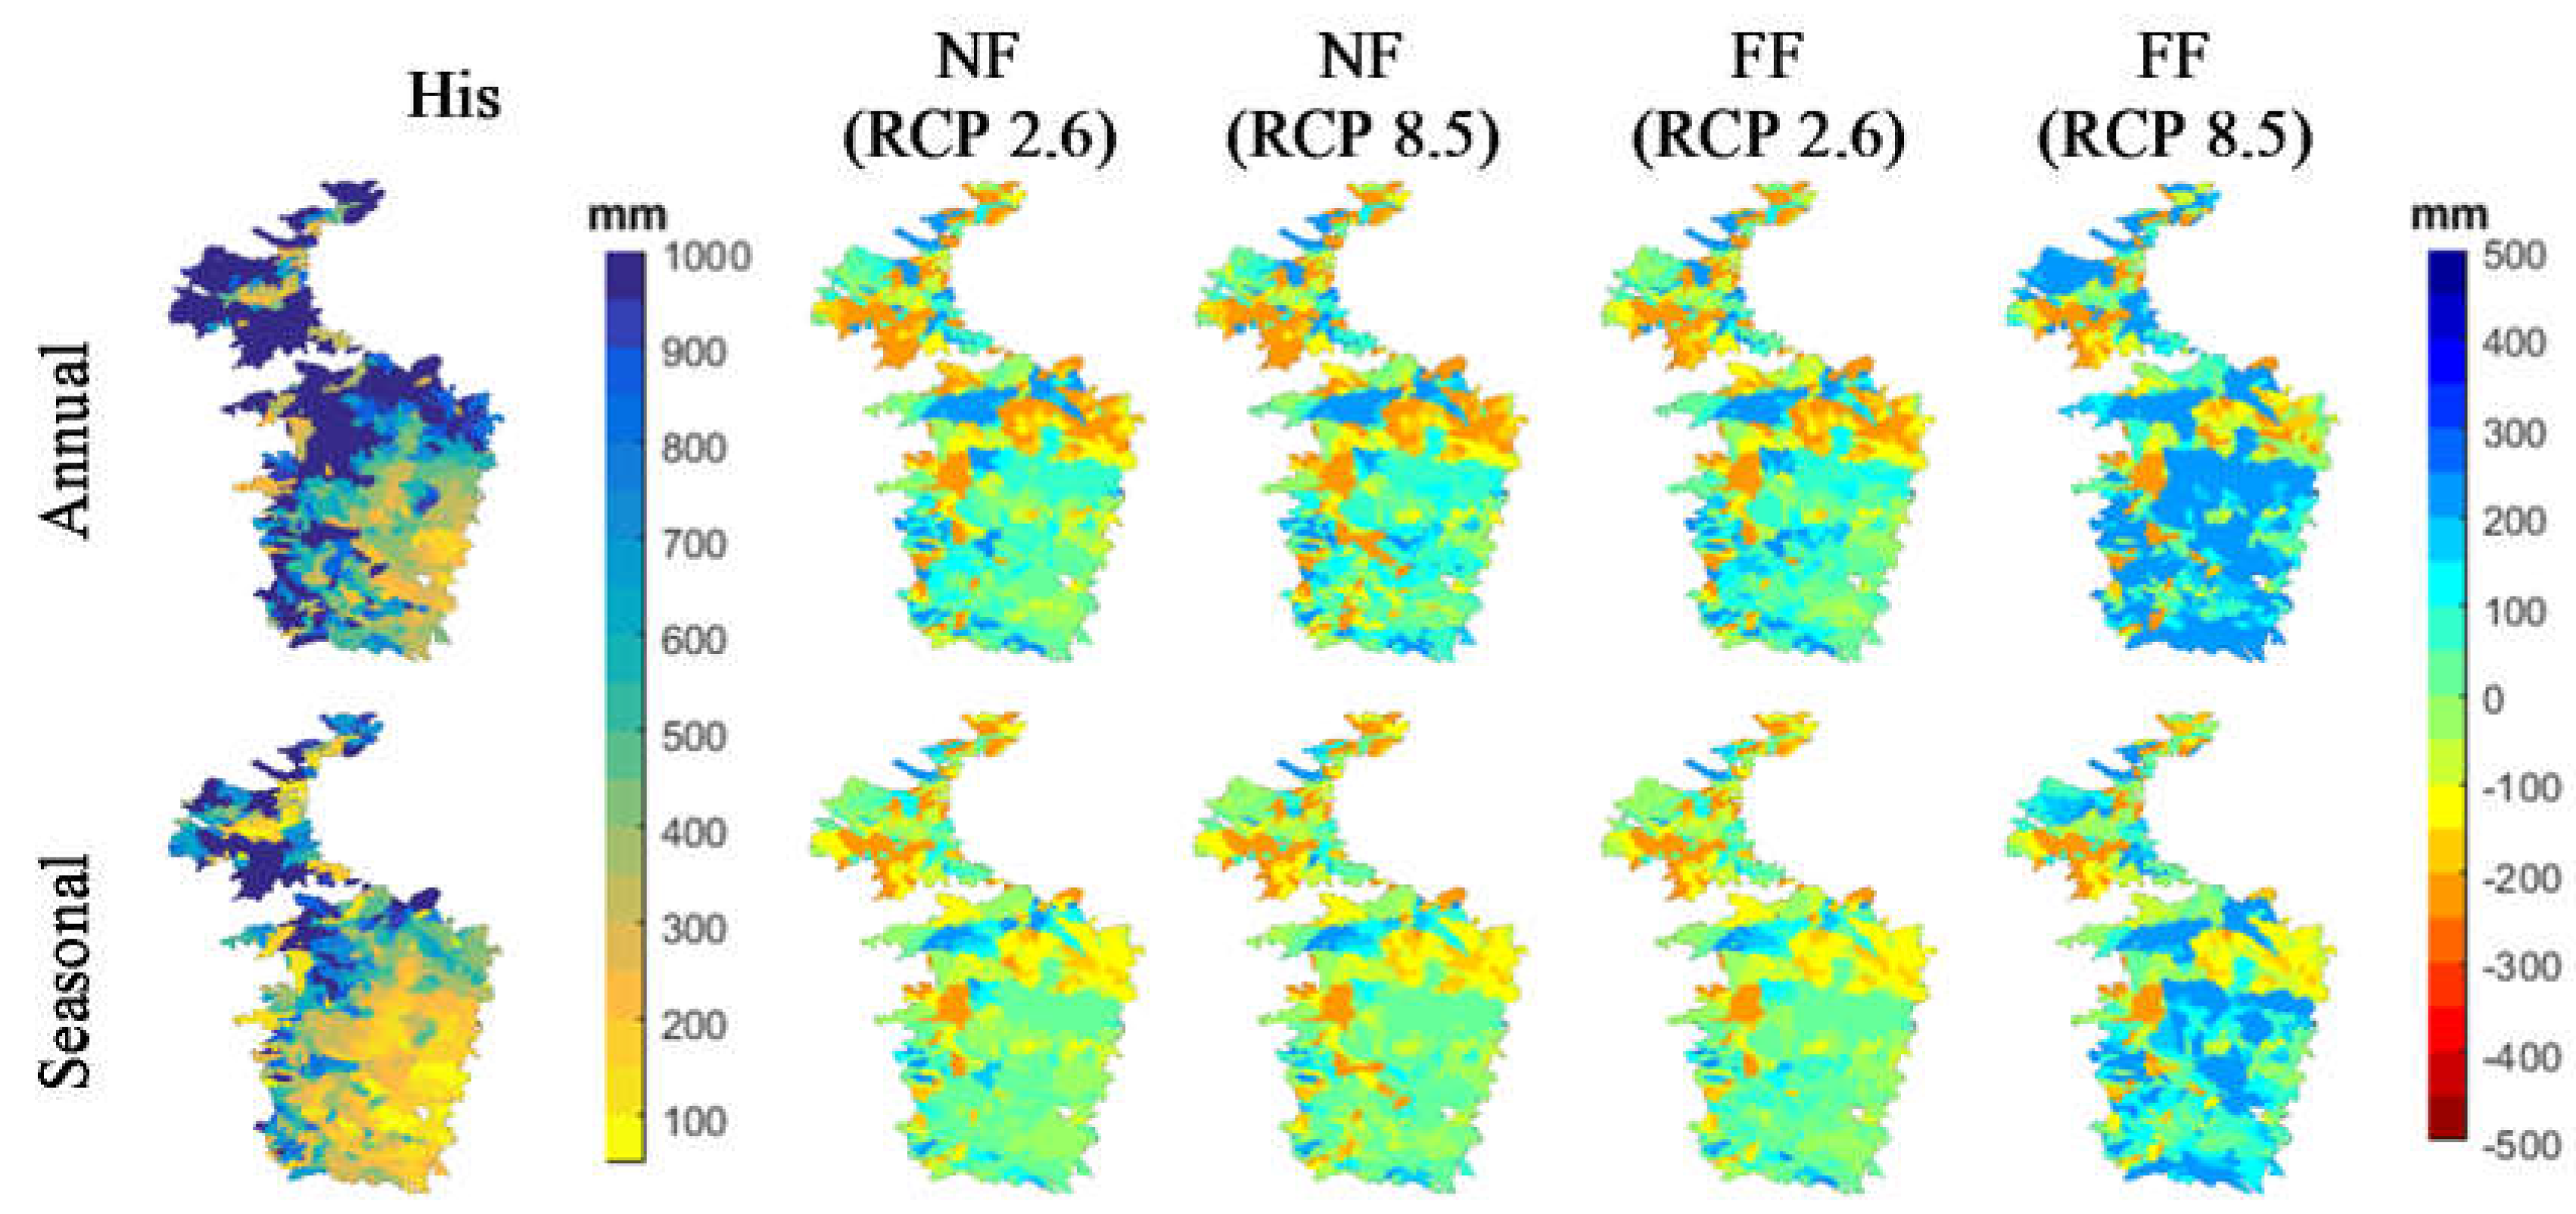
3.2. Seasonal and Annual Variation of Hydrological Variables
3.3. Seasonal and Annual Trends of Hydrological Variables
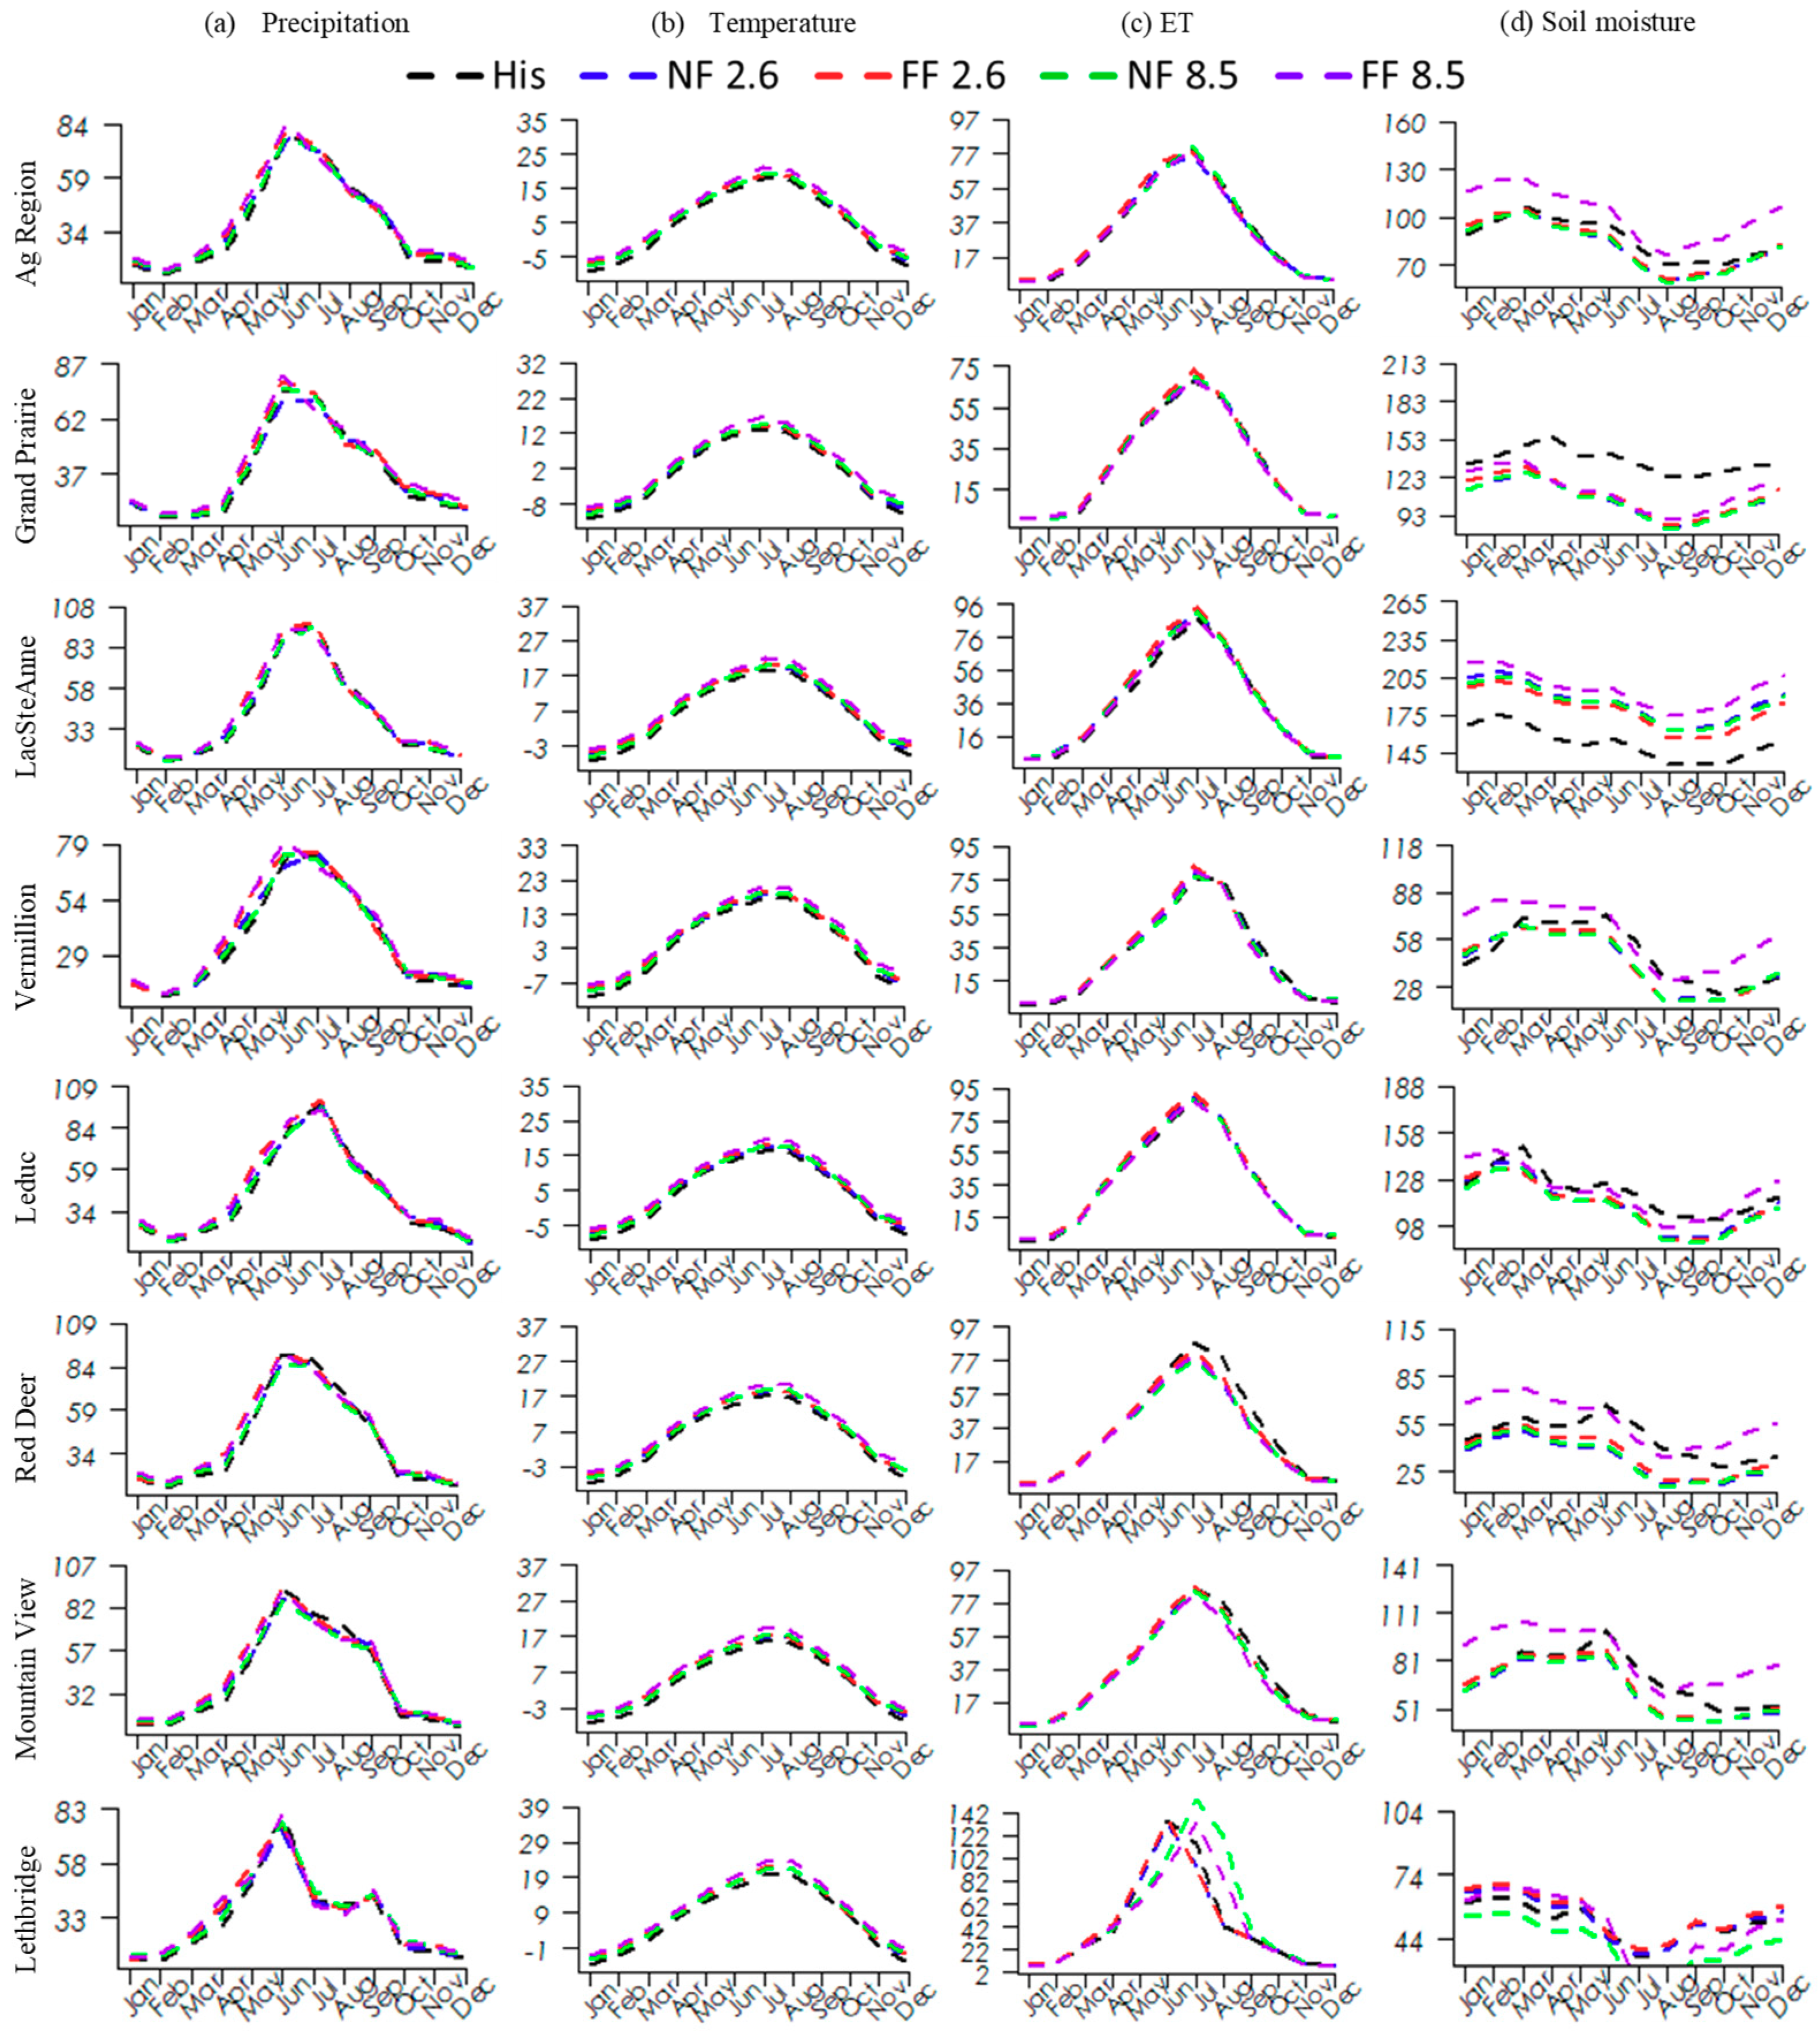
3.4. Monthly Variation of Hydrological Variables
3.5. Implications for Agriculture
4. Conclusions
- Results revealed that the climate in the agricultural region of Alberta had become warmer and drier during the His period. The climate condition is expected to be similar in future periods. Seasonal and annual precipitation is expected to increase by 1% and 3% in the NF while they are projected to increase by 5% and 7% in the FF. The mean seasonal and annual temperature is likely to increase by 1.21 and 1.33 °C in the NF while they are expected an increase by 2.14 and 2.32 °C in the FF, respectively. ET and SM distribution in the future has a resemblance with temperature and precipitation distribution. For instance, a region with high temperature is projected to have high ET and low SM. The blue water resources (DA and WYLD) is likely to increase in the future.
- Trend analysis showed that magnitude of increase and decrease in seasonal precipitation is higher than that of annual precipitation. Mean temperature generally has a higher trend magnitude in the southern part than the north, and a region with a low mean temperature has a higher warming rate. ET shows decreasing trends in the historical as well as in the future periods. SM does not indicate an apparent trend to conclude in the selected counties. However, it is likely to have an increasing trend for the study area. DA and WYLD show very mild trend both in the historical and future periods.
- Long-term average monthly variation of precipitation is expected to increase in winter and spring seasons. The temperature is likely to increase all the year round. ET is expected to increase and decrease in the ascending and recession limbs of the bell-shaped curve having the peak in July. The SM is projected to decrease considering the entire agricultural region, while blue water resources are projected to increase in the future.
- Comparison of water demand (ET) and water deficit (WD) for DLU and barley (as an example crop) indicated that there was no water deficit in May and June, while water deficit existed in July and August in some counties during the His period, that was compensated by irrigation.
Supplementary Materials
Author Contributions
Funding
Conflicts of Interest
References
- Diffenbaugh, N.S.; Swain, D.L.; Touma, D. Anthropogenic warming has increased drought risk in California. Proc. Natl. Acad. Sci. USA 2015, 112, 3931–3936. [Google Scholar] [CrossRef] [PubMed]
- Piao, S.; Ciais, P.; Huang, Y.; Shen, Z.; Peng, S.; Li, J.; Zhou, L.; Liu, H.; Ma, Y.; Ding, Y.; et al. The impacts of climate change on water resources and agriculture in China. Nature 2010, 467, 43–51. [Google Scholar] [CrossRef] [PubMed]
- IPCC Summary for Policymakers. Climate Change 2013: Physical Science Basis. Contribution of Working Group I to Fifth Assessment Report of the Intergovernmental Panel Climate Chang; Cambridge University Press: Cambridge, UK, 2013; Volume 33. [Google Scholar]
- Zhang, X.; Vincent, L.A.; Hogg, W.D.; Niitsoo, A. Temperature and precipitation trends in Canada during the 20th century. Atmosphere-Ocean 2000, 38, 395–429. [Google Scholar] [CrossRef]
- Yao, J.; Chen, Y. Trend analysis of temperature and precipitation in the Syr Darya Basin in Central Asia. Theor. Appl. Climatol. 2015, 120, 521–531. [Google Scholar] [CrossRef]
- Chattopadhyay, S.; Edwards, D. Long-term trend analysis of precipitation and air temperature for Kentucky, United States. Climate 2016, 4, 10. [Google Scholar] [CrossRef]
- Hadi, S.J.; Tombul, M. Long-term spatiotemporal trend analysis of precipitation and temperature over Turkey. Meteorol. Appl. 2018, 25, 445–455. [Google Scholar] [CrossRef]
- Zhao, P.; Jones, P.; Cao, L.; Yan, Z.; Zha, S.; Zhu, Y.; Yu, Y.; Tang, G. Trend of surface air temperature in Eastern China and associated large-scale climate variability over the Last 100 Years. J. Clim. 2014, 27, 4693–4703. [Google Scholar] [CrossRef]
- Philandras, C.M.; Nastos, P.T.; Kapsomenakis, J.; Douvis, K.C.; Tselioudis, G.; Zerefos, C.S. Long term precipitation trends and variability within the Mediterranean region. Nat. Hazards Earth Syst. Sci. 2011, 11, 3235–3250. [Google Scholar] [CrossRef]
- Machiwal, D.; Gupta, A.; Jha, M.K.; Kamble, T. Analysis of trend in temperature and rainfall time series of an Indian arid region: Comparative evaluation of salient techniques. Theor. Appl. Climatol. 2018, 1–20. [Google Scholar] [CrossRef]
- Vincent, L.A.; Zhang, X.; Brown, R.D.; Feng, Y.; Mekis, E.; Milewska, E.J.; Wan, H.; Wang, X.L. Observed trends in Canada’s climate and influence of low-frequency variability modes. J. Clim. 2015, 28, 4545–4560. [Google Scholar] [CrossRef]
- Mekis, É.; Vincent, L.A. An overview of the second generation adjusted daily precipitation dataset for trend analysis in Canada. Atmosphere-Ocean 2011, 49, 163–177. [Google Scholar] [CrossRef]
- Zhang, X.; Harvey, K.D.; Hogg, W.D.; Yuzyk, T.R. Trends in Canadian streamflow. Water Resour. Res. 2001, 37, 987–998. [Google Scholar] [CrossRef]
- Ghafouri-Azar, M.; Bae, D.-H.; Kang, S.-U. Trend analysis of long-term reference evapotranspiration and its components over the Korean Peninsula. Water 2018, 10, 1373. [Google Scholar] [CrossRef]
- Chen, Y.; Guan, Y.; Shao, G.; Zhang, D. Investigating trends in streamflow and precipitation in Huangfuchuan Basin with wavelet analysis and the Mann-Kendall Test. Water 2016, 8, 77. [Google Scholar] [CrossRef]
- Seneka, M.; Figliuzzi, S.J. Alberta Environment. Trends in Historical Annual Flows for Major Rivers in Alberta; Alberta Environment: Alberta, VR, USA, 2004; ISBN 0778531929. [Google Scholar]
- Jin, H.; Zhu, Q.; Zhao, X.; Zhang, Y. Simulation and prediction of climate variability and assessment of the response of water resources in a typical watershed in China. Water 2016, 8, 490. [Google Scholar] [CrossRef]
- Mehan, S.; Kannan, N.; Neupane, R.; McDaniel, R.; Kumar, S. Climate change impacts on the hydrological processes of a small agricultural watershed. Climate 2016, 4, 56. [Google Scholar] [CrossRef]
- Arias, R.; Rodríguez-Blanco, M.; Taboada-Castro, M.; Nunes, J.; Keizer, J.; Taboada-Castro, M. Water resources response to changes in temperature, rainfall and CO2 concentration: A first approach in NW Spain. Water 2014, 6, 3049–3067. [Google Scholar] [CrossRef]
- Faramarzi, M.; Abbaspour, K.C.; Adamowicz, W.L.; Lu, W.; Fennell, J.; Zehnder, A.J.B.; Goss, G.G. Uncertainty based assessment of dynamic freshwater scarcity in semi-arid watersheds of Alberta, Canada. J. Hydrol. Reg. Stud. 2017, 9, 48–68. [Google Scholar] [CrossRef]
- Masud, M.B.; Mcallister, T.; Cordeiro, M.R.C.; Faramarzi, M. Modeling future water footprint of barley production in Alberta, Canada: Implications for water use and yields to 2064. Sci. Total Environ. 2018, 616–617, 208–222. [Google Scholar] [CrossRef]
- Cannon, A.J. Selecting GCM scenarios that span the range of changes in a multimodel ensemble: Application to CMIP5 climate extremes indices. J. Clim. 2015, 28, 1260–1267. [Google Scholar] [CrossRef]
- Faramarzi, M.; Srinivasan, R.; Iravani, M.; Bladon, K.D.; Abbaspour, K.C.; Zehnder, A.J.B.; Goss, G.G. Setting up a hydrological model of Alberta: Data discrimination analyses prior to calibration. Environ. Model. Softw. 2015, 74, 48–65. [Google Scholar] [CrossRef]
- Environment and Climate Change Canada. Climate Data and Scenarios for Canada: Synthesis of Recent Observation and Modelling Results; Environment and Climate Change Canada: Gatineau, QC, Canada, 2016.
- Flato, G.; Marotzke, J.; Abiodun, B.; Braconnot, P.; Chou, S.C.; Collins, W.; Cox, P.; Driouech, F.; Emori, S.; Eyring, V.; et al. Evaluation of Climate Models. In Climate Change 2013: The Physical Science Basis; Stocker, T.F., Ed.; Cambridge University Press: Cambridge, UK; New York, NY, USA, 2013. [Google Scholar]
- Arnold, J.G.; Srinivasan, R.; Muttiah, R.S.; Williams, J.R. Large area hydrologic modeling and assessment Part 1: Model development. J. Am. Water Resour. Assoc. 1998, 34, 73–89. [Google Scholar] [CrossRef]
- Shekhar, S.; Xiong, H. Soil and Water Assessment Tool “SWAT.”. Encycl. GIS 2008, 1068. [Google Scholar] [CrossRef]
- Neitsch, S.; Arnold, J.; Kiniry, J.; Williams, J. Soil & water assessment tool theoretical documentation version 2009. Texas Water Resour. Inst. 2011, 1–647. [Google Scholar]
- Jarvis, A.; Reuter, H.I.; Nelson, A.; Guevara, E. Hole-filled SRTM for the Globe Version 4, the CGIAR-CSI SRTM 90m Database. Available online: http://srtm.csi.cgiar.org/ (accessed on 28 June 2018).
- Schulze, R. Approaches towards practical adaptive management options for selected water-related sectors in South Africa in a context of climate change. Water 2011, 37, 621–646. [Google Scholar] [CrossRef]
- Mosase, E.; Ahiablame, L. Rainfall and Temperature in the Limpopo River Basin, Southern Africa: Means, Variations, and Trends from 1979 to 2013. Water 2018, 10, 364. [Google Scholar] [CrossRef]
- Kendall, M.G.; Maurice, G.; Gibbons, J.D. Rank Correlation Methods; Arnold, E., Ed.; John Wiley & Sons, Inc.: Hoboken, NJ, USA, 1990; ISBN 0195208374. [Google Scholar]
- Mann, H.B. Nonparametric tests against trend. Econometrica 1945, 13, 245–259. [Google Scholar] [CrossRef]
- Vincent, L.A.; van Wijngaarden, W.A.; Hopkinson, R.; Vincent, L.A.; van Wijngaarden, W.A.; Hopkinson, R. Surface temperature and humidity trends in Canada for 1953–2005. J. Clim. 2007, 20, 5100–5113. [Google Scholar] [CrossRef]
- Singh, P.; Kumar, V.; Thomas, T.; Arora, M. Changes in rainfall and relative humidity in river basins in northwest and central India. Hydrol. Process. 2008, 22, 2982–2992. [Google Scholar] [CrossRef]
- Masud, M.B.; Soni, P.; Shrestha, S.; Tripathi, N.K. Changes in climate extremes over North Thailand, 1960–2099. J. Climatol. 2016, 2016, 1–18. [Google Scholar] [CrossRef]
- Gedefaw, M.; Wang, H.; Yan, D.; Song, X.; Yan, D.; Dong, G.; Wang, J.; Girma, A.; Ali, B.; Batsuren, D.; et al. Trend analysis of climatic and hydrological variables in the Awash River Basin, Ethiopia. Water 2018, 10, 1554. [Google Scholar] [CrossRef]
- Yue, S.; Pilon, P.; Cavadias, G. Power of the Mann–Kendall and Spearman’s rho tests for detecting monotonic trends in hydrological series. J. Hydrol. 2002, 259, 254–271. [Google Scholar] [CrossRef]
- Liu, S.; Huang, S.; Huang, Q.; Xie, Y.; Leng, G.; Luan, J.; Song, X.; Wei, X.; Li, X. Identification of the non-stationarity of extreme precipitation events and correlations with large-scale ocean-atmospheric circulation patterns: A case study in the Wei River Basin, China. J. Hydrol. 2017, 548, 184–195. [Google Scholar] [CrossRef]
- Asong, Z.E.; Khaliq, M.N.; Wheater, H.S. Projected changes in precipitation and temperature over the Canadian Prairie Provinces using the Generalized Linear Model statistical downscaling approach. J. Hydrol. 2016, 539, 429–446. [Google Scholar] [CrossRef]
- Forbes, K.A.; Kienzle, S.W.; Coburn, C.A.; Byrne, J.M.; Rasmussen, J. Simulating the hydrological response to predicted climate change on a watershed in southern Alberta, Canada. Clim. Chang. 2011, 105. [Google Scholar] [CrossRef]
- Jiang, R.; Gan, T.Y.; Xie, J.; Wang, N.; Kuo, C.-C. Historical and potential changes of precipitation and temperature of Alberta subjected to climate change impact: 1900–2100. Theor. Appl. Clim. 2017, 127, 725–739. [Google Scholar] [CrossRef]
- Kienzle, S.W.; Nemeth, M.W.; Byrne, J.M.; MacDonald, R.J. Simulating the hydrological impacts of climate change in the upper North Saskatchewan River basin, Alberta, Canada. J. Hydrol. 2012, 412–413, 76–89. [Google Scholar] [CrossRef]
- Schindler, D.W.; Donahue, W.F. An impending water crisis in Canada’s western prairie provinces. Proc. Natl. Acad. Sci. USA 2006, 103, 7210–7216. [Google Scholar] [CrossRef]
- Farjad, B.; Gupta, A.; Marceau, D.J. Annual and seasonal variations of hydrological processes under climate change scenarios in two sub-catchments of a complex watershed. Water Resour. Manag. 2016, 30, 2851–2865. [Google Scholar] [CrossRef]
- Falkenmark, M.; Rockström, J. The new blue and green water paradigm: Breaking new ground for water resources planning and management. J. Water Resour. Plan. Manag. 2006, 132, 129–132. [Google Scholar] [CrossRef]
- Zhang, X.; Zwiers, F.W.; Stott, P.A.; Zhang, X.; Zwiers, F.W.; Stott, P.A. Multimodel multisignal climate change detection at regional scale. J. Clim. 2006, 19, 4294–4307. [Google Scholar] [CrossRef]
- Marland, G.; Pielke, R.A.; Apps, M.; Avissar, R.; Betts, R.A.; Davis, K.J.; Frumhoff, P.C.; Jackson, S.T.; Joyce, L.A.; Kauppi, P.; et al. The climatic impacts of land surface change and carbon management, and the implications for climate-change mitigation policy. Clim. Policy 2003, 3, 149–157. [Google Scholar] [CrossRef]
- Lindemann, T.; Morra, D. Climate change: Implications on agriculture and food security in the short-medium term. In Global Warming and Climate Change; Palgrave Macmillan UK: London, UK, 2010; pp. 78–96. [Google Scholar]
- Pathak, T.; Maskey, M.; Dahlberg, J.; Kearns, F.; Bali, K.; Zaccaria, D. Climate change trends and impacts on California agriculture: A Detailed review. Agronomy 2018, 8, 25. [Google Scholar] [CrossRef]


| Census Division (CD) | # Farms in the CD | County (# Farms >900) | # Farms in the Country | Dominant Land Use * |
|---|---|---|---|---|
| CD 2. Lethbridge | 2790 | Lethbridge | 933 | SWHT |
| CD 6. Calgary | 4186 | Mountain View | 1636 | AGRR |
| CD 8. Red Deer | 3682 | Red Deer | 1531 | AGRR |
| CD 10. Camrose/Vermilion | 4616 | Vermilion River | 1029 | AGRR |
| CD 11. Edmonton | 5034 | Leduc | 1255 | PAST |
| CD 13. Barrhead/Athabasca | 3833 | Lac Ste. Anne | 936 | PAST |
| CD 19. Grande Prairie/Fairview | 2734 | Grande Prairie | 1206 | AGRR & FRSD |
| Hydrological Model | |||
| Calibration | Validation | ||
| p-factor (%) | r-factor | p-factor (%) | r-factor |
| 63 | 1.04 | 71 | 1.43 |
| Crop Model | |||
| Calibration | Validation | ||
| p-factor (%) | r-factor | p-factor (%) | r-factor |
| 88 | 4.48 | 85 | 5.35 |
| RCP 2.6 | RCP 8.5 | ||||||||||||
|---|---|---|---|---|---|---|---|---|---|---|---|---|---|
| Annual | Seasonal | Annual | Seasonal | ||||||||||
| County | His | NF | FF | His | NF | FF | His | NF | FF | His | NF | FF | |
| Trend Magnitude | |||||||||||||
| Precipitation | Ag Region | −0.37 | −0.05 | −0.17 | −0.02 | 0.00 | 0.09 | −0.37 | −0.20 | −0.26 | −0.02 | −0.07 | 0.00 |
| Grande Prairie | −1.73 | −1.82 | −1.90 | −2.50 * | −2.36 * | −2.29 | −1.73 | −1.77 | −1.46 | −2.50 * | −2.29 | −2.32 | |
| Lac Ste. Anne | −3.21 | −2.84 | −3.25 | −2.83 | −2.75 | −2.92 | −3.21 | −2.92 | −2.96 | −2.83 | −2.58 | −2.83 | |
| Leduc | −0.23 | −0.68 | −0.34 | −2.12 | −2.13 | −2.04 | −0.23 | 0.23 | −0.54 | −2.12 | −1.65 | −2.29 | |
| Vermilion | −0.59 | −0.39 | −0.22 | −0.12 | 0.38 | 0.39 | −0.59 | −0.58 | −0.50 | −0.12 | −0.32 | 0.29 | |
| Lethbridge | −0.26 | −0.50 | −0.32 | 1.36 | 1.26 | 1.52 | −0.26 | −0.36 | −0.18 | 1.36 | 0.85 | 1.24 | |
| Mountain View | −0.49 | 0.16 | 0.18 | −0.34 | −0.44 | −0.20 | −0.49 | −0.42 | 0.01 | −0.34 | −0.53 | −0.40 | |
| Red Deer | −0.07 | 0.46 | 0.88 | 0.34 | 0.23 | 0.19 | −0.07 | 0.37 | 0.71 | 0.34 | −0.10 | 0.50 | |
| Tmean | Ag Region | 0.04 | 0.04 | 0.04 | 0.02 | 0.02 | 0.02 | 0.04 | 0.04 | 0.04 | 0.02 | 0.02 | 0.02 |
| Grande Prairie | 0.04 | 0.04 | 0.04 | 0.02 | 0.02 | 0.02 | 0.04 | 0.04 | 0.04 | 0.02 | 0.02 | 0.01 | |
| Lac Ste. Anne | 0.03 | 0.03 | 0.03 | 0.01 | 0.01 | 0.01 | 0.03 | 0.03 | 0.03 | 0.01 | 0.01 | 0.01 | |
| Leduc | 0.03 | 0.03 | 0.03 | 0.01 | 0.01 | 0.01 | 0.03 | 0.03 | 0.03 | 0.01 | 0.01 | 0.01 | |
| Vermilion | 0.04 | 0.04 | 0.04 | 0.01 | 0.02 | 0.02 | 0.04 | 0.04 | 0.04 | 0.01 | 0.02 | 0.02 | |
| Lethbridge | 0.04 | 0.05 | 0.04 | 0.01 | 0.01 | 0.01 | 0.04 | 0.05 | 0.04 | 0.01 | 0.01 | 0.01 | |
| Mountain View | 0.05 * | 0.05 | 0.05 | 0.02 | 0.02 | 0.02 | 0.05 * | 0.05 * | 0.05 * | 0.02 | 0.02 | 0.02 | |
| Red Deer | 0.04 | 0.04 | 0.04 | 0.01 | 0.01 | 0.01 | 0.04 | 0.04 | 0.04 | 0.01 | 0.01 | 0.01 | |
| Tmax | Ag Region | 0.03 | 0.03 | 0.03 | 0.01 | 0.01 | 0.01 | 0.03 | 0.03 | 0.03 | 0.01 | 0.01 | 0.01 |
| Grande Prairie | 0.04 | 0.04 | 0.04 | 0.01 | 0.01 | 0.01 | 0.04 | 0.04 | 0.04 | 0.01 | 0.01 | 0.01 | |
| Lac Ste. Anne | 0.03 | 0.03 | 0.03 | 0.01 | 0.01 | 0.01 | 0.03 | 0.03 | 0.03 | 0.01 | 0.01 | 0.01 | |
| Leduc | 0.02 | 0.02 | 0.02 | 0.00 | 0.00 | 0.00 | 0.02 | 0.02 | 0.02 | 0.00 | 0.00 | 0.00 | |
| Vermilion | 0.02 | 0.02 | 0.02 | −0.02 | −0.02 | −0.02 | 0.02 | 0.02 | 0.02 | −0.02 | −0.02 | −0.02 | |
| Lethbridge | 0.04 | 0.04 | 0.04 | 0.00 | 0.00 | 0.00 | 0.04 | 0.04 | 0.04 | 0.00 | 0.00 | 0.00 | |
| Mountain View | 0.03 | 0.03 | 0.03 | 0.01 | 0.01 | 0.01 | 0.03 | 0.03 | 0.03 | 0.01 | 0.01 | 0.01 | |
| Red Deer | 0.03 | 0.03 | 0.03 | 0.01 | 0.00 | 0.01 | 0.03 | 0.03 | 0.03 | 0.01 | 0.00 | 0.01 | |
| Tmin | Ag Region | 0.05 | 0.05 | 0.05 | 0.03 | 0.03 | 0.03 | 0.05 | 0.05 | 0.05 | 0.03 | 0.03 | 0.03 |
| Grande Prairie | 0.05 | 0.05 | 0.05 | 0.03 | 0.02 | 0.02 | 0.05 | 0.05 | 0.05 | 0.03 | 0.02 | 0.02 | |
| Lac Ste. Anne | 0.03 * | 0.03 | 0.03 * | 0.03 | 0.03 | 0.03 | 0.03 * | 0.03 * | 0.03 * | 0.03 | 0.03 | 0.03 | |
| Leduc | 0.05 | 0.04 | 0.04 | 0.02 | 0.02 | 0.02 | 0.05 | 0.04 | 0.04 | 0.02 | 0.02 | 0.02 | |
| Vermilion | 0.07 | 0.07 * | 0.07 | 0.04 | 0.04 | 0.04 | 0.07 | 0.07 * | 0.07 | 0.04 | 0.03 | 0.03 | |
| Lethbridge | 0.05 | 0.04 | 0.05 | 0.03 | 0.03 | 0.03 | 0.05 | 0.04 | 0.05 | 0.03 | 0.03 | 0.03 | |
| Mountain View | 0.06 * | 0.06 * | 0.06 * | 0.02 | 0.02 | 0.02 | 0.06 * | 0.06 * | 0.06 * | 0.02 | 0.02 | 0.02 | |
| Red Deer | 0.05 * | 0.04 | 0.04 * | 0.02 | 0.03 | 0.03 | 0.05 * | 0.04 | 0.04 * | 0.02 | 0.03 | 0.03 | |
| RCP 2.6 | RCP 8.5 | ||||||||||||
|---|---|---|---|---|---|---|---|---|---|---|---|---|---|
| Annual | Seasonal | Annual | Seasonal | ||||||||||
| County | His | NF | FF | His | NF | FF | His | NF | FF | His | NF | FF | |
| Trend Magnitude | |||||||||||||
| ET | Ag Region | −0.03 | −0.01 | −0.001 | 0.03 | 0.03 | 0.01 | −0.03 | 0.00 | −0.007 | 0.03 | 0.06 | 0.01 |
| Grande Prairie | 0.04 | 0.36 | 0.28 | 0.10 | 0.29 | −0.14 | 0.04 | 0.38 | 0.63 | 0.10 | 0.31 | −0.13 | |
| Lac Ste. Anne | −0.11 | −1.21 | −1.08 | −0.14 | −0.91 | −0.73 | −0.11 | −1.27 | −1.15 | −0.14 | −0.93 | −0.81 | |
| Leduc | −0.12 | −1.68 | −1.41 | −0.16 | −0.78 | −0.88 | −0.12 | −1.54 | −1.4 | −0.16 | −0.60 | −0.65 | |
| Vermilion | −0.10 | −0.18 | −0.72 | −0.16 | −0.17 | −0.40 | −0.10 | −0.22 | −1.51 | −0.16 | 0.01 | −1.13 | |
| Lethbridge | −0.12 | −2.03 | −1.48 | −0.18 | −2.04 | −1.37 | −0.12 | −0.27 | 0.13 | −0.18 | −0.03 | 0.53 | |
| Mountain View | −0.05 | 0.40 | −0.29 | 0.07 | −0.08 | 0.41 | −0.05 | −0.57 | −0.41 | 0.07 | −0.02 | 0.15 | |
| Red Deer | −0.06 | −0.41 | −0.31 | 0.00 | 0.20 | 0.08 | −0.06 | −0.62 | −0.76 | 0.00 | −0.18 | −0.73 | |
| SM | Ag Region | 0.07 | 0.16 | 0.30 | 0.46 | 0.43 | 0.64 * | 0.07 | 0.08 | 0.43 | 0.46 | 0.38 | 0.70 * |
| Grande Prairie | −0.54 | −0.65 | −0.67 | −0.26 | −0.19 | −0.15 | −0.54 | −0.96 | −0.52 | −0.26 | −0.16 | −0.07 | |
| Lac Ste. Anne | −0.62 | −0.72 | −0.89 | 0.04 | 0.00 | 0.15 | −0.62 | −0.48 | −0.67 | 0.04 | −0.10 | 0.01 | |
| Leduc | 0.10 | −0.74 | −0.12 | 0.06 | 0.12 | 0.18 | 0.10 | −0.59 | −0.17 | 0.06 | 0.10 | 0.01 | |
| Vermilion | −0.04 | −0.94 | −0.64 | 0.53 | 0.03 | 0.51 * | −0.04 | −0.71 | −0.99 | 0.53 | 0.05 | 0.30 | |
| Lethbridge | −0.31 | −0.99 | −1.03 * | 0.13 | −0.06 | 0.07 | −0.31 | −0.78 | −1.26 | 0.13 | 0.15 | 0.14 | |
| Mountain View | −0.22 | −0.90 | −0.39 | −0.10 | −0.36 | −0.09 | −0.22 | −0.79 | −0.17 | −0.10 | −0.38 | −0.01 | |
| Red Deer | 0.74 | −0.13 | −0.10 | 0.85 | 0.57 | 0.50 | 0.74 | 0.01 | 0.58 | 0.85 | 0.51 | 1.24 * | |
| DA | Ag Region | 0.00 | 0.00 | 0.001 | 0.00 | 0.001 | 0.003 | 0.00 | 0.00 | 0.002 | 0.00 | 0.001 | 0.004 |
| Grande Prairie | 0.00 | −0.05 | −0.03 | −0.005 | −0.03 | −0.02 | 0.00 | −0.05 | −0.04 | −0.005 | −0.04 | −0.02 | |
| Lac Ste. Anne | 0.00 | −0.01 | 0.04 | 0.00 | 0.00 | 0.02 | 0.00 | 0.00 | 0.04 | 0.00 | 0.00 | 0.01 | |
| Leduc | 0.00 | 0.02 | 0.04 | 0.002 | 0.02 | 0.03 | 0.00 | 0.01 | 0.04 | 0.002 | 0.02 | 0.03 | |
| Vermilion | 0.00 | 0.00 | 0.01 | 0.00 | 0.00 | 0.01 | 0.00 | 0.00 | 0.01 | 0.00 | 0.00 | 0.01 | |
| Lethbridge | 0.00 | 0.04 | 0.04 | 0.008 | 0.04 * | 0.05 * | 0.00 | 0.00 | 0.02 | 0.008 | 0.00 | 0.03 * | |
| Mountain View | 0.00 | 0.00 | −0.01 | 0.001 | 0.00 | 0.00 | 0.00 | −0.01 | 0.00 | 0.001 | 0.00 | 0.04 | |
| Red Deer | 0.00 | 0.00 | 0.01 | 0.00 | 0.00 | 0.00 | 0.00 | 0.00 | 0.06 * | 0.00 | 0.00 | 0.02 | |
| WYLD | Ag Region | 0.01 | 0.005 | 0.04 | 0.05 | 0.04 | 0.06 | 0.01 | −0.009 | 0.03 | 0.05 | 0.03 | 0.10 |
| Grande Prairie | −0.03 | −0.29 | 0.33 | 0.00 | −0.03 | −0.02 | −0.03 | 0.17 | 0.31 | 0.00 | −0.04 | −0.02 | |
| Lac Ste. Anne | −0.08 | −0.26 | 0.18 | −0.15 | 0.00 | 0.02 | −0.08 | −0.31 | −0.08 | −0.15 | 0.00 | 0.01 | |
| Leduc | 0.06 | 0.98 | 1.49 * | 0.15 | 0.02 | 0.03 | 0.06 | 0.84 | 2.71 * | 0.15 | 0.02 | 0.03 | |
| Vermilion | 0.01 | 0.77 | 1.48 * | 0.03 | 0.00 | 0.01 | 0.01 | 0.96 | 2.22 | 0.03 | 0.00 | 0.01 | |
| Lethbridge | 0.02 | 0.13 | 0.23 | 0.03 | 0.04 * | 0.05 * | 0.02 | 0.07 | 0.16 | 0.03 | 0.00 | 0.03 * | |
| Mountain View | −0.01 | −0.05 | 0.07 | 0.00 | 0.00 | 0.00 | −0.01 | −0.14 | 0.48 | 0.00 | 0.00 | 0.04 | |
| Red Deer | 0.06 | 1.17 | 1.14 | 0.10 | 0.00 | 0.00 | 0.06 | 0.90 | 1.46 | 0.10 | 0.00 | 0.02 | |
© 2018 by the authors. Licensee MDPI, Basel, Switzerland. This article is an open access article distributed under the terms and conditions of the Creative Commons Attribution (CC BY) license (http://creativecommons.org/licenses/by/4.0/).
Share and Cite
Masud, M.B.; Ferdous, J.; Faramarzi, M. Projected Changes in Hydrological Variables in the Agricultural Region of Alberta, Canada. Water 2018, 10, 1810. https://doi.org/10.3390/w10121810
Masud MB, Ferdous J, Faramarzi M. Projected Changes in Hydrological Variables in the Agricultural Region of Alberta, Canada. Water. 2018; 10(12):1810. https://doi.org/10.3390/w10121810
Chicago/Turabian StyleMasud, Mohammad Badrul, Jannatul Ferdous, and Monireh Faramarzi. 2018. "Projected Changes in Hydrological Variables in the Agricultural Region of Alberta, Canada" Water 10, no. 12: 1810. https://doi.org/10.3390/w10121810
APA StyleMasud, M. B., Ferdous, J., & Faramarzi, M. (2018). Projected Changes in Hydrological Variables in the Agricultural Region of Alberta, Canada. Water, 10(12), 1810. https://doi.org/10.3390/w10121810