The proposed numerical methodology of modeling surface irrigation is also developed on the basis of stochastic parameter modeling method of controlling variables. In this section, Monte Carlo simulation method is used as the stochastic parameter simulation methodology.
Probability Distribution Functions of Model Parameters
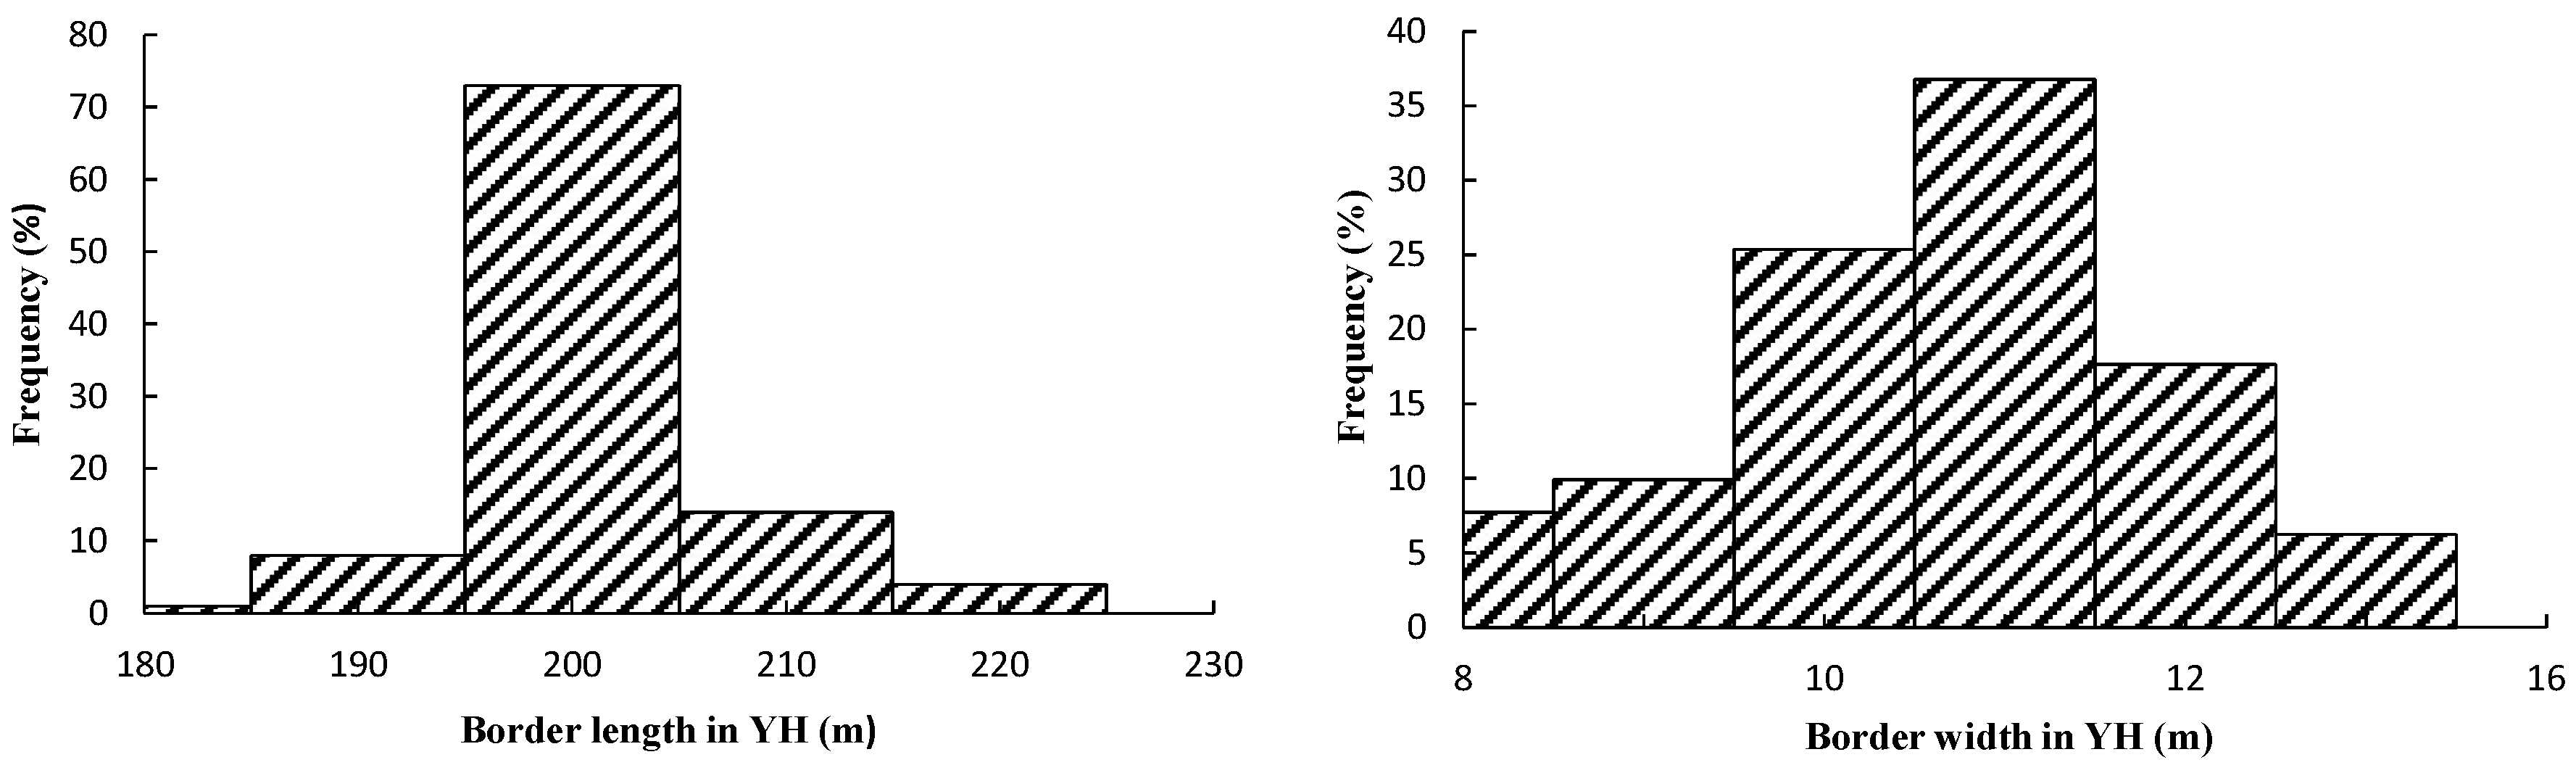
Stochastic parameters, such as border length, unit discharge, soil hydraulic properties, surface micro- topography, field slope, and roughness, are input to the hybrid coupled model proposed by Dong et al. [
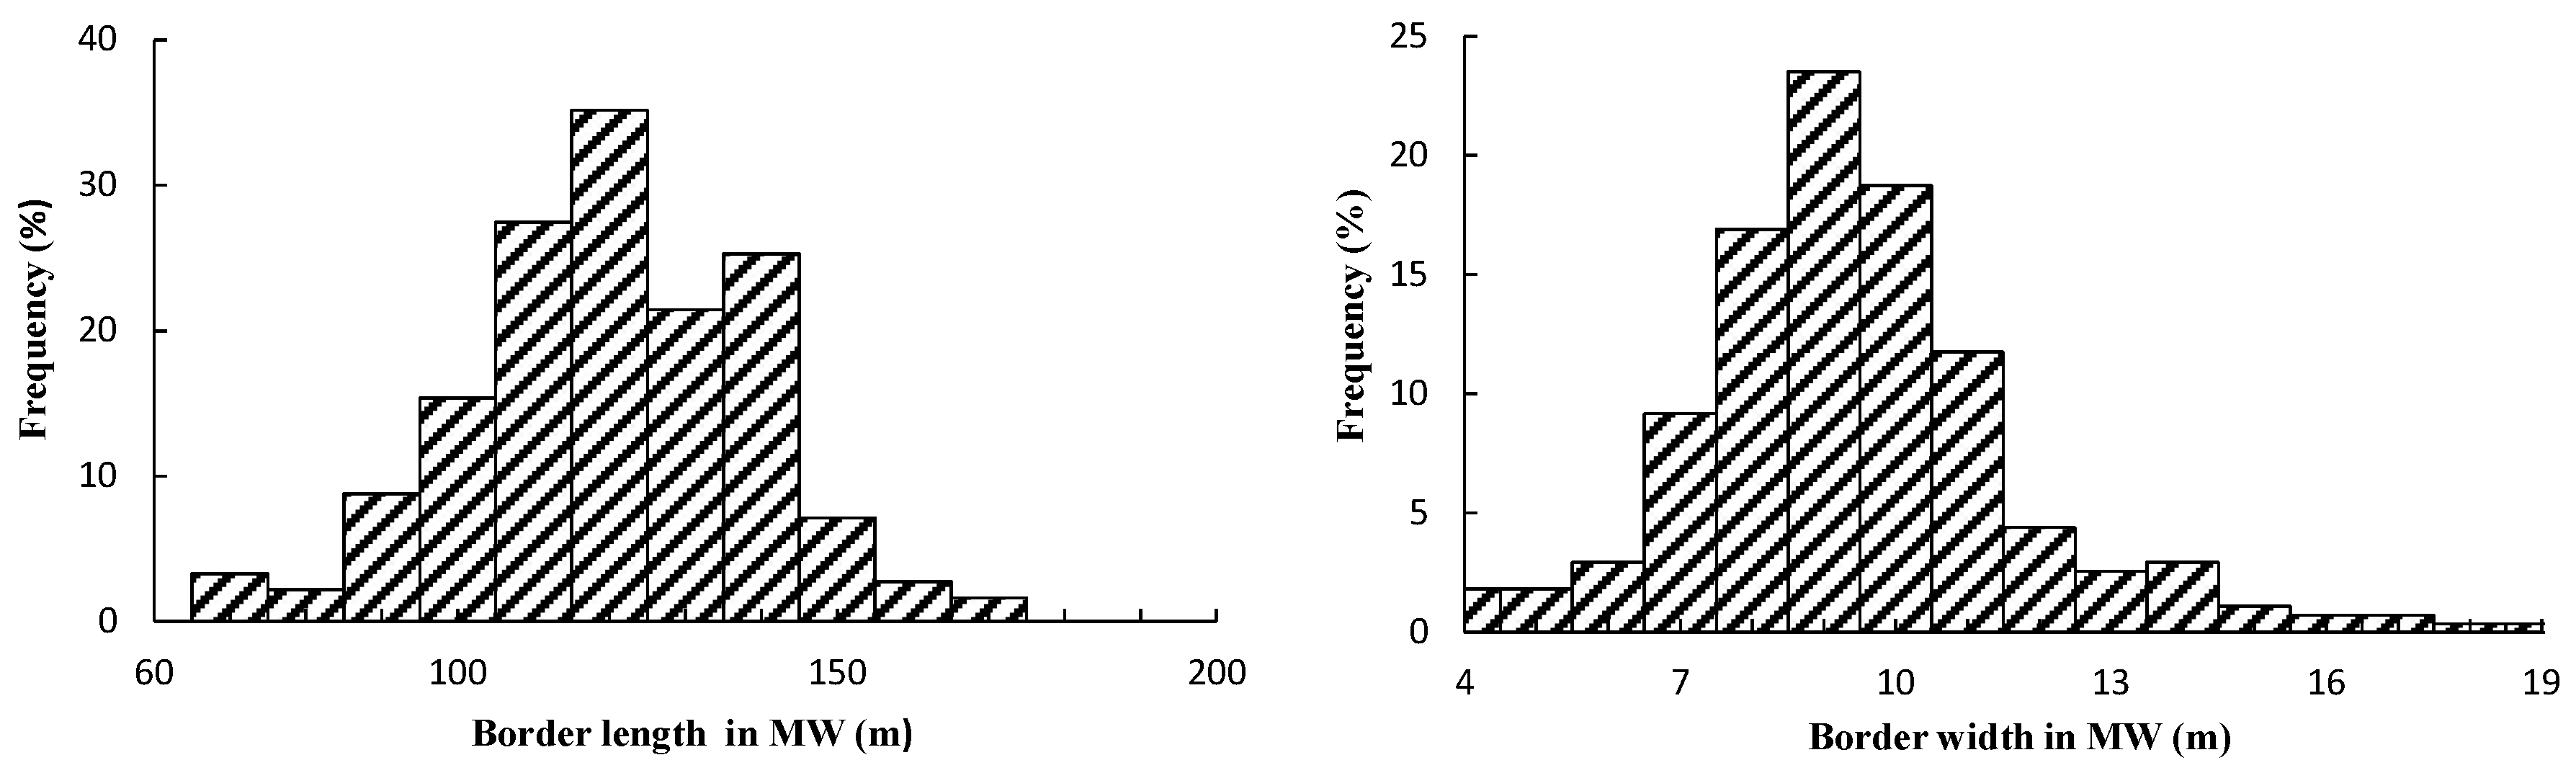
23] as the initial conditions. Soil hydraulic properties are often nonlinearly related to soil sand content, clay content and organic carbon content. Therefore, soil hydraulic properties can be indirectly obtained from soil sand content, clay content, and organic carbon content using Pedo-Transfer Functions (PTFs). In order to assess border irrigation performance of field scale, the normal or logarithmic normal distribution functions are used to describe the distribution characteristics of controlling variables because of their spatial uncertainty. Border length, border width, unit discharge, soil sand content, soil clay content, and soil organic carbon content are of approximately normal distribution at a field scale. The probability distribution function of normal distribution can be expressed as follows:
where
x is the controlling variable,
u is the mean value of the controlling variable, and
σ is the standard deviation of the controlling variable.
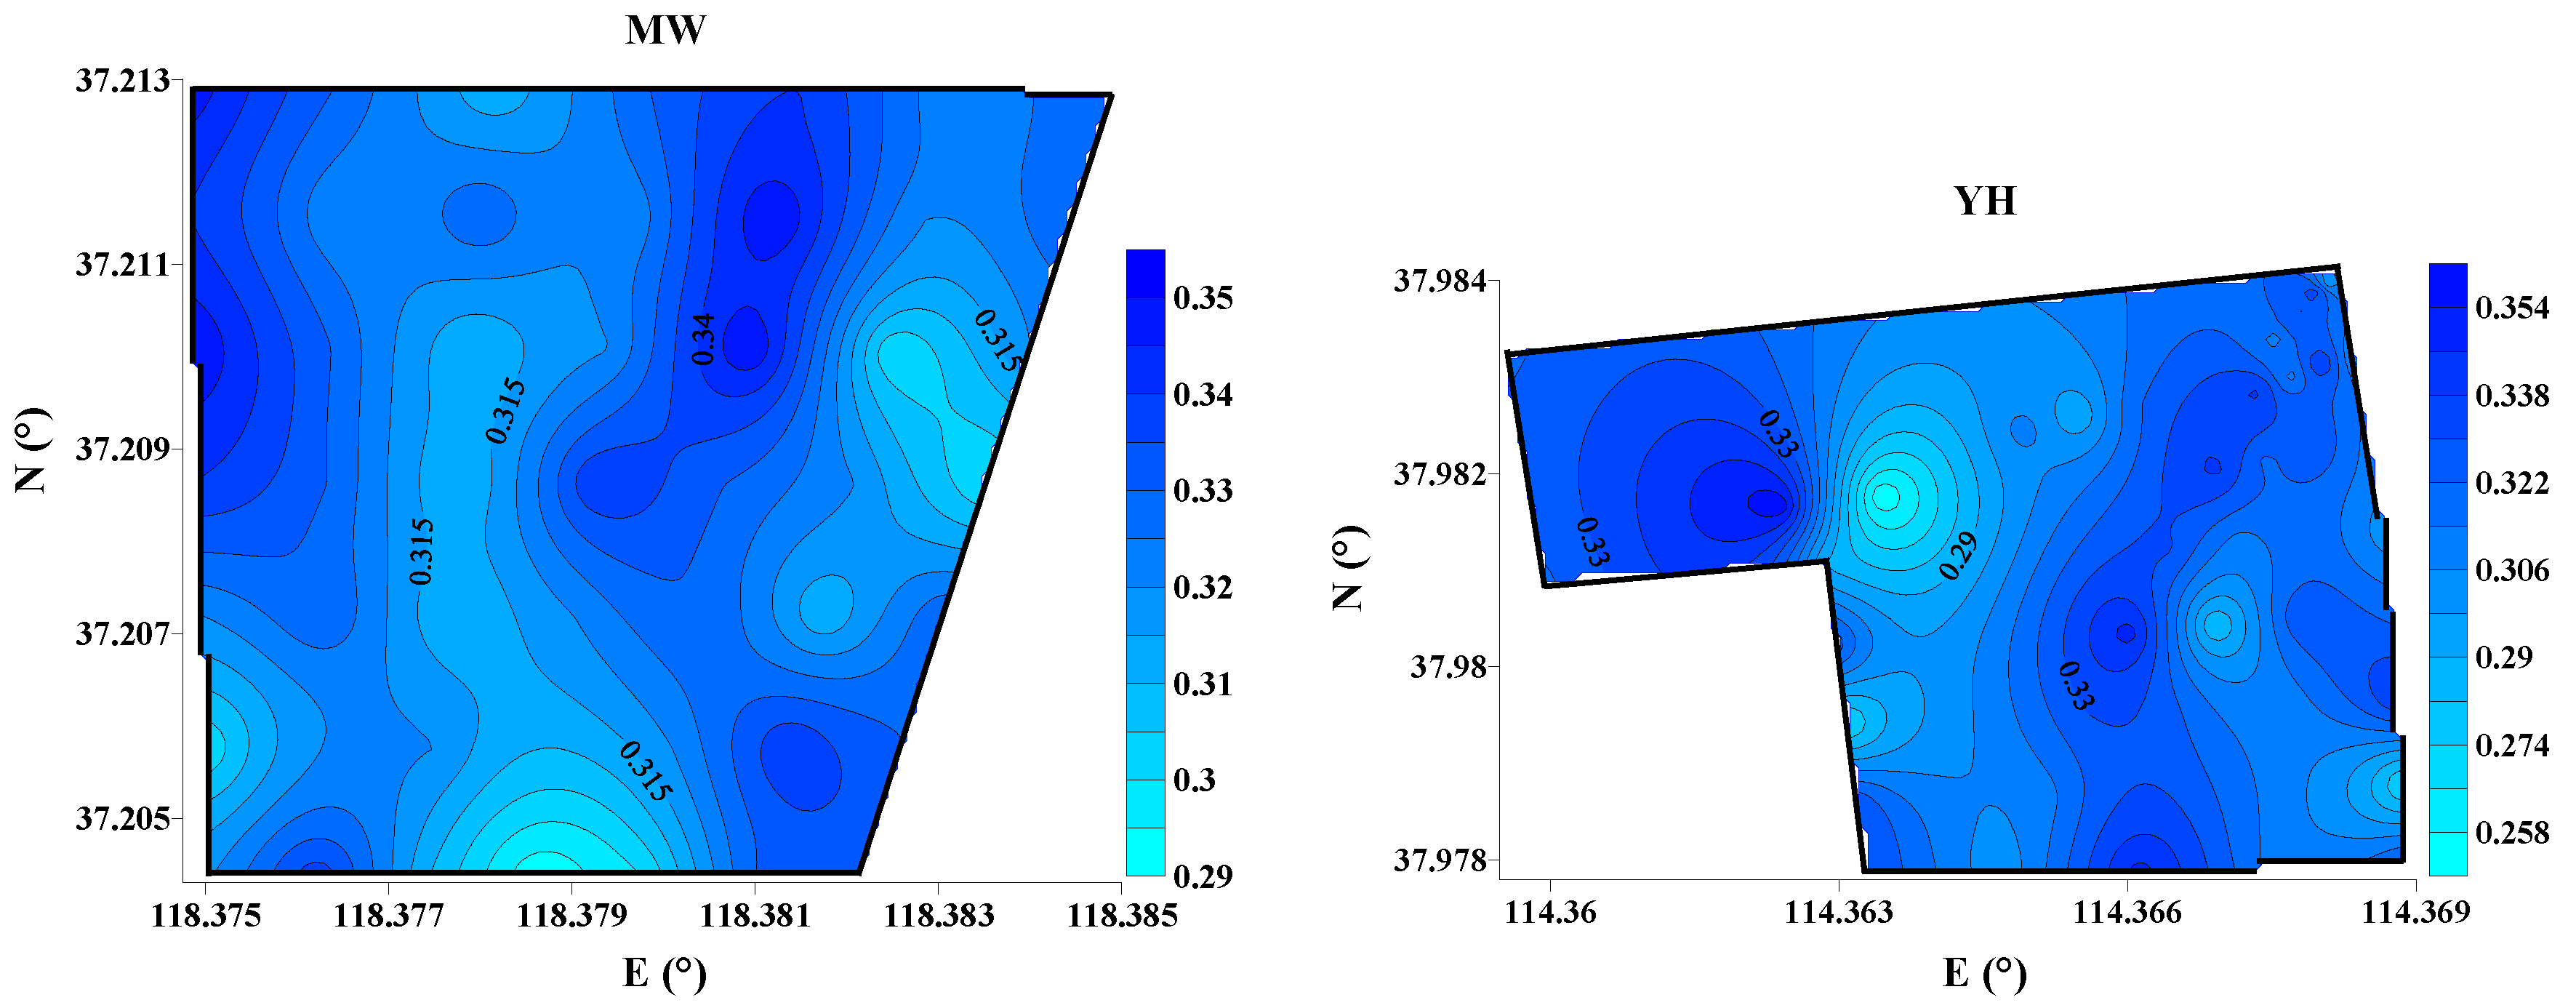
Surface micro-topography is one of the most important factors affecting the irrigation performance of a border irrigation system and it significantly affects the advance and recession processes of an irrigation event [
28]. Micro-topography varies spatially along both the longitudinal and transversal directions of a border, thus the spatial distribution of surface elevation differences (SED) also affects the advance and recession processes and system performance. Therefore, the spatial variability of surface micro-topography includes the degree of unevenness of SED expressed by the standard deviation
Sd and the spatial distribution of SED between the actual and the target design elevations. Under the same field tillage and management conditions, all of the
Sd values of SED at a field scale are assumed as the same [
26]. For a same
Sd the spatial distribution of SED may vary, which makes it difficult to describe the impacts of the spatial variability of SED on surface irrigation performance. Therefore, surface micro-topography at a field scale can be represented by a set of elevation distributions of SED for the same S
d. Based on the field geometry (length and width) and the statistical characteristics of observed SED, the surface elevation nodes can be expressed by the following distribution:
where
zmt is SED (cm),
umt is the mean value of SED (cm), and
σmt is the standard deviation of SED (cm).
Monte Carlo Simulation
Monte Carlo method is developed on the basis of probability and statistics theory and can be used to analyze most of the uncertainty issues. It is assumed that the probability distribution function of the random variable is known and a set of input parameter samples are obtained using the random sampling method. Thus, numerical models run based on the input parameter samples and output the corresponding simulation results. Finally, the performance indicators are calculated on the basis of the output data and their probability distribution characteristics are fitted, respectively.
In the proposed paper, it is assumed that all of the border slope, surface roughness and the standard deviation
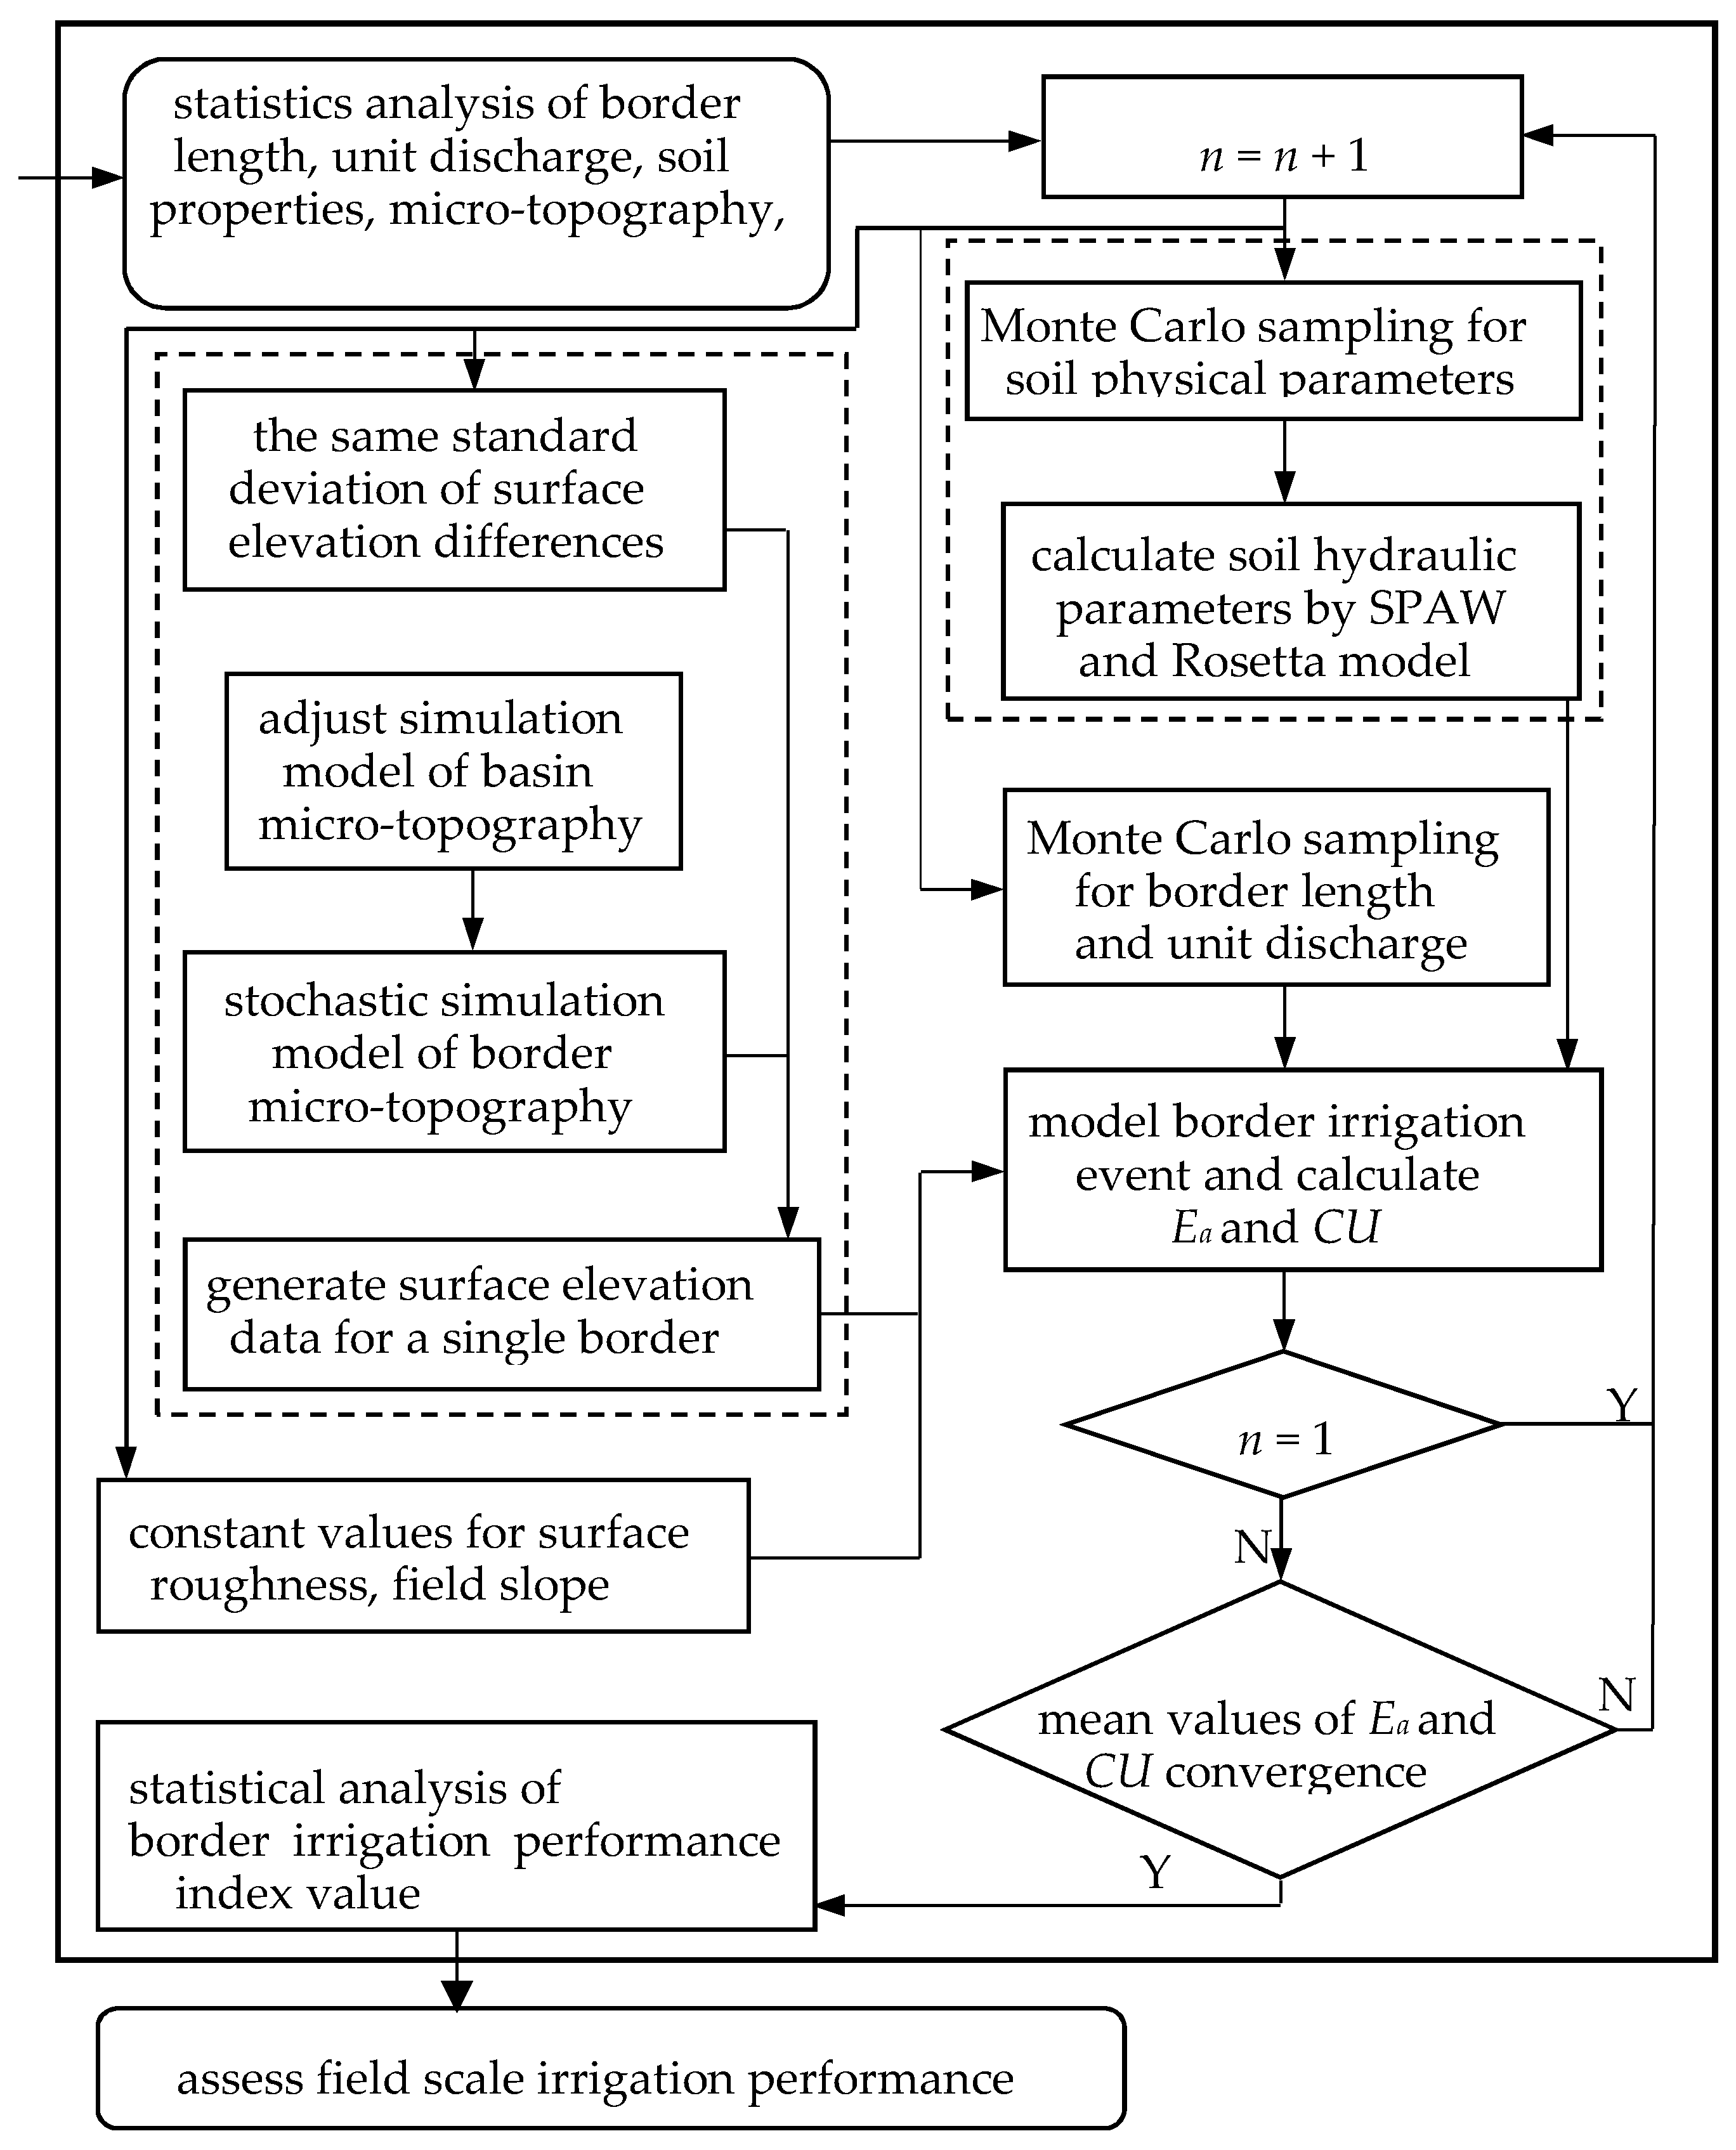
Sd of surface micro-topography at a field scale are the same under the same filed tillage and management conditions and the spatial variability of soil properties, border length, unit discharge, and the spatial distribution of SED are the main factors that affect surface irrigation performance of field scale and the spatial distribution characteristics. The Monte Carlo simulation process of border irrigation at a field scale shown in
Figure 4 is discussed as follows:
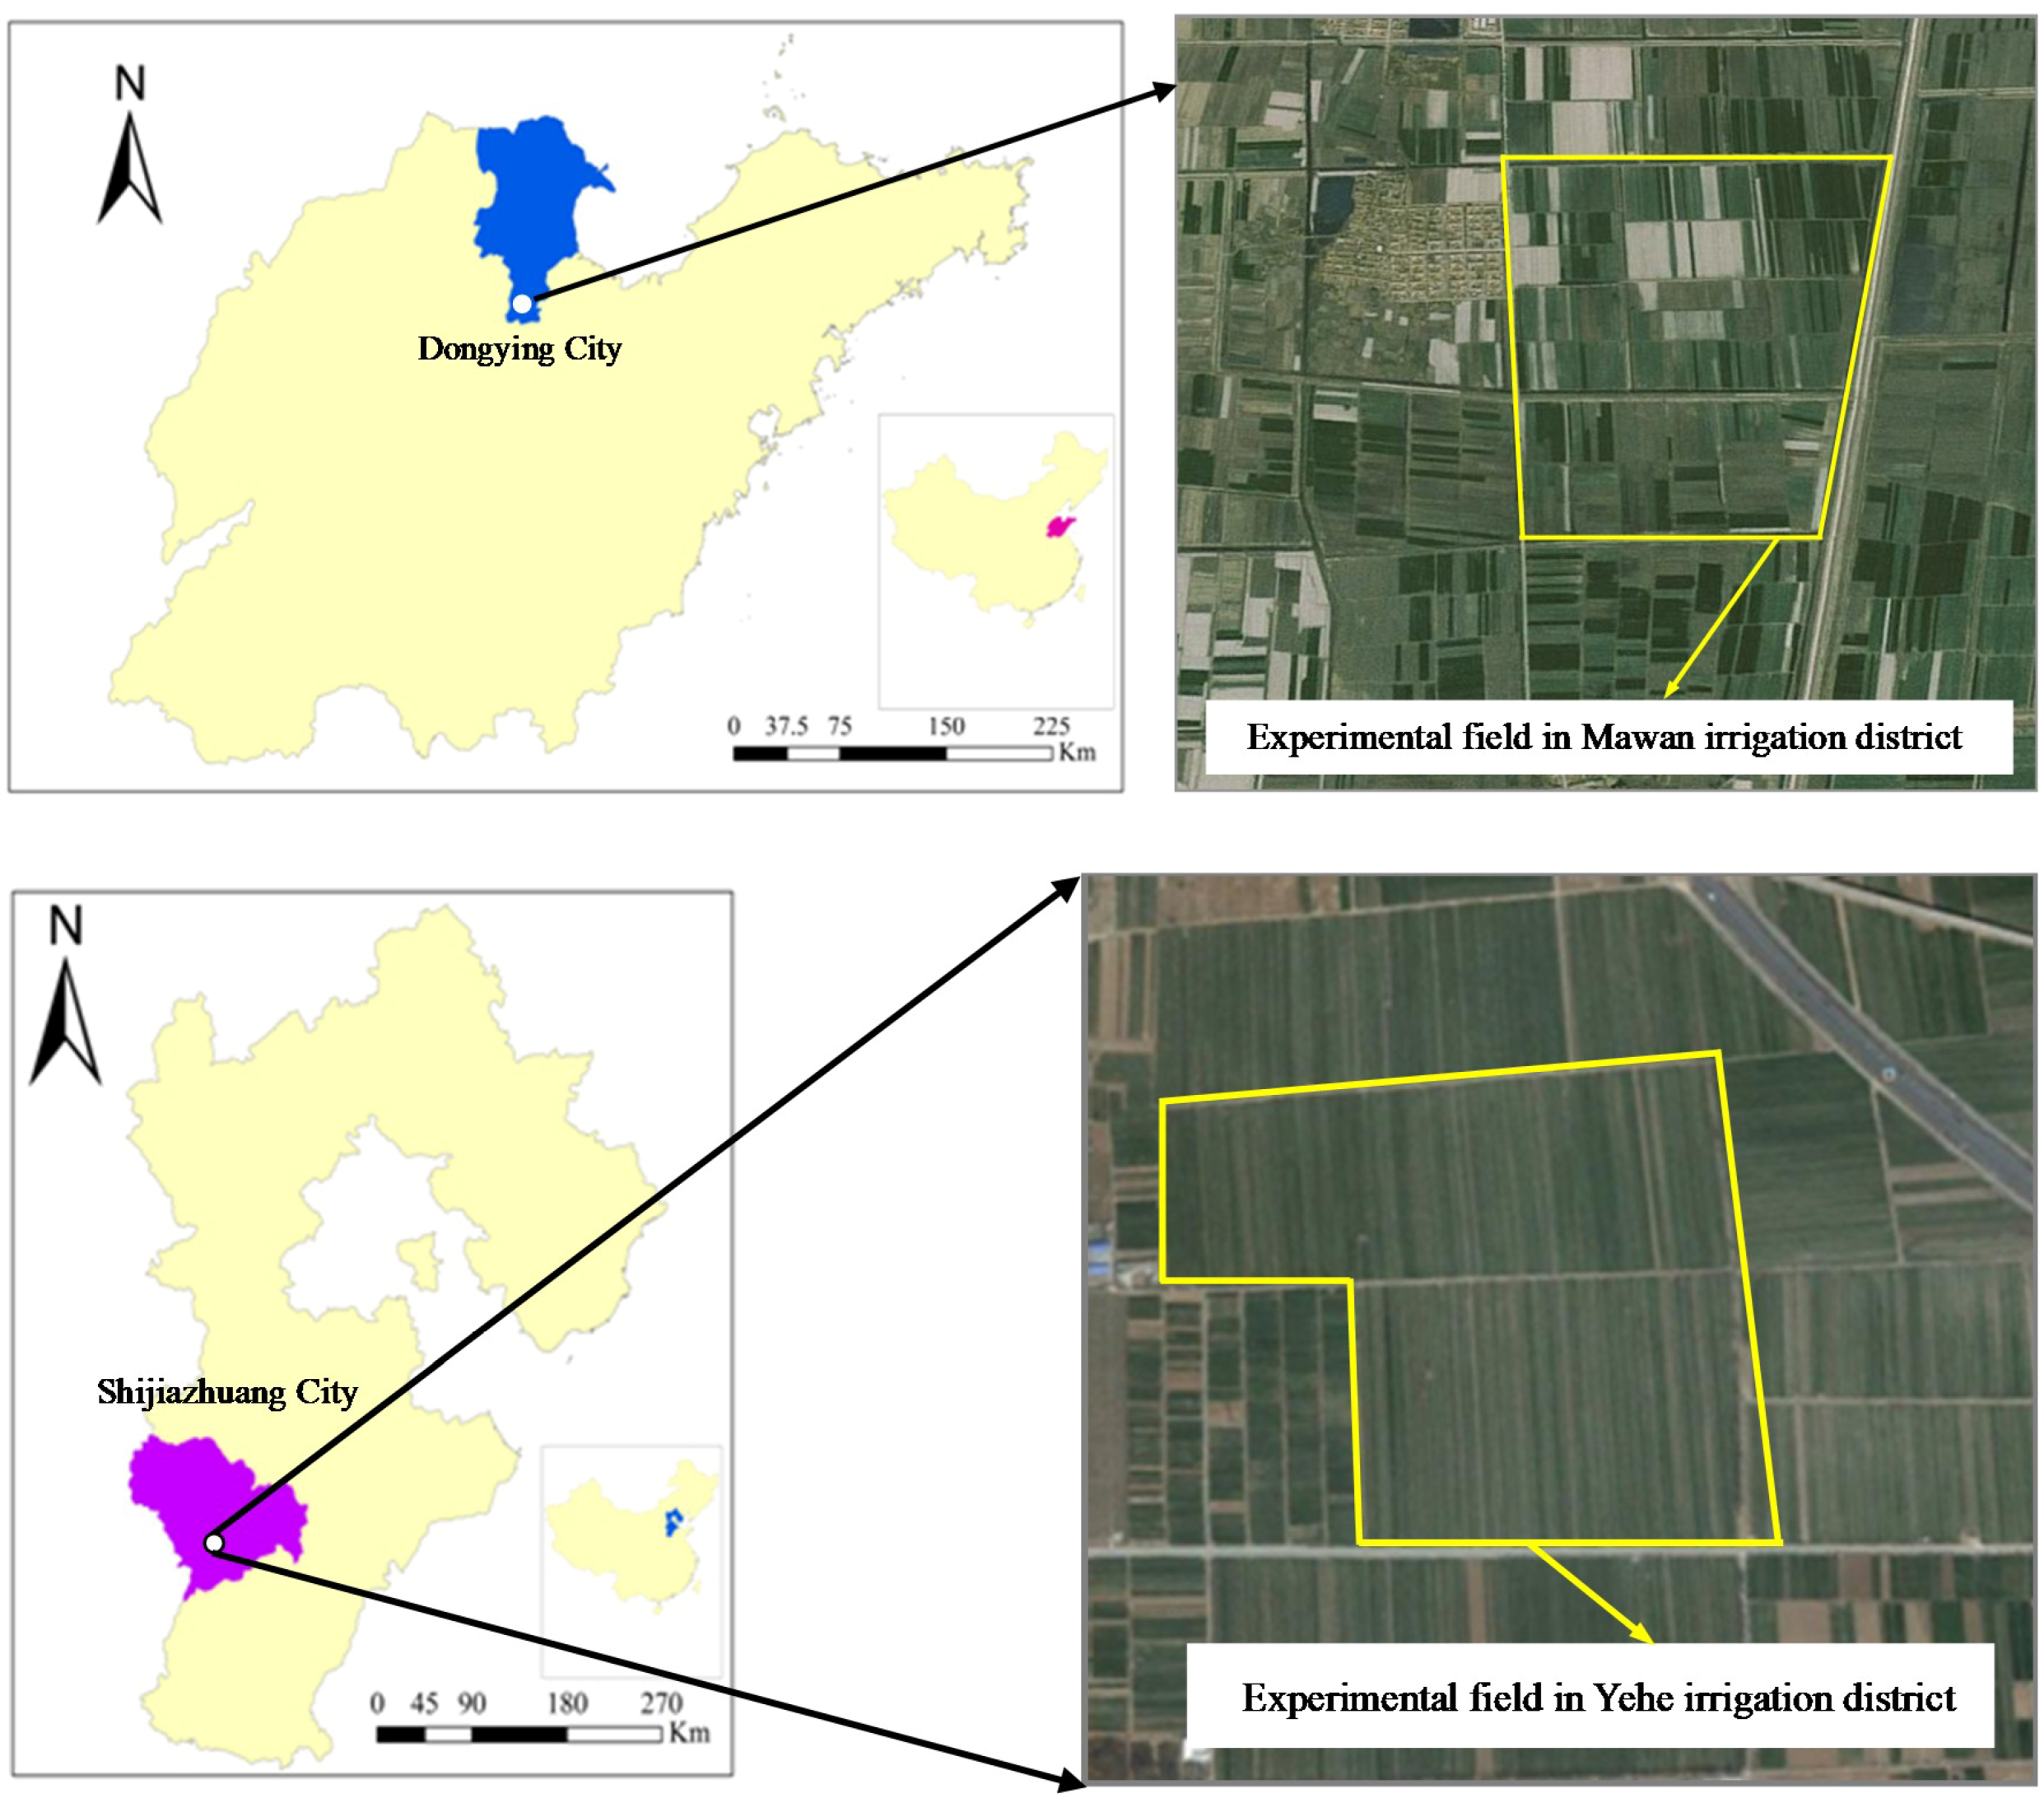
(1) The probability and statistical analysis of soil sand content, soil clay content, soil organic carbon, border length, unit discharge and SED are conducted on the basis of the field test data of field scale. The roughness coefficients of 100 plots selected randomly are calculated based on the surface elevation data and field slope values of 100 plots selected randomly are obtained based on surface water depth and crop growth situation.
(2) The probability distribution functions of soil sand content, clay content, silt content, and organic carbon content are obtained on the basis of the field test data of field scale and a set of random samples are obtained through their probability distribution functions by means of Monte Carlo simulation. If the parameter sample combinations of soil properties do not satisfy the given condition of Equation (12), the sample combination is replenished. Then, soil bulk density, field water holding capacity and wilt water content are obtained when the random samples of soil sand content, clay content and organic carbon content satisfying Equation (12) are input to Soil Plant Atmosphere Water (SPAW) software [
29]. Finally, the random samples of soil sand content, soil clay content, soil organic carbon, soil bulk density, field water holding capacity and wilt water content are input to Rosetta software and the corresponding samples of soil hydraulic properties are obtained.
where
Si is soil silt content, %,
C is soil clay content, %,
S is soil sand content, %, and
SOC is soil organic matter content, %.
(3) A set of border length and unit discharge samples are obtained through their probability distribution functions by means of Monte Carlo simulation, respectively.
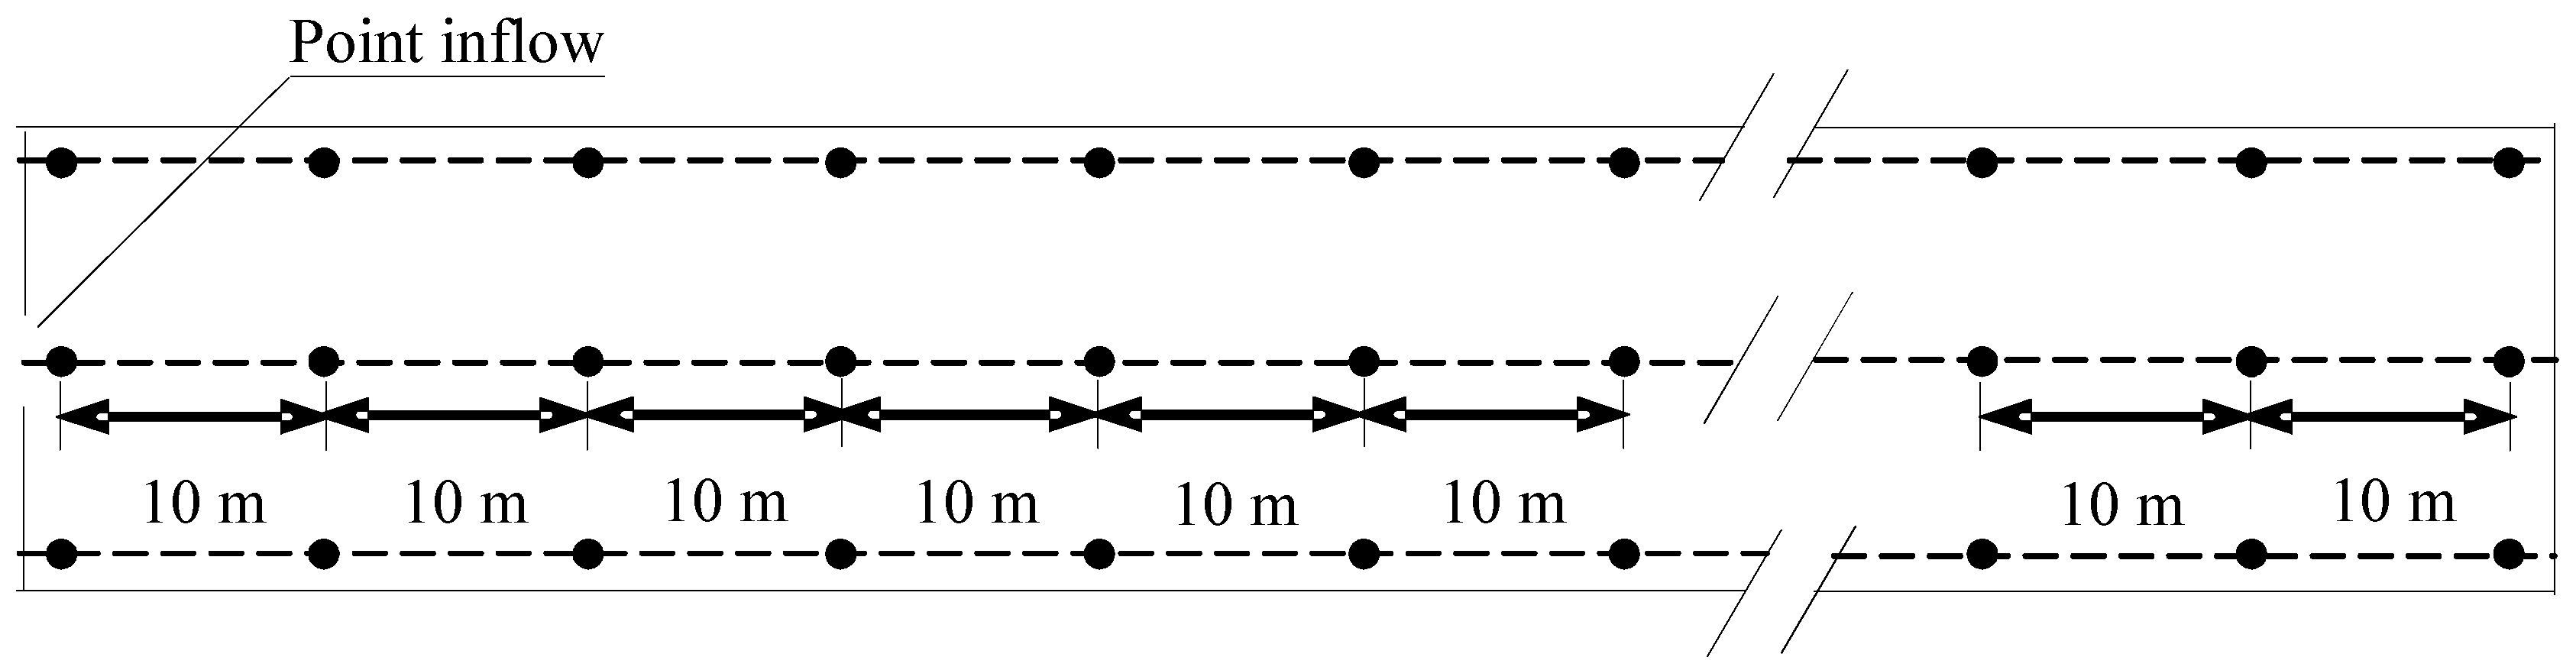
(4) The number of surface elevation node in a single border is determined by field length, field width and the length of surface cell which is divided along the basin length direction. Surface elevation distribution data are generated by the stochastic simulation model of basin micro-topography, which is developed to simulate two-dimensional surface micro-topography on the basis of Monte Carlo method and Kriging interpolation method [
26]. To simulate the one-dimensional border micro-topography, Equation (13) is used to update the above-mentioned surface elevation distribution data for border irrigation simulation:
where
is the average value of SED at the grid
j along the basin length direction, representing the new SED value (cm),
is the SED value at the grid
k along the basin width direction (cm),
Nx is the grid number along the basin width direction (−), and
Ny is the grid number along the basin length direction (−).
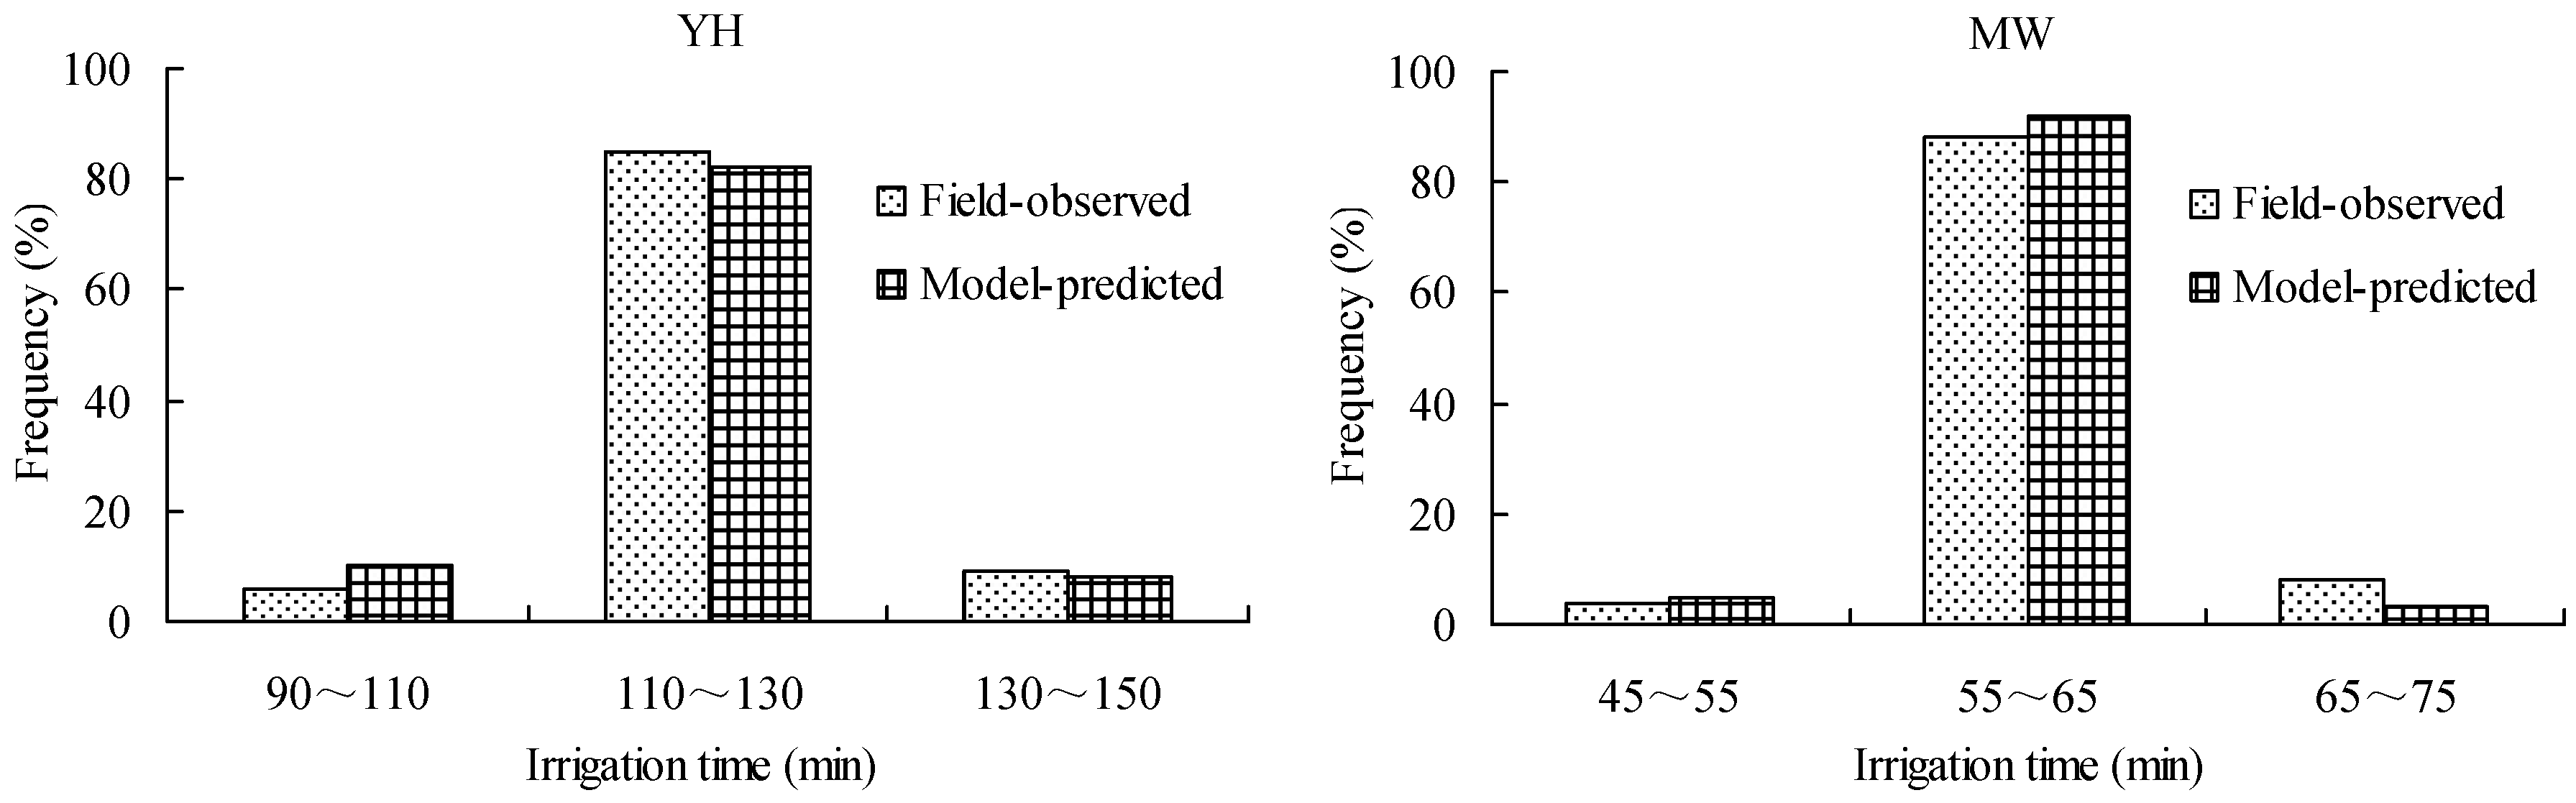
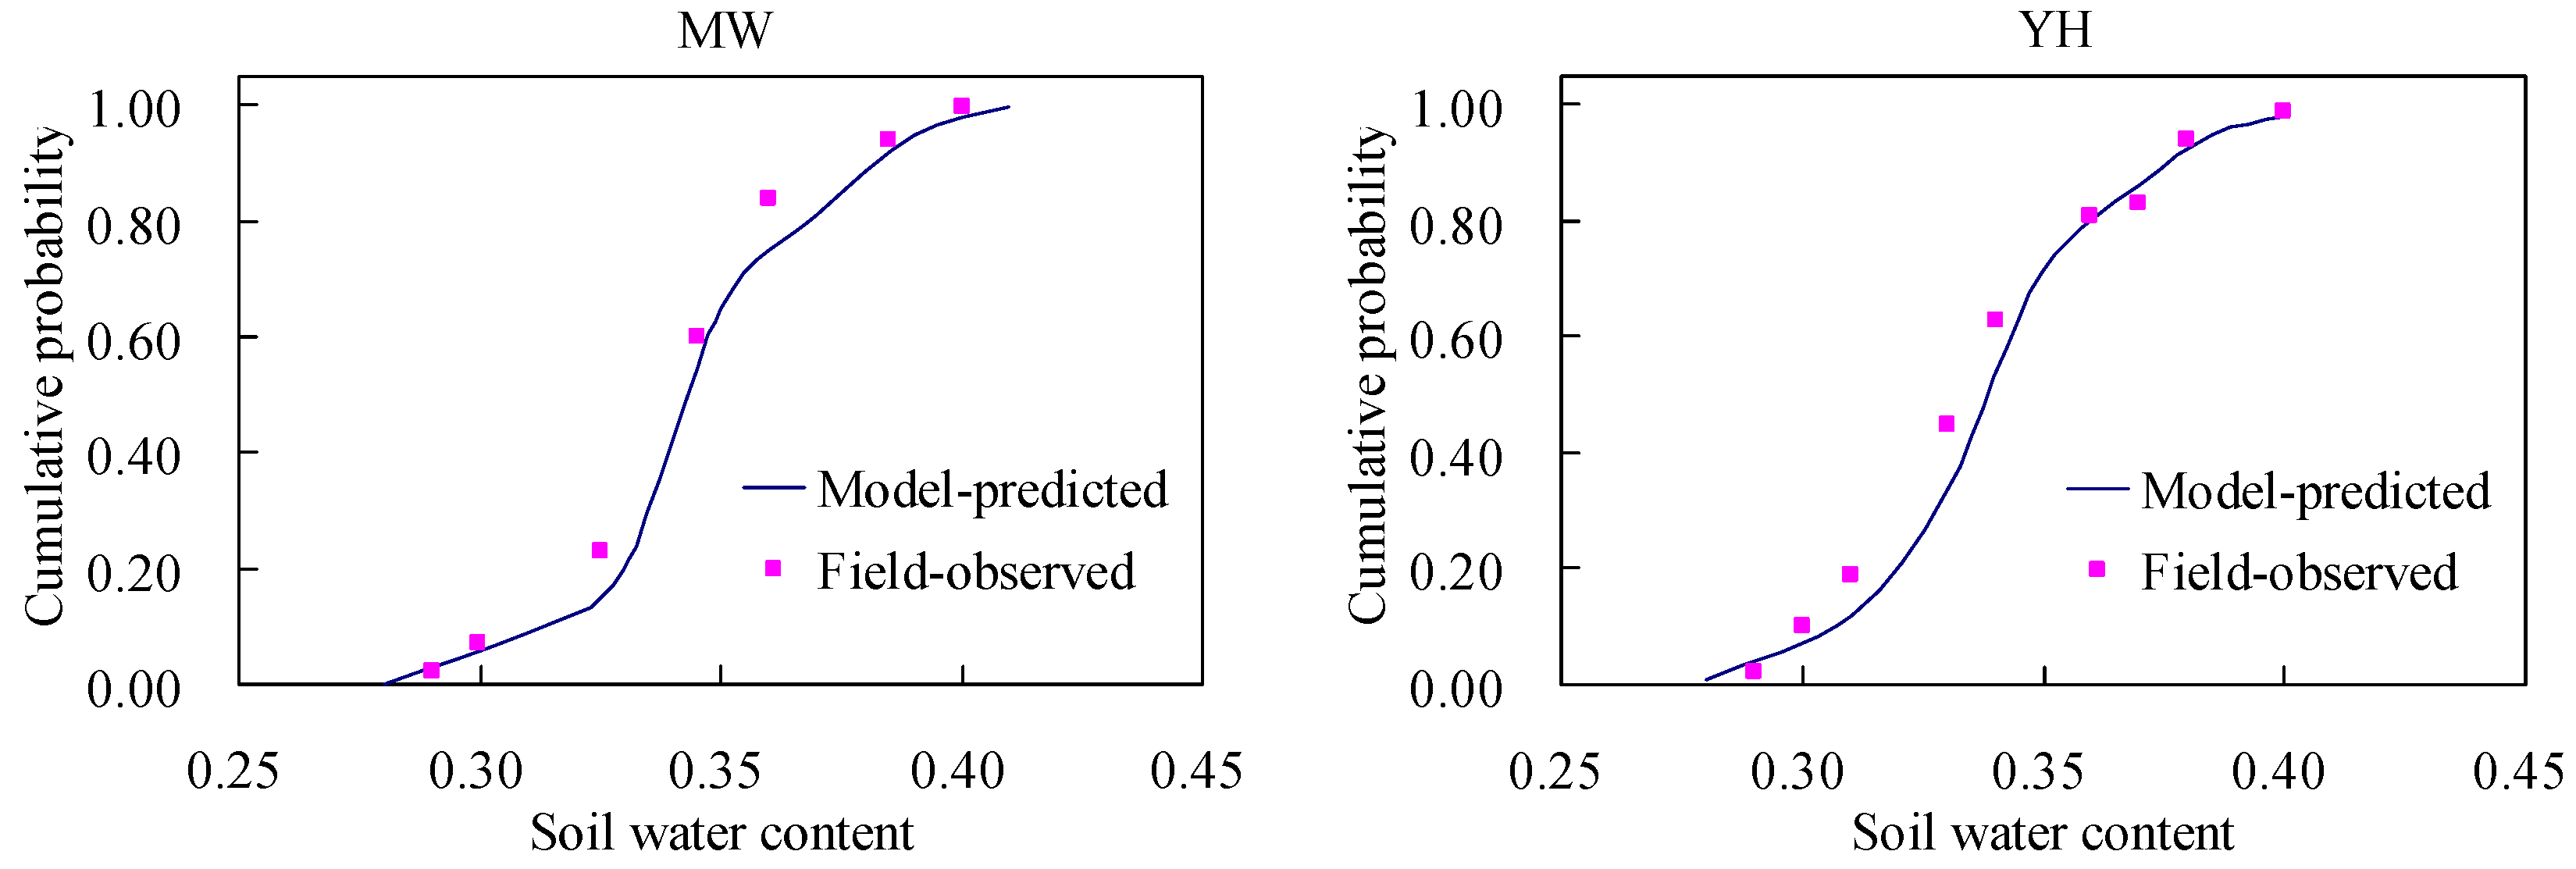
(5) Steps (2) to (4) are repeated to obtain a set of random sample combinations, including border length, unit discharge, soil hydraulic properties, and surface micro-topography. These sample combinations and the constant parameters such as the mean values of field slope and roughness coefficient are input to the hybrid coupled model. Then, the hybrid coupled model runs repeatedly based on a set of stochastic parameter combinations and the border irrigation uniformity coefficient (CU) and border irrigation application efficiency (Ea) of each irrigation event are calculated based on the simulation values of soil water content along the border length direction. In the proposed paper, the maximum number of randomly selected samples is set to 272, which is the field-observed number.
(6) If the mean values of
CU and
Ea of the iteration (
n + 1) and mean values of
CU and
Ea of the iteration
n cannot satisfy the convergence criterion of Equations (14) and (15) (shown in
Section 2.3), the iterative process continues. Otherwise, the iteration is terminated.
(7) The probability and statistical analysis method is used to analyze the changing trend of each evaluation indicator at a field scale, assess the impacts of spatial variability of field physical properties on border irrigation performance of field scale and optimize surface irrigation management plan at a field scale.


