Health Risk Assessment of Household Drinking Water in a District in the UAE

 ,
,  ,
,
Abstract
1. Introduction
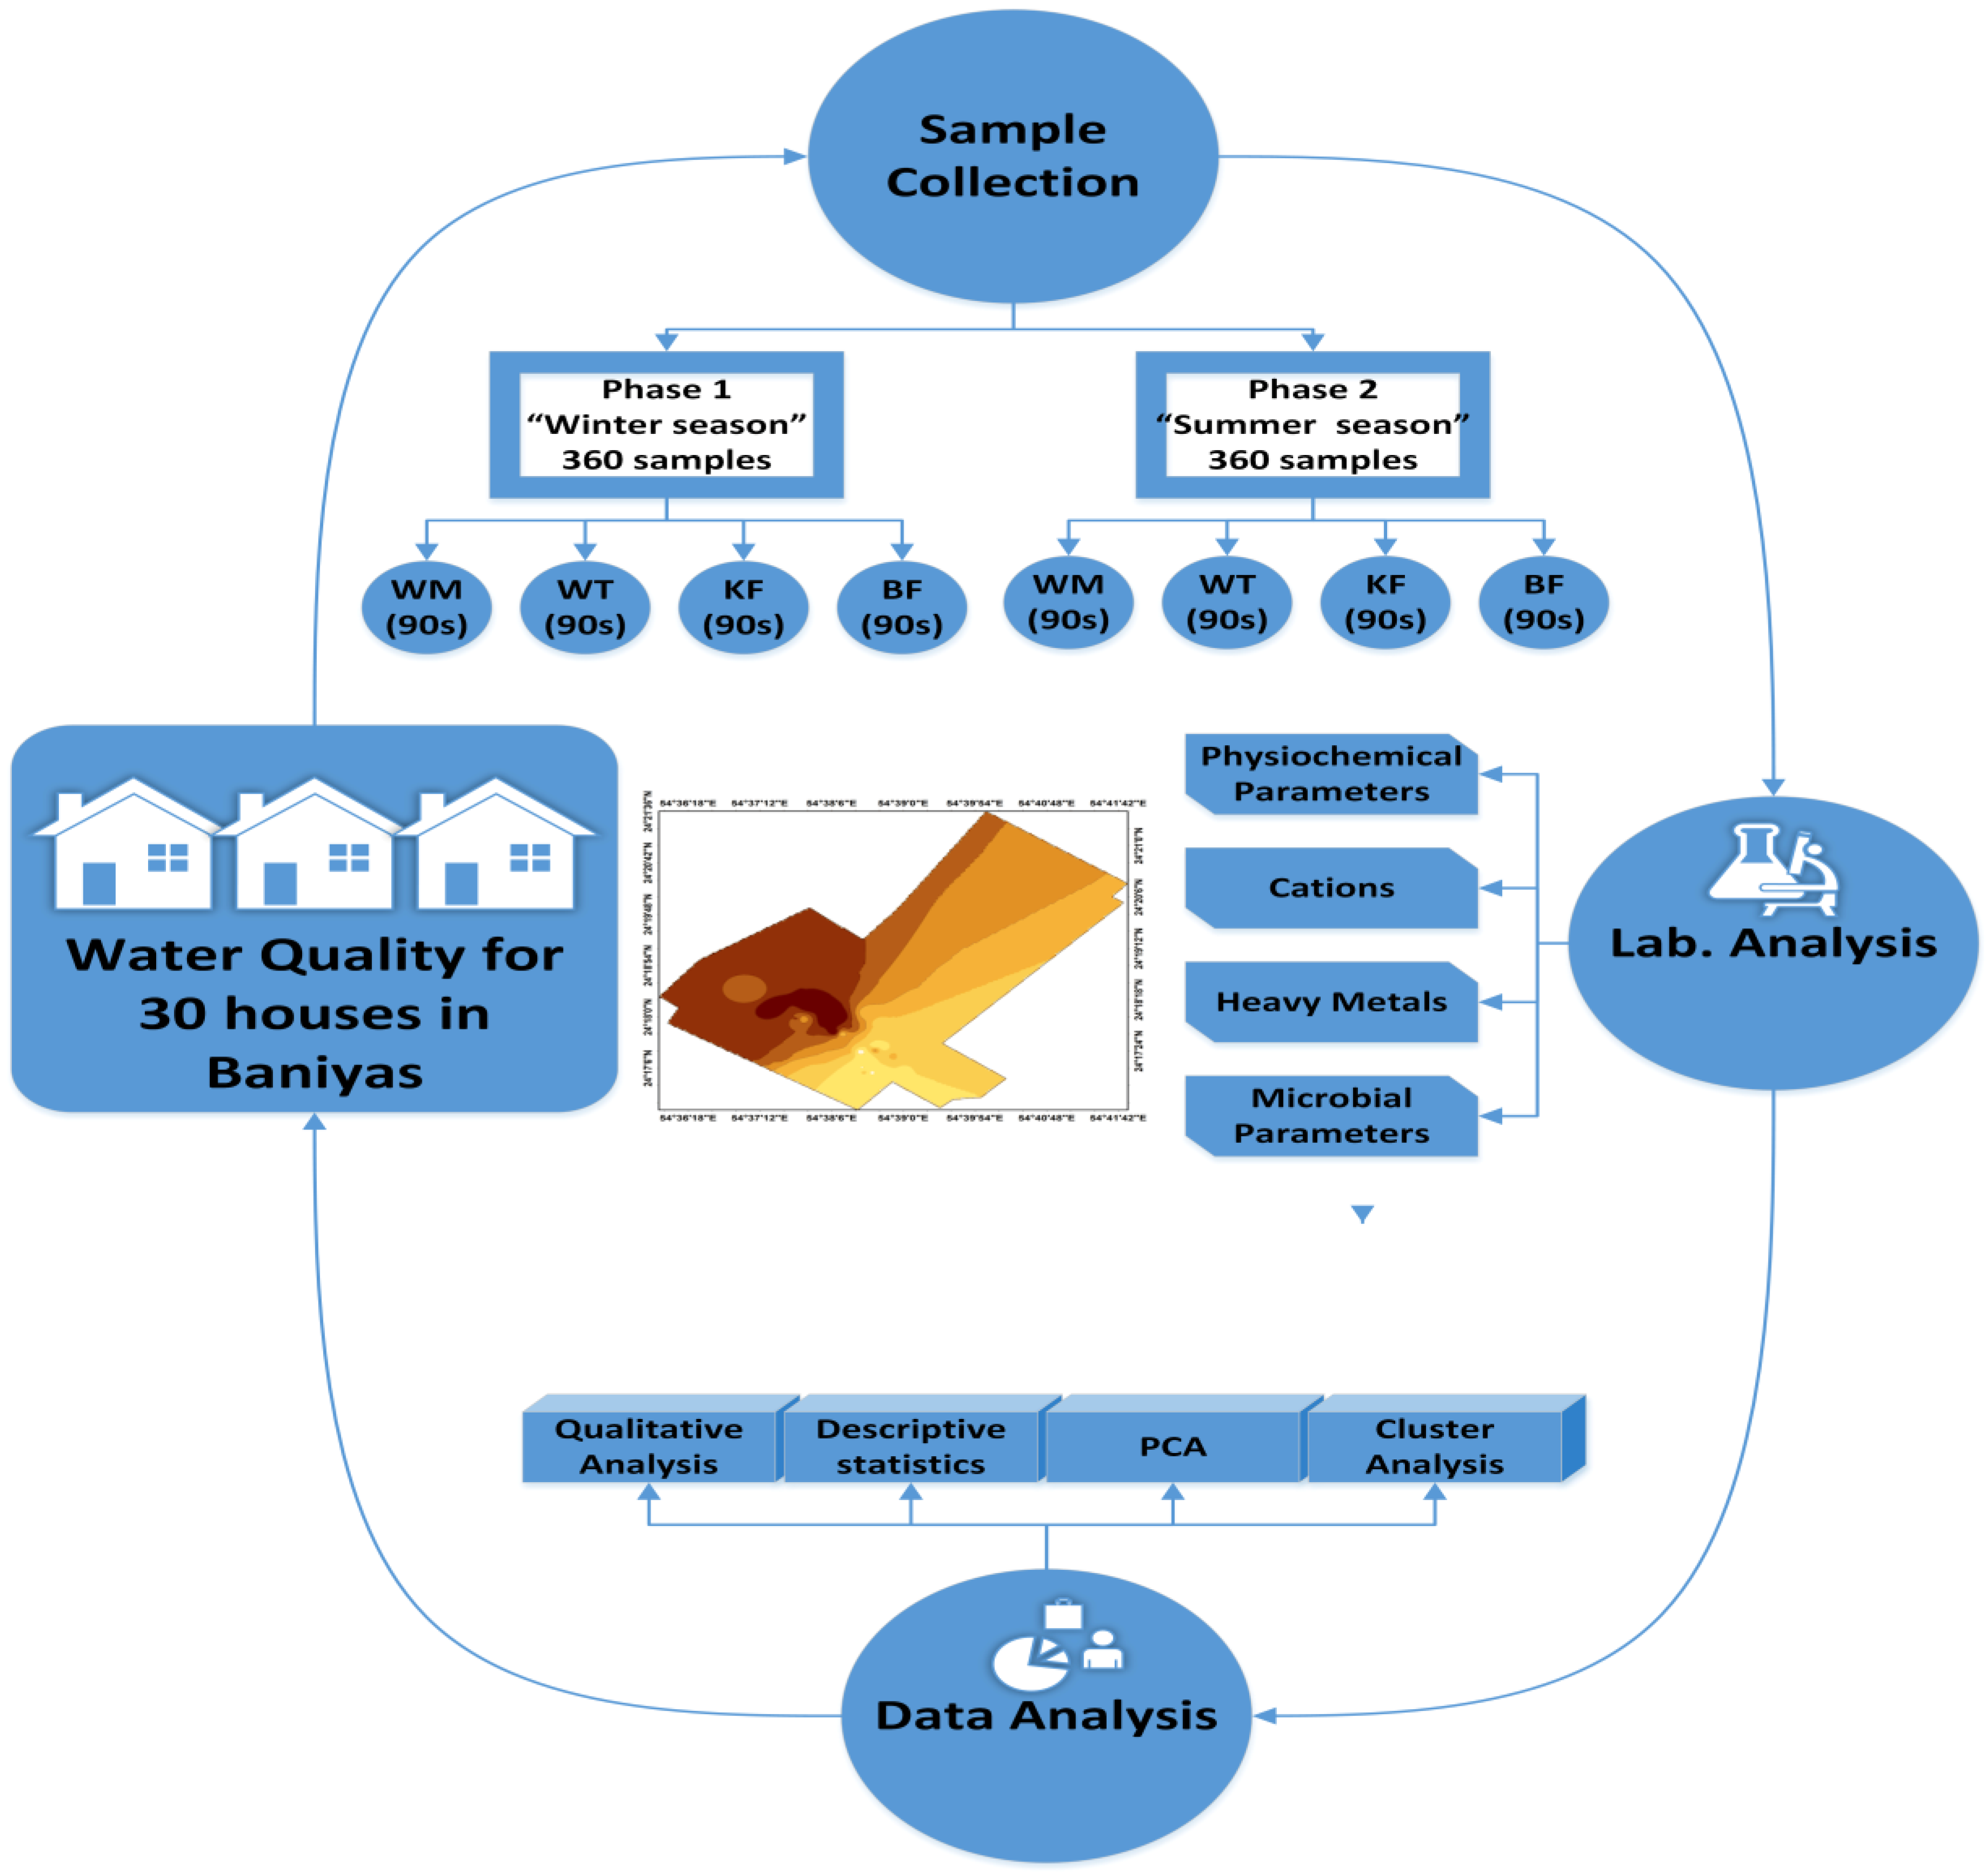
2. Materials and Methods
2.1. Study Area
2.2. Sample Collection and Preparation
2.3. Laboratory and Field Methods
2.4. Data Analysis
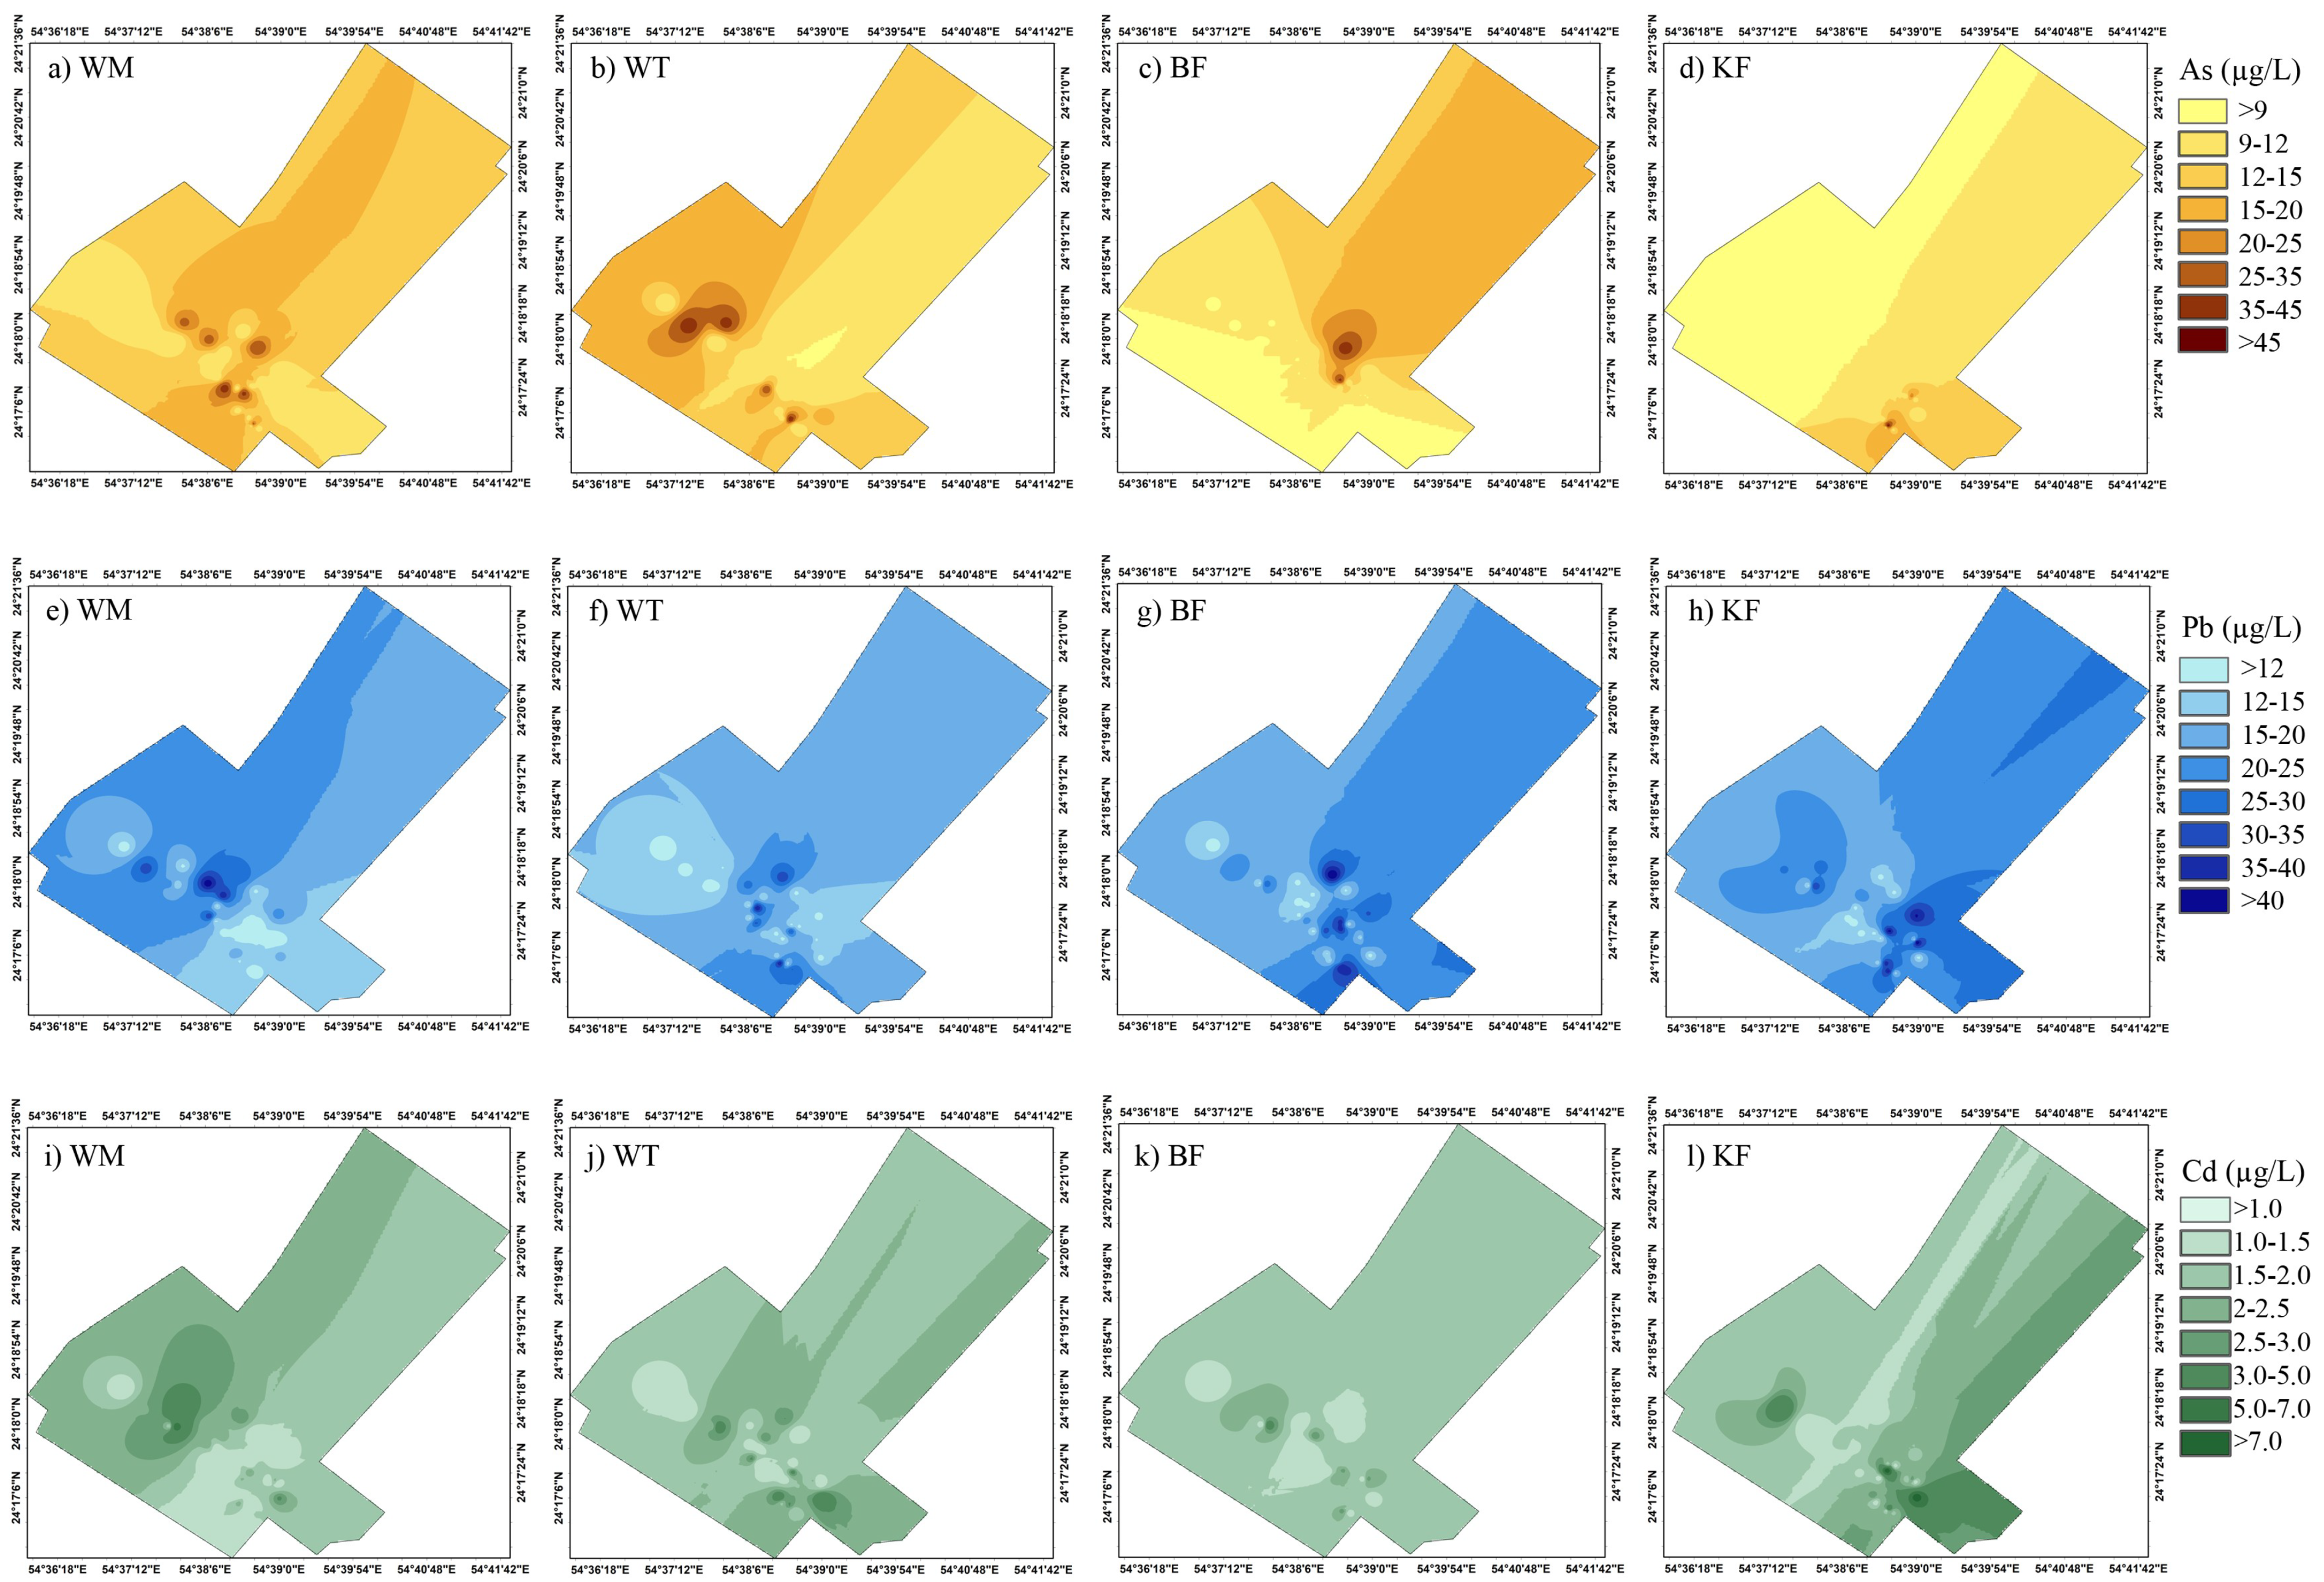
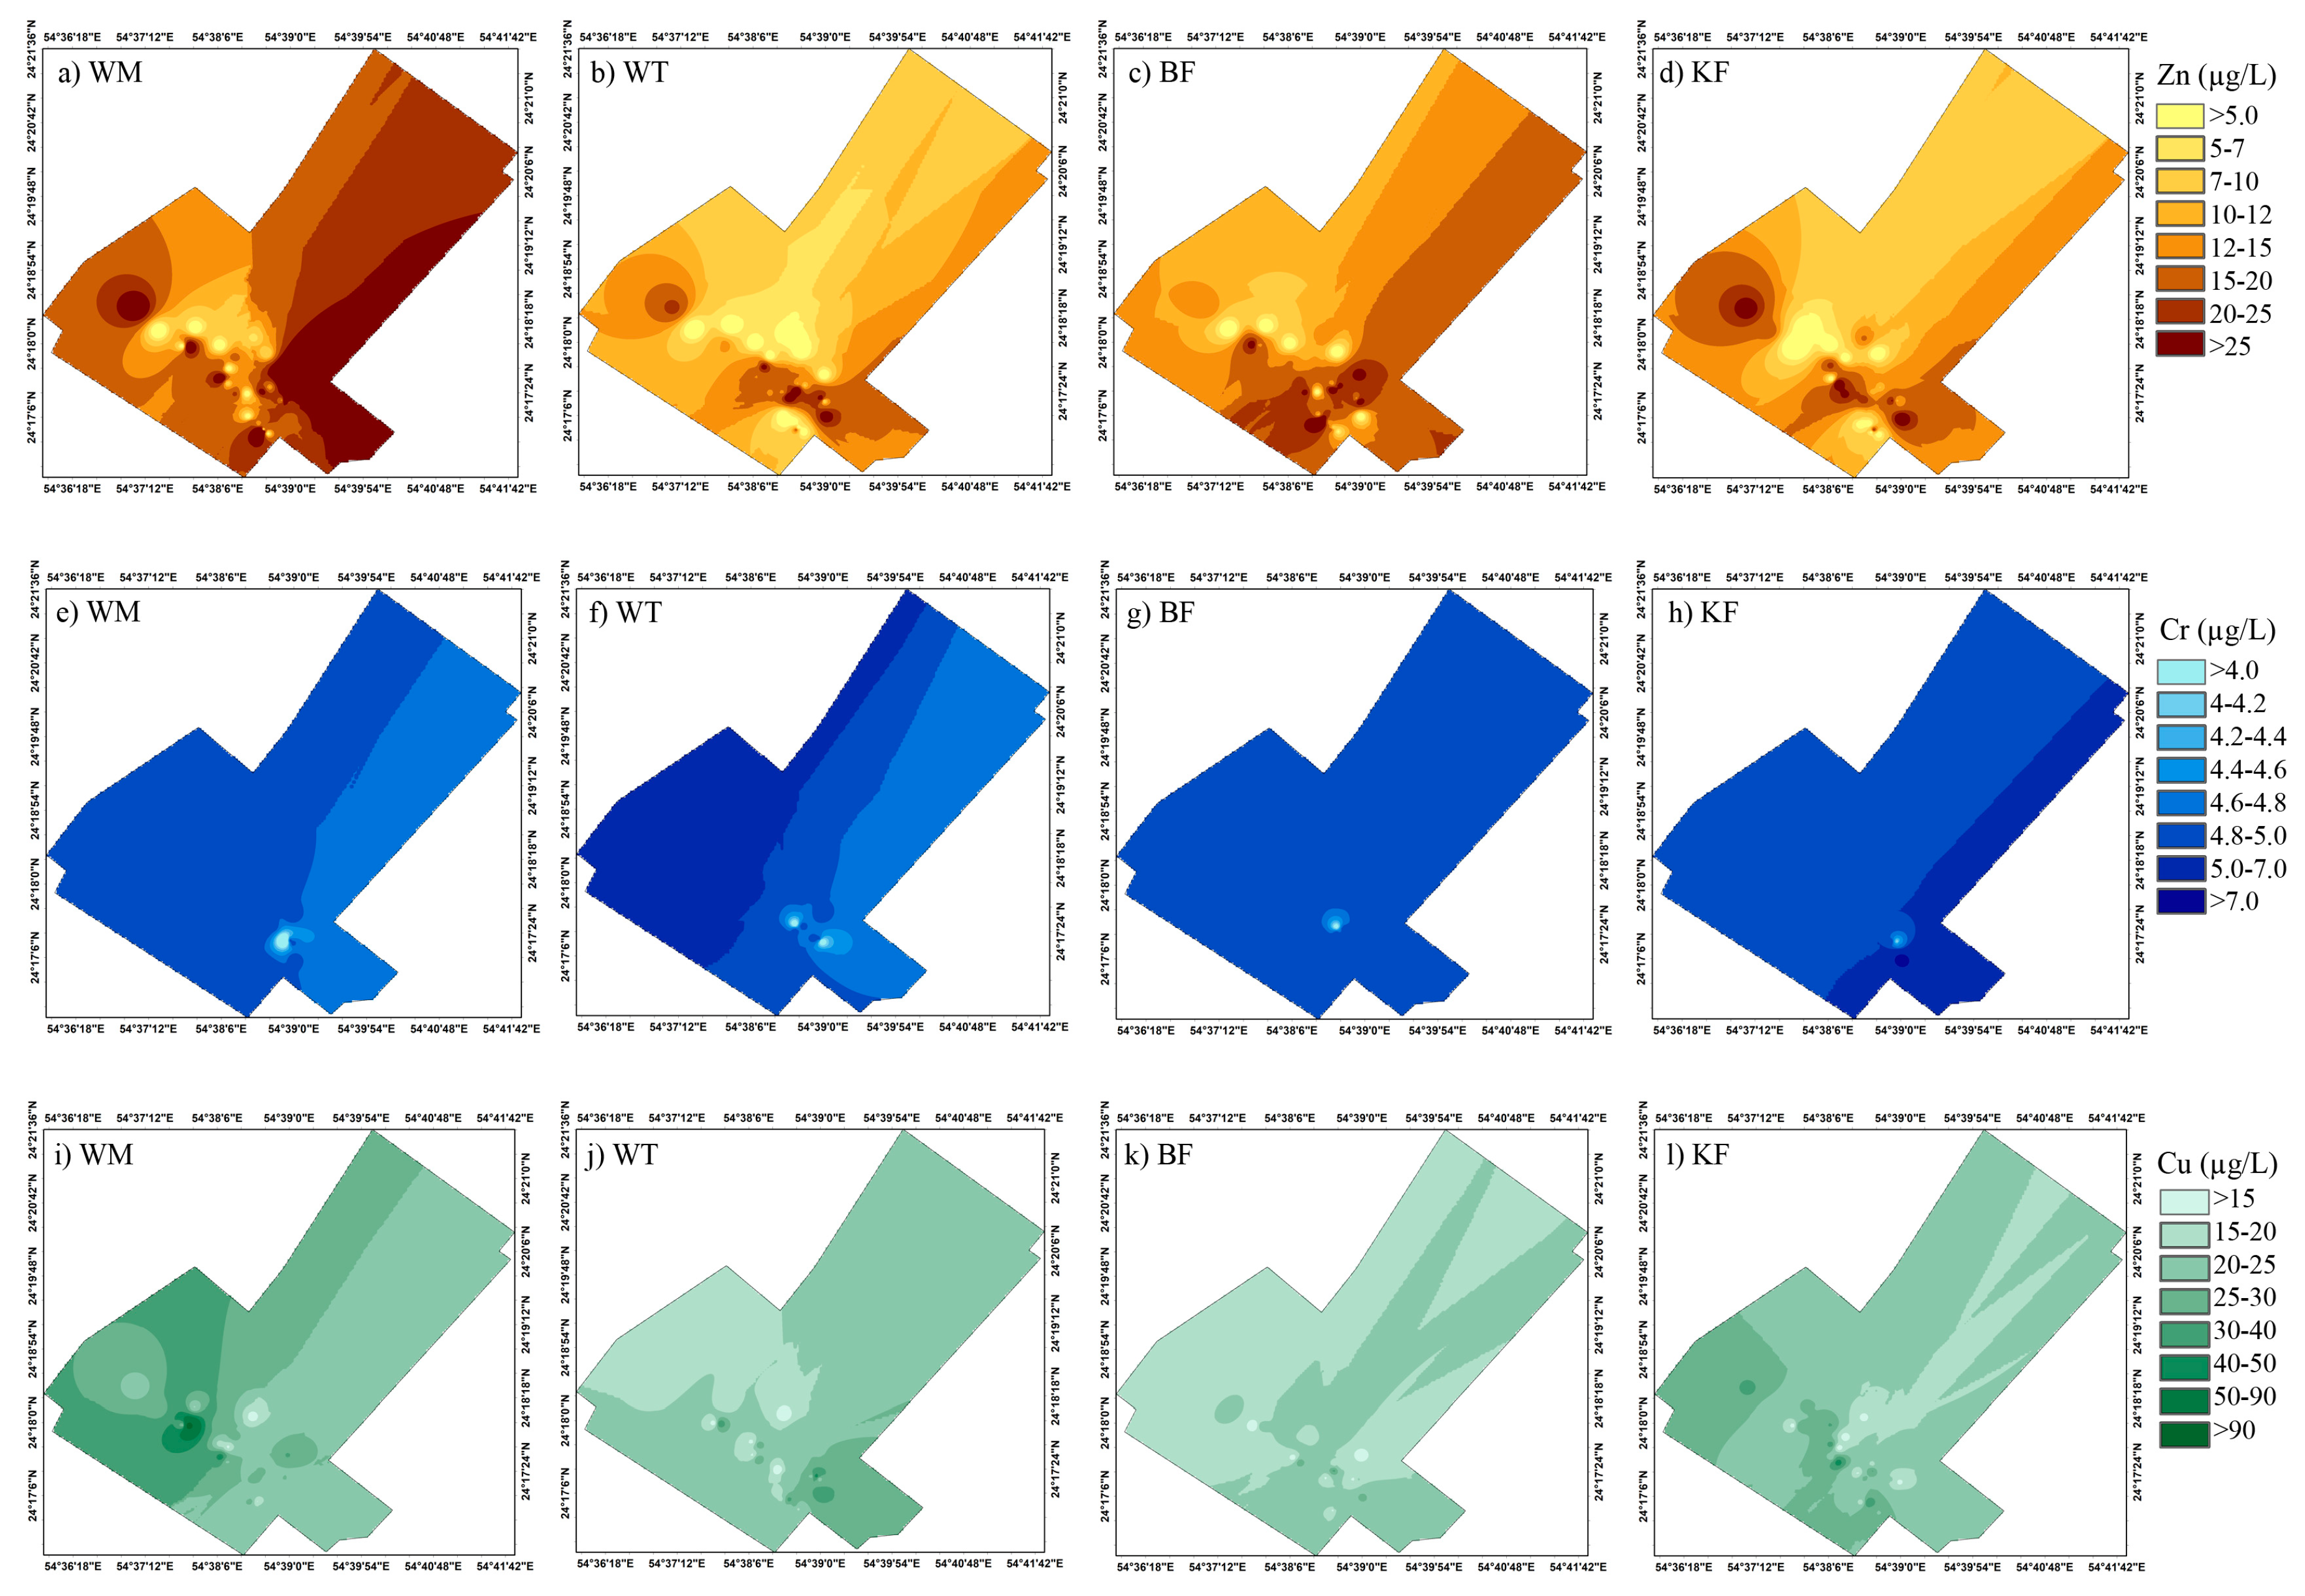
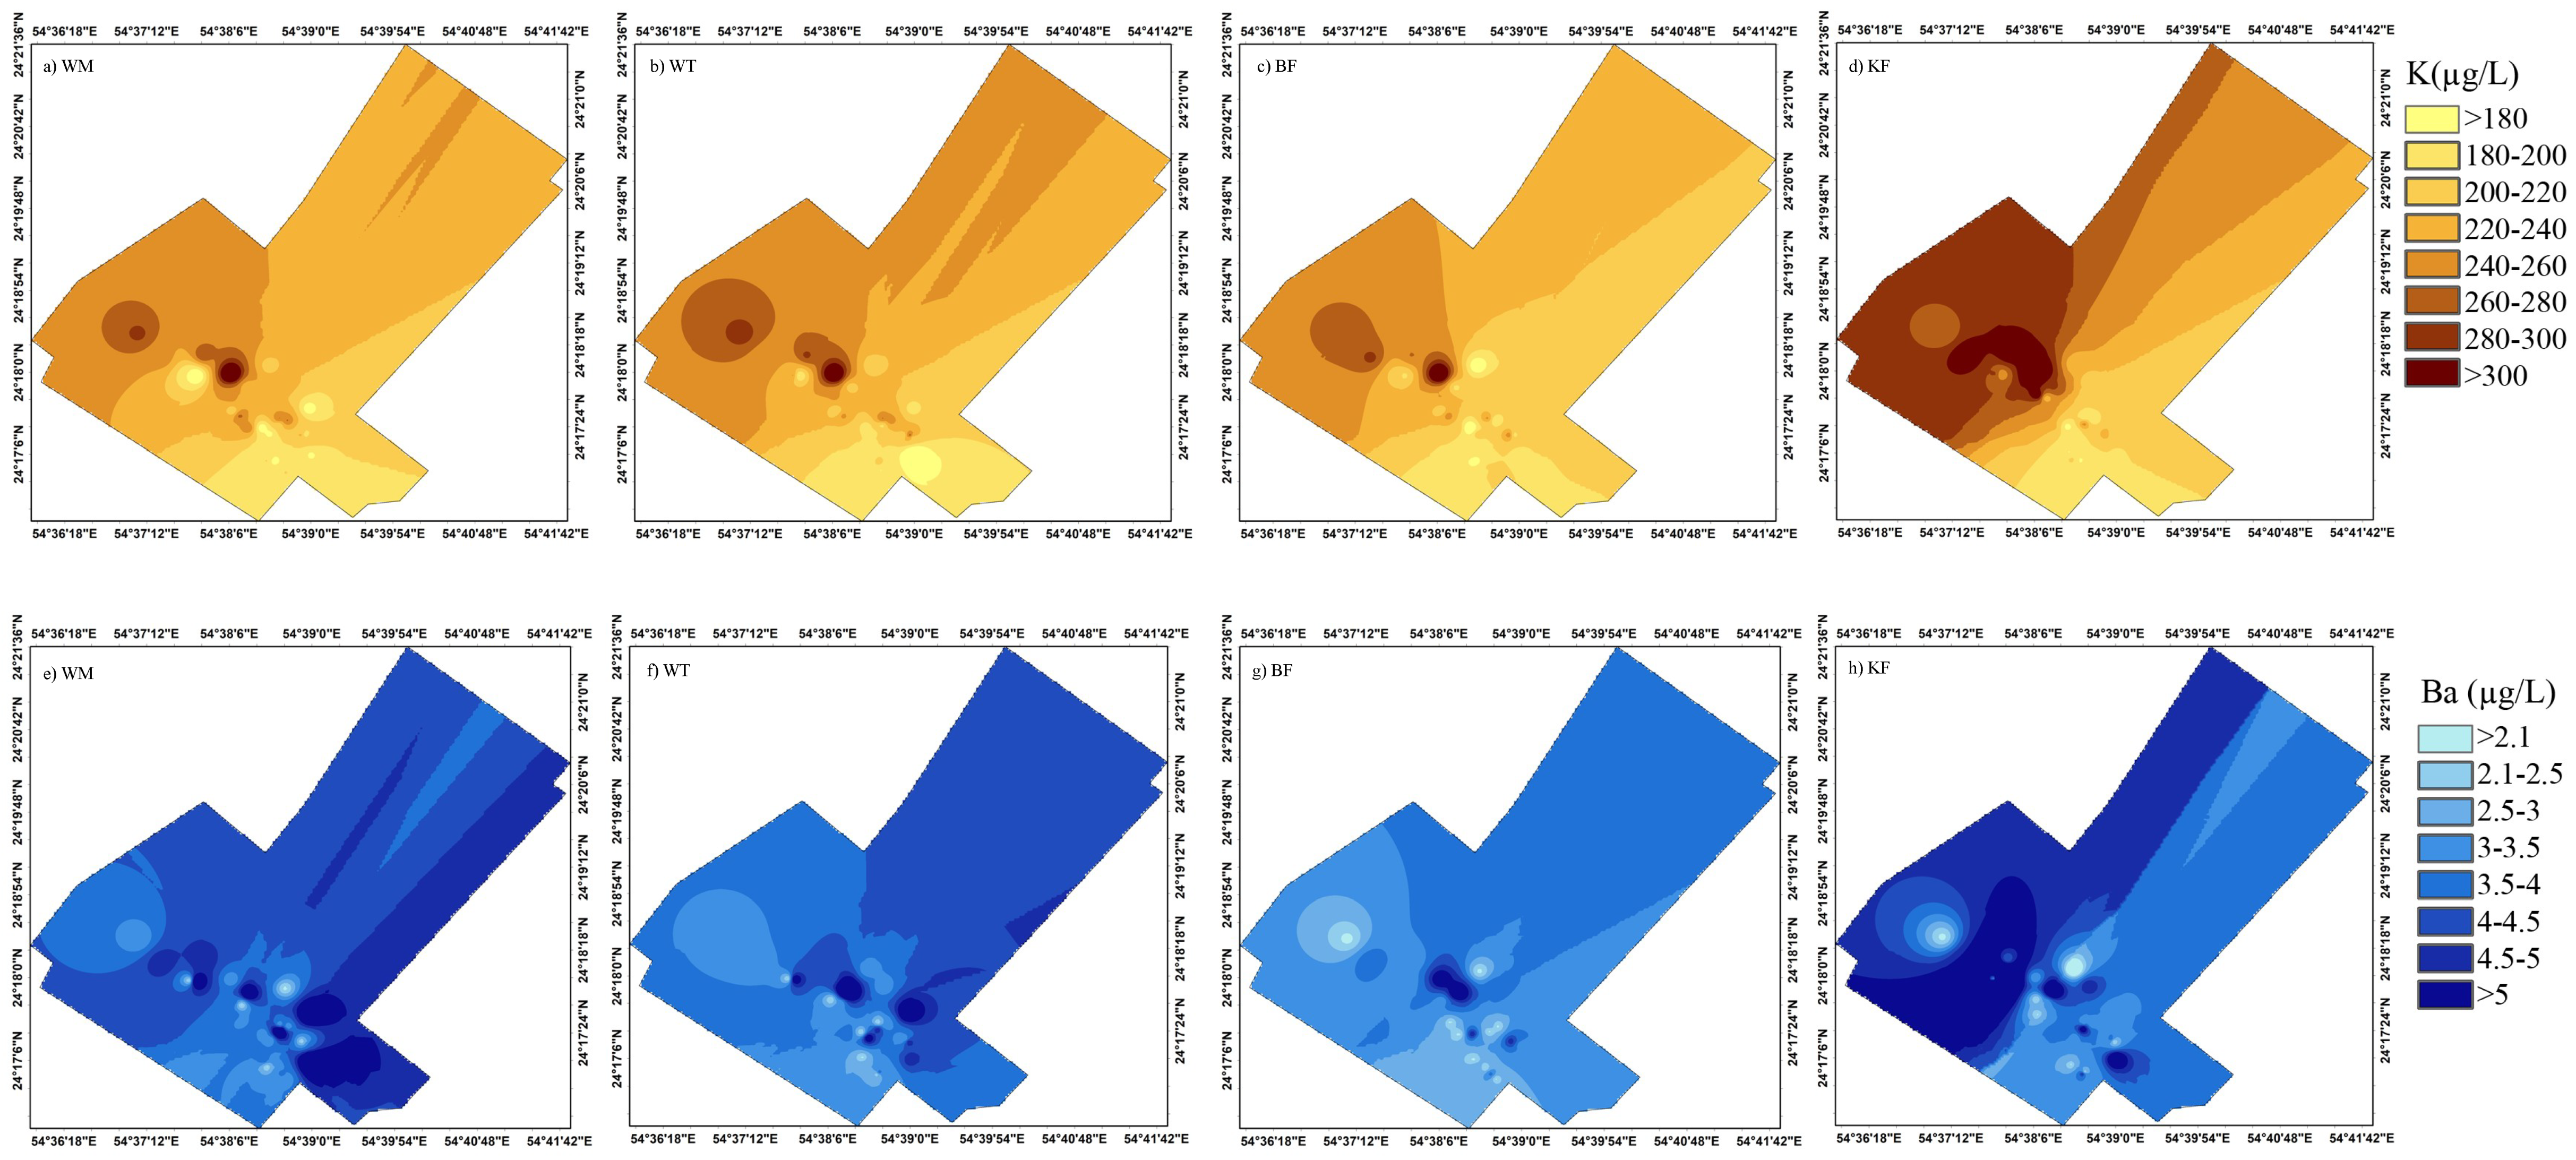
2.4.1. Spatial Analysis
2.4.2. Multivariate Statistical Analysis
2.4.3. Health Risk Assessment
- Risk category 1: Negligible risk, where the HI or HQ are <0.1
- Risk category 2: Low risk, where the HI or HQ are ≥0.1 but <1.0
- Risk category 3: Moderate risk, where the HI or HQ are ≥1.0 but <4.0
- Risk category 4: High risk, where the HI or HQ are ≥4.0
3. Results
3.1. Spatial Variation Analysis
3.2. Descriptive Statistics
3.3. Principal Component Analysis
3.4. Cluster Analysis
3.5. Health Risk Assessment
4. Discussion
4.1. Limitations of This Study
4.2. Recommendations for Managing Contaminants in Drinking Water
5. Conclusions
Author Contributions
Funding
Acknowledgments
Conflicts of Interest
Appendix A
A.1. Physico-Chemical Parameters

| Phase-1 | ||||||||
| pH | Tem | EC | TDS | Turbidity | BOD | Cl− | SO42− | |
| pH | 1.00 | |||||||
| Tem | 0.38 | 1.00 | ||||||
| EC | −0.12 | 0.09 | 1.00 | |||||
| TDS | −0.29 | −0.33 | 0.90 | 1.00 | ||||
| Turbidity | −0.19 | −0.09 | −0.04 | 0.00 | 1.00 | |||
| BOD | −0.31 | −0.14 | −0.03 | 0.06 | 0.11 | 1.00 | ||
| Cl− | −0.30 | −0.05 | 0.67 | 0.64 | 0.02 | 0.08 | 1.00 | |
| SO42− | −0.24 | −0.04 | 0.51 | 0.49 | 0.16 | −0.04 | 0.83 | 1.00 |
| Phase-2 | ||||||||
| pH | Tem | EC | TDS | Turbidity | BOD | Cl− | SO42− | |
| pH | 1.00 | |||||||
| Tem | 0.10 | 1.00 | ||||||
| EC | −0.22 | 0.24 | 1.00 | |||||
| TDS | 0.13 | −0.21 | −0.09 | 1.00 | ||||
| Turbidity | 0.39 | −0.10 | −0.07 | 0.004 | 1.00 | |||
| BOD | 0.24 | 0.04 | −0.05 | 0.05 | 0.08 | 1.00 | ||
| Cl− | −0.14 | 0.06 | 0.08 | −0.45 | 0.02 | −0.18 | 1.00 | |
| SO42− | −0.13 | 0.04 | 0.14 | −0.35 | 0.04 | −0.11 | 0.93 | 1.00 |
A.2. Heavy Metals
| Phase-1 | ||||||
| Ar | Cd | Pb | Cr | Cu | Zn | |
| Ar | 1.00 | |||||
| Cd | −0.16 | 1.00 | ||||
| Pb | −0.05 | −0.21 | 1.00 | |||
| Cr | 0.03 | 0.38 | 0.09 | 1.00 | ||
| Cu | −0.19 | 0.78 | −0.14 | 0.47 | 1.00 | |
| Zn | 0.04 | −0.18 | 0.25 | −0.11 | −0.04 | 1.00 |
| Phase-2 | ||||||
| Ar | Cd | Pb | Cr | Cu | Zn | |
| Ar | 1.00 | |||||
| Cd | −0.08 | 1.00 | ||||
| Pb | 0.15 | 0.04 | 1.00 | |||
| Cr | 0.12 | 0.45 | −0.02 | 1.00 | ||
| Cu | −0.20 | 0.38 | −0.14 | 0.05 | 1.00 | |
| Zn | −0.19 | −0.14 | 0.08 | 0.06 | 0.07 | 1.00 |
Appendix B


References
- Jalba, D.I.; Cromar, N.J.; Pollard, S.J.T.; Charrois, J.W.; Bradshaw, R.; Hrudey, S.E. Effective drinking water collaborations are not accidental: Interagency relationships in the international water utility sector. Sci. Total Environ. 2014, 470–471, 934–944. [Google Scholar] [CrossRef] [PubMed]
- Gorchev, H.G.; Ozolins, G. WHO guidelines for drinking-water quality. WHO Chron. 2011, 38, 104–108. [Google Scholar] [CrossRef]
- Khanal, N.; Buchberger, S.G.; Mckenna, S.A.; Clark, R.M.; Grayman, W.M. Vulnerability assessment of water distribution system to chemical intrusions. In Proceedings of the World Water and Environmental Resources Congress, Anchorage, Alaska, 15–19 May 2005; Volume 56. [Google Scholar]
- Regulation and Supervision Bureau (RSB). The Water Quality Regulations, 4th ed.; The Regulation and Supervision Bureau for the Water, Wastewater and Electricity Sector in the Emirate of Abu Dhabi; RSB: Abu Dhabi, UAE, 2014. [Google Scholar]
- Deng, Y.; Jiang, W.; Sadiq, R. Modeling contaminant intrusion in water distribution networks: A new similarity-based DST method. Expert Syst. Appl. 2011, 38, 571–578. [Google Scholar] [CrossRef]
- Cartier, C.; Nour, S.; Richer, B.; Deshommes, E.; Prévost, M. Impact of water treatment on the contribution of faucets to dissolved and particulate lead release at the tap. Water Res. 2012, 46, 5205–5216. [Google Scholar] [CrossRef] [PubMed]
- Deshommes, E.; Andrews, R.C.; Gagnon, G.; McCluskey, T.; McIlwain, B.; Doré, E.; Nour, S.; Prévost, M. Evaluation of exposure to lead from drinking water in large buildings. Water Res. 2016, 99, 46–55. [Google Scholar] [CrossRef] [PubMed]
- Scheili, A.; Rodriguez, M.J.; Sadiq, R. Impact of human operational factors on drinking water quality in small systems: An exploratory analysis. J. Clean. Prod. 2016, 133, 681–690. [Google Scholar] [CrossRef]
- Wongsasuluk, P.; Chotpantarat, S.; Siriwong, W.; Robson, M. Heavy metal contamination and human health risk assessment in drinking water from shallow groundwater wells in an agriculture area in Ubon Ratchathani province, Thailand. Environ. Geochem. Health 2013, 2014, 169–182. [Google Scholar] [CrossRef]
- Diao, K.; Sweetapple, C.; Farmani, R.; Fu, G.; Ward, S.; Butler, D. Global resilience analysis of water distribution systems. Water Res. 2016, 106, 383–393. [Google Scholar] [CrossRef] [PubMed]
- Housh, M.; Ostfeld, A. An integrated logit model for contamination event detection in water distribution systems. Water Res. 2015, 75, 210–223. [Google Scholar] [CrossRef] [PubMed]
- Liu, S.; Li, R.; Smith, K.; Che, H. Why conventional detection methods fail in identifying the existence of contamination events. Water Res. 2016, 93, 222–229. [Google Scholar] [CrossRef] [PubMed]
- Wu, J.; Man, Y.; Sun, G.; Shang, L. Occurrence and health-risk assessment of trace metals in raw and boiled drinkingwater from rural areas of China. Water (Switzerland) 2018, 10, 641. [Google Scholar] [CrossRef]
- Dzulfakar, M.A.; Shaharuddin, M.S.; Muhaimin, A.A.; Syazwan, A.I. Risk assessment of aluminum in drinking water between two residential areas. Water (Switzerland) 2011, 3, 882–893. [Google Scholar] [CrossRef]
- Deshommes, E.; Laroche, L.; Nour, S.; Cartier, C.; Prévost, M. Source and occurrence of particulate lead in tap water. Water Res. 2010, 44, 3734–3744. [Google Scholar] [CrossRef] [PubMed]
- Liu, B.; Reckhow, D.A. Disparity in disinfection byproducts concentration between hot and cold tap water. Water Res. 2015, 70, 196–204. [Google Scholar] [CrossRef] [PubMed]
- Murad, A.A.; Nuaimi, H.; Hammadi, M. Comprehensive assessment of water resources in the United Arab Emirates (UAE). Water Resour. Manag. 2007, 21, 1449–1463. [Google Scholar] [CrossRef]
- Bi, H.; Burstein, G.T.; Rodriguez, B.B.; Kawaley, G. Some aspects of the role of inhibitors in the corrosion of copper in tap water as observed by cyclic voltammetry. Corros. Sci. 2016, 102, 510–516. [Google Scholar] [CrossRef]
- Wang, J.; Liu, G.; Liu, H.; Lam, P.K.S. Multivariate statistical evaluation of dissolved trace elements and a water quality assessment in the middle reaches of Huaihe River, Anhui, China. Sci. Total Environ. 2017, 583, 421–431. [Google Scholar] [CrossRef] [PubMed]
- Facchinelli, A.; Sacchi, E.; Mallen, L. Multivariate statistical and GIS-based approach to identify heavy metal sources in soils. Environ. Pollut. 2001, 114, 313–324. [Google Scholar] [CrossRef]
- Mustonen, S.M.; Tissari, S.; Huikko, L.; Kolehmainen, M.; Lehtola, M.J.; Hirvonen, A. Evaluating online data of water quality changes in a pilot drinking water distribution system with multivariate data exploration methods. Water Res. 2008, 42, 2421–2430. [Google Scholar] [CrossRef] [PubMed]
- Shrestha, S.; Kazama, F. Assessment of surface water quality using multivariate statistical techniques: A case study of the Fuji river basin, Japan. Environ. Model. Softw. 2007, 22, 464–475. [Google Scholar] [CrossRef]
- Vialle, C.; Sablayrolles, C.; Lovera, M.; Jacob, S.; Huau, M.C.; Montrejaud-Vignoles, M. Monitoring of water quality from roof runoff: Interpretation using multivariate analysis. Water Res. 2011, 45, 3765–3775. [Google Scholar] [CrossRef] [PubMed]
- American Public Health Association (APHA). Standard Methods for Examination of Water and Wastewater, 21st ed.; APHA: Washington, DC, USA, 2005. [Google Scholar]
- American Public Health Association (APHA). Standard Methods for Examination of Water and Wastewater, 20th ed.; APHA: Washington, DC, USA, 1998; pp. 5–16. ISBN 9780875532356. [Google Scholar]
- Simeonov, V.; Stratis, J.; Samara, C.; Zachariadis, G.; Voutsa, D.; Anthemidis, A.; Sofoniou, M.; Kouimtzis, T. Assessment of the surface water quality in Northern Greece. Water Res. 2003, 37, 4119–4124. [Google Scholar] [CrossRef]
- Muhammad, S.; Shah, M.T.; Khan, S. Health risk assessment of heavy metals and their source apportionment in drinking water of Kohistan region, northern Pakistan. Microchem. J. 2011, 98, 334–343. [Google Scholar] [CrossRef]
- Olsen, R.L.; Chappell, R.W.; Loftis, J.C. Water quality sample collection, data treatment and results presentation for principal components analysis—Literature review and Illinois River watershed case study. Water Res. 2012, 46, 3110–3122. [Google Scholar] [CrossRef] [PubMed]
- Brahman, K.D.; Kazi, T.G.; Afridi, H.I.; Naseem, S.; Arain, S.S.; Ullah, N. Evaluation of high levels of fluoride, arsenic species and other physicochemical parameters in underground water of two sub districts of Tharparkar, Pakistan: A multivariate study. Water Res. 2013, 47, 1005–1020. [Google Scholar] [CrossRef] [PubMed]
- Singh, K.P.; Malik, A.; Mohan, D.; Sinha, S. Multivariate statistical techniques for the evaluation of spatial and temporal variations in water quality of Gomti River (India)—A case study. Water Res. 2004, 38, 3980–3992. [Google Scholar] [CrossRef] [PubMed]
- Bortey-Sam, N.; Nakayama, S.M.M.; Ikenaka, Y.; Akoto, O.; Baidoo, E.; Mizukawa, H.; Ishizuka, M. Health risk assessment of heavy metals and metalloid in drinking water from communities near gold mines in Tarkwa, Ghana. Environ. Monit. Assess. 2015, 187, 1–12. [Google Scholar] [CrossRef] [PubMed]
- Gul, N.; Shah, M.T.; Khan, S.; Khattak, N.U.; Muhammad, S. Arsenic and heavy metals contamination, risk assessment and their source in drinking water of the Mardan District, Khyber Pakhtunkhwa, Pakistan. J. Water Health 2015, 13, 1073–1084. [Google Scholar] [CrossRef] [PubMed]
- United States Environmental Protection Agency (USEPA). National Primary/Secondary and Drinking Water Regulations; USEPA: Washington, DC, USA, 2009.
- Meng, Q.; Zhang, J.; Zhang, Z.; Wu, T. Geochemistry of dissolved trace elements and heavy metals in the Dan River Drainage (China): Distribution, sources, and water quality assessment. Environ. Sci. Pollut. Res. 2016, 23, 8091–8103. [Google Scholar] [CrossRef] [PubMed]
- Kapur, V. UAE in World’s Top 5 “Heaviest” Nations—Emirates 24|7. Available online: http://www.emirates247.com/news/emirates/uae-in-world-s-top-5-heaviest-nations-2012-07-04-1.465700 (accessed on 1 February 2018).
- Xiao, J.; Jin, Z.; Wang, J. Geochemistry of trace elements and water quality assessment of natural water within the Tarim River Basin in the extreme arid region, NW China. J. Geochem. Explor. 2014, 136, 118–126. [Google Scholar] [CrossRef]
- Fewtrell, L.; Fuge, R.; Kay, D. An estimation of the global burden of disease due to skin lesions caused by arsenic in drinking water. J. Water Health 2005, 3, 101–107. [Google Scholar] [CrossRef] [PubMed]
- Herath, H.M.A.S.; Kawakami, T.; Nagasawa, S.; Serikawa, Y.; Motoyama, A.; Chaminda, G.G.T.; Weragoda, S.K.; Yatigammana, S.K.; Amarasooriya, A.a.G.D. Arsenic, cadmium, lead, and chromium in well water, rice, and human urine in Sri Lanka in relation to chronic kidney disease of unknown etiology. J. Water Health 2018, wh2018070. [Google Scholar] [CrossRef] [PubMed]
- Patrick, L. Lead toxicity, a review of the literature. Part I: Exposure, evaluation, and treatment. Altern. Med. Rev. 2006, 11, 2–22. [Google Scholar] [PubMed]
- Pieper, K.J.; Krometis, L.A.H.; Gallagher, D.L.; Benham, B.L.; Edwards, M. Incidence of waterborne lead in private drinking water systems in Virginia. J. Water Health 2015, 13, 897–908. [Google Scholar] [CrossRef] [PubMed]
- Harvey, P.J.; Handley, H.K.; Taylor, M.P. Widespread copper and lead contamination of household drinking water, New South Wales, Australia. Environ. Res. 2016, 151, 275–285. [Google Scholar] [CrossRef] [PubMed]
- Siddiqui, K. Heuristics for sample size determination in multivariate statistical techniques. World Appl. Sci. J. 2013, 27, 285–287. [Google Scholar] [CrossRef]
- National Health. Health Guidance Statement Lead in Drinking Water from Some Plumbing Products. Available online: http://www.health.gov.au/internet/main/publishing.nsf/content/A12B57E41EC9F326CA257BF0001F9E7D/$File/Lead-plumbing-products-Guidance-Statement-July2018.pdf (accessed on 7 November 2018).
- Minnesota Department of Health. Important Information on How to Protect Your Health: Let It Run… and Get the Lead Out! Available online: http://www.health.state.mn.us/divs/eh/water/factsheet/com/letitrunenglish.pdf (accessed on 7 November 2018).
- Ng, D.Q.; Lin, Y.P. Evaluation of lead release in a simulated lead-free premise plumbing system using a sequential sampling approach. Int. J. Environ. Res. Public Health 2016, 13. [Google Scholar] [CrossRef] [PubMed]


| Parameter | Unit | UAE Standard | Phase-1 | Phase-2 | ||||||||||
|---|---|---|---|---|---|---|---|---|---|---|---|---|---|---|
| Min | Max | Median | Mean | SD | CV (%) | Min | Max | Median | Mean | SD | CV (%) | |||
| pH | pH | 7.0–9.2 | 6.33 | 7.37 | 7.02 | 6.92 | 0.36 | 5.2 | 6.15 | 8.25 | 7.27 | 7.32 | 0.45 | 6.15 |
| Tem | °C | 20.61 | 29.79 | 25.66 | 25.27 | 2.55 | 10.09 | 22 | 55.15 | 38.38 | 39.23 | 8.28 | 21.11 | |
| EC | µS/cm | 250 | 104.5 | 165.5 | 133.75 | 135.03 | 13.87 | 10.27 | 95.5 | 239 | 164.25 | 164.92 | 33.57 | 20.36 |
| TDS | mg/L | 100–1000 | 51.75 | 82 | 70 | 68.02 | 6.86 | 10.09 | 45 | 172 | 95 | 104.11 | 34.23 | 32.88 |
| Turbidity | FNU | 4 | 0.2 | 1.65 | 0.39 | 0.55 | 0.35 | 63.64 | 0.25 | 1.95 | 1 | 1.04 | 0.46 | 44.23 |
| BOD | mg/l | 0 to 4 | 0.05 | 2.93 | 1.6 | 1.43 | 0.79 | 55.24 | 0.5 | 4.35 | 2.53 | 2.48 | 1.06 | 42.74 |
| Cl− | mg/L | 250 | 7.99 | 17.26 | 12.86 | 12.9 | 2.43 | 18.84 | 7.45 | 16.91 | 10.14 | 10.8 | 2.65 | 24.54 |
| SO42− | mg/L | 250 | 0.75 | 1.85 | 1.2 | 1.23 | 0.27 | 21.95 | 0.74 | 1.66 | 0.96 | 1.04 | 0.27 | 25.96 |
| Ca2+ | mg/L | 200 | 22.02 | 31.5 | 24.29 | 24.29 | 0.99 | 4.08 | 21.94 | 27.2 | 24.43 | 24.64 | 1.33 | 5.4 |
| Na+ | mg/L | 150 | 5.39 | 10.83 | 7.79 | 7.69 | 1.19 | 15.47 | 6.73 | 11.68 | 8.66 | 8.7 | 1.3 | 14.94 |
| K+ | mg/L | 12 | 0.02 | 0.52 | 0.23 | 0.24 | 0.08 | 33.33 | 0.11 | 0.31 | 0.19 | 0.2 | 0.05 | 25 |
| Mg2+ | mg/L | 30 | 0.77 | 1.9 | 1.07 | 1.09 | 0.19 | 17.43 | 0.63 | 1.95 | 0.84 | 0.93 | 0.24 | 25.81 |
| Ba2+ | µg/L | 700 | 1 | 40 | 4 | 4 | 4 | 100 | 1 | 16 | 2 | 3 | 3 | 100 |
| As | µg/L | 10 | 9 | 80 | 9 | 10.78 | 9.94 | 92.21 | 8.9 | 95.04 | 9 | 14.72 | 17.25 | 117.19 |
| Cd | µg/L | 3 | 1 | 11.54 | 1 | 2.16 | 1.75 | 81.02 | 1 | 15.4 | 1 | 1.73 | 2.04 | 117.92 |
| Pb | µg/L | 10 | 11 | 81.78 | 12 | 13.85 | 9.65 | 69.68 | 11 | 76.28 | 11 | 25.09 | 19.73 | 78.64 |
| Cr | µg/L | 50 | 2 | 6.41 | 5 | 4.99 | 0.3 | 6.01 | 1.5 | 12.22 | 5 | 4.93 | 0.9 | 18.26 |
| Cu | µg/L | 1000 | 10 | 210 | 20 | 20 | 20 | 100 | 0 | 90 | 20 | 20 | 10 | 50 |
| Zn | µg/L | 5000 | 1 | 173.57 | 1 | 16.11 | 23.21 | 144.07 | 1 | 205.1 | 1 | 14.29 | 25.67 | 179.64 |
| Phase-1 | Phase-2 | ||||||||
|---|---|---|---|---|---|---|---|---|---|
| Eigenvalue | 6.4361 | 3.0249 | 2.4226 | 1.5344 | 5.1403 | 2.801 | 2.1032 | 1.8423 | 1.4692 |
| Proportion | 0.339 | 0.159 | 0.128 | 0.081 | 0.271 | 0.147 | 0.111 | 0.097 | 0.077 |
| Cumulative | 34% | 50% | 63% | 71% | 27% | 42% | 53% | 63% | 70% |
| Variable | PC1 | PC2 | PC3 | PC4 | PC1 | PC2 | PC3 | PC4 | PC5 |
| pH | −0.15 | −0.12 | −0.51 | 0.03 | −0.07 | 0.14 | −0.02 | −0.54 | −0.12 |
| Tem | −0.02 | −0.14 | −0.27 | −0.62 | 0.09 | 0.45 | −0.26 | −0.06 | −0.03 |
| EC | 0.31 | −0.06 | −0.08 | −0.04 | 0.07 | 0.19 | 0.06 | 0.32 | −0.48 |
| TDS | 0.29 | 0.01 | 0.06 | 0.22 | −0.25 | −0.21 | −0.22 | −0.10 | −0.12 |
| Turbidity | −0.03 | −0.35 | 0.35 | 0.05 | −0.02 | −0.08 | 0.18 | −0.44 | −0.33 |
| BOD | 0.00 | −0.11 | 0.33 | 0.09 | −0.07 | 0.13 | 0.06 | −0.21 | −0.28 |
| Cl− | 0.37 | −0.11 | 0.00 | 0.02 | 0.42 | −0.08 | 0.01 | −0.04 | 0.02 |
| SO42− | 0.32 | −0.16 | 0.00 | 0.03 | 0.38 | −0.07 | 0.00 | 0.01 | −0.09 |
| Ca2+ | −0.32 | 0.01 | −0.01 | 0.27 | −0.36 | 0.21 | −0.06 | 0.03 | 0.09 |
| Na+ | 0.34 | −0.18 | −0.18 | 0.07 | 0.41 | −0.09 | 0.01 | −0.12 | 0.08 |
| K+ | 0.28 | −0.19 | −0.24 | 0.09 | 0.41 | 0.05 | −0.05 | −0.14 | 0.14 |
| Mg2+ | 0.35 | −0.16 | −0.07 | −0.04 | 0.32 | 0.35 | −0.11 | 0.00 | 0.03 |
| Ba2+ | −0.16 | −0.45 | 0.19 | 0.03 | 0.00 | 0.39 | 0.34 | 0.00 | 0.05 |
| As | 0.15 | −0.05 | 0.27 | 0.15 | −0.03 | 0.26 | −0.25 | −0.20 | 0.29 |
| Cd | −0.16 | −0.44 | −0.07 | 0.21 | −0.08 | 0.11 | 0.57 | −0.05 | 0.20 |
| Pb | 0.02 | 0.11 | 0.30 | −0.31 | −0.08 | 0.35 | −0.14 | 0.25 | 0.29 |
| Cr | −0.14 | −0.24 | −0.12 | −0.31 | 0.00 | 0.30 | 0.34 | −0.16 | −0.12 |
| Cu | −0.19 | −0.48 | −0.02 | −0.01 | 0.03 | −0.19 | 0.42 | 0.13 | 0.34 |
| Zn | 0.10 | −0.09 | 0.34 | −0.45 | 0.09 | 0.11 | 0.10 | 0.41 | −0.41 |
| Cwt (µg) | RfD (µg/kg/day) | HQ | |||
|---|---|---|---|---|---|
| Adult | Children | ||||
| As | Max. | 95.04 | 3.00 × 10⁻¹ | 8.34 | 10.6 |
| Avg. | 12.75 | 3.00 × 10⁻¹ | 1.12 | 1.42 | |
| Min. | 8.9 | 3.00 × 10⁻¹ | 0.78 | 0.99 | |
| Cd | Max. | 15.4 | 5.00 × 10⁻¹ | 0.81 | 1.03 |
| Avg. | 1.95 | 5.00 × 10⁻¹ | 0.102 | 0.13 | |
| Min. | 1 | 5.00 × 10⁻¹ | 0.052 | 0.066 | |
| Pb | Max. | 81.78 | 3.50 × 10⁻¹ | 6.15 | 7.79 |
| Avg. | 19.47 | 3.50 × 10⁻¹ | 1.46 | 1.85 | |
| Min. | 11 | 3.50 × 10⁻¹ | 0.826 | 1.05 | |
| Cr | Max. | 12.22 | 3.00 | 0.107 | 0.136 |
| Avg. | 4.96 | 3.00 | 0.0437 | 0.055 | |
| Min. | 1.5 | 3.00 | 0.013 | 0.0167 | |
| Cu | Max. | 206 | 4.00 × 10 | 0.136 | 0.172 |
| Avg. | 23.21 | 4.00 × 10 | 0.0153 | 0.0194 | |
| Min. | 2 | 4.00 × 10 | 0.0013 | 0.0017 | |
| Zn | Max. | 205.1 | 3.00 × 10² | 0.0180 | 0.0228 |
| Avg. | 15.2 | 3.00 × 10² | 0.0013 | 0.0017 | |
| Min. | 1 | 3.00 × 10² | 0.0001 | 0.0001 | |
| Location | Adult | Children | ||||
|---|---|---|---|---|---|---|
| Max | Mean | Min | Max | Mean | Min | |
| House-1 | 5.1 | 2.23 | 1.71 | 6.46 | 2.83 | 2.17 |
| House-2 | 7.14 | 2.66 | 1.68 | 9.05 | 3.37 | 2.13 |
| House-3 | 7.21 | 2.46 | 1.69 | 9.13 | 3.11 | 2.14 |
| House-4 | 3.78 | 2.11 | 1.68 | 4.79 | 2.67 | 2.13 |
| House-5 | 9.92 | 3.42 | 1.68 | 12.57 | 4.32 | 2.14 |
| House-6 | 8.35 | 3.05 | 1.71 | 10.58 | 3.86 | 2.17 |
| House-7 | 3.69 | 2.15 | 1.71 | 4.68 | 2.72 | 2.17 |
| House-8 | 5.56 | 2.2 | 1.7 | 7.04 | 2.79 | 2.16 |
| House-9 | 4.94 | 2.36 | 1.71 | 6.25 | 2.99 | 2.18 |
| House-10 | 3.51 | 1.95 | 1.71 | 4.45 | 2.47 | 2.16 |
| House-11 | 2.79 | 1.86 | 1.71 | 3.54 | 2.35 | 2.17 |
| House-12 | 4.43 | 2.08 | 1.71 | 5.62 | 2.63 | 2.17 |
| House-13 | 6.15 | 2.28 | 1.71 | 7.79 | 2.89 | 2.16 |
| House-14 | 4.8 | 2.15 | 1.7 | 6.08 | 2.72 | 2.16 |
| House-15 | 9.28 | 2.68 | 1.71 | 11.76 | 3.4 | 2.16 |
| House-16 | 7.27 | 3.51 | 1.71 | 9.2 | 4.44 | 2.18 |
| House-17 | 5.7 | 2.72 | 1.71 | 7.22 | 3.44 | 2.17 |
| House-18 | 11.08 | 3.48 | 1.71 | 14.03 | 4.4 | 2.18 |
| House-19 | 9.89 | 3.35 | 1.7 | 12.52 | 4.24 | 2.16 |
| House-20 | 10.08 | 3.34 | 1.71 | 12.77 | 4.23 | 2.17 |
| House-21 | 5.99 | 2.58 | 1.7 | 7.59 | 3.28 | 2.16 |
| House-22 | 7.77 | 3.03 | 1.72 | 9.84 | 3.84 | 2.18 |
| House-23 | 9.3 | 3.45 | 1.71 | 11.78 | 4.37 | 2.17 |
| House-24 | 6.25 | 2.92 | 1.71 | 7.92 | 3.7 | 2.17 |
| House-25 | 13.65 | 4.5 | 1.73 | 17.29 | 5.7 | 2.19 |
| House-26 | 5.77 | 2.55 | 1.72 | 7.31 | 3.23 | 2.19 |
| House-27 | 3.04 | 2.06 | 1.72 | 3.85 | 2.61 | 2.18 |
| House-28 | 6.57 | 3.24 | 1.72 | 8.32 | 4.1 | 2.18 |
| House-29 | 8.1 | 2.58 | 1.72 | 10.26 | 3.27 | 2.18 |
| House-30 | 11.74 | 3.41 | 1.72 | 14.87 | 4.33 | 2.18 |
© 2018 by the authors. Licensee MDPI, Basel, Switzerland. This article is an open access article distributed under the terms and conditions of the Creative Commons Attribution (CC BY) license (http://creativecommons.org/licenses/by/4.0/).
Share and Cite
Mahmoud, M.T.; Hamouda, M.A.; Al Kendi, R.R.; Mohamed, M.M. Health Risk Assessment of Household Drinking Water in a District in the UAE. Water 2018, 10, 1726. https://doi.org/10.3390/w10121726
Mahmoud MT, Hamouda MA, Al Kendi RR, Mohamed MM. Health Risk Assessment of Household Drinking Water in a District in the UAE. Water. 2018; 10(12):1726. https://doi.org/10.3390/w10121726
Chicago/Turabian StyleMahmoud, Mohammed T., Mohamed A. Hamouda, Ruwaya R. Al Kendi, and Mohamed M. Mohamed. 2018. "Health Risk Assessment of Household Drinking Water in a District in the UAE" Water 10, no. 12: 1726. https://doi.org/10.3390/w10121726
APA StyleMahmoud, M. T., Hamouda, M. A., Al Kendi, R. R., & Mohamed, M. M. (2018). Health Risk Assessment of Household Drinking Water in a District in the UAE. Water, 10(12), 1726. https://doi.org/10.3390/w10121726