Article

Impact of Long-Term Reclaimed Water Irrigation on Trace Elements Contents in Agricultural Soils in Beijing, China

1
State Key Laboratory of Simulation and Regulation of Water Cycle in River Basin, China Institute of Water Resources and Hydropower Research, Beijing 100038, China
2
Beijing Water Science & Technology Institute, Beijing 100048, China
*
Author to whom correspondence should be addressed.
Water 2018, 10(12), 1716; https://doi.org/10.3390/w10121716
Submission received: 29 October 2018 / Revised: 14 November 2018 / Accepted: 20 November 2018 / Published: 23 November 2018
(This article belongs to the Section Water Quality and Contamination)

Abstract

:
The rapid increase of reclaimed water irrigation on agricultural soils requires investigation of its impact on soil health. In this study, a simulation experiment for various lengths of long-term reclaimed water irrigation time (98, 196 and 236 years, respectively) was conducted in the southeast suburb of Beijing, China. Unirrigated soil served as the control. The environmental behavior of seven trace elements (As, Cd, Cr, Cu, Hg, Pb and Zn) at different soil depths in 0–600 cm profiles was analyzed. Results showed that the 0–30 and 200–300 cm soil layers were more likely to accumulate trace elements under long-term reclaimed water irrigation, although the accumulation in the 0–600 cm profiles was not particularly obvious. Correlation analysis showed that the trace element concentrations and distribution were significantly related to clay fraction and organic matters (OM), whereas they were not related to redox potential (Eh). The potential ecological risk assessment showed that the long-term reclaimed water irrigation did not result in a significantly increased ecological risk. However, Cd and Hg were identified as the metals with the highest potential ecological risk in the study area and the trace element contents in the top 0–30 cm soil layer should be carefully monitored. Future studies are required to clarify the environmental risks of trace elements under long-term reclaimed water irrigation as they might slowly accumulate in soil with time.

1. Introduction

Rapid economic development and sharp increases in population have greatly stimulated water consumption in industrial, agricultural and domestic use and aggravated the shortage of fresh water resources. The increase in water consumption has also exacerbated the volume of sewage discharge. The use of reclaimed water can not only reduce the volume of sewage discharge but also alleviate the pressure of demand for fresh water resources [1]. Wastewater has been recycled for use in agriculture for centuries in cities such as Berlin, London and Paris [2]. In China, treated municipal sewage has been used in urban areas and industry for nearly 30 years but large-scale use in agricultural irrigation is not common. On the one hand, use of reclaimed water for irrigation has been commonly adopted because of several advantages, such as increased utilization of water resources, alleviation of pressure on fresh water sources, nitrogen and phosphorus nutrient recovery to crops, fertilizer use reduction and decreased disposal costs [3,4,5]. On the other hand, unregulated irrigation using reclaimed water over many years might lead to the accumulation of toxic and harmful substances, such as heavy metals and metalloids, in the soil of irrigated areas, causing soil pollution and groundwater pollution and ultimately threaten human health through biological enrichment [6,7,8]. The potential health risks and environmental impacts resulting from reclaimed water use in agriculture have been of great concern around the world.
Municipal wastewater reclamation and reuse for agriculture have been practiced for several decades, experiencing the emerging stage (before 1985), the demonstration stage (1985–2000) and the developing stage (since 2000) [9,10,11]. Since 1957, China has used raw or primary-treated domestic wastewater for farmland irrigation. With the increase in irrigation area and amount of wastewater and reclaimed water being used, the problem of trace element pollution has received increasing attention [11]. According to the National Survey of Soil Pollution Bulletin released in 2014 [12], 39 of the 55 monitored wastewater irrigation districts have suffered different extents of soil pollution and the main pollutants included Cd and As. The increasingly serious environmental problems resulting from raw or primary-treated wastewater irrigation stimulated the development of improved wastewater treatment technology in China. Although the quality of reclaimed water has been greatly improved in recent years and the amount of trace elements applied to soil with reclaimed water irrigation is limited, the accumulation of environmental contaminants under long-term irrigation is still unknown. The impact of long-term reclaimed water irrigation on soil health is still a key research focus.
Trace elements pollution in the soil is concealed, cumulative and irreversible. Trace elements entering the soil are difficult to dilute or remove from the soil under natural conditions without human intervention. For example, the half-lives of Cd, Cu and Pb are 15–1100, 310–1500 and 740–5900 years, respectively [13]. Trace elements are toxic to organisms and harmful to soil ecosystem if present in high concentration and the damage is difficult to recover [14]. Trace elements tend to accumulate in soils. Chen et al. [15] found that the Cd content in the 0–20 cm soil layer was greatly elevated and was more than 2 times higher than that in the deep soil layer under long-term reclaimed water (Cd 0.26–1.30 µg/L) irrigation. However, Xu et al. [16] found that the highest levels of Cr, Cu, Ni and Zn were determined in the 30–40 cm horizons in soils irrigated with effluent for 8 years and at a deeper depth of 40–50 cm in soils irrigated for 20 years. The leaching effect of long-term reclaimed water irrigation might lead to increased risk of groundwater contamination with trace elements [17,18]. Beijing is the key city developing reclaimed water irrigation in China; the trace element content of the reclaimed water in Beijing is far lower than that demanded by the Standards for Irrigation Water Quality (GB 5084-2005) [19]. The question still remains about the effect of high-quality reclaimed water irrigation on agricultural soil health.
In this study, an experiment was conducted to simulate the long-term irrigation with reclaimed water in the typical irrigation area in Beijing. The main objectives were (1) to study the characteristics of the occurrence and migration of trace elements in soil profiles under long-term reclaimed water irrigation; (2) to analyze the effects of soil properties on trace elements distribution in soil; and (3) to assess the potential ecological risk of trace elements in soil under the long-term reclaimed water irrigation conditions.

2. Materials and Methods

2.1. Study Area

The study area was located near the Baita Sluice of the Dalong River in the Nanhongmen reclaimed water irrigation area, northeastern part of Daxing District in Beijing (Figure 1). The region has a semi-humid continental monsoon climate in the warm temperate zone with a mean annual rainfall of 544 mm. The precipitation is mostly concentrated in the flood season from June to September, accounting for about 80% of the annual average. The perennial average water surface evaporation was 1021 mm, the land surface evaporation was 450 mm and the groundwater depth was 10.62–11.53 m. Sandy loam and silty loam are the main soil types. The main crop types are corn and wheat. The Nanhongmen irrigation area was built in the 1950s and its area has grown to 26,000 hm2 at present. The area had a sewage irrigation history about 20 years before 1970 and gradually shifted to groundwater irrigation after 1980. Since 2002, reclaimed water irrigation has been vigorously developed in this area because of its growing problem of groundwater over-exploitation. Dalong River is an important canal system transporting reclaimed water from Xiaohongmen Sewage Treatment Plant and the Huangcun Sewage Treatment Plant to the southern part of the Nanhongmen reclaimed water irrigation area. The Baita Sluice is an important flood control and drainage project of the Dalong River.

2.2. Experimental Design

The test arrangement is shown in Figure 1. On the east side of the Baita Sluice, three separated percolation ponds T1, T2 and T3 were selected for the simulation experiment of irrigation years treatment of long-term reclaimed water irrigation (Table 1). The ponds are 23.5 m in length and 18 m in width. It was considered that there was little lateral infiltration effect as the hydraulic load can ensure the vertical infiltration of reclaimed water in the central area of the infiltration pool because of the large size of the ponds. The reclaimed water used in the experiment was from the Dalong River and the water quality indexes are shown in Table 2. The infiltration was conducted in a rotational mode with an irrigation interval of 1 day and approximately 150 m3 of reclaimed water was pumped into each percolation pond each time. During the experimental period, the cumulative infiltration amount of T1, T2 and T3 ponds was 4952.6, 9962.2 and 11,981.5 m3, respectively. Thus, the irrigation years were calculated as 98 years of T1, 196 years of T2 and 236 years of T3, according to the average annual irrigation volume of winter wheat and summer corn (250 m3/mu) and the utilization coefficient of irrigation water (0.68). In order to simplify the simulation, the study hypothesized that the trace elements brought in the soil by reclaimed water irrigation were not absorbed by crops, which was an extreme case where the trace elements reached their upper limits in soil.

2.3. Sample Collection and Analysis

The pond center was selected as the sampling point for each treatment group. Considering the spatial variability of soil, samples of the control points were collected separately for each treatment at 20 m east of T1, T2 and T3 samples, named control 1 (CK1), control 2 (CK2) and control 3 (CK3), respectively. Soil samples of the treatment groups (T1, T2 and T3) and control groups (CK1, CK2 and CK3) from 0–600 cm profiles were collected by stratified sampling at different depths to analyze the vertical distribution of trace elements. Stratified soil samples were collected at intervals of 10, 20 and 40 cm for the 0–100, 100–300 and 300–600 cm soil layers, respectively and each sample was approximately 1 kg. To avoid sample contamination, metal containers were not used during the sampling, sample preservation and sample processing procedures. All soil samples were air dried at room temperature, sieved through a 10-mesh (2-mm) nylon sieve to remove coarse debris and then separated into two subsamples. One subsample was used to determine soil properties including pH, clay content, organic matter, redox potential and total nitrogen (TN) and the other was ground with a porcelain pestle and mortar until all particles passed a 100-mesh (0.149-mm) nylon sieve for subsequent heavy metal and metalloid analysis. Table 3 summarizes the information of soil properties in the 0–600 cm profiles in the study area.
For analysis of the total concentrations of soil As, Cd, Cr, Cu, Hg, Pb and Zn, soil samples were digested by HNO3-H2O2 mixture in Teflon tubes according to USEPA method 3050B [20]. The concentrations of As and Hg were determined by atomic fluorescence spectrometry (AFS). The concentrations of Cd, Cr, Cu, Pb and Zn were determined by inductively coupled plasma mass spectrometry (ICP-MS). The detection limits of the trace elements were 2 µg/kg for Hg, 30 µg/kg for Cd, 1 mg/kg for As and Cu, 2 mg/kg for Pb and Zn and 5 mg/kg for Cr. All element concentrations are presented on a dry matter basis.

2.4. Methodology

2.4.1. Weighted Average Concentration Calculation

The soil samples were collected at different soil depth. The detected trace element concentration of each sample was regarded as the concentration of its corresponding layer. The weighted average concentration was calculated as follows:
C i = k = 1 n C k i ρ k Δ H k k = 1 n ρ k Δ H k
where C i is the weighted average concentration of trace element i (mg/kg), C k i is the measured concentration of element i in soil layer k (k = 1, 2, 3, ..., n) (mg/kg), ρ k is the soil bulk density of the layer k (g/cm3) and Δ H k is the thickness of soil layer k (cm).

2.4.2. Potential Ecological Risk Assessment

The potential ecological risk index (PERI) was used to assess the contamination degree of trace elements in the study area. The equations to calculate the PERI were introduced by Hakanson [22] as follows:
C f i = C s i / C n i
E r i = T r i C f i = T r i C s i / C n i
P E R I = i = 1 n E r i = i = 1 n T r i C s i / C n i
where C f i is the contamination factor of a single element, C s i is the measured concentration of element i in a soil sample (mg/kg) and C n i is its corresponding background value of the same element (mg/kg). The average background values of the study area are 7.09 mg/kg for As, 119 µg/kg for Cd, 29.8 mg/kg for Cd, 18.7 mg/kg for Cu, 57.6 µg/kg for Hg, 24.6 mg/kg for Pb and 57.5 mg/kg for Zn [23,24]. E r i is the potential ecological risk factor of element i and T r i is the biological toxicity factor of an individual element, which were as follows: As = 10, Cd = 30, Cr = 2, Cu = Pb = 5, Hg = 40 and Zn = 1 [25]. PERI is the comprehensive potential ecological risk index of the elements, which is the sum of E r i . It represents the sensitivity of the biological community to the toxic substance and illustrates the potential ecological risk caused by the overall concentration. The categories for E r i and PERI of trace elements are shown in Table S1.

2.4.3. Statistical Analysis

All statistical analyses were performed using SPSS 20.0 software for windows (IBM, Armonk, NY, USA). A Pearson correlation matrix was used to relate trace element concentrations to soil properties and among the trace elements themselves. A p-value of < 0.05 or < 0.01 was considered to be statistically significant. A paired sample T-test was used to analyze the impact of reclaimed water irrigation by comparing the significance of the difference in soil PERI between the treatment groups and the control groups.

3. Results and Discussion

3.1. Vertical Distribution of Trace Elements in Soil

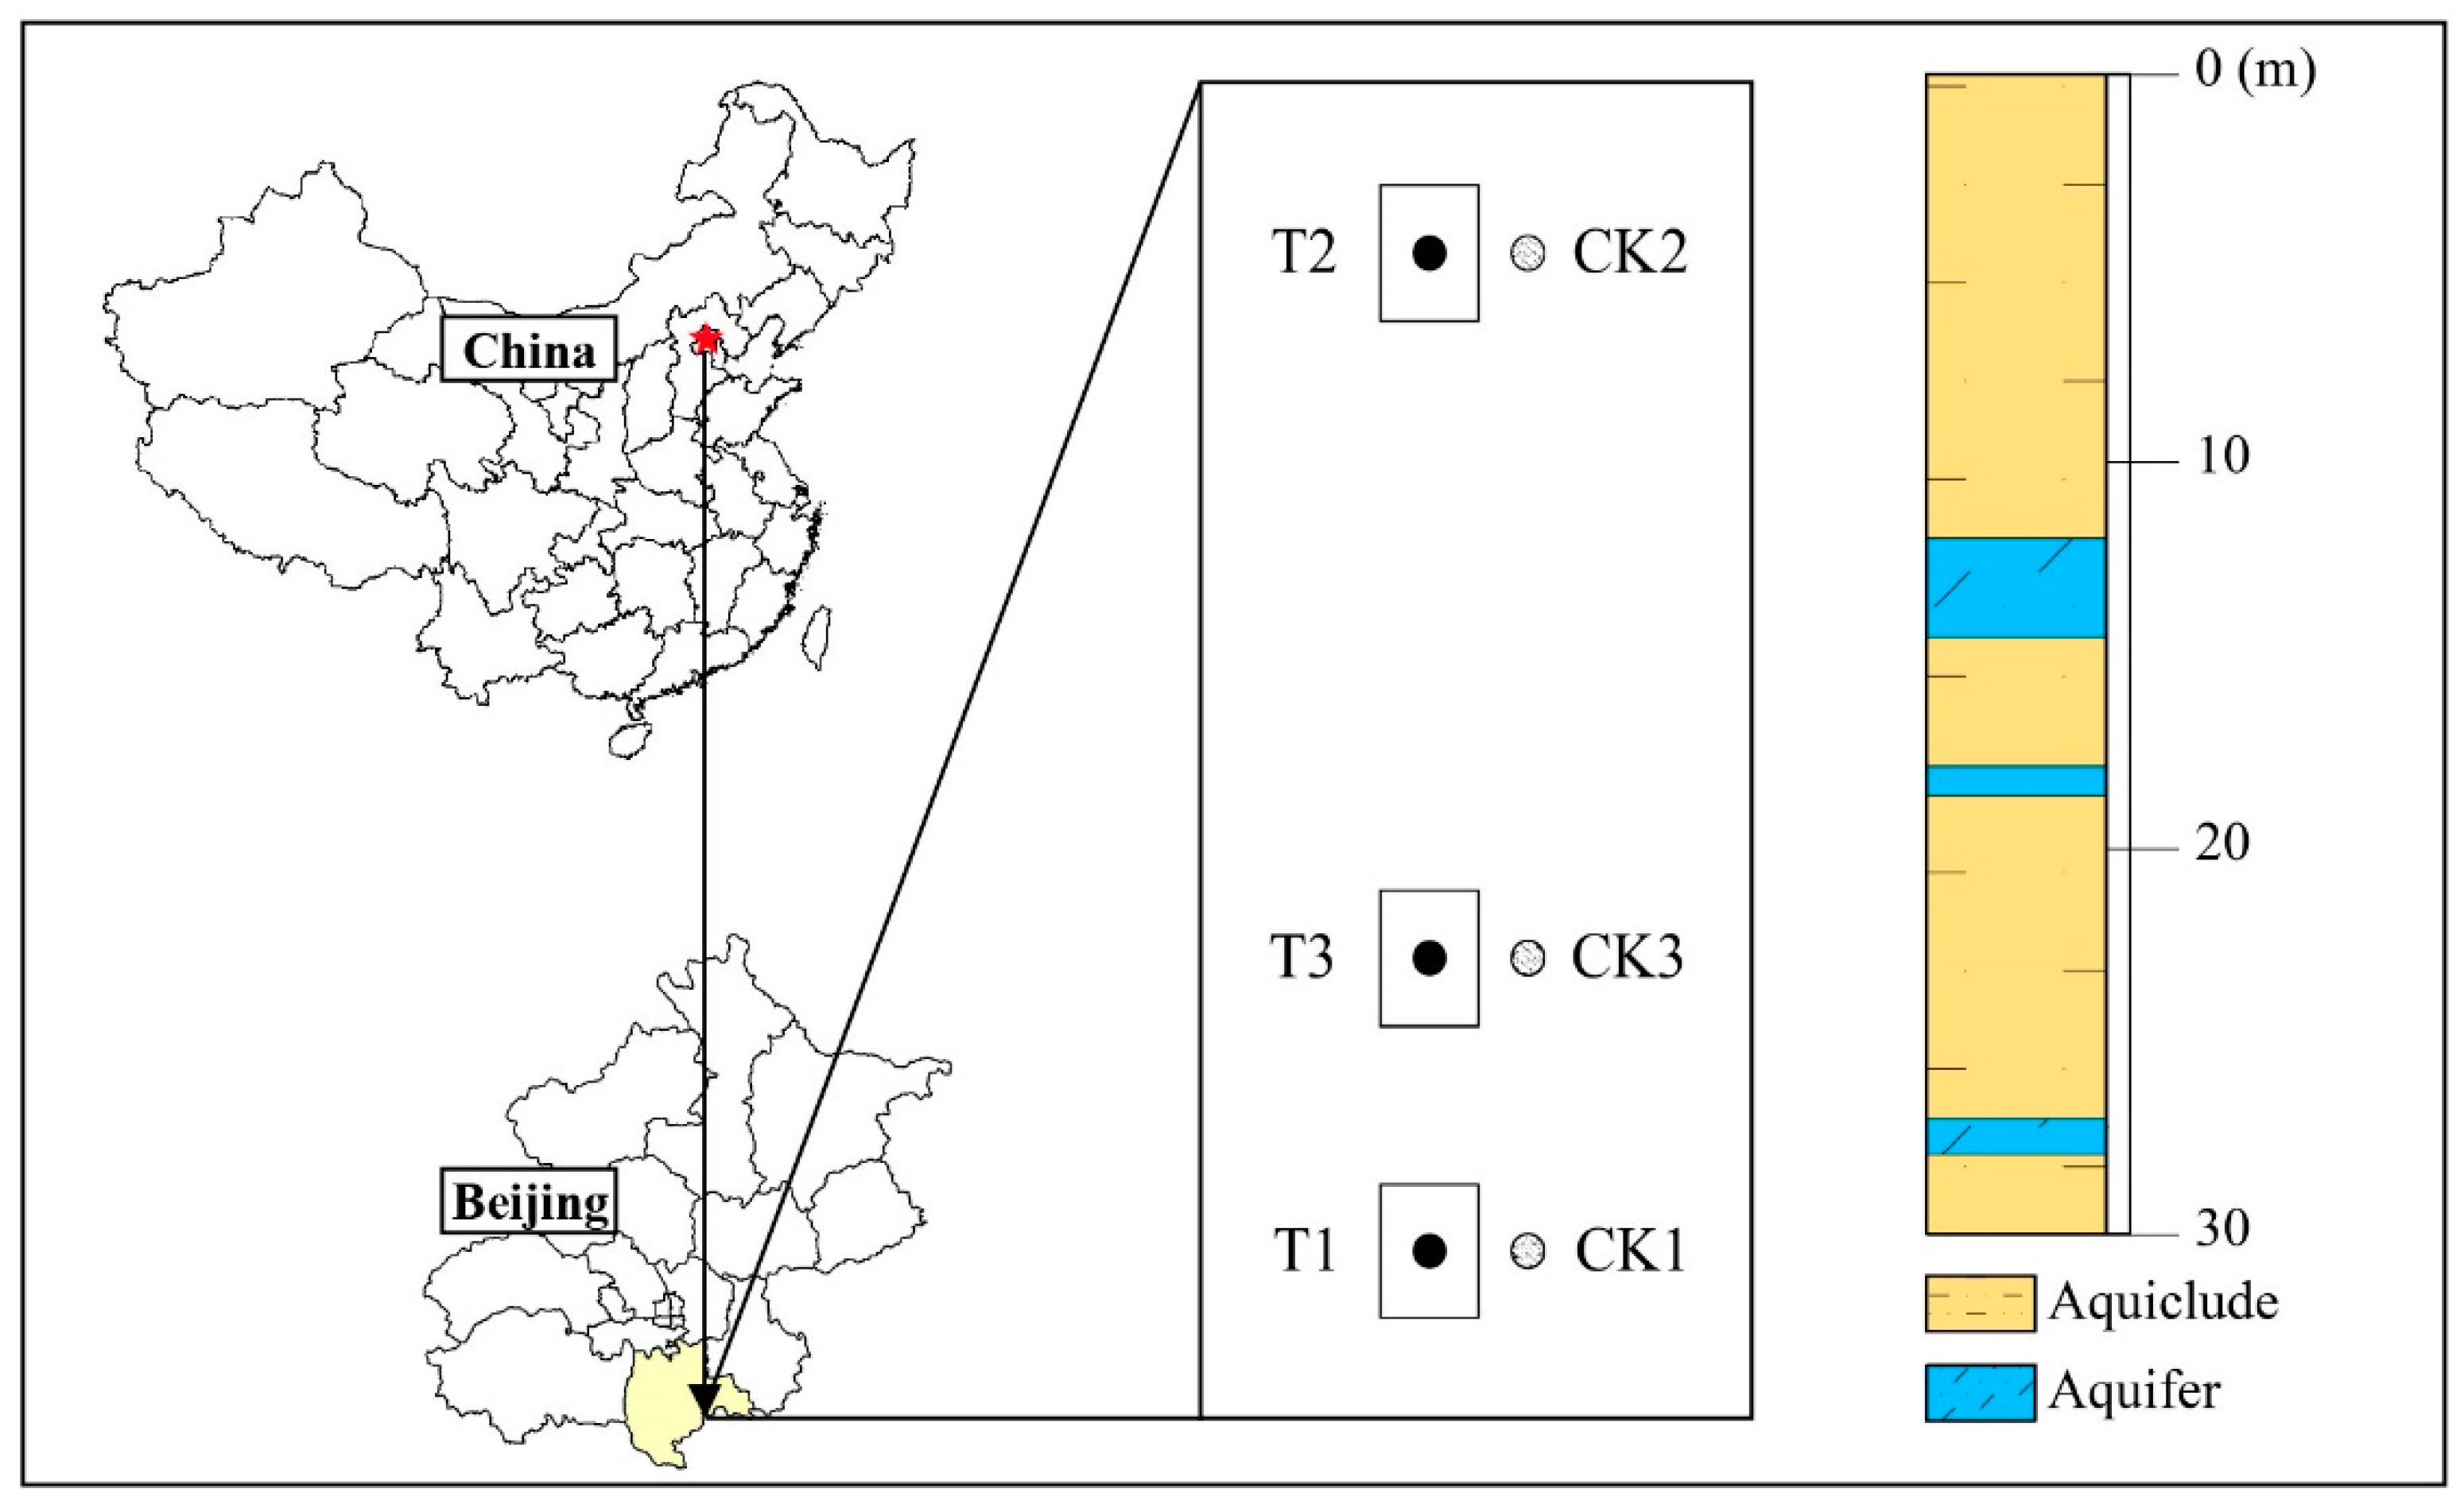
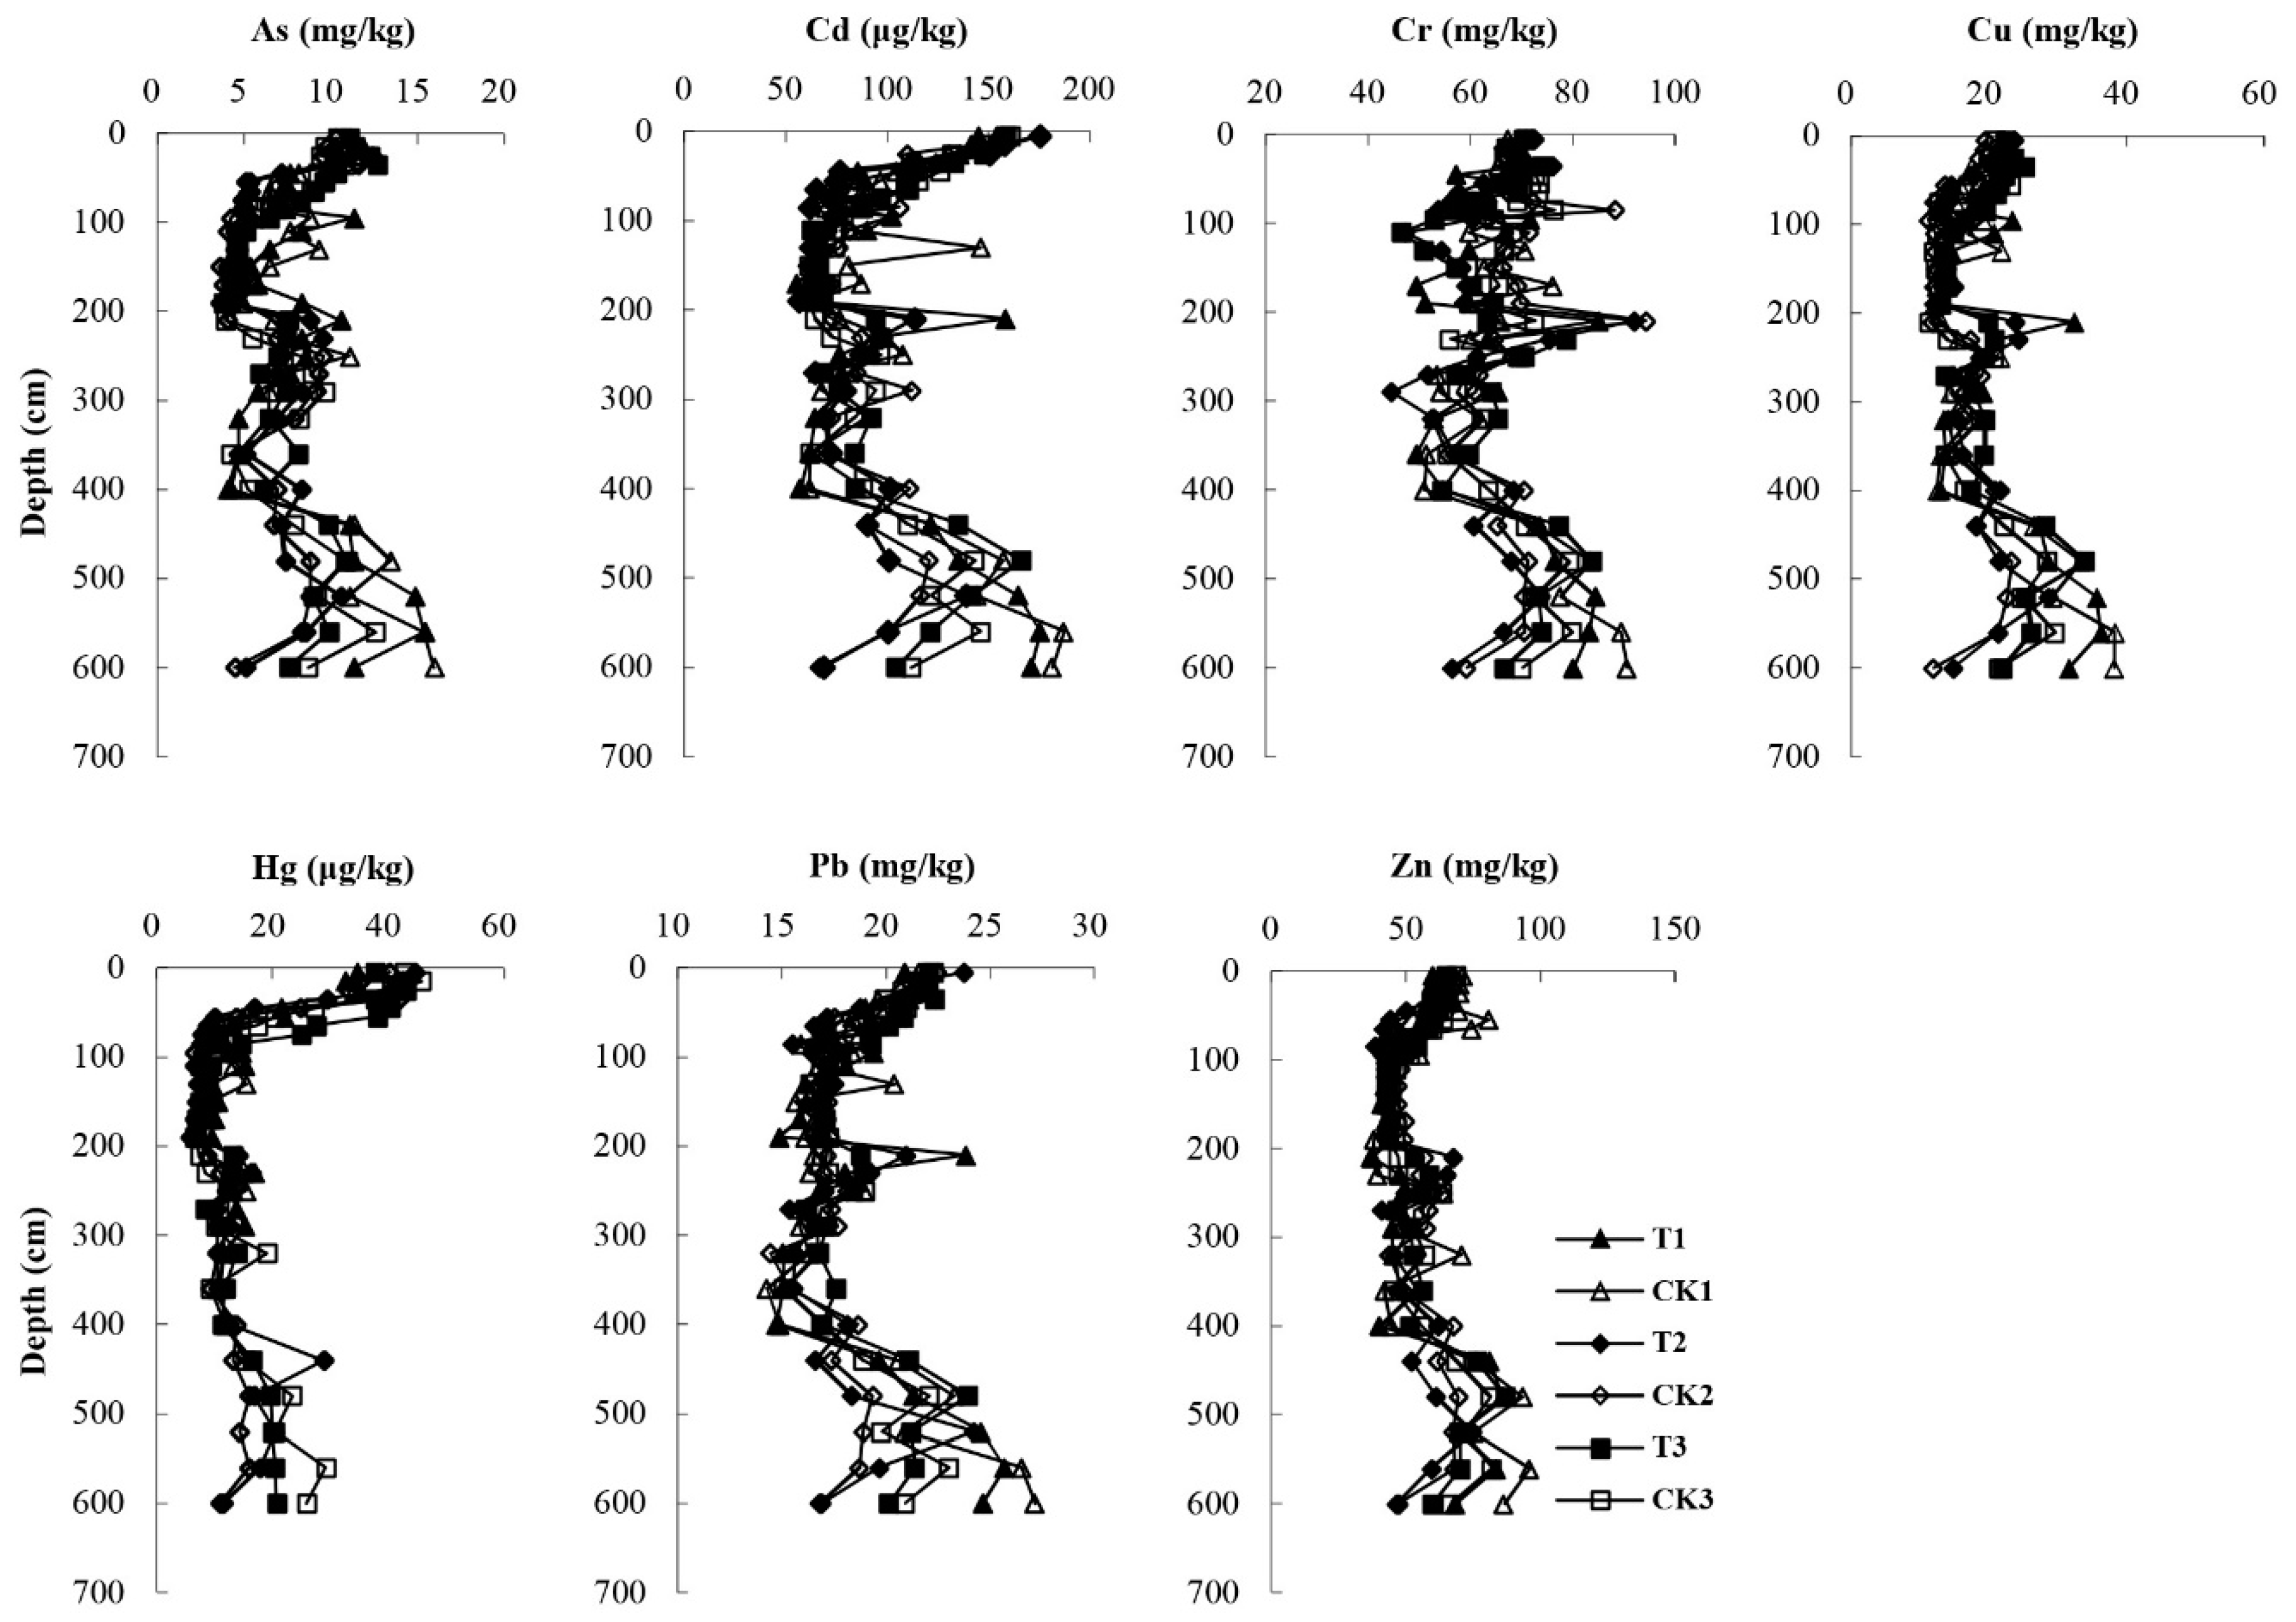
The vertical distribution of trace elements could help describe the soil contamination level and characteristics. The vertical distribution of As, Cd, Cr, Cu, Hg, Pb and Zn concentrations along the 0–600 cm soil profiles under three irrigation times and the three corresponding control cases is illustrated in Figure 2. For all samples, the highest concentrations were obtained for soil Cr, Zn and Cu. For the weighted average of 0–600 cm profiles, Cr, Zn and Cu concentrations of the treatment and control groups were in the range of 62.38–68.58 mg/kg (66.54 mg/kg), 53.07–60.86 mg/kg (58.06 mg/kg) and 16.80–22.26 mg/kg (19.88 mg/kg), respectively, which were higher than the reported background concentrations in Beijing (29.8 mg/kg for Cr, 57.5 mg/kg for Zn, 18.7 mg/kg for Cu) [23]. The trace element concentrations in soils in descending order were as follows: Cr > Zn > Cu > Pb > As > Cd > Hg. Comparing with the previous studies, the contents of seven trace elements in soils of the control and treatment groups were close to or even lower than that in agricultural soils irrigated without sewage or reclaimed water in other regions of China. In Lu et al.’s [26] survey of agricultural soils in Shunyi, Beijing, the mean values of the trace elements were 7.85, 0.136, 22.4, 0.073, 20.4 and 69.8 for As, Cd, Cu, Hg, Pb and Zn, respectively, slightly higher than the contents of the present study. And in Li et al.’s [27] research, the mean Cd, Pb, Cu and Zn concentrations in the 0–20 cm soil of Shenyang were 0.10, 21.60, 16.88 and 46.46 mg/kg, respectively, which showed a slightly lower values.
In general, the As, Cd, Cu, Hg, Pb and Zn contents decreased with increasing depth on the top 100 cm soil layer, suggesting the strong adsorption and fixation capacity of the surface soil. Among them, Hg decreased the most. The concentration of Hg decreased sharply from 33.86–43.00 µg/kg in top 30 cm profiles to 6.84–10.92 µg/kg at 100 cm depth (68–83% decrease) and did not change substantially in the 100–600 cm soil profiles. The results showed the strong adsorption effect of the topsoil on Hg. Besides the clay fraction, atmospheric deposition might play an important role in the accumulation of Hg in topsoil [28]. In the 200–300 cm and 450–550 cm soil layers As, Cd, Cu, Pb and Zn showed an increase in concentration, which was because of the high clay content in these soil layers. The increase in the adsorption efficiency can be explained by the increasing surface area where the adsorption takes place [29]. The Pb concentration showed little variation in the 100–400 cm profile and had an increasing tendency in the 400–600 cm profile. In an alkaline medium (pH > 7), the soil negative charge increases with the increasing pH and clay content, as in the 400–600 cm profiles, thus resulting in increased adsorption of Pb [30]. The Cr content had a small fluctuation in the 0–200 cm soil layers and showed an increase with increasing depth in the 400–600 cm profiles. The mobility of Cr in soil depends on its oxidation state [31]. Cr added to the soil tends to be oxidized to its mobile state, Cr(VI), generally in the anionic form, because of the well-aerated soil in the surface layer. The alkaline environment and the negative charge of soil particles enhanced the mobility of Cr(VI) in soils. With increasing depth, the soil conditions gradually changed to reducing conditions where Cr(VI) might be converted to the stable form Cr(III). The trace elements concentrations were relatively low at 300–400 cm but relatively high at 400–600 cm, which might be attributed to long-term leaching.
The vertical distribution of trace elements in soil profiles of other regions have been discussed in many previous studies. Huang et al. [32] found that the heavy metals showed a slight enrichment at the surface or subsurface and gradually decreased with depth in 0–200 cm agricultural soils. This trend was similar as the distribution of the trace elements in 0–200 cm profiles in this study. By subtracting the heavy metals which included the one brought by wastewater irrigation and the one in original soil, Li et al. [27] found that the upper 0–20 cm soil layer have accumulated most of the exogenous heavy metals than 20–40 cm soil layer, indicating that the atmospheric precipitation was a significant contributor to heavy metals in topsoil. It was likely that the reclaimed water irrigation and the atmospheric precipitation were the main reason of relatively high concentration of trace elements in the 0–30 cm soil layer.
The trace element concentrations in different soil layers of the treatment group (T1, T2 and T3) and the control group (CK1, CK2 and CK3) and the percentage increase in the concentration of the treatment group when compared with the control group are shown in Table 4. On average, after long-term reclaimed water irrigation, the concentrations of As, Cd, Cr, Cu, Hg and Pb in top 30 cm soils increased by 10%, 6%, 2%, 10%, 4% and 2%, respectively; the Zn contents decreased by 2%. The trace elements showed an obvious accumulation in the 0–30 cm soil layer. At the depth of 30–100 cm, the concentrations of As, Cu, Hg and Pb increased by 8%, 14%, 15% and 1%, respectively and the Cd, Cr and Zn contents decreased by 6%, 7% and 0.4%, respectively. In the 100–200 cm soil layers, the As, Cu, Hg contents increased by 5%, 7% and 7%, respectively, whereas the Cd, Cr, Pb, Zn contents declined by 13%, 15%, 2% and 8%, respectively. The concentrations of the seven trace elements all increased in the 200–300 cm profiles, by 2% for As, 7% for Cd, 3% for Cr, 24% for Cu, 20% for Hg, 5% for Pb and 4% for Zn. At 300–600 cm depth, the contents of Cd, Cu, Hg and Pb increased by 0.4%, 4%, 5% and 2%, respectively and the As, Cr, Zn contents decreased by 0.1%, 2% and 5%, respectively.
According to the change in trace element contents in soil profiles after long-term reclaimed water irrigation, the top 30 cm and 200–300 cm soil layers were more likely to accumulate trace elements especially As, Cu and Hg in the study area, which might be explained by the higher clay and OM contents of these two soil layers (Table 3). Similarly, Bao et al. [33] studied the accumulation of heavy metals in soil profiles with long-term sewage irrigation and found that the irrigation area showed the greatest accumulation of Hg, Pb and Cu in topsoil (0–30 cm) due to the greatest topsoil OM contents. Present and previous studies indicated that the reclaimed water irrigation could contribute to the trace elements accumulation in soil which was similar to sewage irrigation [34,35]. However, the increases in trace element concentrations in soils of the treatment groups relative to those of the control groups in this study were less than 10% in the 0–30 cm profiles and less than 7% in the 200–300 cm profiles except for Cu (20%) and Hg (20%). Overall, comparing the three pairs of treatment and control groups, no obvious accumulation was observed in the 0–600 cm soil profiles with the increase in years of reclaimed water irrigation.

3.2. Effects of Soil Properties on Trace Element Distribution

The distribution of trace elements in the soil profile is closely related to soil properties, trace element species and sources [36]. Understanding the relationship between the trace elements and the soil parameters could help clarify the behavior of these elements in soil. Pearson correlation analyses between trace element concentrations and soil properties (clay, OM and Eh) of the treatment group and control group soils and among trace elements were conducted in this study (Table 5).
The clay content was significantly positively correlated with the seven trace elements in all treatments T1–T3 (Table 5; p < 0.01 except for Hg in T2 where p < 0.05). The clay in CK1 showed a significant positive correlation with the contents of Cd, Cu, Pb and Zn (p < 0.05). In CK2, clay was significantly positively correlated with As, Cu and Zn (p < 0.01) and with Cr, Hg and Pb (p < 0.05). In CK3, clay was significantly positively correlated with As, Cd, Cu, Pb and Zn (p < 0.01) and with Cr and Hg (p < 0.05). Positive correlations were observed between trace elements and soil clay fraction in many different researches [37,38]. The correlations in treatment groups were more significant than that in control groups, suggesting that the trace elements in soils of control groups have not reached their saturation values. The clay was considered as the main soil component associated with trace elements because of the high affinity of the trace elements for clay minerals [39]. The high correlation coefficients shown in Table 5 confirmed the results obtained in Bradl’s [40] study that the fine-grained soil fraction exhibited higher tendency for trace element adsorption than coarse-grained soils as it contains soil particles with large surface areas such as clay minerals. This might explain the high content of trace elements in the 250–300 and 450–550 cm soil layers in this study.
OM was positively correlated with the seven trace elements (Table 5). Trace elements tend to adsorb on OM and form stable organic-metallic complexes. Therefore, soils rich in OM can reduce the migration and biological activity of trace elements [41,42,43]. OM and clay content were found to be significantly correlated [44]. Clay particles are more likely to adsorb OM and form clay-organic complexes because of their higher surface area and charge density. The small pores and poor ventilation of soil with high clay contents are responsible for inhibiting the activity of aerobic microbes, by extension, weakening the decomposition of OM and benefiting its accumulation. Therefore, soil with high clay contents has relatively high OM contents. Results showed that the correlation between trace element concentration and clay fraction is consistent with that of trace element concentration and OM. Moreover, organic carbon (OC) content, as the amount of carbon found in OM, is also found to correlate positively with trace elements by many researchers [39,45].
The Eh was not significantly correlated with trace elements (Table 5). Eh is an important indicator reflecting the soil oxidation state, as such, Eh could induce a serious of complex chemical changes in soil pH, OM contents and mineral components, which directly or indirectly affect the environmental behavior of trace elements [46]. These complex chemical changes could make it difficult to quantify the effects of Eh on trace elements.
Correlation analysis was also carried out between trace elements (Table 6). Inter-elements relationships provide information on trace element sources and pathways. According to the Pearson correlation coefficient values, all elements were highly correlated (p < 0.01) and the high correlations suggest that the trace elements have a similar origin [47,48].
Results of the statistical analyses have shown the various and complex relationships between trace elements and soil properties. Some of the correlation coefficients were low, although significant, suggesting a weak linear dependence. Nevertheless, the main relationships described in the study have been observed in many previous researches of trace elements [39,48].

3.3. Potential Ecological Risk Assessment

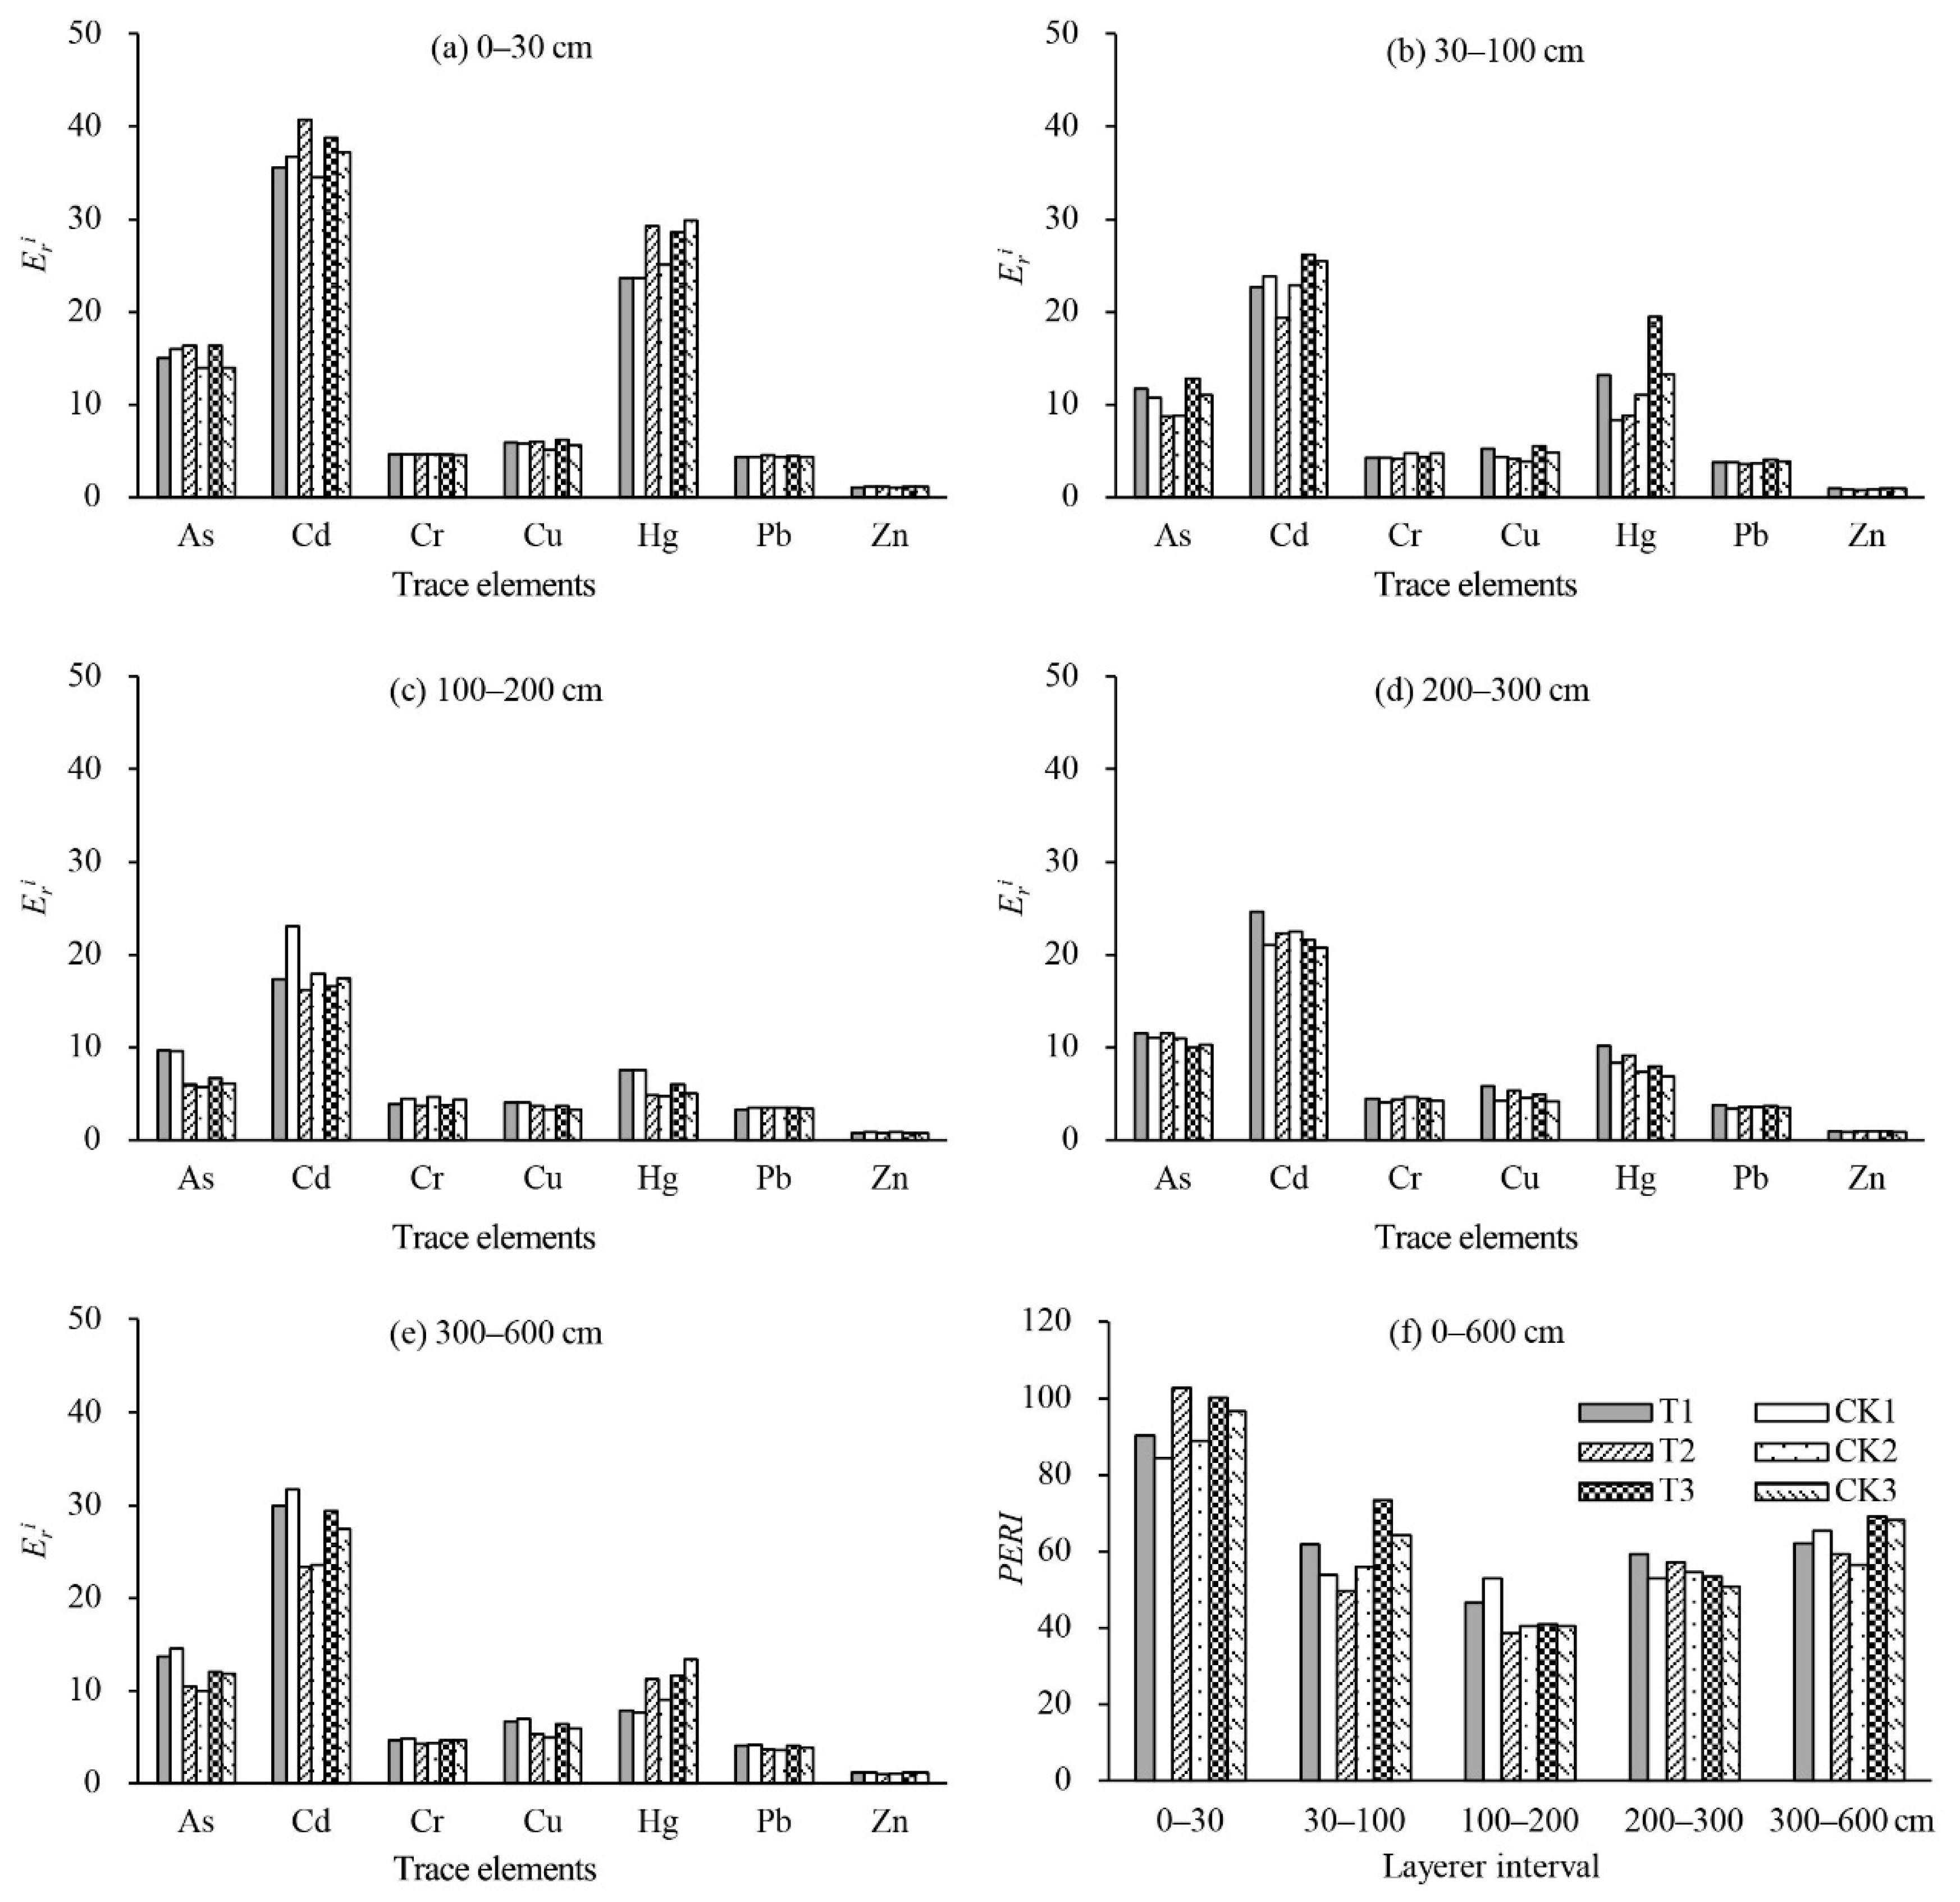
The contents of As, Cd, Cr, Cu, Hg, Pb and Zn in the soil of control groups were 0.95–1.30 (mean 1.10), 0.77–0.94 (0.85), 2.25–2.30 (2.28), 0.90–1.15 (1.02), 0.23–0.30 (0.27), 0.72–0.78 (0.75) and 0.99–1.06 (0.99) times those of the background values of trace elements in Beijing, respectively. The contents of As, Cd, Cr, Cu, Hg, Pb and Zn in the soil of treatment groups were 1.00–1.27 (1.13), 0.75–0.89 (0.84), 2.09–2.24 (2.19), 0.99–1.19 (1.10), 0.26–0.34 (0.30), 0.73–0.78 (0.77) and 0.92–1.03 (1.03) times those of the background values, respectively. The contamination factors followed the order of Cr > As > Cu > Zn > Cd > Pb > Hg. The results revealed that the study area already has some accumulation of Cr, As and Cu and that the Zn concentration was close to the background value.
The results of the potential ecological risk factor of single elements ( E r i ) and the comprehensive potential ecological risk index (PERI) for the seven trace elements in different soil layers are depicted in Figure 3. The E r i values of all trace elements were < 40 in the 0–600 cm soil profiles except for the E r i value of Cd, which was close to 40 in top 30 cm soils, implying a low ecological risk. The degree of pollution from the seven trace elements decreased in the following sequence: Cd > Hg > As > Cu > Cr > Pb > Zn. Although the contents of Cd and Hg were lower than the soil background values, their biological toxicity factor was higher apparently than that of the other elements (Cd = 30, Hg = 40) resulting in a higher degree of ecological risk. Cd and Hg were also revealed as the main contribution to the potential ecological risk in previous studies [49,50]. Cd and Hg are highly toxic and can enter the human body through the food chain and seriously endanger human health. The accumulation of Cd and Hg in soil should be strictly controlled as they are priority pollutants in the study area. In addition, the PERI values were all < 150, which was classified as low potential ecological risk. Comparing the E r i and PERI of different soil layers, the top 30 cm soil layer had the highest values. The results suggested that the trace element concentrations in the 0–30 cm soil layers should be monitored for pollution prevention.
To study the impact of reclaimed water irrigation, the difference in soil PERI between the treatment and control groups was analyzed using paired sample t-test (Table 7). All the P-values of T1-CK1, T2-CK2 and T3-CK3 pairs were > 0.05, except 0.040 of T2-CK2 and 0.005 of T3-CK3 in the 30–100 cm soil profiles, which showed no significant difference at a level of 0.05. It was concluded that the long-term reclaimed water irrigation experiment in the study area did not result in a significantly increased PERI of trace elements in the profiles.
Compared with previous studies about the impact of long-term reclaimed water irrigation on soil [15], the trace element concentration of Dalong River reclaimed water in this experiment was very low. Because many industries creating trace element pollution have been moved out of the city in recent years and discharges of industrial wastewater are well regulated, the trace elements concentration in reclaimed water in Beijing is largely negligible. In addition, trace elements can be effectively removed from wastewater treatment processes and be concentrated in the sludge fraction. The trace element input from reclaimed water is generally small in comparison to atmospheric deposition and agrochemicals [51,52]. It is likely that the low trace element concentration of reclaimed water might be one of the main reasons for little accumulation of trace elements in the soils in this study.

4. Conclusions

This paper studied the environmental behavior of As, Cd, Cr, Cu, Hg, Pb and Zn in soil profiles of the study area under long-term reclaimed water irrigation and the potential ecological risk. Cr, Zn and Cu concentrations were the highest in soil profiles of both the control and treatment groups. The contents of As, Cd, Cu, Hg, Pb and Zn in the 0–100 cm soil profile all decreased with increasing depth. Among them, Hg decreased the most, while Cr did not change significantly. The surface soil showed strong adsorption characteristics. In the 200–300 and 450–550 cm soil layers there were increased concentrations of As, Cd, Cu, Hg, Pb and Zn because of the high clay contents. According to the change in trace element contents in soil profiles after long-term reclaimed water irrigation, the 0–30 and 200–300 cm soil layers were more likely to accumulate trace elements. The distribution of trace elements in soil profiles was closely related to soil properties. Correlation analysis showed that trace element contents were positively correlated with clay and OM but not significantly correlated with Eh. As, Cr and Cu contents of the study area were higher than the background values. The ecological risk assessment using the Hakanson method showed that Cd in top 30 cm soil layer was close to moderate pollution and other six trace elements studied were slight pollution. The PERI values of different soil layers were all <150, implying low ecological pollution. The long-term reclaimed water irrigation did not result in the significant accumulation of trace elements in soil profiles or an increase in the potential ecological risk. Considering the various complex factors of different districts including the reclaimed water quality, soil type, irrigation method, environmental conditions, further research is needed to objectively and comprehensively assess the effect of long-term reclaimed water irrigation on soil health.

Supplementary Materials

The following are available online at https://www.mdpi.com/2073-4441/10/12/1716/s1.

Author Contributions

Y.H. and W.W. were responsible for the experiments of this study; Y.H., W.W. and H.L. helped in the data processing and result analysis; Y.H. and W.W. wrote the paper. D.X. and H.L. worked on improving and finalizing the manuscript.

Funding

This research was funded by the National Key Research and Development Program of China (2016YFC0403101), the Independent Research Project of State Key Laboratory of Simulation and Regulation of Water Circle in River Basin (2016ZY05) and the National Water Pollution Control and Treatment Science and Technology Major Project (2018ZX07110008).

Acknowledgments

The authors thank the reviewers for providing helpful suggestions to improve this manuscript.

Conflicts of Interest

The authors declare no conflict of interest.

References

  1. Wang, Z.; Li, J.S.; Li, Y.F. Using Reclaimed Water for Agricultural and Landscape Irrigation in China: A Review. Irrig. Drain. 2017, 66, 672–686. [Google Scholar] [CrossRef]
  2. Australian Academy of Technology and Engineering (ATSE). Water Recycling in Australia; Australian Academy of Technological Sciences and Engineering: Melbourne, Australia, 2004; Available online: https://www.atse.org.au/ (accessed on 20 October 2018).
  3. Guo, W.; Qi, X.B.; Xiao, Y.T.; Li, P.; Andersen, M.N.; Zhang, Y.; Zhao, Z.J. Effects of Reclaimed Water Irrigation on Microbial Diversity and Composition of Soil with Reducing Nitrogen Fertilization. Water 2018, 10, 365. [Google Scholar] [CrossRef]
  4. Ayoub, S.; Al-Shdiefat, S.; Rawashdeh, H.; Bashabsheh, I. Utilization of reclaimed wastewater for olive irrigation: Effect on soil properties, tree growth, yield and oil content. Agric. Water Manag. 2016, 176, 163–169. [Google Scholar] [CrossRef]
  5. Pedrero, F.; Camposeo, S.; Pace, B.; Cefola, M.; Vivaldi, G.A. Use of reclaimed wastewater on fruit quality of nectarine in Southern Italy. Agric. Water Manag. 2018, 203, 186–192. [Google Scholar] [CrossRef]
  6. Khan, M.U.; Malik, R.N.; Muhammad, S. Human health risk from Heavy metal via food crops consumption with wastewater irrigation practices in Pakistan. Chemosphere 2013, 93, 2230–2238. [Google Scholar] [CrossRef] [PubMed]
  7. Xu, J.Y.; Zhao, C.T.; Wei, D.B.; Du, Y.G. A toxicity-based method for evaluating safety of reclaimed water for environmental reuses. J. Environ. Sci. 2014, 26, 1961–1969. [Google Scholar] [CrossRef] [PubMed] [Green Version]
  8. Cherfi, A.; Achour, M.; Cherfi, M.; Otmani, S.; Morsli, A. Health risk assessment of heavy metals through consumption of vegetables irrigated with reclaimed urban wastewater in Algeria. Process Saf. Environ. Prot. 2015, 98, 245–252. [Google Scholar] [CrossRef]
  9. Pan, F. Present situation and development countermeasure of reusing municipal sewage. Pollut. Control Technol. 2006, 19, 31–33. (In Chinese) [Google Scholar]
  10. Wei, N.; Cheng, X.R.; Liu, Y.P. Overview of main reuse approaches of municipal wastewater. Water Saving Irrig. 2006, 31–34, 36. (In Chinese) [Google Scholar]
  11. Yi, L.L.; Jiao, W.T.; Chen, X.N.; Chen, W.P. An overview of reclaimed water reuse in China. J. Environ. Sci. 2011, 23, 1585–1593. [Google Scholar] [CrossRef]
  12. Ministry of Ecology and Environment of China. National Survey of Soil Pollution Bulletin; Ministry of Ecology and Environment of the People’s Republic of China: Beijing, China, 2014. Available online: http://www.mee.gov.cn/ (accessed on 20 October 2018).
  13. Alloway, B.J.; Ayres, D.C. Chemical Principles of Environmental Pollution; Blackie Academic & Professional (an imprint of Chapman & Hall): Oxford, UK, 1993; p. 291. ISBN 0751400130. [Google Scholar]
  14. Gulser, F.; Erdogan, E. The effects of heavy metal pollution on enzyme activities and basal soil respiration of roadside soils. Environ. Monit. Assess. 2008, 145, 127–133. [Google Scholar] [CrossRef] [PubMed]
  15. Chen, W.P.; Lu, S.D.; Peng, C.; Jiao, W.T.; Wang, M.E. Accumulation of Cd in agricultural soil under long-term reclaimed water irrigation. Environ. Pollut. 2013, 178, 294–299. [Google Scholar] [CrossRef] [PubMed]
  16. Xu, J.A.; Wu, L.S.; Chang, A.C.; Zhang, Y.A. Impact of long-term reclaimed wastewater irrigation on agricultural soils: A preliminary assessment. J. Hazard. Mater. 2010, 183, 780–786. [Google Scholar] [CrossRef] [PubMed]
  17. Asano, T.; Cotruvo, J.A. Groundwater recharge with reclaimed municipal wastewater: Health and regulatory considerations. Water Res. 2004, 38, 1941–1951. [Google Scholar] [CrossRef] [PubMed]
  18. Nouri, J.; Mahvi, A.H.; Jahed, G.R.; Babaei, A.A. Regional distribution pattern of groundwater heavy metals resulting from agricultural activities. Environ. Geol. 2008, 55, 1337–1343. [Google Scholar] [CrossRef]
  19. Ministry of Ecology and Environment of China. Standards for Irrigation Water Quality (GB 5084-2005); Ministry of Ecology and Environment of the People’s Republic of China: Beijing, China, 2005. Available online: http://www.gb688.cn/bzgk/gb/ (accessed on 20 October 2018).
  20. US Environmental Protection Agency (USEPA). Method 3050B: Acid Digestion of Sediments, Sludges, and Soils; United States Environmental Protection Agency: Washington, DC, USA, 1996. Available online: Https://www.epa.gov/ (accessed on 20 October 2018).
  21. Ministry of Housing and Urban-Rural Development of China. The Reuse of Urban Recycling Water—Quality of Farmland Irrigation Water (GB 20922-2007); Ministry of Housing and Urban-Rural Development of the People’s Republic of China: Beijing, China, 2007. Available online: http://www.gb688.cn/bzgk/gb/ (accessed on 20 October 2018).
  22. Hakanson, L. An Ecological Risk Index for Aquatic Pollution-Control—A Sedimentological Approach. Water. Res. 1980, 14, 975–1001. [Google Scholar] [CrossRef]
  23. Chen, T.B.; Zheng, Y.M.; Chen, H.; Zheng, G.D. Background concentrations of soil heavy metals in Beijing. Environ. Sci. 2004, 25, 117–122. (In Chinese) [Google Scholar]
  24. Yang, J.; Chen, T.B.; Lei, M.; Liu, H.L.; Wu, W.Y.; Zhou, J. Assessing the effect of irrigation with reclaimed water: The soil and crop pollution risk of heavy metals. J. Nat. Resour. 2011, 26, 209–217. (In Chinese) [Google Scholar]
  25. Suresh, G.; Ramasamy, V.; Meenakshisundaram, V.; Venkatachalapathy, R.; Ponnusamy, V. Influence of mineralogical and heavy etal composition on natural radionuclide concentrations in the river sediments. Appl. Radiat. Isot. 2011, 69, 1466–1474. [Google Scholar] [CrossRef] [PubMed]
  26. Lu, A.X.; Wang, J.H.; Qin, X.Y.; Wang, K.Y.; Han, P.; Zhang, S.Z. Multivariate and geostatistical analyses of the spatial distribution and origin of heavy metals in the agricultural soils in Shunyi, Beijing, China. Sci. Total Environ. 2012, 425, 66–74. [Google Scholar] [CrossRef] [PubMed] [Green Version]
  27. Li, P.J.; Wang, X.; Allinson, G.; Li, X.J.; Xiong, X.Z. Risk assessment of heavy metals in soil previously irrigated with industrial wastewater in Shenyang, China. J. Hazard. Mater. 2009, 161, 516–521. [Google Scholar] [CrossRef] [PubMed]
  28. Wang, D.Y.; Shi, X.J.; Wei, S.Q. Accumulation and transformation of atmospheric mercury in soil. Sci. Total Environ. 2003, 304, 209–214. [Google Scholar] [CrossRef]
  29. Veli, S.; Alyuz, B. Adsorption of copper and zinc from aqueous solutions by using natural clay. J. Hazard. Mater. 2007, 149, 226–233. [Google Scholar] [CrossRef] [PubMed]
  30. Sari, A.; Tuzen, M.; Citak, D.; Soylak, M. Equilibrium, kinetic and thermodynamic studies of adsorption of Pb(II) from aqueous solution onto Turkish kaolinite clay. J. Hazard. Mater. 2007, 149, 283–291. [Google Scholar] [CrossRef] [PubMed]
  31. Kumpiene, J.; Lagerkvist, A.; Maurice, C. Stabilization of As, Cr, Cu, Pb and Zn in soil using amendments—A review. Waste Manag. 2008, 28, 215–225. [Google Scholar] [CrossRef] [PubMed]
  32. Huang, S.S.; Liao, Q.L.; Hua, M.; Wu, X.M.; Bi, K.S.; Yan, C.Y.; Chen, B.; Zhang, X.Y. Survey of heavy metal pollution and assessment of agricultural soil in Yangzhong district, Jiangsu Province, China. Chemosphere 2007, 67, 2148–2155. [Google Scholar] [CrossRef] [PubMed]
  33. Bao, Z.; Wu, W.Y.; Liu, H.L.; Chen, H.H.; Yin, S.Y. Impact of Long-Term Irrigation with Sewage on Heavy Metals in Soils, Crops, and Groundwater—A Case Study in Beijing. Pol. J. Environ. Stud. 2014, 23, 309–318. [Google Scholar]
  34. Pedrero, F.; Kalavrouziotis, I.; Alarcon, J.J.; Koukoulakis, P.; Asano, T. Use of treated municipal wastewater in irrigated agriculture-Review of some practices in Spain and Greece. Agric. Water Manag. 2010, 97, 1233–1241. [Google Scholar] [CrossRef]
  35. Singh, P.K.; Deshbhratar, P.B.; Ramteke, D.S. Effects of sewage wastewater irrigation on soil properties, crop yield and environment. Agric. Water Manag. 2012, 103, 100–104. [Google Scholar] [CrossRef]
  36. Manta, D.S.; Angelone, M.; Bellanca, A.; Neri, R.; Sprovieri, M. Heavy metals in urban soils: A case study from the city of Palermo (Sicily), Italy. Sci. Total Environ. 2002, 300, 229–243. [Google Scholar] [CrossRef]
  37. Zayed, A.M.; Terry, N. Chromium in the environment: Factors affecting biological remediation. Plant Soil 2003, 249, 139–156. [Google Scholar] [CrossRef]
  38. Dragovic, S.; Mihailovic, N.; Gajic, B. Heavy metals in soils: Distribution, relationship with soil characteristics and radionuclides and multivariate assessment of contamination sources. Chemosphere 2008, 72, 491–495. [Google Scholar] [CrossRef] [PubMed]
  39. Tume, P.; Bech, J.; Longan, L.; Tume, L.; Reverter, F.; Sepulveda, B. Trace elements in natural surface soils in Sant Climent (Catalonia, Spain). Ecol. Eng. 2006, 27, 145–152. [Google Scholar] [CrossRef]
  40. Bradl, H.B. Adsorption of heavy metal ions on soils and soils constituents. J. Colloid Interface Sci. 2004, 277, 1–18. [Google Scholar] [CrossRef] [PubMed]
  41. Halim, M.; Conte, P.; Piccolo, A. Potential availability of heavy metals to phytoextraction from contaminated soils induced by exogenous humic substances. Chemosphere 2003, 52, 265–275. [Google Scholar] [CrossRef]
  42. Lützow, M.V.; Kogel-Knabner, I.; Ekschmitt, K.; Matzner, E.; Guggenberger, G.; Marschner, B.; Flessa, H. Stabilization of organic matter in temperate soils: Mechanisms and their relevance under different soil conditions—A review. Eur. J. Soil Sci. 2006, 57, 426–445. [Google Scholar] [CrossRef]
  43. Liu, L.; Chen, H.S.; Cai, P.; Liang, W.; Huang, Q.Y. Immobilization and phytotoxicity of Cd in contaminated soil amended with chicken manure compost. J. Hazard. Mater. 2009, 163, 563–567. [Google Scholar] [CrossRef] [PubMed]
  44. Al-Abbas, A.H.; Swain, P.H.; Baumgardner, M.F. Relating organic matter and clay content to the multispectral radiance of soils. Soil Sci. 1972, 114, 477–485. [Google Scholar] [CrossRef]
  45. Bartoli, G.; Papa, S.; Sagnella, E.; Fioretto, A. Heavy metal content in sediments along the Calore river: Relationships with physical-chemical characteristics. J. Environ. Manag. 2012, 95, S9–S14. [Google Scholar] [CrossRef] [PubMed]
  46. Masscheleyn, P.H.; Delaune, R.D.; Patrick, W.H. Effect of Redox Potential and Ph on Arsenic Speciation and Solubility in a Contaminated Soil. Environ. Sci. Technol. 1991, 25, 1414–1419. [Google Scholar] [CrossRef]
  47. Wilcke, W.; Muller, S.; Kanchanakool, N.; Zech, W. Urban soil contamination in Bangkok: Heavy metal and aluminium partitioning in topsoils. Geoderma 1998, 86, 211–228. [Google Scholar] [CrossRef]
  48. Gil, C.; Boluda, R.; Ramos, J. Determination and evaluation of cadmium, lead and nickel in greenhouse soils of Almeria (Spain). Chemosphere 2004, 55, 1027–1034. [Google Scholar] [CrossRef] [PubMed]
  49. Wu, Q.H.; Leung, J.Y.S.; Geng, X.H.; Chen, S.J.; Huang, X.X.; Li, H.Y.; Huang, Z.Y.; Zhu, L.B.; Chen, J.H.; Lu, Y.Y. Heavy metal contamination of soil and water in the vicinity of an abandoned e-waste recycling site: Implications for dissemination of heavy metals. Sci. Total Environ. 2015, 506, 217–225. [Google Scholar] [CrossRef] [PubMed]
  50. Wu, W.C.; Wu, Y.X.; Wu, J.H.; Liu, X.W.; Chen, X.B.; Cai, X.D.; Yu, S.X. Regional risk assessment of trace elements in farmland soils associated with improper e-waste recycling activities in Southern China. J. Geochem. Explor. 2018, 192, 112–119. [Google Scholar] [CrossRef]
  51. Luo, L.; Ma, Y.B.; Zhang, S.Z.; Wei, D.P.; Zhu, Y.G. An inventory of trace element inputs to agricultural soils in China. J. Environ. Manag. 2009, 90, 2524–2530. [Google Scholar] [CrossRef] [PubMed] [Green Version]
  52. Chen, H.Y.; Teng, Y.G.; Lu, S.J.; Wang, Y.Y.; Wu, J.; Wang, J.S. Source apportionment and health risk assessment of trace metals in surface soils of Beijing metropolitan, China. Chemosphere 2016, 144, 1002–1011. [Google Scholar] [CrossRef] [PubMed]
Figure 1. Location of the study area in China and sampling sites.
Water 10 01716 g001
Figure 2. Distribution of As, Cd, Cr, Cu, Hg, Pb and Zn concentrations along the 0–600 cm soil profiles under different irrigation treatments.
Water 10 01716 g002
Figure 3. The E r i of seven trace elements and PERI values in different soil layers of treatment and control groups.
Water 10 01716 g003
Table 1. Infiltration volume and converted irrigation years of each percolation pond.
TreatmentT1T2T3
Infiltration volume (m3)4952.69962.211,981.5
Converted irrigation years (y)98196236
Table 2. Index of reclaimed water quality.
IndexUnitMax.Min.MeanStandard Limit aStandard Limit b
Electricity conductivity (EC)mS/cm1.2910.9671.13
pH7.96.87.665.5–8.55.5–8.5
CODcrmg/L1341747.43200180
BOD5mg/L10.23.316.6110080
TNmg/L164.859.92
Total phosphorus (TP)mg/L3.310.911.74
Suspended solids (SS)mg/L22121810090
Total saltmg/L8347227781000
Asµg/L25.24.018.5100100
Cdµg/L0.0300.0030.0171010
Crµg/L13.75010.8212.2100100
Cuµg/L2.4600.601.210001000
Hgµg/L0.00840.0020.00511
Pbµg/L1.1630.2990.7200200
Znµg/L249.06.620115.220002000
a Limit value of irrigation water quality for dry farming specified in GB 5084-2005 [19]; b Limit value of urban recycling water quality for farmland irrigation specified in GB 20922-2007 [21].
Table 3. Soil characteristics in the 0–600 cm profiles in the study area.
Depth (cm)pH (min.–max.) MeanClay Content (%) (min.–max.) MeanOM (%) (min.–max.) MeanEh (mV) (min.–max.) MeanTN (mg/kg) (min.–max.) Mean
0–30(7.25–7.71) 7.49(13.5–23.8) 18.9(10.7–14.7) 12.5(250–418) 320(0.46–2.31) 1.27
30–100(7.31–7.64) 7.50(5.5–30.8) 16.2(4.06–11.2) 7.03(254–456) 339(0.07–2.14) 0.79
100–200(7.51–7.95) 7.67(3.0–25.0) 8.1(0.58–7.72) 2.46(250–493) 329(0.02–1.87) 0.48
200–300(7.52–7.89) 7.76(5.5–39) 17.9(1.49–5.86) 4.04(251–422) 340(0.12–1.57) 0.65
300–600(7.78–7.96) 7.88(9.5–46) 22.9(2.63–16.3) 9.34(249–465) 332(0.12-1.63) 0.83
Table 4. Trace element concentrations in different soil layers of treatment and control group; and the percentage of the increase in the concentration of the treatment group when compared with that of the control group, which was marked as δ.
Depth (cm)TreatmentAs (mg/kg)Cd (mg/kg)Cr (mg/kg)Cu (mg/kg)Hg (mg/kg)Pb (mg/kg)Zn (mg/kg)
0–30T1(CK1, δ)10.67 (11.35, −6%)141.00 (145.83, −3%)69.76 (68.73,2%)22.30 (21.76, 3%)33.86 (34.13, −1%)21.48 (21.40, 0%)62.30 (65.77, −5%)
T2(CK2, δ)11.61 (9.91, 17%)161.40 (136.9, 18%)69.78 (69.00, 1%)22.58 (19.21, 18%)42.18 (36.20, 17%)22.35 (21.61, 3%)64.67 (63.63, 2%)
T3(CK3, δ)11.60 (9.87, 18%)153.97 (147.50, 4%)69.68 (68.25, 2%)23.05 (21.02, 10%)41.13 (43.00, −4%)21.99 (21.57, 2%)64.75 (67.08, −4%)
30–100T1(CK1, δ)8.31 (7.62, 9%)89.97 (94.51, −5%)64.30 (63.42, 1%)19.76 (16.39, 21%)14.28 (12.02, 19%)18.48 (18.46, 0%)54.46 (50.46, 8%)
T2(CK2, δ)6.20 (6.23, −1%)77.00 (90.63, −15%)62.05 (70.99, −13%)15.56 (14.50, 7%)12.75 (15.99, −20%)17.47 (18.11, −4%)45.41 (51.06, −11%)
T3(CK3, δ)9.04 (7.85, 15%)104.01 (101.00, 3%)65.28 (71.26, −8%)20.83 (18.14, 15%)28.13 (19.14, 47%)20.06 (19.06, 5%)57.49 (56.34, 2%)
100–200T1(CK1, δ)6.87 (6.79, 1%)68.88 (91.64, −25%)57.11 (65.85, −13%)15.06 (15.15, −1%)10.92 (10.91, 0%)16.25 (17.11, −5%)43.54 (48.58, −10%)
T2(CK2, δ)4.23 (4.06, 4%)64.18 (70.96, −10%)55.59 (68.72, −19%)13.74 (12.40, 11%)7.04 (6.84, 3%)16.98 (17.16, −1%)43.06 (48.20, −11%)
T3(CK3, δ)4.72 (4.36, 8%)65.82 (69.09, −5%)56.00 (65.1, −14%)13.96 (12.51, 12%)8.72 (7.33, 19%)17.08 (16.90, 1%)43.46 (45.34, −4%)
200–300T1(CK1, δ)8.19 (7.86, 4%)97.52 (83.62, 17%)66.99 (60.56, 11%)21.63 (15.90, 36%)14.70 (12.02, 22%)18.42 (16.70, 10%)56.98 (49.18, 16%)
T2(CK2, δ)8.17 (7.79, 5%)88.58 (89.24, −1%)65.08 (69.95, −7%)20.02 (16.90, 19%)13.13 (10.58, 24%)17.84 (17.46, 2%)55.1 (58.42, −6%)
T3(CK3, δ)7.07 (7.27, −3%)85.64 (82.22, 4%)66.94 (63.13, 6%)18.43 (15.74, 17%)11.50 (9.98, 15%)17.91 (17.37, 3%)53.37 (52.90, 1%)
300–600T1(CK1, δ)9.89 (10.53, −6%)121.35 (127.83, −5%)70.08 (72.96, −4%)25.42 (26.54, −4%)-20.32 (20.69, −2%)65.25 (70.24, −7%)
T2(CK2, δ)7.46 (7.11, 5%)93.55 (93.84, 0%)63.23 (64.73, −2%)19.91 (8.55, 7%)16.27 (13.1, 24%)18.23 (17.53, 4%)56.48 (59.59, −5%)
T3(CK3, δ)8.55 (8.47, 1%)117.15 (109.81, 7%)69.60 (69.71, 0%)24.16 (22.24, 9%)16.96 (19.57, −13%)19.97 (19.31, 3%)65.85 (66.64, −1%)
Table 5. Pearson correlation matrix for trace element concentrations and soil properties in soils of treatment and control groups.
Soil PropertiesAsCdCrCuHgPbZn
ClayT10.753 **0.736 **0.717 **0.827 **0.761 **0.739 **0.793 **
CK10.3580.439 *0.2470.426 *0.3630.438 *0.389 *
T20.583 **0.496 **0.583 **0.718 **0.399 *0.529 **0.704 **
CK20.763 **0.468 *-0.1200.868 **0.440 *0.418 *0.771 **
T30.628 **0.599 **0.570 **0.655 **0.482 **0.563 **0.646 **
CK30.678 **0.592 **0.466 *0.730 **0.471 *0.625 **0.697 **
OMT10.757 **0.754 **0.668 **0.729 **0.841 **0.715 **0.759 **
CK10.781 **0.755 **0.643 **0.798 **0.3630.748 **0.809 **
T20.470 *0.559 **0.2370.3520.651 **0.468 *0.364
CK20.491 **0.543 **-0.1360.419 *0.613 **0.567 **0.372
T30.757 **0.803 **0.542 **0.661 **0.728 **0.751 **0.682 **
CK30.835 **0.870 **0.457 *0.810 **0.839 **0.814 **0.815 **
EhT10.1430.0870.2670.1840.1170.1430.157
CK1−0.284−0.320−0.304−0.326−0.210−0.379 *−0.330
T20.1870.1200.442 *0.2630.0410.1270.281
CK20.2830.253−0.1860.388 *0.2480.1460.293
T30.1220.0350.2290.109-0.0110.0850.105
CK30.3580.439 *0.2470.426 *0.3630.438 *0.389 *
* Correlation is significant at the 0.05 level (2-tailed); ** Correlation is significant at the 0.01 level (2-tailed).
Table 6. Pearson correlation matrix among trace elements.
ElementsAsCdCrCuHgPbZn
As1.000
Cd0.882 **1.000
Cr0.567 **0.701 **1.000
Cu0.885 **0.859 **0.664 **1.000
Hg0.694 **0.715 **0.410 **0.591 **1.000
Pb0.844 **0.936 **0.738 **0.875 **0.703 **1.000
Zn0.857 **0.900 **0.777 **0.944 **0.578 **0.896 **1.000
** Correlation is significant at the 0.01 level (2-tailed).
Table 7. The difference in soil PERI between treatment and control groups by paired sample T-test, shown by p-values.
Depth (cm)0–3030–100100–200200–300300–600
T1-CK10.5630.1240.4030.4170.319
T2-CK20.0570.0400.0760.7240.310
T3-CK30.4820.0050.3220.7880.788

