1. Introduction
June 2017 ended with 65.6 million forcibly displaced people and 17 million refugees (excluding Palestinians), with 55% of this cohort originating from just three countries: Syria, Afghanistan and South Sudan [
1]. The challenges are huge, since the average duration of refugee situations is between 10 and 17 years, depending on the calculation method [
2,
3]. Water supply is essential for the survival of human beings, with between 7.5 and 15 L per person per day required for drinking, cooking and personal hygiene [
4]. Two different standards guide the planning of access to water in refugee camps: the SPHERE standards for emergencies [
4] and the United Nations High Commissioner for Refugees (UNHCR) standards for post-emergency situations [
5]. SPHERE recommends 15 L per person per day, a maximum of 250 persons per tap, 500 per hand pump and 500 m between households and water collection points. Meanwhile, UNHCR recommends 20 L per person per day, a maximum of 80–100 persons per tap, 200–300 persons per hand pump and a maximum of 200 m to a waterpoint. Furthermore, the areas where displaced people seek shelter have often limited or no existing water infrastructure [
6], and so authorities and non-governmental organisations (NGOs) find themselves struggling to provide rapid emergency responses, and settlements are likely to remain for years ahead [
7]. A rapid and incremental development of refugee settlements requires tools that can evaluate decisions on multiple timescales.
Life-cycle costing (LCC) and the carbon footprint are common tools used to quantify economic and environmental impacts. LCC is often used to calculate full cost recovery of water utilities in Europe and it is considered an extremely important analysis to ensure the financial sustainability of water supply (article 9 of the EU Water Framework Directive). UNHCR published a method for LCC in post-emergency situations and applied it to two refugee camps, namely Bambasi in Ethiopia and Kounoungou in Chad [
8,
9]. They found very strong differences in the service levels and cost per m
3 of water in the two locations. For example, the investment cost per capita in Bambasi was more than three times larger than in Kounoungou.
Several studies have compared solar and diesel-powered groundwater-pumping systems in developing countries, but not for refugee camps. Diesel systems appear to be more harmful from an environmental point of view [
10] and more expensive than solar if considering a timeframe of 20 years for systems below 19,000 m
3/year [
11,
12] or after 25 years [
13,
14,
15]. The same conclusion has been reached after 10 [
16] or 5 years of operation [
17]. It is worth mentioning that the majority of these studies gathered cost estimates or values from different countries [
14,
15,
16,
18]. Two relevant studies in similar geographical areas (South Sudan and Uganda) found that a diesel-powered system was more expensive than a hybrid system (diesel + solar) after 3 years of operation [
19] and a solar-powered system after only 0.9 years [
18]. However, only [
8] highlighted the differences between short-term and long-term results.
There is a lack of consistency in the way sustainability is addressed when comparing water supply systems. The three pillars of evaluation (i.e., economic, environmental and social) and several types of multi-criteria analysis have been used, but the topic is still under development. Each study includes different parameters for comparison and different ways of aggregating them. For example, 7 environmental impacts, a cost-benefit analysis and 5 social impacts were included by [
20]; 5 sub-indicators (e.g., financial management, consumer satisfaction) each quantified with 8–15 questions were included by [
21]; and 6 dimensions (social, economic, environmental, institutional/legal, skills/knowhow, technical) and 3 perspectives (user, provider and investor) were addressed by [
22]. In addition, it differs whether sustainability was considered in the planning phase or based on actual observations of already implemented solutions. Stakeholder involvement has been used both for questionnaires and for ranking water system parameters [
20,
21,
23], but it is not commonly used in emergency situations.
To address some of the shortcomings of earlier studies, we conducted detailed LCC and carbon footprint analyses, using real-life data, assuming different timeframes and highlighting which assumptions contribute most to the results. Our sustainability analysis included both traditional (LCC and carbon footprint) and additional tools (risk of groundwater scarcity, end-users’ questionnaire and water quality), and we combined all the results in a qualitative manner for a general conclusion.
1.1. Background in Uganda
Uganda has a long tradition of hosting refugees, and its policy is described in Uganda’s 2006 Refugee Act and the 2010 Refugee Regulations whereby refugees are not hosted in gated refugee camps but in open settlements. They have access to education and basic services, as well as the right to work and move. To minimise potential conflicts, 70% of available resources are dedicated to the host communities and 30% to the refugees, excluding food distribution [
24]. Unlike other refugee situations, the Ugandan government seeks to use emergency funds to build long-lasting infrastructure that can be used by locals in years to come. These principles are supported by national guidelines on building water supply systems in the West Nile region (
Supplementary Material A.1).
This paper focuses on the South Sudanese refugee settlements in northern Uganda. South Sudan was formed after a referendum held in January 2011. The South Sudanese civil war started in December 2013 and has resulted in more than 2 million refugees of which over 1 million were hosted by Uganda by the end of 2017 [
25]. A list of emergency response stakeholders in Uganda can be found in [
26] and in
Supplementary Material A.2.
Our study used data collected mainly from three refugee settlements in the north-western region of Uganda called the West Nile region (
Supplementary Material A.3): Bidibidi, located in the Yumbe district, and the Rhino and Imvepi settlements, both in the Arua district. In these settlements, water is supplied by hand pumps, motorised systems and water trucking (
Table 1). Trucks convey water from natural artesian springs, high-yield diesel-powered boreholes and surface water treatment plants (
Supplementary Material A.4). Water trucking is the most common way of supplying safe water during an emergency, as it is highly flexible and rapidly available, but also very expensive, challenged by muddy conditions during the wet season and has, in general, a negative impact on road conditions [
27]. For these reasons, many NGOs are undertaking efforts to phase out water trucking in Uganda [
28].
For the two districts of Arua and Yumbe, outside the refugee settlments, the majority of water comes from deep boreholes and natural springs, while piped distribution is quite rare [
30]. The fact that in both districts around 10% of water sources are non-functional due to low yield, technical breakdown, and low water quality highlights the importance of considering long-term sustainable water sources.
1.2. Study Aim
Our aim was to provide a framework for the evaluation of options for water supply in new refugee settlements. The framework was demonstrated for the refugee settlements in the West Nile region of Uganda. We evaluated alternative options for water provision currently considered by NGOs in the refugee settlements studied. The methodology and the results of our study should help decision-makers understand sustainability in emergency contexts and highlight the best value for money. To ensure a broad evaluation of the sustainability of water provision, we developed a method that would investigate the following:
End-user demand and their expectations of a water supply system;
Economic costs of all technical components of different alternatives for water supply, including hand pumps, motorised pumps (diesel, solar and hybrid) and water trucking;
Carbon footprint of the alternatives for water supply;
Freshwater availability and vulnerability to water stress;
Critical system point review in terms of safe water quality.
2. Materials and Methods
Our comparative study of different water supply systems is built on several different evaluations: an end-user survey, life-cycle costing (LCC), carbon footprint, freshwater assessment and hazard analysis and critical control points (HACCPs) (
Table 2).
2.1. Alternative Water Supply Systems and Data Collection
Data were collected during two field trips in 2017 stretching over two weeks in May and one month between November and December. On these occasions, several stakeholders were interviewed and surveyed: the Danish Refugee Council (DRC) water, sanitation and hygiene (WASH) experts, other NGOs working with water supply, such as Red Cross Uganda, OXFAM and Water Mission, systems operators (at the borehole, responsible for chlorination etc.), the private suppliers of the water systems, water committees and end-users.
The quantitative comparisons are based on a functional unit of 1 m
3 drinkable water delivered to end-users. In the LCC and the carbon footprint assessment, we compared 26 alternatives for water provision, covering manual hand pumps, motorised systems (solar, diesel and hybrid) and water trucking (
Table 3). Each alternative represented a possible water supply system including the borehole drilling, the installation and operation of the pump and the distribution system (water tanks, pipes and taps or water trucking). We modelled several motorised boreholes with different pumping yields (i.e., 2, 5, 10, 25, 50 m
3/h), in order to reach conclusions that were independent of the individual technical characteristics (e.g., the length of the pipes, the topography of the area, the population density). Four power systems were modelled: solar (pumping for 7 h), short-running diesel (pumping for 7 h with the same water demand as solar), long-running diesel (pumping for 10/12 h with a higher water demand than solar), and hybrid (pumping 7h with solar and the remaining with diesel, having the same water demand as the long-running diesel). Alternatives are described in
Table 3 and
Supplementary Material A.5. The pumped water was always treated with chlorination, except for the case of hand pumps. The solar-based systems were actual designs made by DRC using the SPHERE standards.
Water trucking was modelled in two ways: (1) assuming that the water source was a diesel-powered generator pumping water from a 25 m3/h borehole for 12 h a day (25_Dl); and (2) assuming a no-cost water source (best-case scenario as in the case of the artesian spring). On average, each water truck was assumed to distribute 25,000 L of water and to travel 14 km per trip (based on data collected during the field trip).
By contrast, for the end-users survey and HACCP, the comparison was made between hand pumps (manual pump), motorised systems (solar or diesel), and water trucking. The analysis of the water stress mainly analysed the groundwater availability.
Each water system was defined by a set of system components (
Supplementary Material A.7): “Borehole” (e.g., excavation, screen casting, cement grouting), “Site” (e.g., security fencing, gate, guard’s house, generator plinth), “Pump” (e.g., submersible pump, solar panels, metallic structure, inverter and generator) and “Distribution” (e.g., excavation and pipe laying, taps, steel storage tanks).
2.2. End-Users Survey
A questionnaire survey made in collaboration with DRC investigated the context of water use among South Sudanese refugees in Uganda. In May 2017, 400 households in Zone 1 of the Bidibidi settlement were surveyed as a representative sample of the total population of 51,000 people in that zone. The survey (
Supplementary Material A.8) included the following topics: demographic data and identification of each household’s water source, quantification of water demand and water use, means for water collection, water use patterns, perceived quality of water, time spent at the pump, and distance and time spent travelling between the household and the water source. Results were compiled into a spreadsheet for data processing and analysis, including the statistical significance of the results for different water sources.
2.3. Life-Cycle Costing (LCC)
LCC should answer the questions: (i) Are solar systems financially feasible for investors and the UN in emergencies? (ii) How many years does it take for solar-powered systems to be cost-effective, when compared to other water supply systems? (iii) Is an exit strategy possible for NGOs?
The methodology for life-cycle costing was inspired by the methodological report on the cost of water services in refugee settlements published by UNHCR [
8]. In general, LCC should cover all of the life phases of a product (design and financing, construction and commissioning, operation and maintenance (O&M) and disposal) and all associated expenditure (capital investment, minor and major operation, maintenance and management-related expenditure). As in [
8], this study did not include the expenditures covering management, because it was not possible to isolate them from the general budgets of NGOs. Similarly, the disposal phase was not included, due to its uncertainty.
We calculated the net present value (NPV) for 10 different timeframes ranging from 1 to 10 years of operation, to compare systems from both short- and long-term perspectives:
where
CAPEX (USD) is capital expenditure,
OPEX (USD) is operational expenditure,
i is the discount rate and
t is the timeframe.
We decided to limit our calculations to 10 years because donors (e.g., UNHCR, United Nations Children’s Fund (UNICEF)) manage funding from a very short-term perspective, i.e., a few years rather than many. We also analysed the first year costs (in terms of both CAPEX and OPEX) because it represents what is often covered by external sources.
We calculated the NPV per m
3 of water delivered and this unit cost reflects the price setting for the final consumer in order to achieve full cost recovery in the timeframe
t. Full cost recovery means that in each timeframe (
t) the sum of the expenditure (CAPEX and OPEX) is equal to the sum of revenues. Detailed calculations can be found in
Supplementary Material A.9. The unit cost was compared to the existing water fees in the host communities (
Supplementary Material A.10). An exit strategy is possible for NGOs if the unit cost of water is lower than the average water fee, meaning that the refugees could afford these systems once the situation normalises. The year in which an alternative water option becomes cheaper than another alternative was defined as the breakeven year.
NPV, is affected by the chosen discount rate (
i). However, the concept of discounting money spent in the future is challenging in our case, because NGOs usually have easier access to funding in the early stages of an emergency compared to later stages. For this reason, three discount rates were tested in the study: 0% to model the case in which future money is affected by the risk of not getting it (baseline), 12% as the average of the last 10 years’ real interest rates found for Uganda [
31], and 6% as a value between the two.
All capital expenditure (CAPEX) and the design of the solar-powered systems were based on real systems designed by DRC for refugee settlements in the area, while the hybrid and the diesel-powered systems were modelled as potential substitutions for solar-based pumping (
Supplementary Material A.5). For example, we modelled the diesel-powered system having a pumping yield of 10 m
3/h using the same data as the 10 m
3/h solar-powered system, but changing the distribution length in case the annual water production was higher than for the solar limited by daylight. O&M activities (
Supplementary Material A.6) included yearly operation (chlorine and diesel consumption, salary for guards and pump attendants, cleaning of the steel tanks), yearly maintenance (oil change, change of the filters, generic costs, contingencies) and major maintenance (replacement of the submersible pump, of the inverter, of the switch and of the generator).
We tested the robustness of the results in scenarios with varying parameters between a minimum and a maximum value for the lifetimes of the inverter, the submersible pump and the generator, the diesel consumption, and the cost of diesel and solar panels. Because DRC already installs 1.5 times the panel area needed in order to enhance pumping we assumed the yearly loss of solar panel efficiency negligible (0.8% per year in average [
32]).
2.4. Carbon Footprint
We conducted an environmental analysis to quantify the impact on climate change of the different water supply systems. Emissions were converted into CO
2-equivalents using characterisation factors published by the Intergovernmental Panel on Climate Change (IPCC) [
33]. The inventory included all relevant activities involved in construction (i.e., drilling, pump, fencing, street lighting, generator, solar panels, tanks, structures for solar panels and steel tanks, excavation, water distribution systems) and operation and maintenance (i.e., chlorine, diesel, oil, replacing system components). The processes were based on the database ecoinvent [
34]. As in the LCC, disposal was not included, due to its high uncertainty. The unit kg CO
2-eq per m
3 of water delivered was calculated by summing all the emissions up to the year
x and then dividing for all the m
3 of water delivered from the first until the year
x. The carbon footprint was performed coherently with LCC (
Supplementary Material A.11).
2.5. Freshwater Assessment and the Hazard Analysis and Critical Control Point (HACCP) Approach
The sustainability of water supply systems is dependent on long-term water availability, which, for the Yumbe region, was reviewed based on the current AWaRe method and recent hydrogeological surveys of groundwater availability [
35,
36].
Finally, we performed hazard analysis and critical control point (HACCP) (
Supplementary Material A.12) approach to analyse the main risks surrounding water quality and to identify the critical control points of hand pumps, motorised systems with distribution piping and water trucking.
3. Results
3.1. End-Users’ Survey
The survey displayed the context of water use and investigated the challenges in accessing water. The survey results reflected the perceptions of the participants, and it was not attempted to validate all results through actual observations and measurements.
Supplementary Material A.13 contains detailed results of the end-users survey.
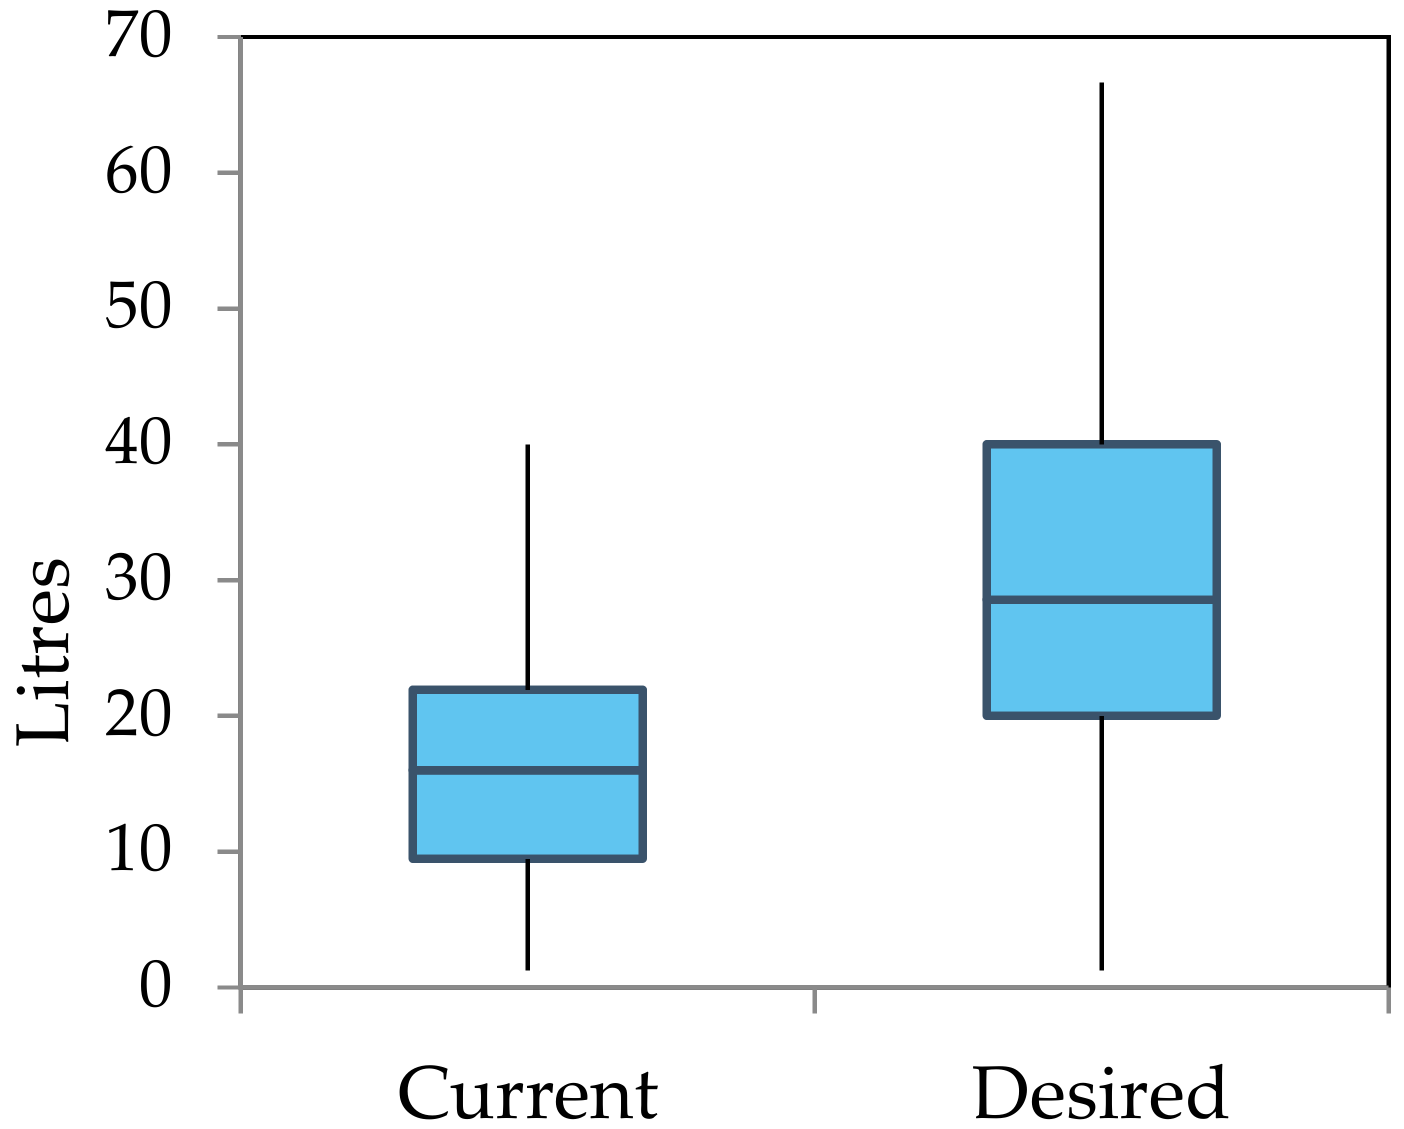
The outcomes confirmed that mainly women (68%) and children (26%) were responsible for collecting water and that peak water demand was in the morning (80% for use and 70% for collection). The average water use was nearly 18 L per person per day, but almost 50% of the interviewees declared to have less than 15 L available per day (
Figure 1); 40% lived more than 500 m away from a water source, and 55% had to wait for more than 60 min while at the water source. Refugees would like to have more water for growing crops and breeding animals and to make construction materials.
Only half of the interviewees thought that the water was of good quality: taste of chlorine was the major issue for 20% of the refugees using tapstands, whereas 30% were dissatisfied with the colour of the water and the 45% had an issue with the presence of salt. In addition, some refugees stated a preference for hand pumps for drinking water, due to the absence of chlorine.
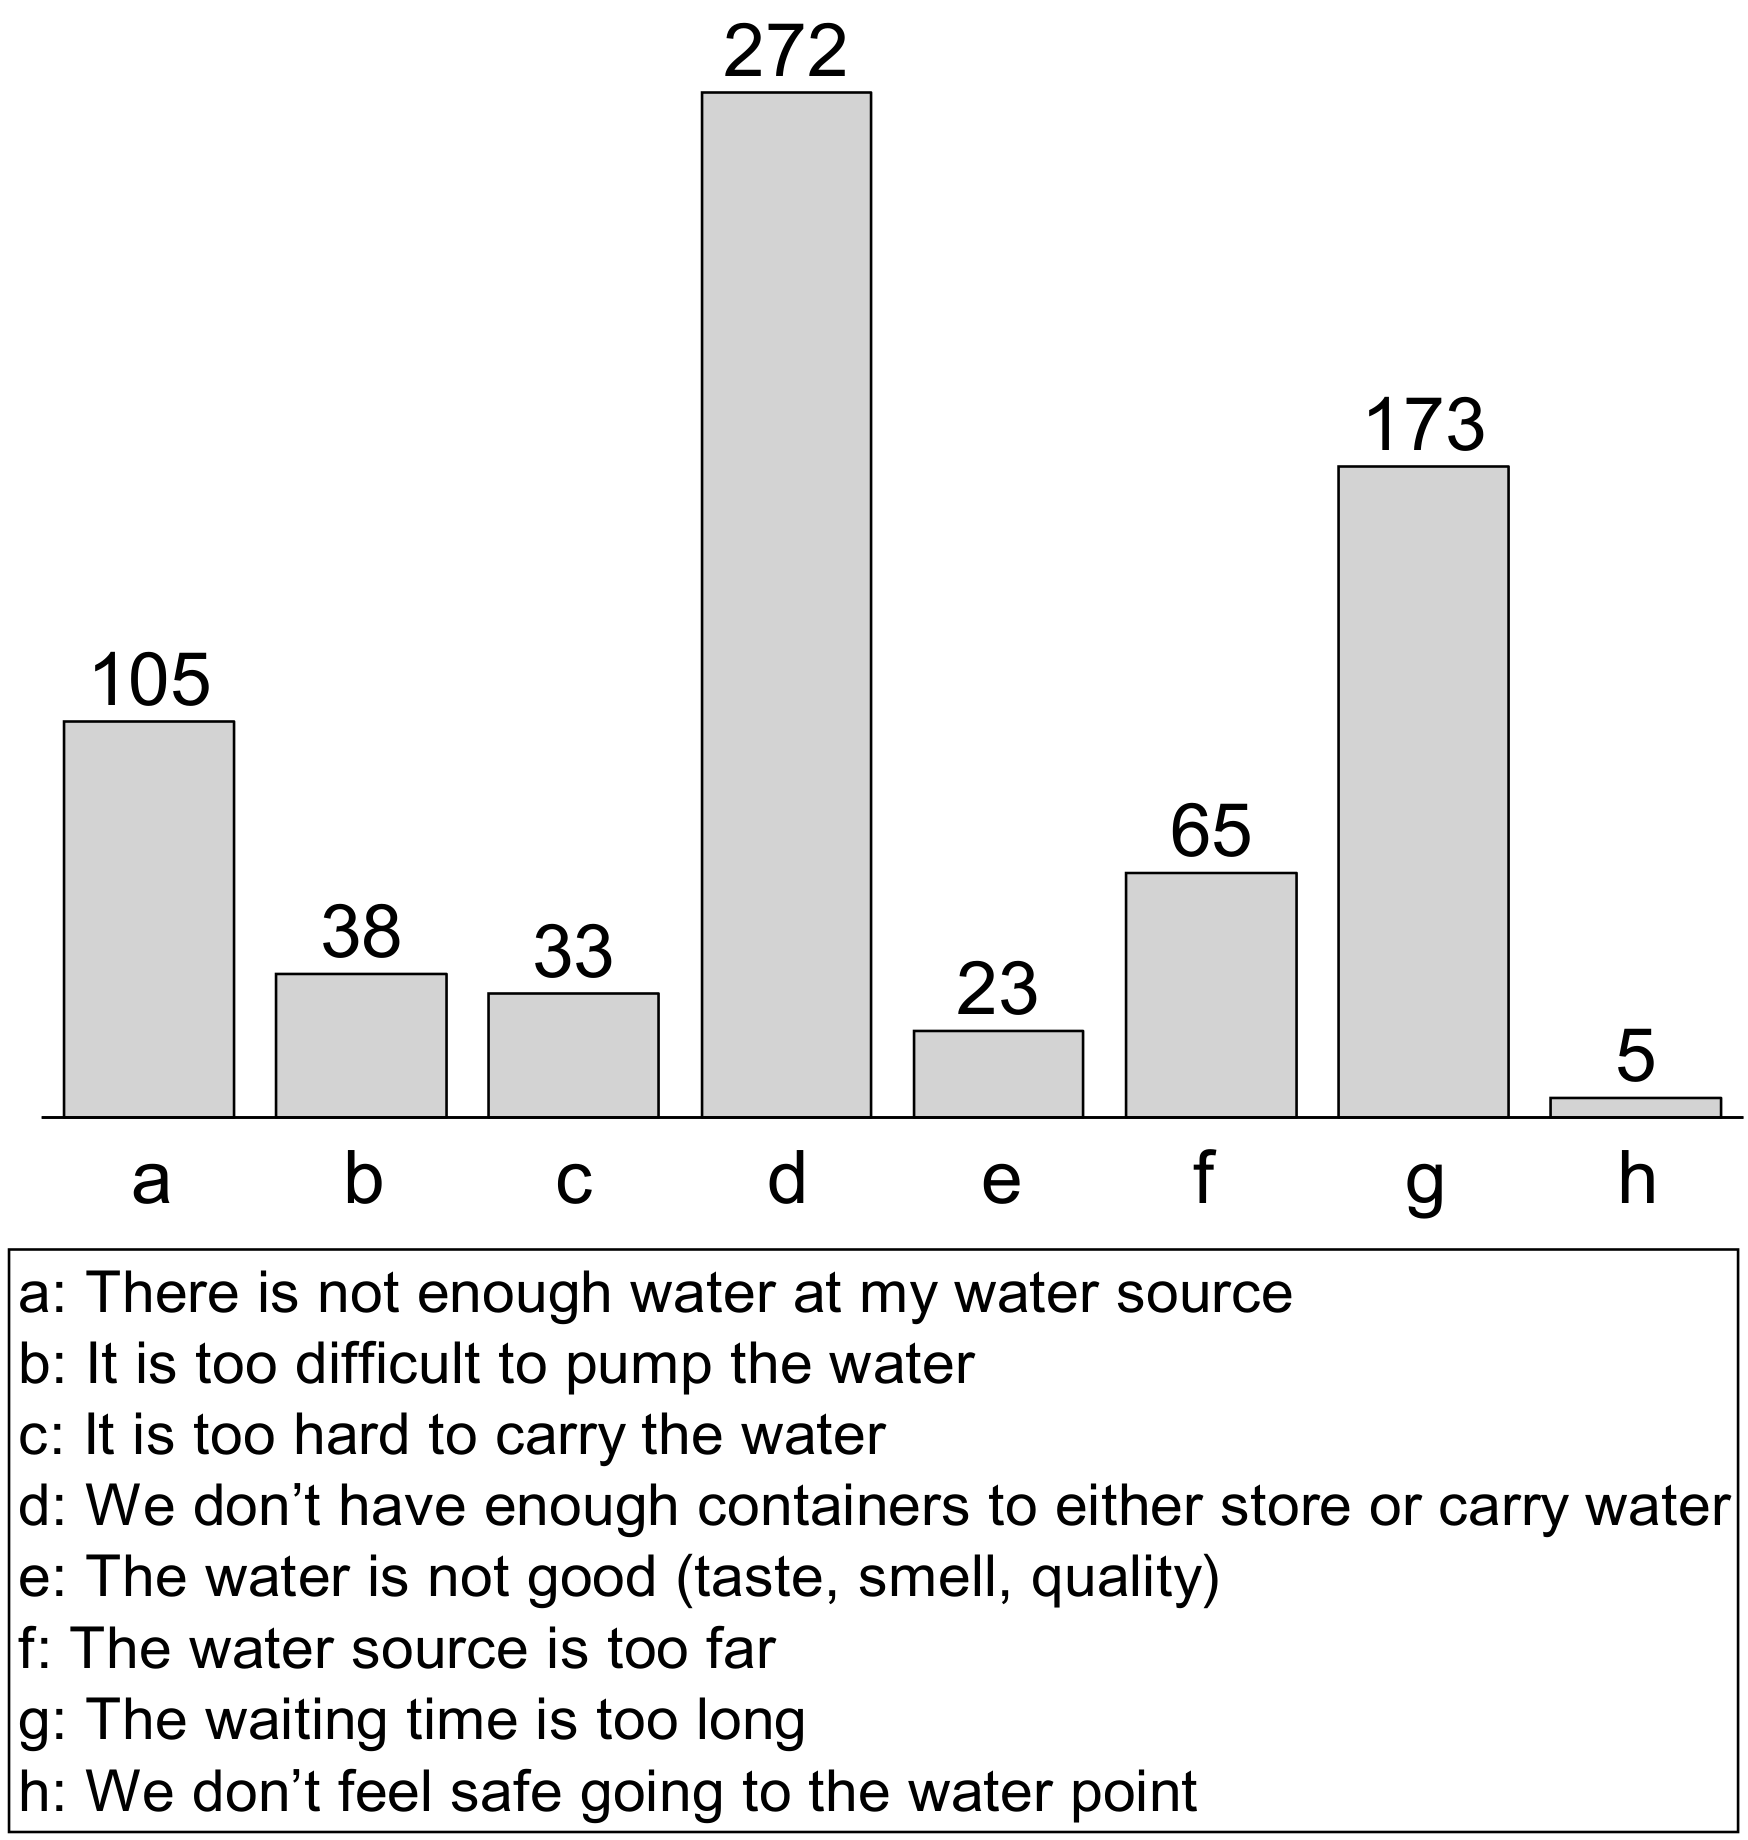
Three major reasons for the insufficient access to water covered 75% of the answers (
Figure 2): not enough jerry cans to either store or carry water (lack of containers), too long queuing times and not enough water available at the source.
3.2. Life-Cycle Costing
This section first describes capital and first-year expenditure relevant for the emergency response actors and operational costs relevant for the long-term support of the water systems.
3.2.1. Capital and First-Year Expenditure
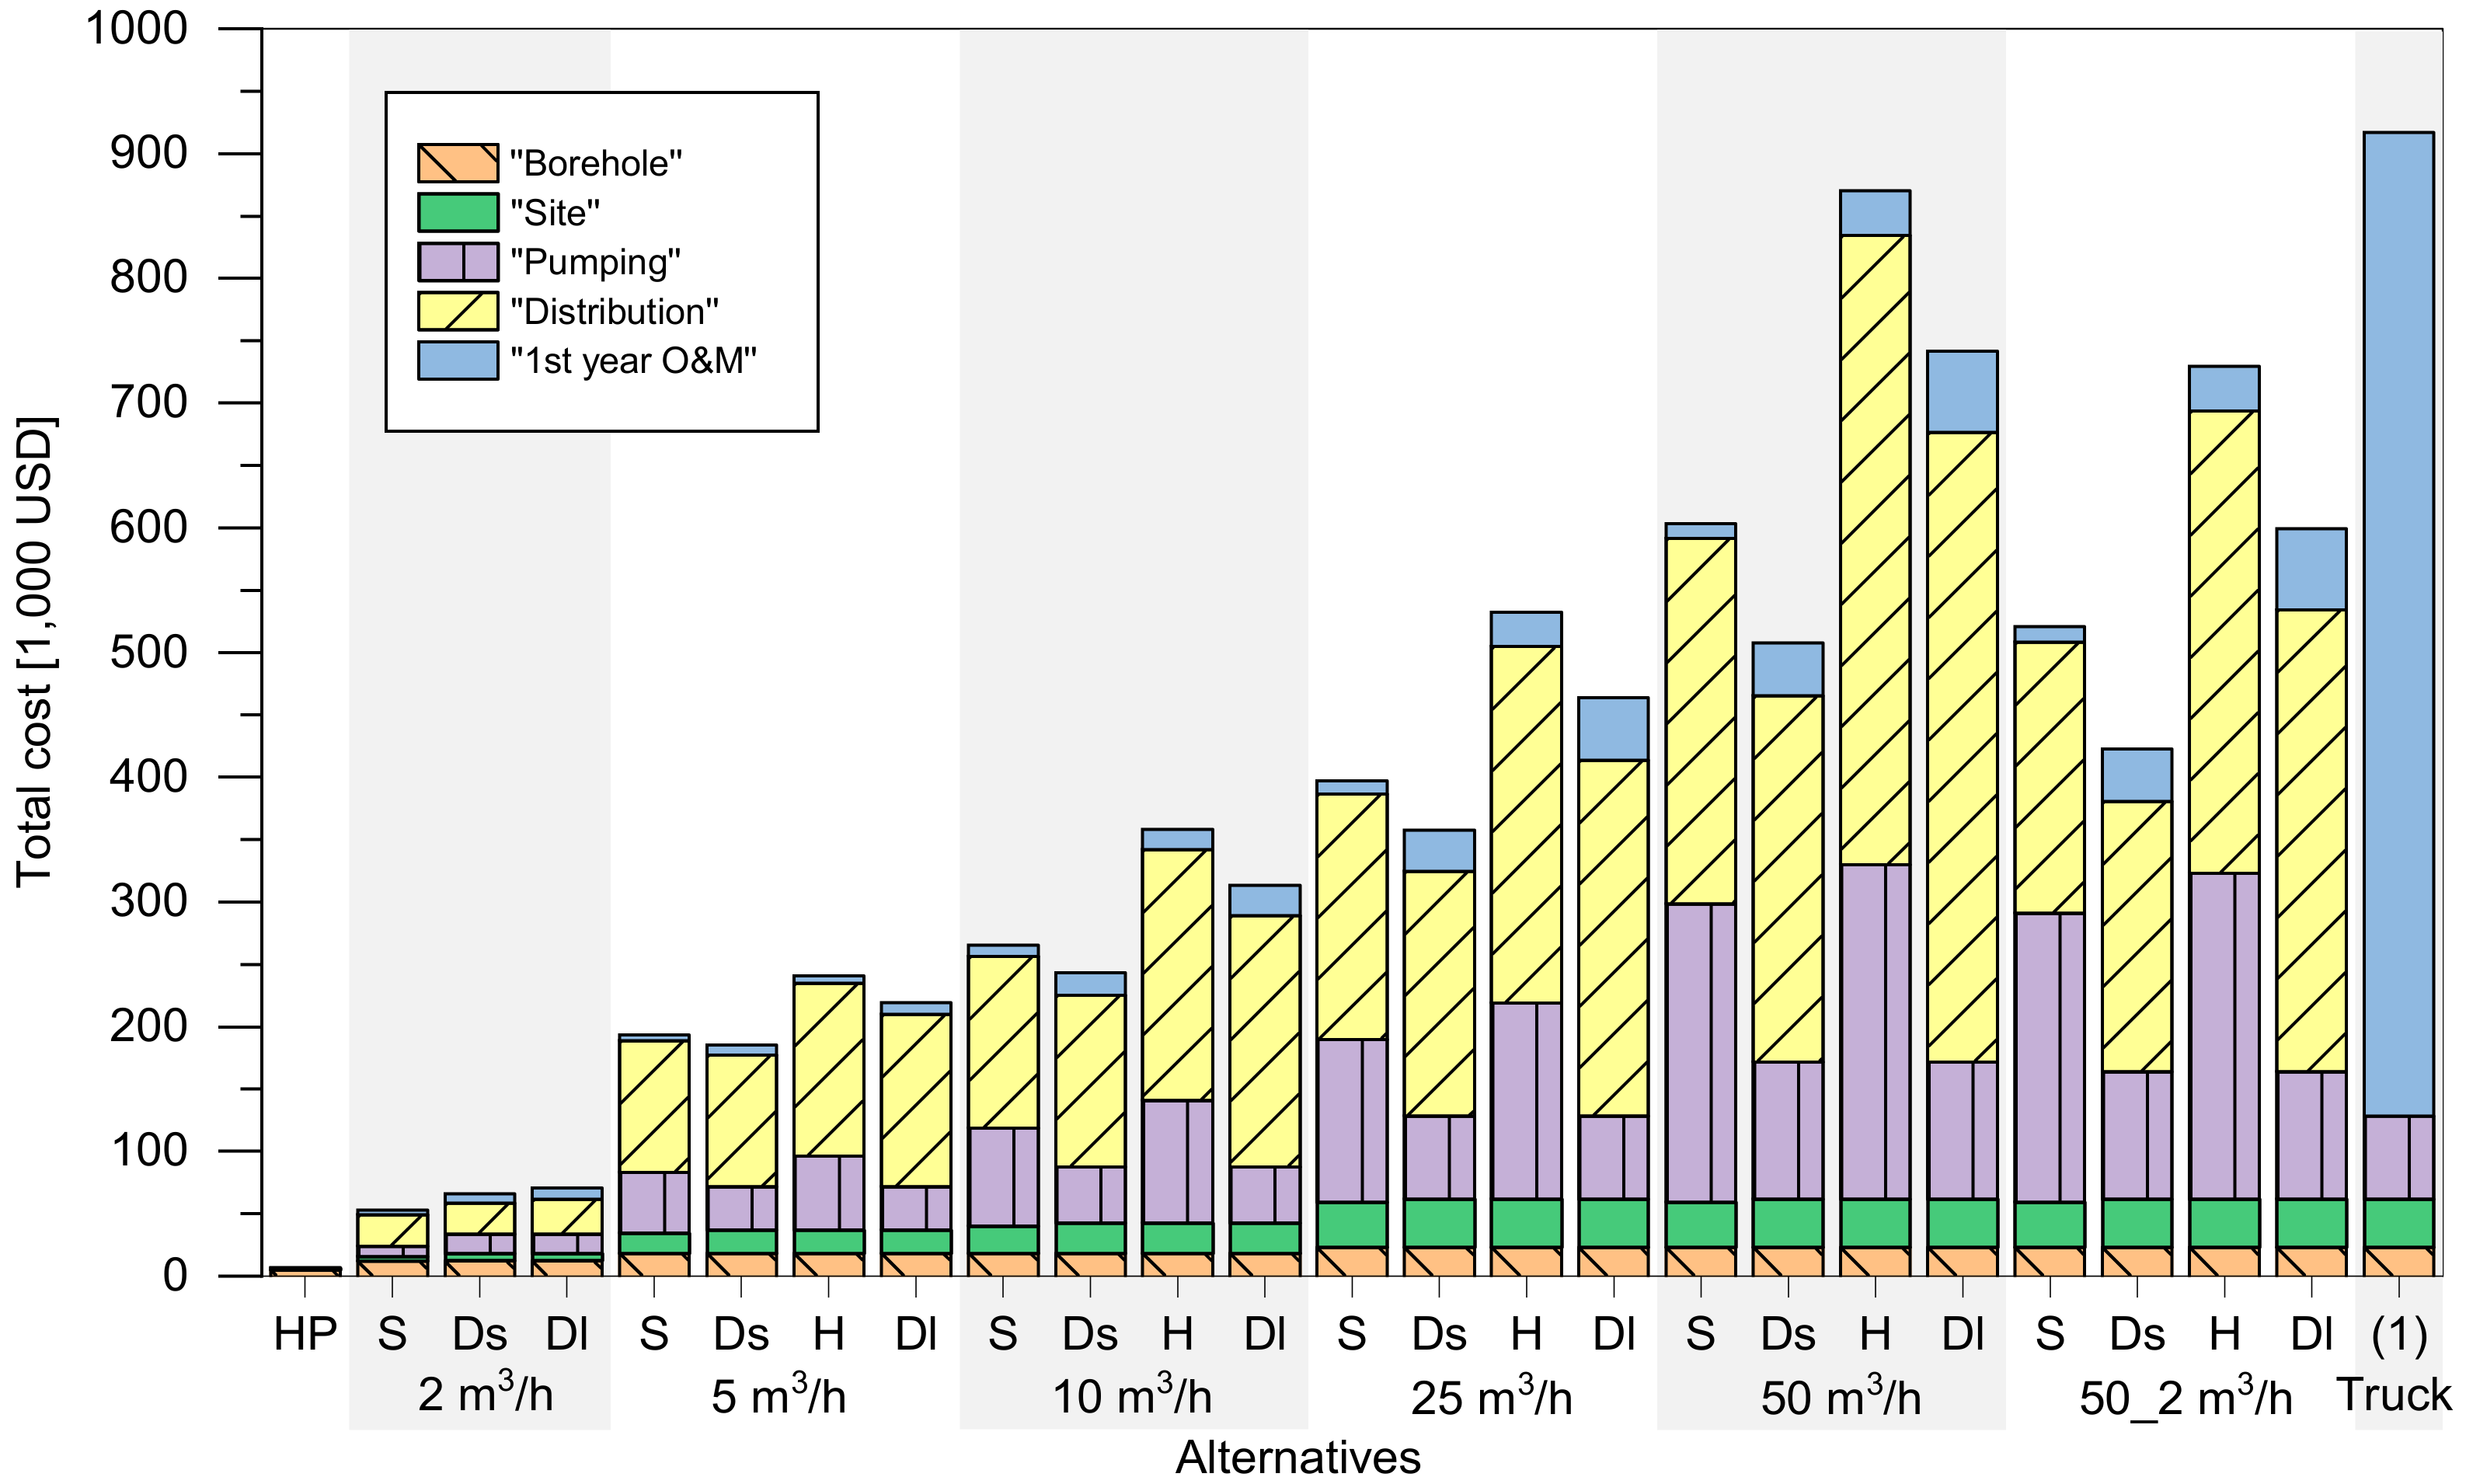
Organisations installing water supply systems had CAPEXs between 7,000 USD for building a hand pump providing 7.5 m
3 of water per day (HP), to above 800,000 USD for a hybrid system providing 600 m
3 of water per day (50_H) (
Figure 3). The results show how assuming a linear proportion between costs and one parameter (e.g., amount of water pumped) can be misleading. In fact, several parameters affected the results: the yield and the depth of the different boreholes, daily pump operation time and the length of the distribution system (for motorised boreholes). The length of the piping and the capacity of storage tanks depends on the topography of the area and on the population density—two parameters highly variable in the visited settlements. For example, the distribution length varied from 2000 m to more than 7000 m for the two solar systems with a pumping yield of 50 m
3/h.
Even within the same capacity category, costs encountered during the first year of operation varied considerably (
Figure 3). For example, building and operating a water system for one year with a yield of 50 m
3/h for 7 h can cost from 420,000 USD (3.31 USD/m
3) in 50_Ds2 to 604,000 USD (4.72 USD/m
3 in 50_S. In general, “Borehole” and “Site” costs were not marked contributions to the first-year expenses (excluding the hand pump). On the other hand, “Pump” contributed markedly to overall cost in solar-powered systems (between 25% and 45%) and similar or less in hybrid (between 25% and 36%) and diesel-powered systems (between 14% and 19%). As expected, “Distribution” was the single largest contributor in all alternatives (37% to 68%), owing especially to the high costs of establishing the transmission and distribution pipes with steel storage tanks. Notably, water trucking exceeded the first-year expenses for all considered alternatives with around 6.7 USD/m
3 spent on just the transport of water from a source to end-users.
3.2.2. Costs Over Time
The unit cost indicated how much each m
3 of water should cost to obtain full cost recovery for a given system lifespan.
Table 4 shows the unit costs per m
3 in the third, fifth and tenth years of operation. Unit costs were found as total costs divided by total amount of water provided for the considered timeframe.
Calculating the cost of water depends markedly on the expected lifetime of the systems: after 3 years of operation, the unit cost of the motorised systems was between 1.1 and 5.5 USD/m
3, while after 10 years it was between 0.51 and 3.1 USD/m
3 of water. NPVs for varying timeframes expose the potential loss if a system fails or is abandoned before time. The unit cost increased by 31% to 47% by shortening the lifetime from 3 to 2 years of operation. This is a relevant consideration, since 27% of the non-functional boreholes in the host community of the Yumbe district has been abandoned due to low yield [
30], probably because of improper location or drilling depth.
Hand pumps appeared to provide the cheapest unit of water (
Table 4), comparable only to the 50 m
3/h systems. On the contrary, water trucking was always very expensive and only meaningful during the first few months of the emergency, since its costs were already higher than providing water from the 25 and 50 m
3/h boreholes during the first year of operation. To provide 15 L per person per day to 20,000 persons for 10 years, NGOs would have to spend around 833,000 USD on a 25 m
3/h hybrid system with distribution pipes and more than 8 million USD when transporting water with trucks. A fixed water installation is economically preferable for any situation with a timeframe beyond a year.
When including CAPEX, only the 50 m3/h alternatives achieved a unit cost lower than the local water fee of 0.83 USD/m3 after 5 or 8 years, dependent on configuration, and the 25 m3/h solar and hybrid options needed more than 9 years of operation to reach a similar result. Even the hand pump needed to be in operation for more than 5 years to be able to reach such costs. All other alternatives were more expensive when considering up to 10 years of operation and full cost recovery of investment would need longer timeframes.
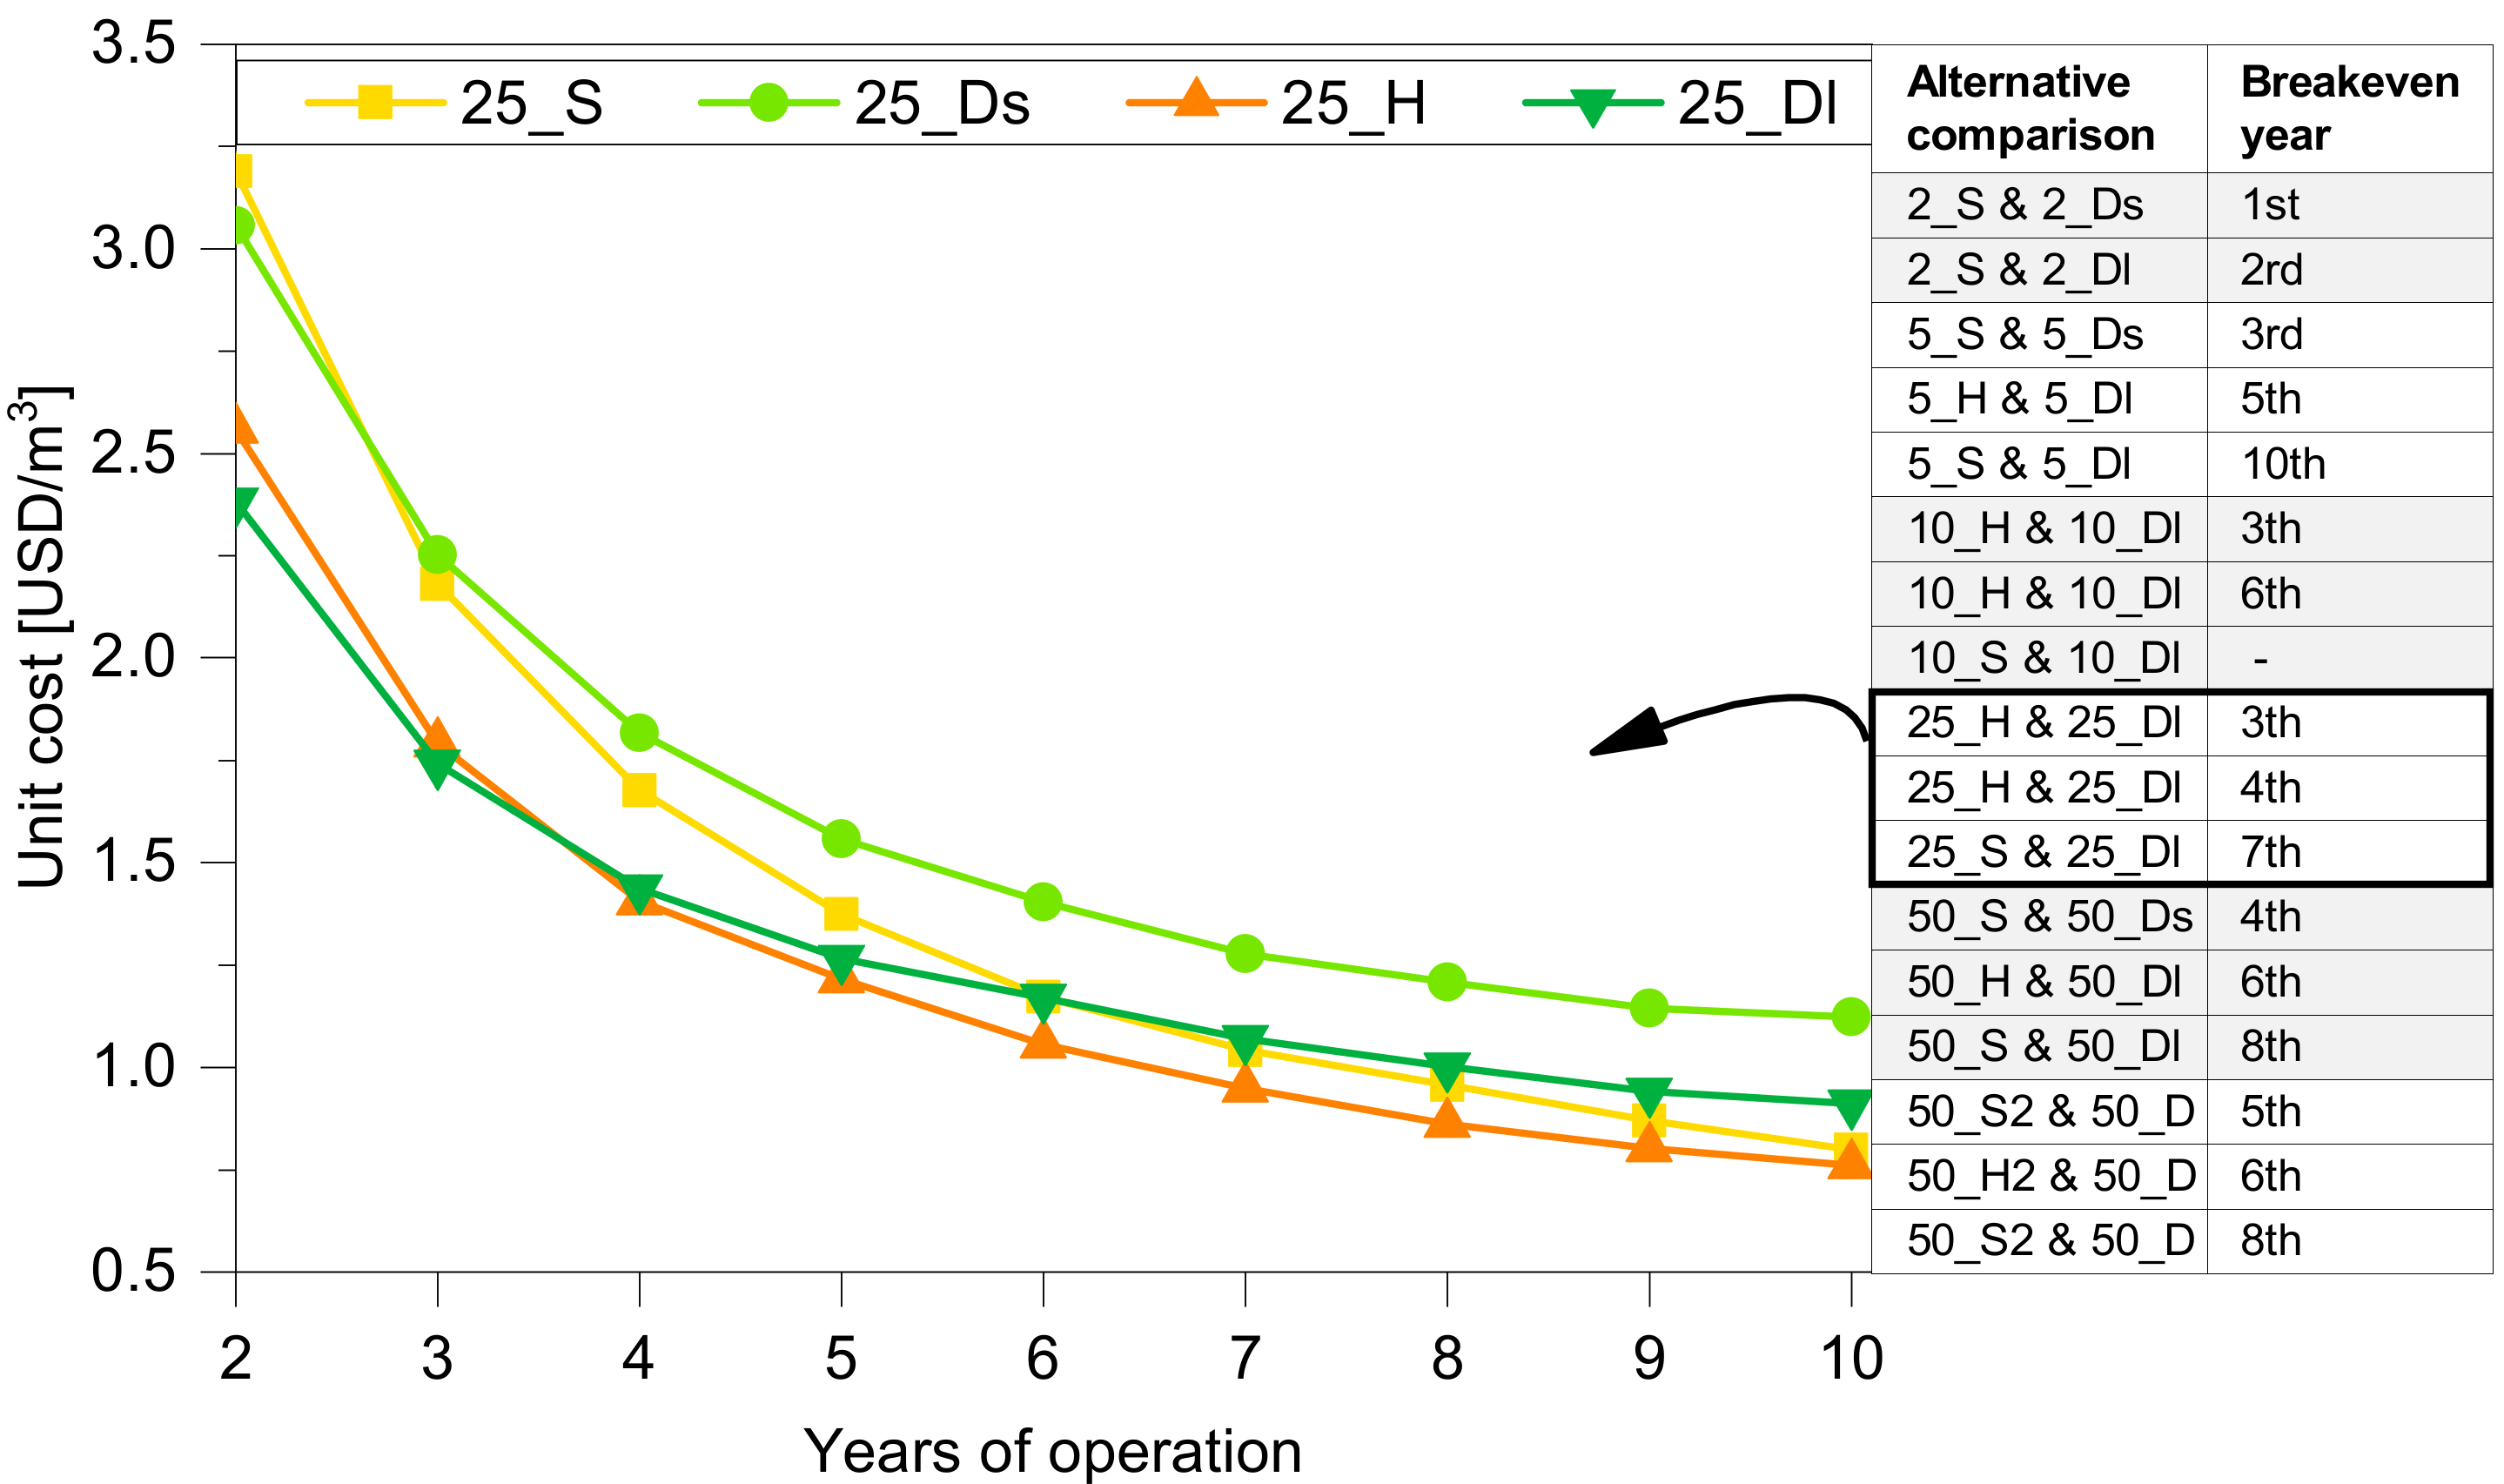
Unit cost allow finding the breakeven years among different power solutions (
Figure 4). The breakeven year depended on systems compared: the solar systems had to run 3–5 years to be cheaper than the short-running diesel, while the hybrid needed 4–6 years to overtake the long-running diesel. In general, it was cheaper to run the diesel generator more than 7 h per day, and the hybrid systems were preferable over the solar system and the short-running diesel.
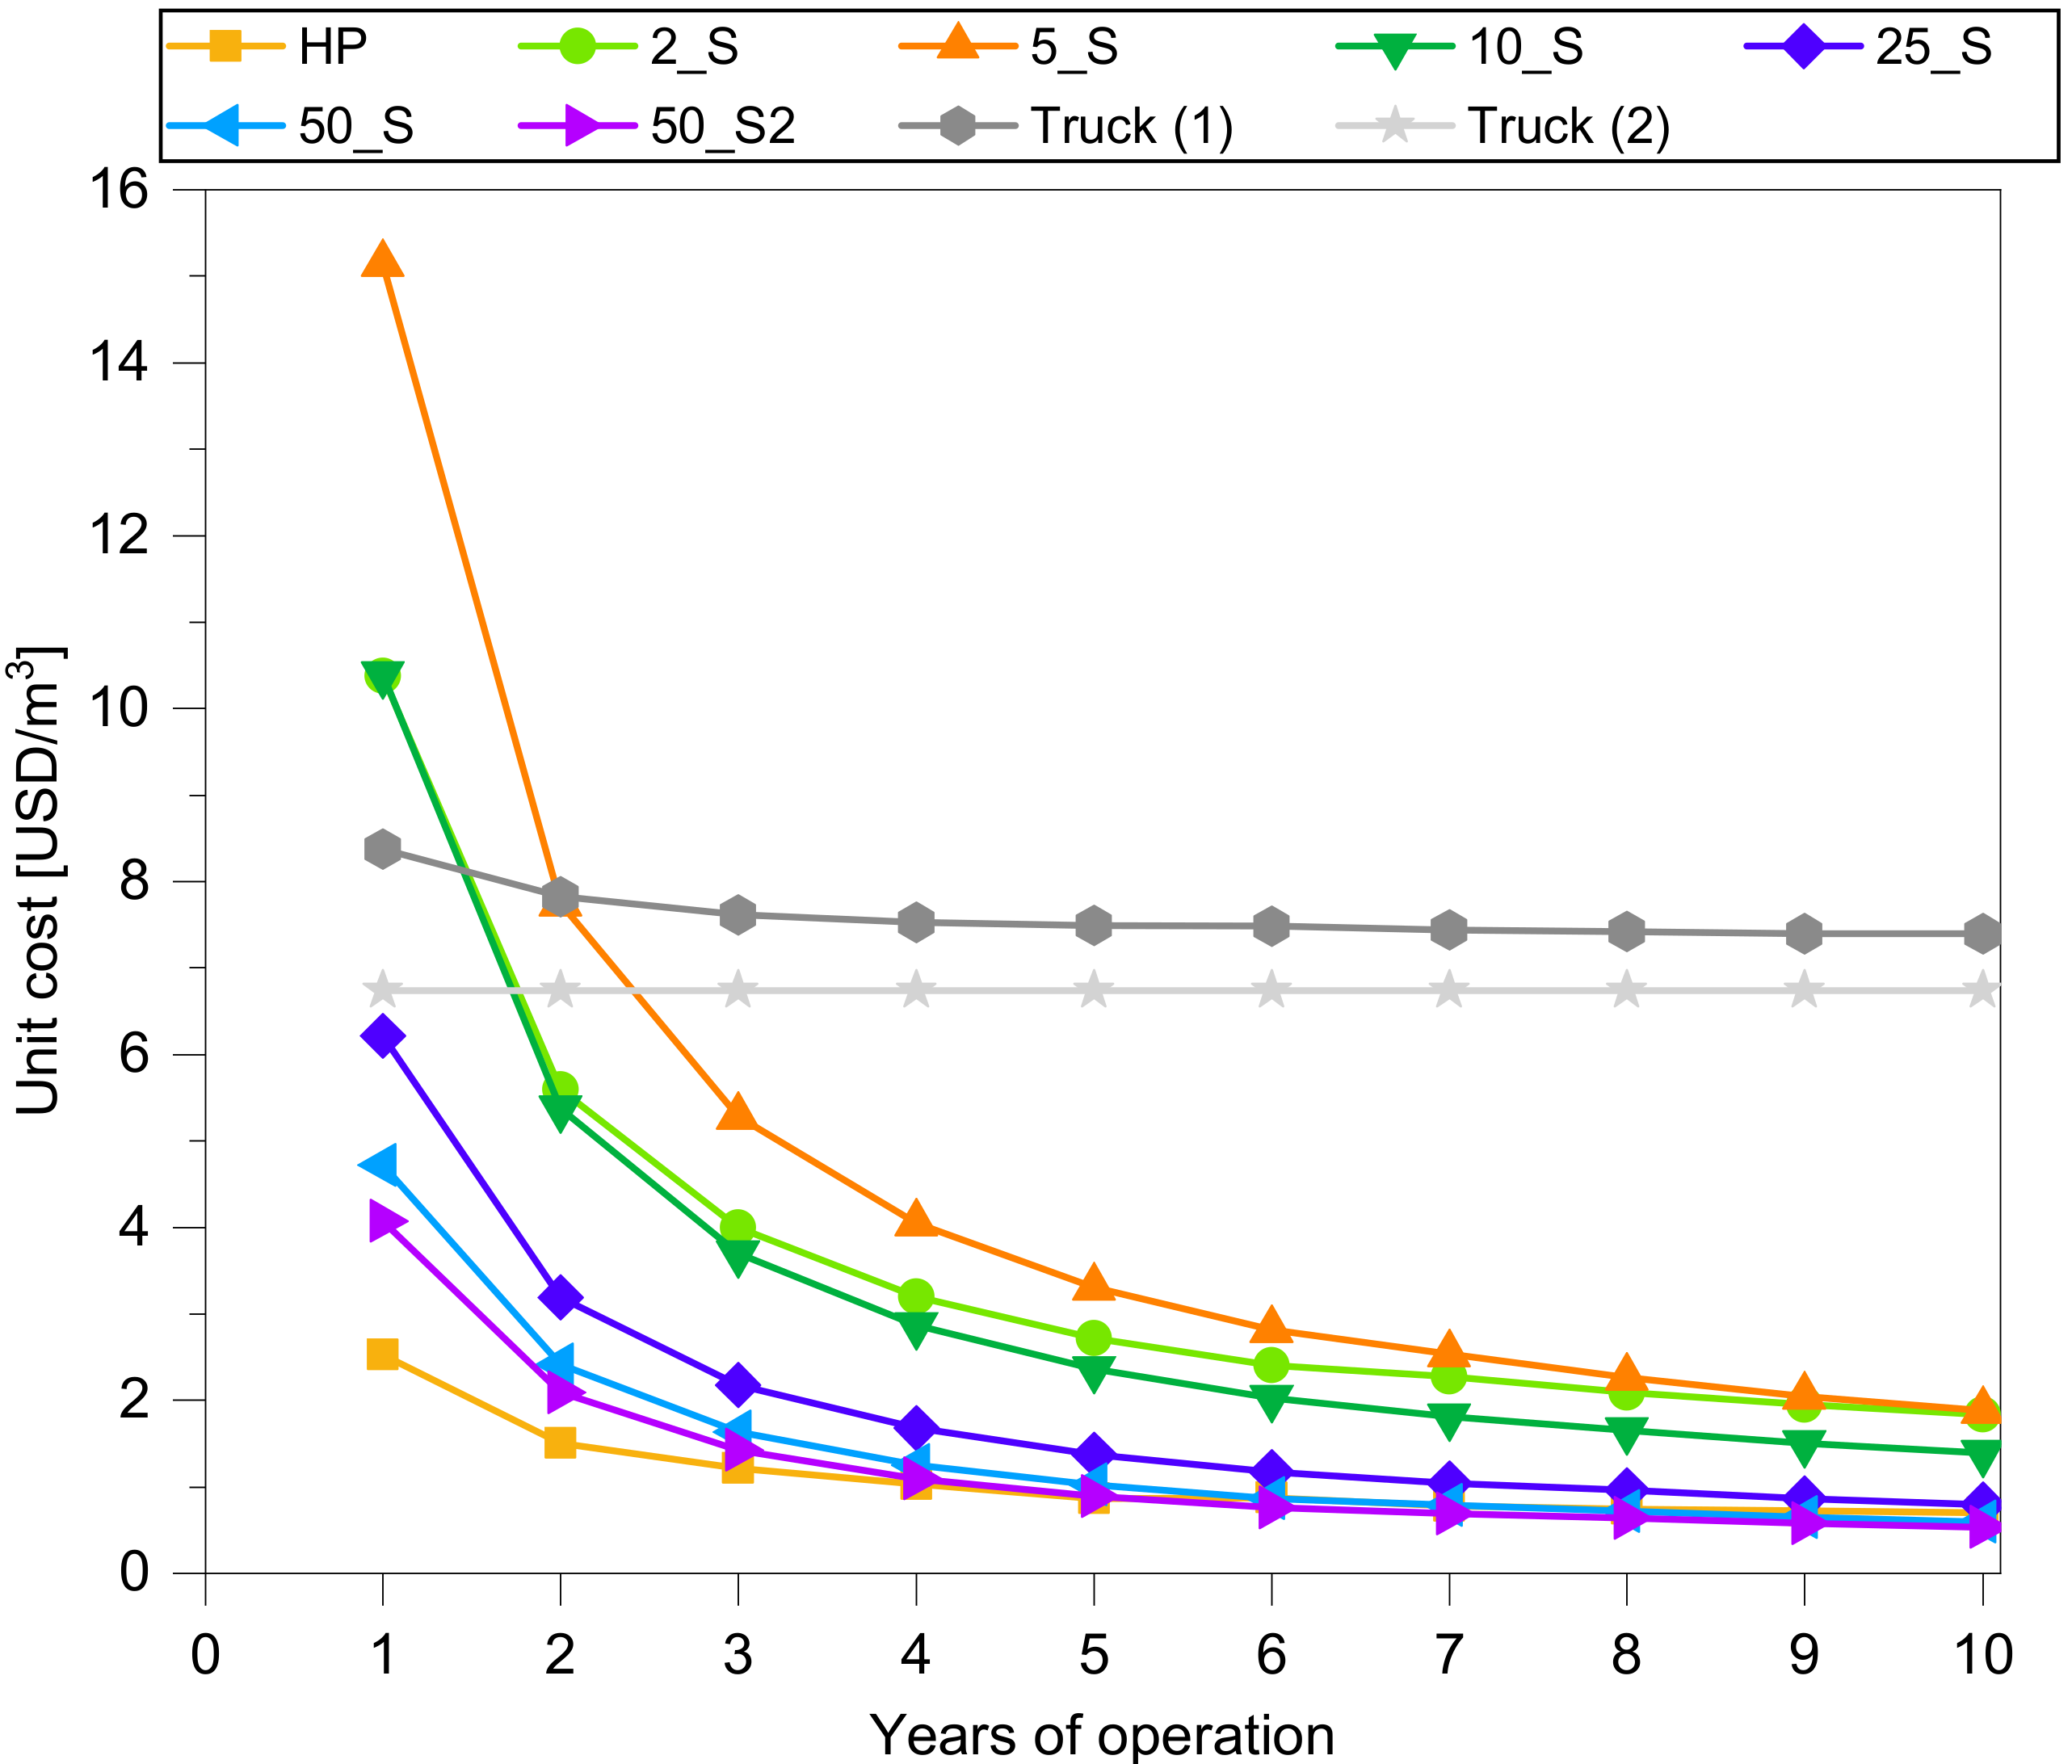
As seen in
Figure 5 and
Supplementary Material A.16, economies of scale affected all observed systems, in that as the capacity of the system increases, the cost of water decreases. The only exception was represented by the 2 m
3/h system, since it had very short distribution piping (only 300 m) compared to the 5 m
3/h (4102 m) or the 10 m
3/h (6140 m).
In the literature, studies often only included the power pumping system [
10,
12,
14,
15,
16,
18], without any additional costs (e.g., preparation of the borehole and of the site, electric components, distribution pipes) covering a very high percentage of the overall cost. Also, the different possible pumping hours and the costs for solar and diesel (and the consequential longer distribution) were not calculated per amount of water provided but rather only per pump after setting a specific water head.
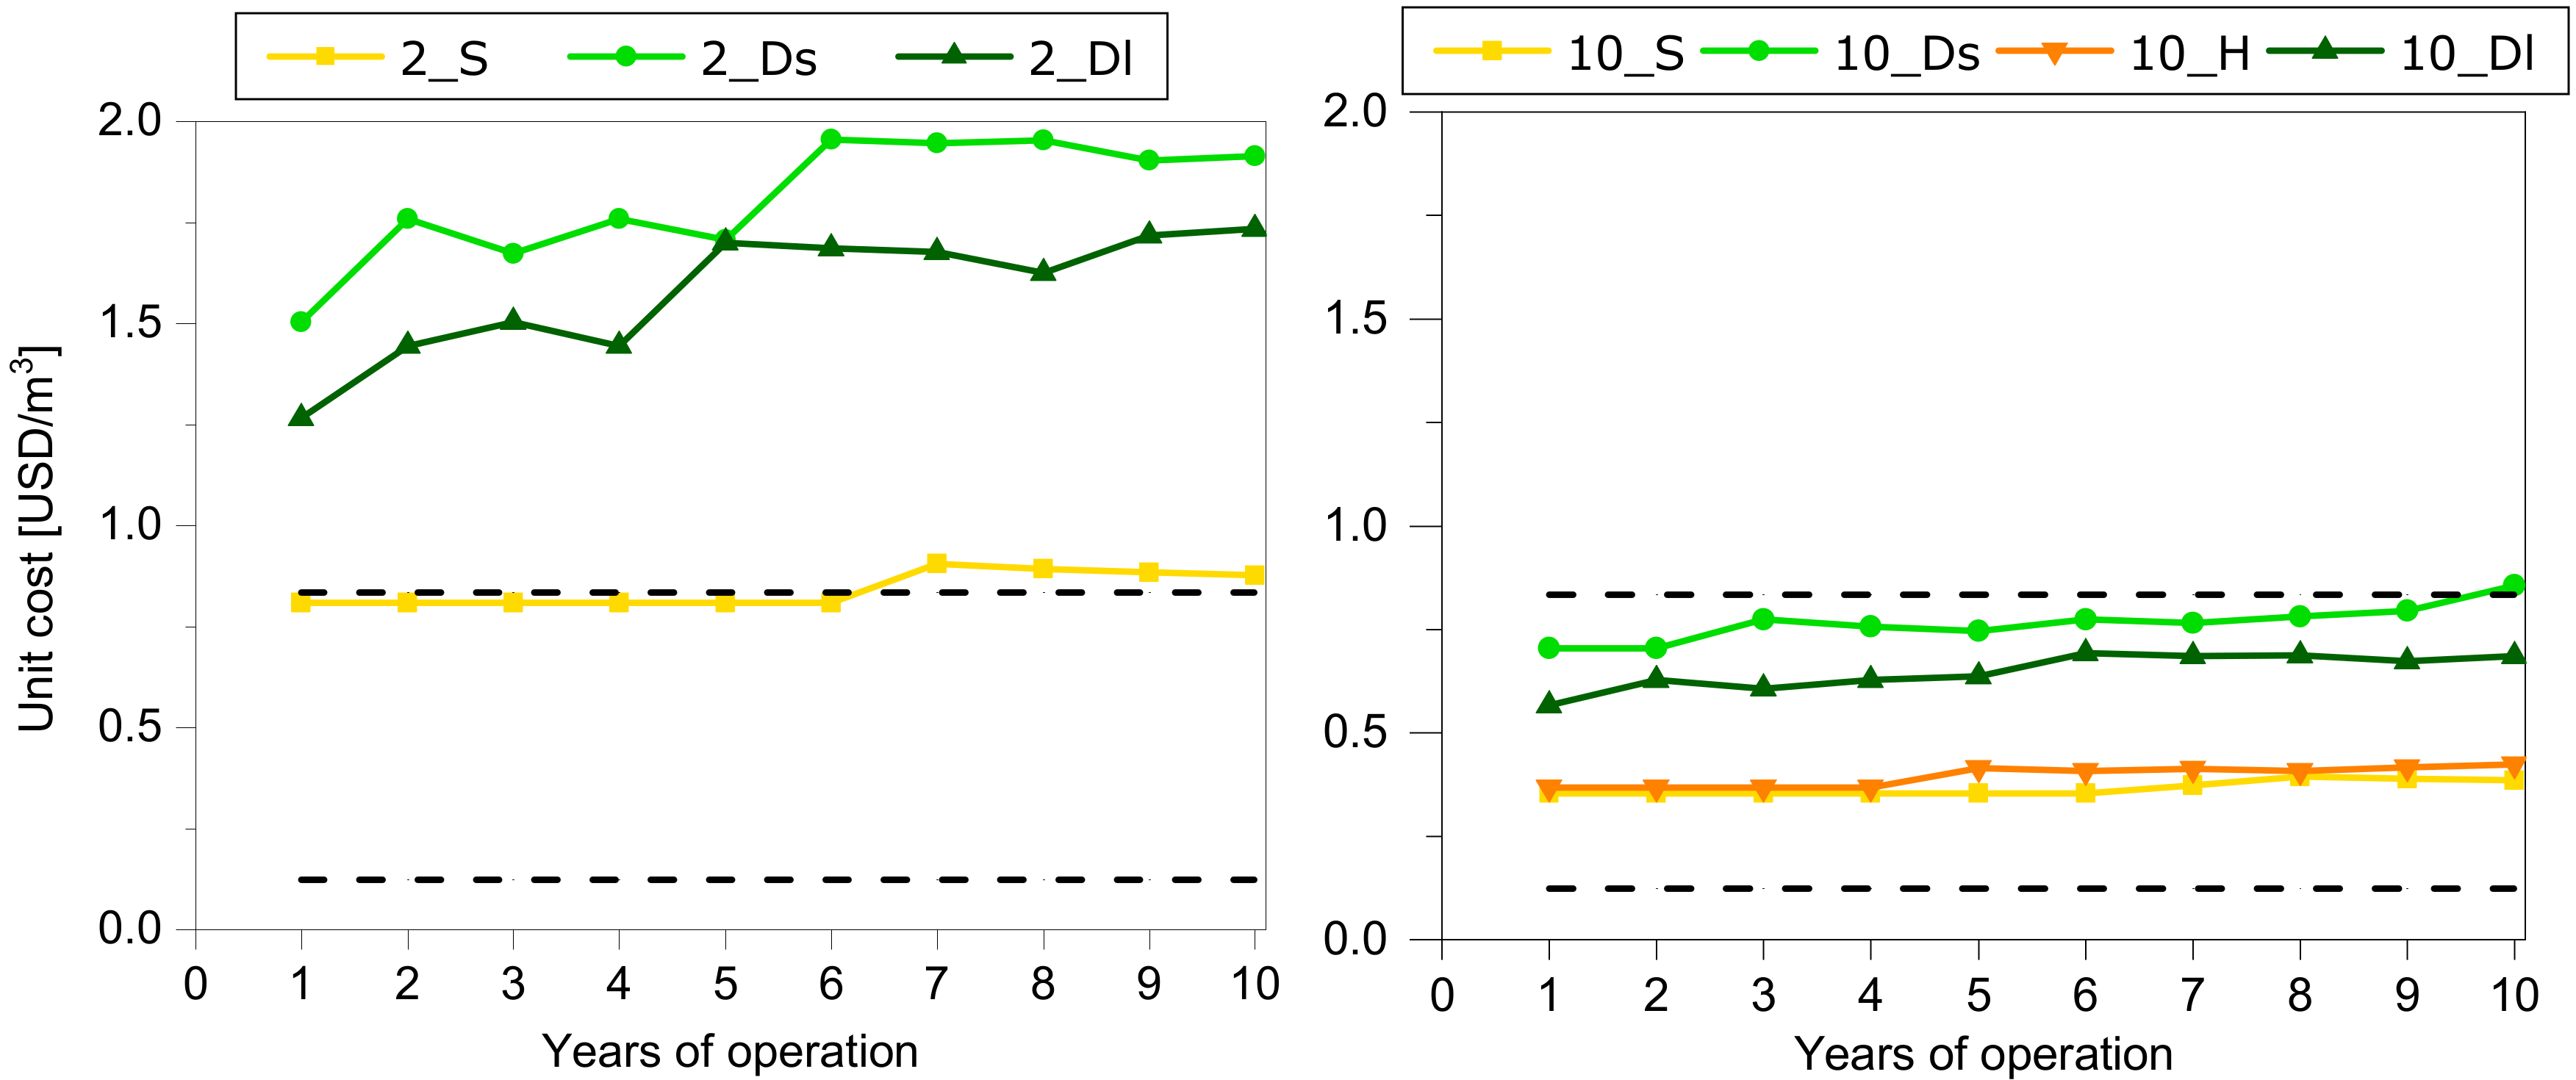
3.2.3. Operational Expenditure (OPEX)
The analysis of OPEX costs is relevant where CAPEXs are covered by donations and operations are transferred to local water communities or authorities after a few years. For all pumping yields systems, the purely solar (running for 7 h per day) option had the cheapest operational costs, followed by hybrid systems, long-running diesel-powered systems and lastly short-running diesel-powered systems (
Figure 6). OPEXs for solar systems varied between 0.81–0.91 USD/m
3 for the 2 m
3/h system and between 0.09–0.15 USD/m
3 for the 50 m
3/h systems dependent on timeframe (
Supplementary Material A.17).
It was clear that the majority of the systems’ OPEX would be less than the current tariffs of 0.83 USD/m
3 (excluding the 2 m
3/h diesel-powered system) (
Supplementary Material A.18). However, none of them could survive with a tariff of 0.12 USD/m
3, as currently paid by the 4000 Congolese refugees living in the neighbouring Lobule settlement (internal communication with DRC). In any case, refugees could pay part of the expenses without reaching full cost recovery, in order to create a sense of ownership of the systems.
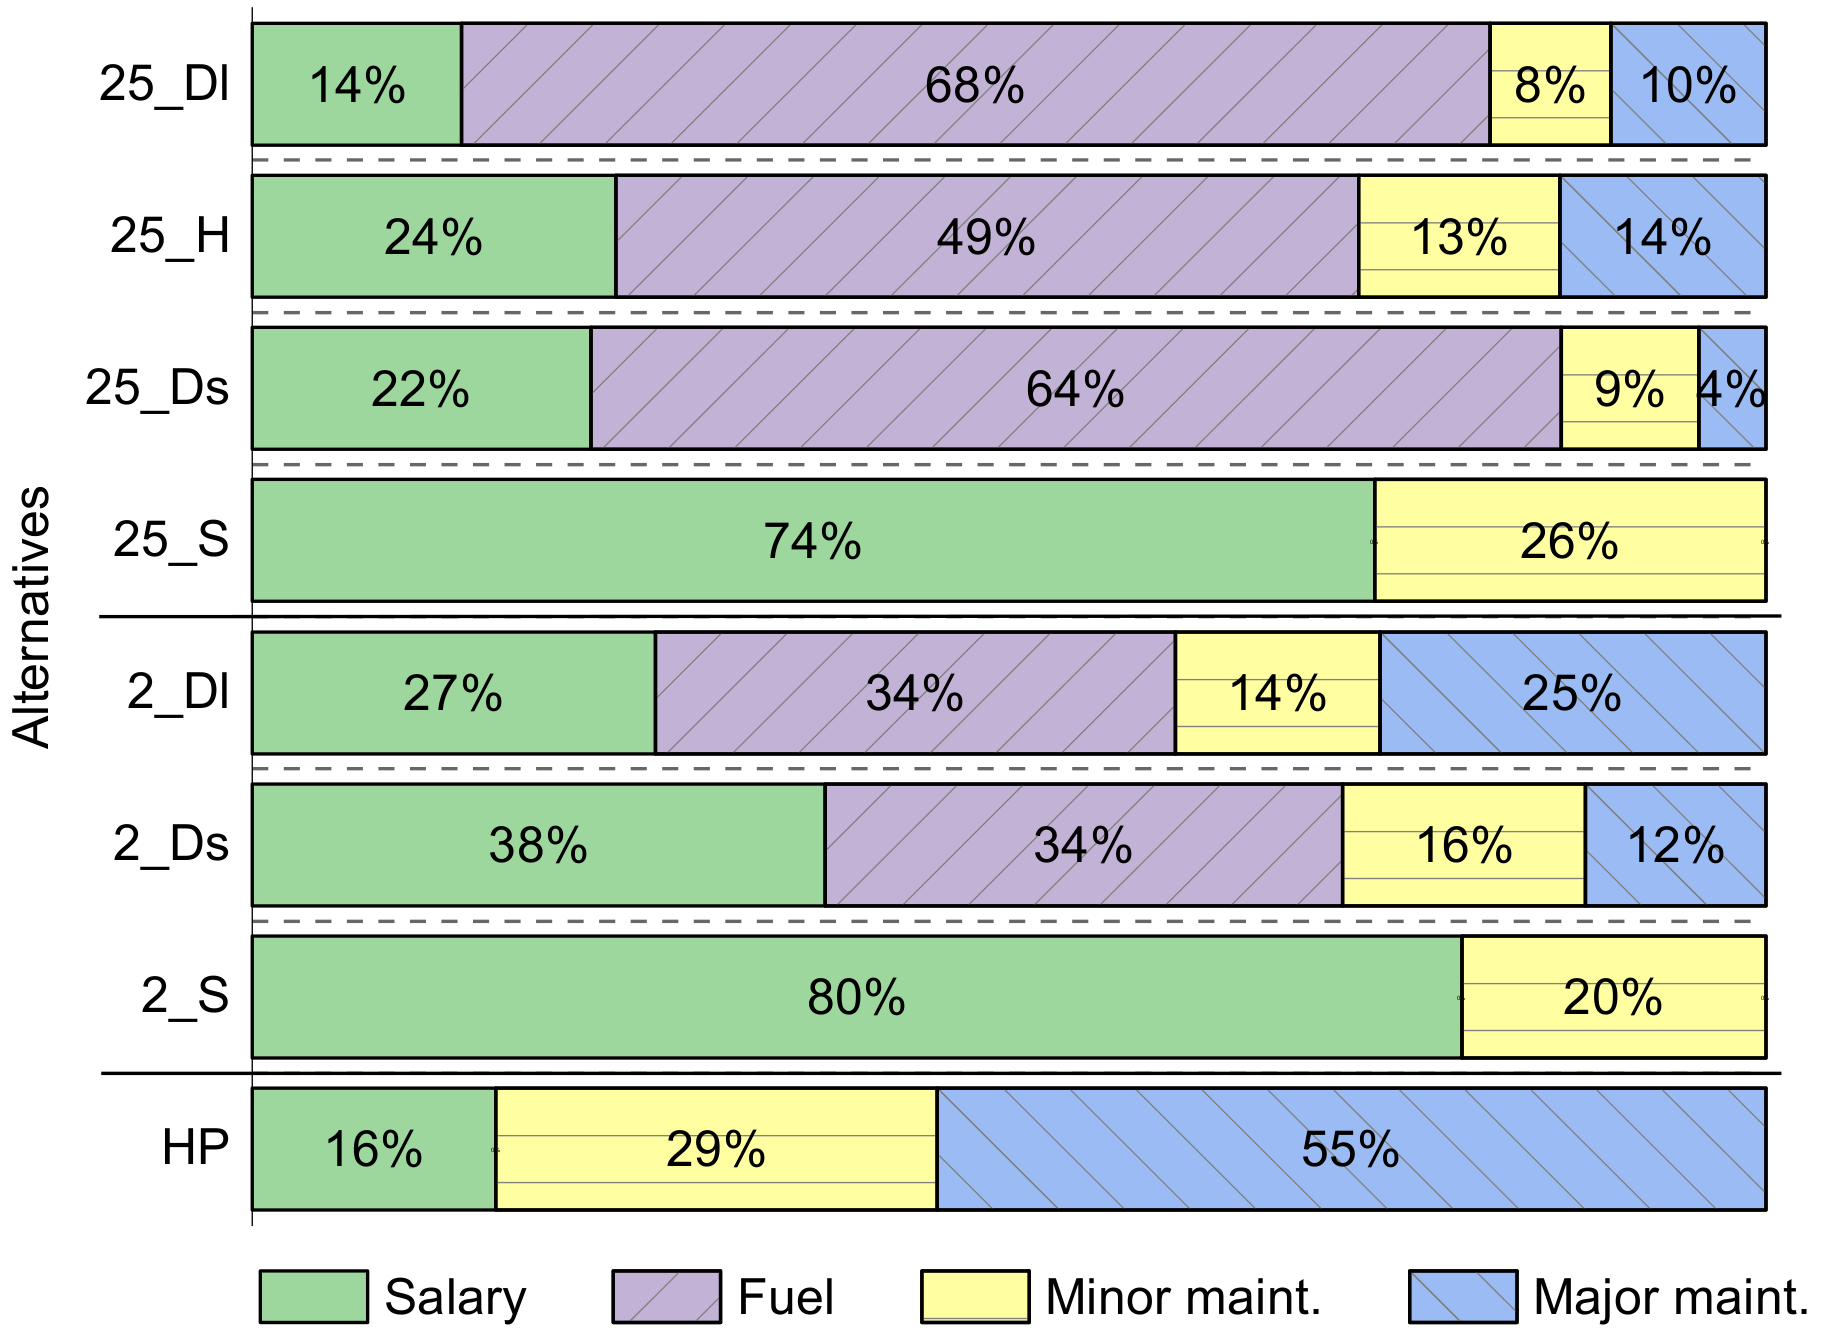
The OPEXs were further analysed by dividing them into four classes: salary, fuel, minor maintenance and major maintenance (
Figure 7 and
Supplementary Material A.20). In general, salaries for guards and attendants at the pumping stations covered a majority of the OPEXs in the solar-powered systems. For diesel-powered systems, fuel consumption was the most important expense, followed by salaries and maintenance.
3.2.4. Scenario Analysis
The scenario analysis quantified the impact of these choices on the unit cost per m
3 of water delivered and on the breakeven years
Supplementary Material A.21). In general, the reliability of the diesel generator, the cost of fuel and the CAPEX for solar panels had the main impact on breakeven years among the alternatives. If the cost of diesel was 1.1 USD per litre instead than 0.83 USD, the 50 m
3/h solar and the hybrid systems worked out cheaper than the long-running diesel in the fifth and the fourth years of operation, respectively, instead of the eighth or sixth years. If the cost of solar panels decreased by 20%, the breakeven years would be six and five. In general, the larger the system, the more sensitive the breakeven years for the characteristics of the generator and the cost of solar panels. These results confirm that the future costs of diesel-powered systems are uncertain and will depend on factors such as maintenance activity and cost of fuel. Lastly, discounting future cash flows by 6 or 12% does not change any conclusions, albeit all breakeven years would be delayed by 1–2 years (
Supplementary Material A.14–A.29).
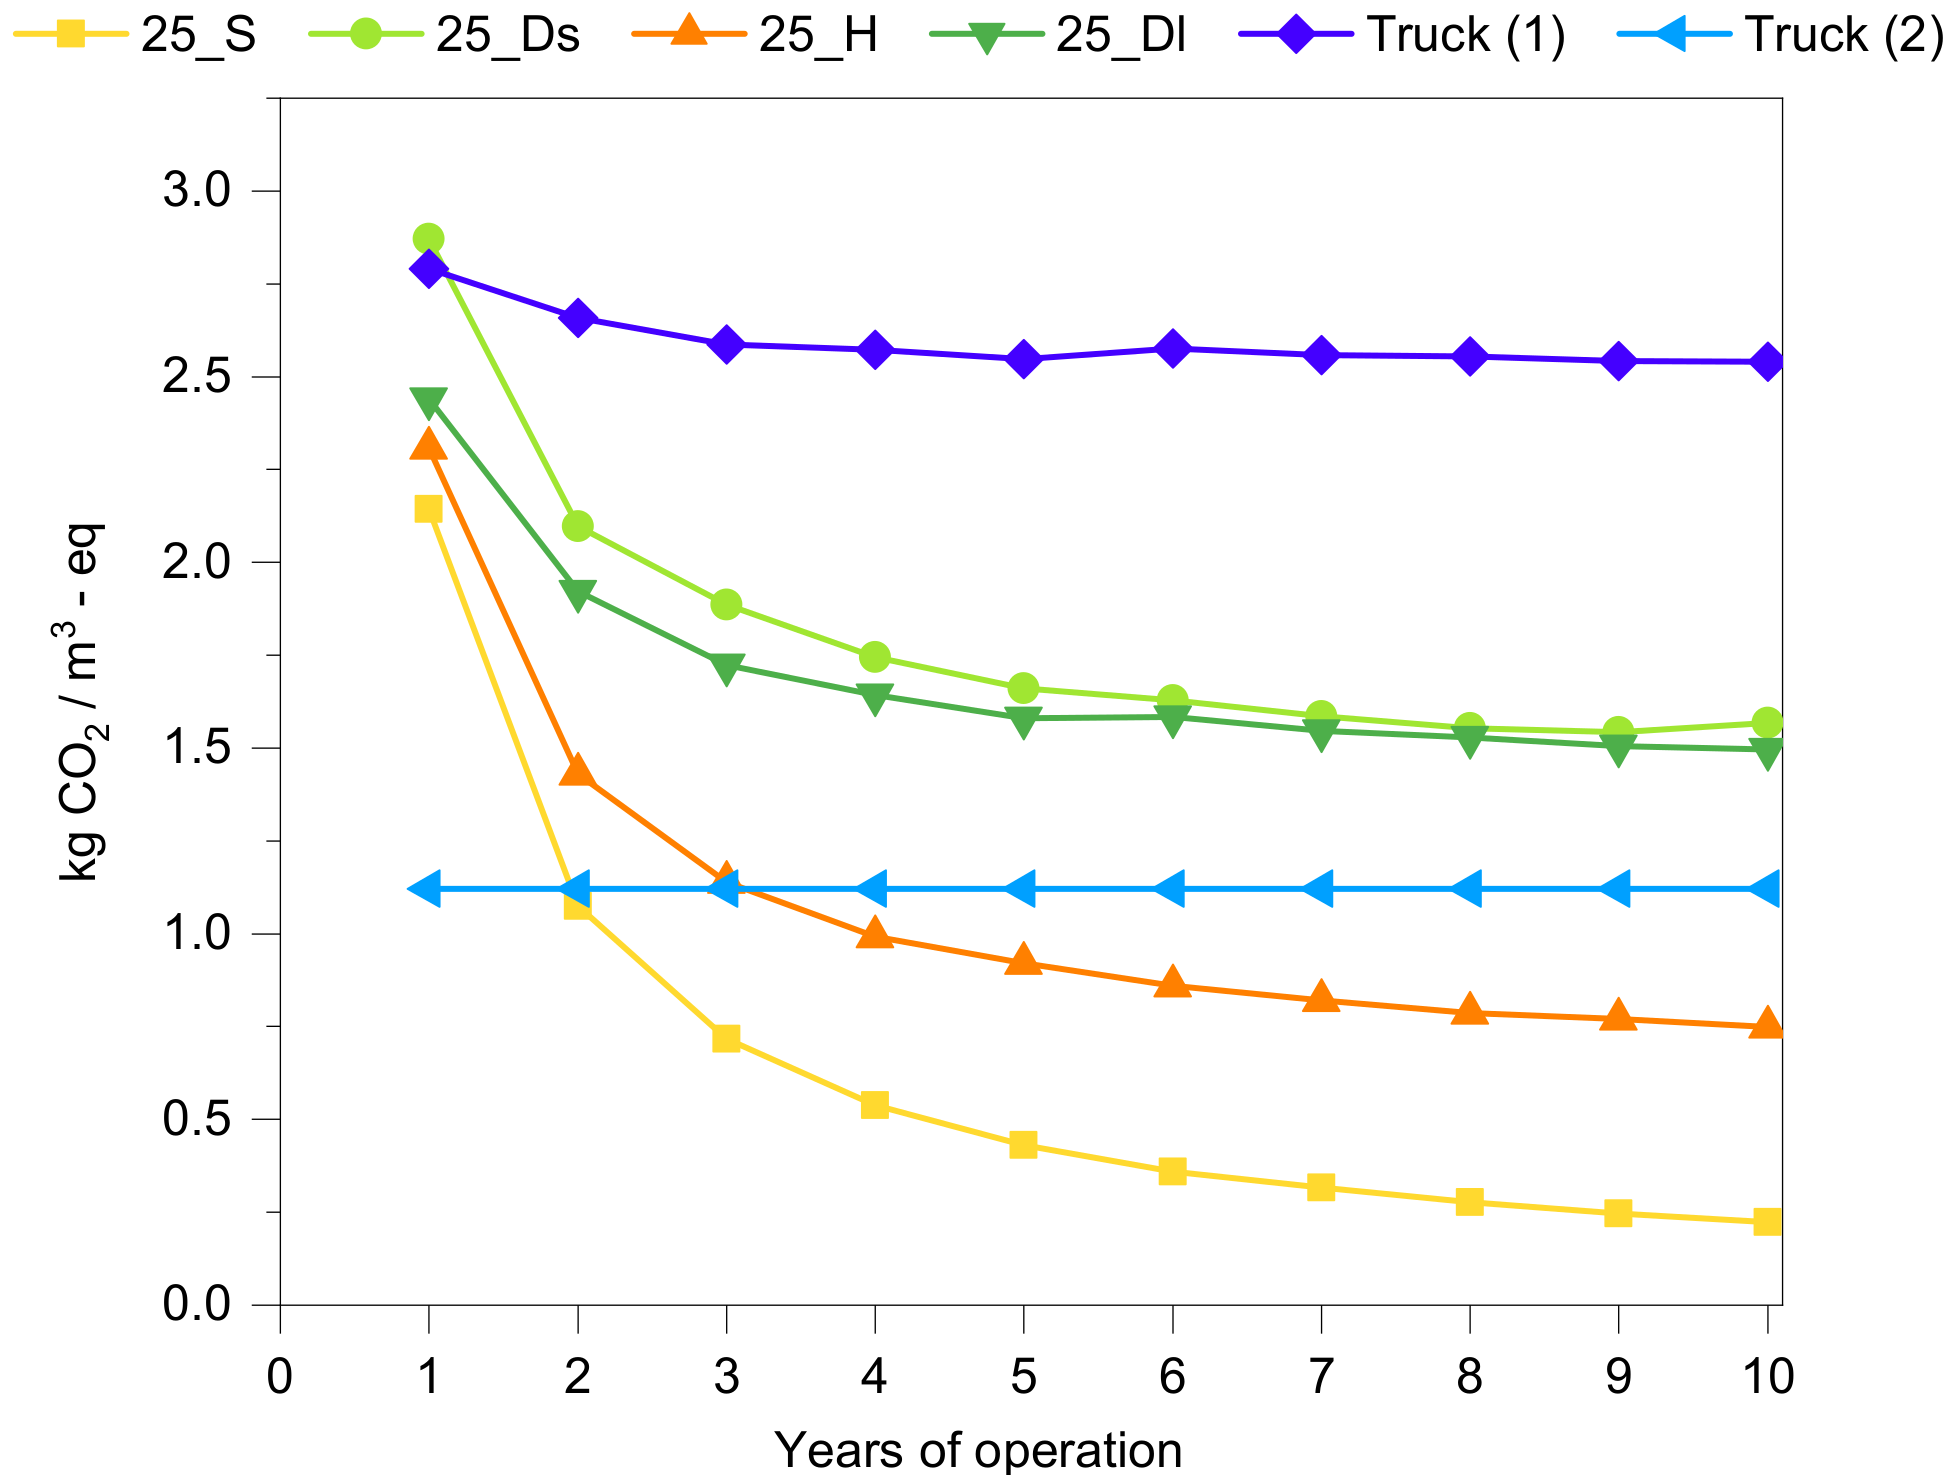
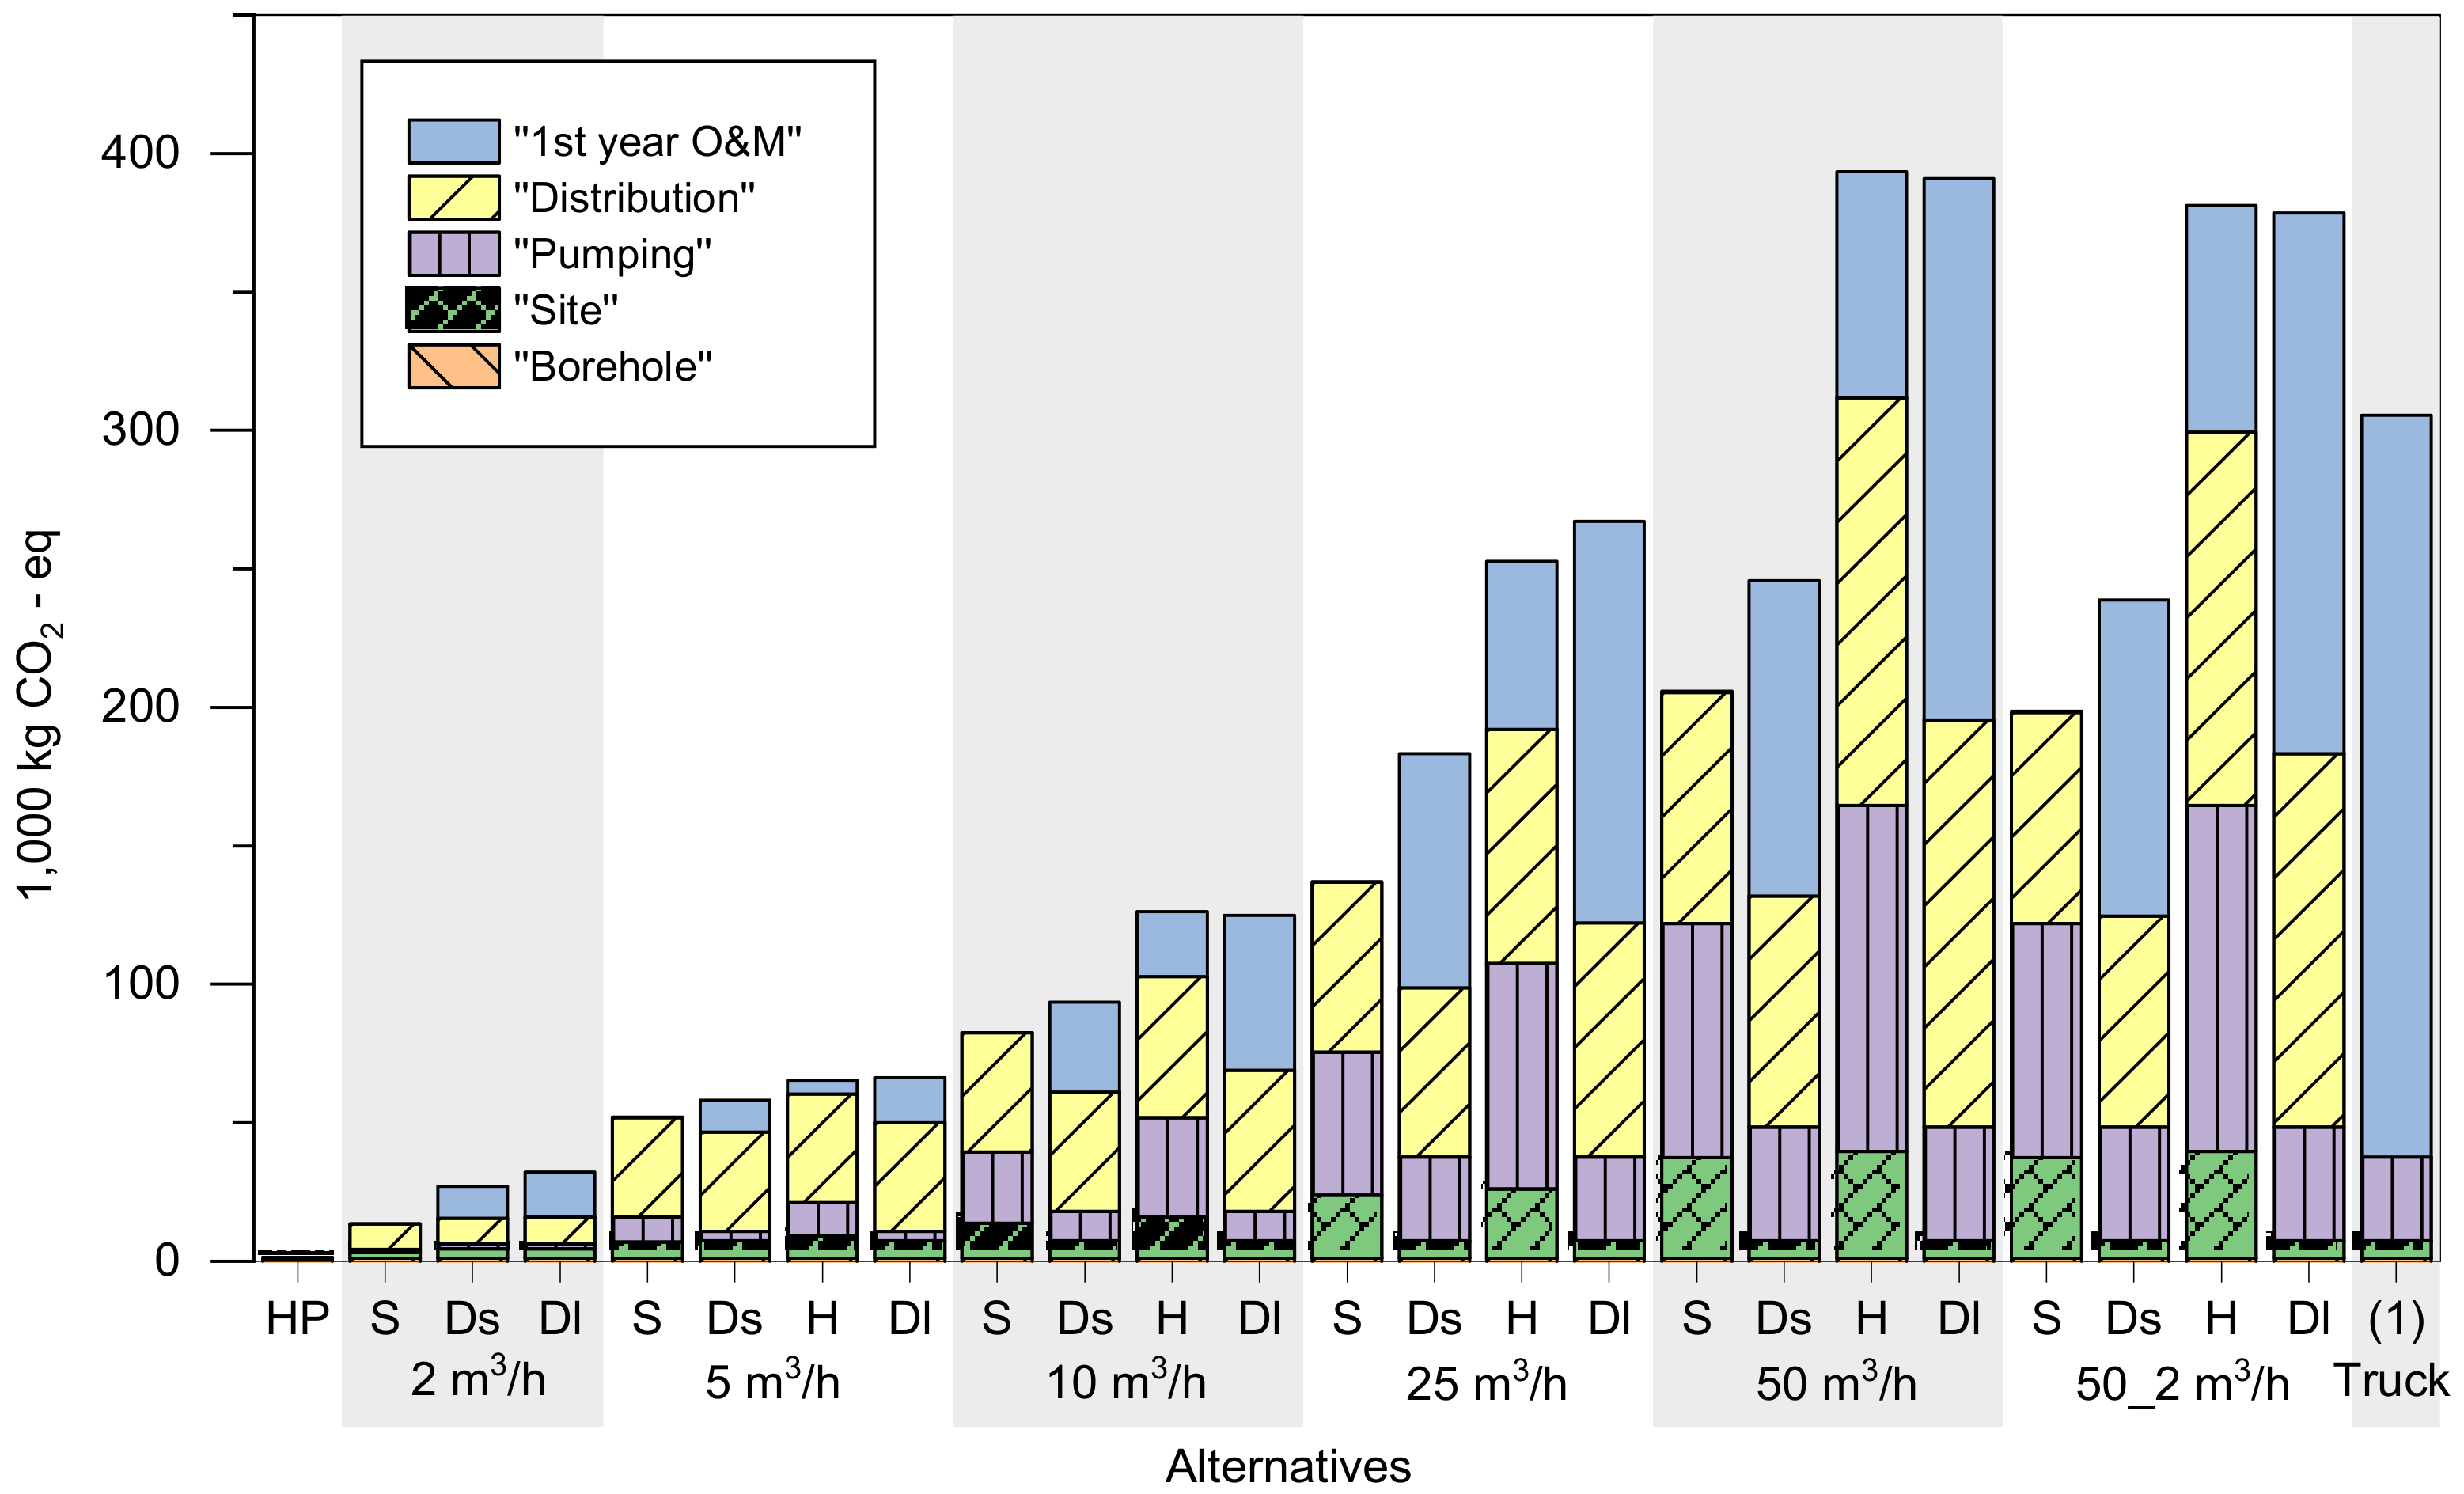
3.3. Carbon Footprint
For all systems and in the first year, the majority of environmental impacts were caused by the production of steel for water storage (tanks and structure), photovoltaic panels, and by operation activities (diesel combustion). In general, direct emissions of diesel combustion caused the major impacts on climate change. When comparing different energy sources, the solar-powered system performed better for most timeframes, followed closely by the hybrid system. The only exception was in the 5 and 10 m3/h systems, where solar solutions needed to run for almost 2 years to outperform the diesel. Regarding the diesel-powered system, running the generator longer (10 or 12 h) was always better than using it for only 7 h.
When comparing different pumping yields, the hand pump was the most environmentally friendly solution (0.07 kg CO2-eq/m3 after 10 years of operation), as limited amounts of materials and energy were used. Among the motorised supply systems, the best systems were the 50 m3/h solar (0.16–0.17 kg CO2-eq/m3 after 10 years), whereas the worst were diesel systems with 2 m3/h yield (2.5–2.6 kg CO2-eq/m3 after 10 years). The impact owing to the transport of water with trucks (1.12 kg CO2-eq/m3) was in the same order of magnitude as those caused by the generator used for the water pumping. When comparing truck transport of water with the other alternatives, water trucking was in general better than the diesel generator and worse than the solar and hybrid options after 3 years of operation. If the trucking distance exceeded 40 km including return, its carbon footprint became worse than all alternatives after 3 years of operation.
In general, the larger the system, the better the performance relative to climate change, but this outcome depended strongly on the power required (either as the number of solar panels or as the size of the diesel generator).
3.4. Freshwater Availability
The Bidibidi settlement is located in the Yumbe district of Uganda, in an area categorised as a tropical savanna with an average yearly precipitation of 1100 mm/year. The dominant water body in the area is the White Nile, offering a fairly stable water discharge of around 1000 m
3/s [
37] that reaches its minimum during July and August. Based on data from the AWaRe project, the Yumbe district has approximately 80 to 90 times less water available per area compared to the world average [
38]. The major limitation of the AWaRe project is that the size of the grid (55 km × 55 km in Uganda) is too large to account for local water conditions.
The main concern is the local and seasonal depletion of groundwater aquifers (at the scale of individual boreholes). Hydrogeological surveys have called for a better monitoring of groundwater levels and increased use of groundwater-potential maps in the planning and operation of water supply boreholes [
36]. With the current low water demand in the range of 15 to 30 L/person/day, it was concluded that water availability can be ensured through the better coordination of groundwater exploration in the area, increased monitoring and the strategic placement of new boreholes [
36]. However, with continued population increase and an assumed improvement in local farming and access to water, increased water consumption may be constrained by water stress at the regional scale, as indicated by the AWaRe indicator. Furthermore, when comparing settlements with the results of older studies [
39], it appears that the northern part of Bidibidi is in an area classified with high water coverage, while Imvepi is located in an area with low water coverage, and both of them are located in areas poorly suited for growing crops (
Supplementary Material A.24). Previous studies agree that groundwater availability is sufficient for the projected household demand, but 90% of the Bidibidi settlement is in a “low groundwater potential” area, meaning that local depletion could happen frequently if boreholes are not drilled after considering groundwater data [
36]. Uncertainties related to groundwater availability and the outlook for a surface-based water supply support the implementation of boreholes that will ensure cost recovery in a timespan of years rather than decades.
The Ugandan government is considering implementing a surface water treatment plant as a long-term strategy for the region, but no information on the implementation plan could be found during the field trip. The major obstacle to surface water provision is the massive financial investment that such a plant and the distribution network would require. The size of the investment would require a completely different analysis and was considered beyond the scope of our study. Furthermore, although not considered in our assessment, rainwater harvesting should be (and is) considered as an additional source of water for households.
3.5. HACCP
The most relevant critical control points found in the construction of the systems were the quality of the borehole casing (particularly relevant for hand pumps) and the quality of distribution pipes installation. Both activities are important to prevent contaminated surface water entering the borehole or the distribution system. The most problematic points concerning spreading disease for both motorised systems and water trucking are water storage tanks and tap stands, even though chlorination was performed in the majority of the boreholes visited. Data covering water-quality monitoring should be collected and shared among the different stakeholders, and systematic cleaning and disinfection of the tanks and trucks should be conducted [
36]. Additional data on the hazard analysis can be found in
Supplementary Material A.25.
3.6. Summary of the Analyses
In summary, the five approaches in our assessment support a final evaluation of the proposed systems for water supply in Ugandan refugee settlements (
Table 5).
Looking at both the economic analysis and the carbon footprint, hand pumps seem to be the best solution, due to the very low capital investment and material required. However, hand pumps need constant physical labour that limits the water availability at each pump. This means that hand pumps require many additional boreholes in the same area, in order to respect SPHERE (500 people per pump) or UNHCR (200 people per pump) standards. Considering that 90% of Bidibidi is considered a “low groundwater potential” area [
36], it is preferable to design fewer high-yield boreholes, assess sustainable capacity and constantly monitor the groundwater level, rather than drilling many non-monitored, low-yield and, therefore, potentially unsuccessful hand pumps.
Our comparison does not reveal a generic “best technology” or the most profitable system; nonetheless, for our specific case, it appears that diesel is cheaper for between 1 and 5 years of operation, depending on the system, and solar in the medium to long term between 2 and 6 years of operation. Based on our method and on the provided spreadsheet (
Supplementary Material B), it is possible to run a simplified LCC to find the likely breakeven years among different alternatives. The same spreadsheet can be used in all contexts where it is relevant to compare solar, diesel and hybrid ground water supply systems. Modelling limitations are the lack of the disposal phase and the assumed constant efficiency of solar panels.
The results of our study emphasise the importance of addressing the lifetime of the technological solutions under evaluation. The uncertainty related to the long-term sustainability of water withdrawal and the length of the stay of refugees in the settlement has a strong influence on the expected unit cost. Our results showed that a shift away from a three- to a five-year lifespan will decrease the unit cost by 21% to 38%, depending on the motorised system in use. In cases where financing is available in the short term, for example if initial investment costs are covered as donations from humanitarian agencies, the solar and hybrid systems have an advantage, since they provide a large yield at a very low operational cost in the years after installation.
Some reflection should address the lack of data on water consumption. All the analyses assumed a constant water demand, but we had no detailed data on this issue, and we speculate that water demand will grow when the water supply efficiency and reliability increases. Furthermore, the observed and metered amounts of water can be very different (as in [
9]), due to losses in the distribution system or poor maintenance. For these reasons, monitoring and data-sharing among different stakeholders should be incentivised to avoid the cost of the systems being much higher than expected (e.g., if a borehole runs dry). Furthermore, stakeholders should constantly measure and share static and dynamic groundwater levels, and data on water consumption patterns and water demand should be collected through end-user surveys or smart distribution electronic devices.

 ,
, 


