1. Introduction
Thermal structure and dynamics of mixing in lakes are mainly forced by energy exchanges between the atmosphere and water. Water temperature in the lake is closely subject to air temperature and wind speed. Previous studies have mainly focused on the effect of the increase in air temperatures, showing the increase in water temperatures in the surface layer [
1,
2]. Moreover, the rise in air temperature increased the strength of stratification [
3,
4], prolonged the period of stratification [
2,
5], and altered the depth of thermocline [
6]. Wind speed also strongly affects the vertical mixing [
7] and temperature structure [
6,
8]. The past century has faced climate changes in air temperature and wind speed. The globally averaged combined land and ocean surface temperature data as calculated by a linear trend, show a warming of 0.85 (0.65 to 1.06) °C, over the period 1880 to 2012 [
9]. The average strength of the tropical cyclone becomes stronger during the 21st century. There are likely more land regions where the stronger wind events have increased than where it has decreased [
9].
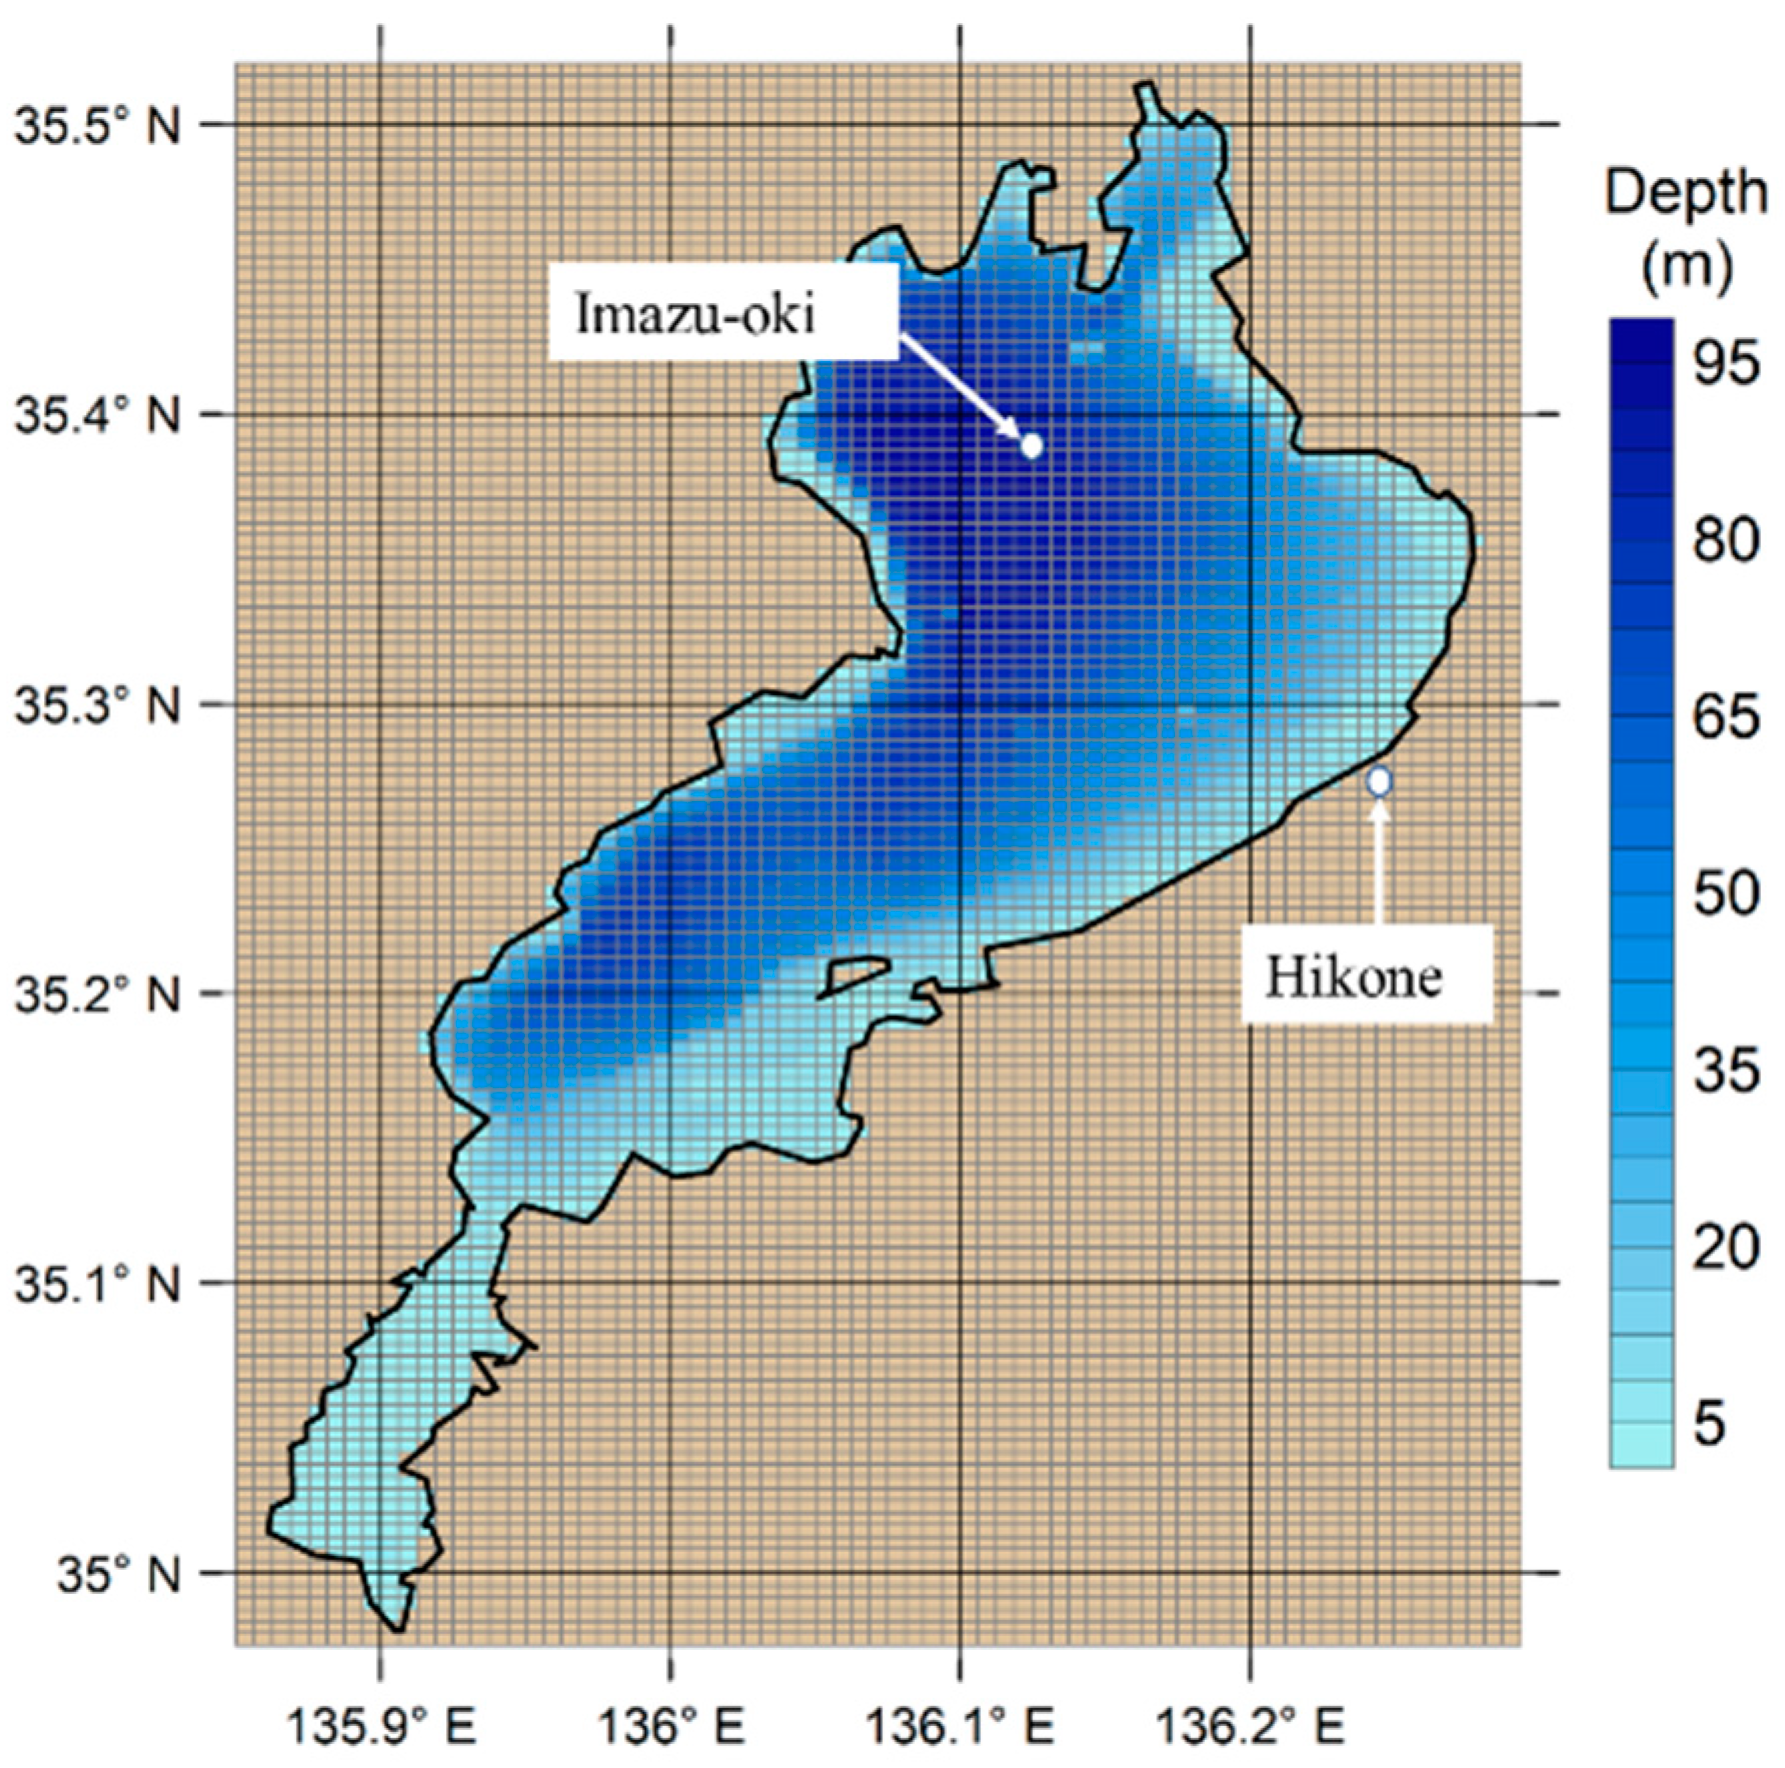
The deterioration of water quality in Lake Biwa in Shiga Prefecture, Japan (
Figure 1) has a serious impact not only on people’s lives but also on ecosystems. As for an influence of deterioration of water quality on the ecosystem, Tsujimura et al. [
10] reported that when the concentration of dissolved oxygen falls below 2 mg/L, the basal metabolism of organisms declines. In the bottom layer of the north lake, the hypoxia has become remarkable from around the 1960s, and since 1979, the concentration of dissolved oxygen of 2 mg/L or less was observed in the bottom layer (90 m) at Imazu-oki.
Lake Biwa is the largest freshwater lake in Japan and is a water source that supports the lives of approximately 15 million people in Shiga and other surrounding prefectures. The area of Lake Biwa is approximately 674 km
2 (the north lake 616 km
2, the south lake 58 km
2), the maximum water depth is 103.6 m. Lake Biwa is divided into the north lake and the south lake from its shape, and the average water depth is 43 m in the north lake and 4 m in the south lake. The total volume is approximately 27.5 km
3: the north lake is 27.3 km
3, and the south lake is 0.2 km
3. The amount of inflowing water is approximately 5 km
3/year, and the residence time is around 5.5 years in the north lake and around 15 days in the south lake [
11].
Eutrophication was considered as the main cause of the declining tendency of dissolved oxygen concentration in the bottom layer until the 1970s [
12]. However, after organic substances from the land area and nutrient load were restricted, changes of structure of the stratification due to climate change have been pointed since 1980 [
13,
14,
15]. In the past 20 years from 1985 to 2004, climate change such as the rise in air temperature (approximately 1 to 2 K), the decrease in wind speed (annual average monthly maximum wind speed decreases by approximately 5%), and the annual precipitation decrease (approximately 100 mm/year) have been observed [
13]. In particular, the rise in air temperature and the decrease in wind speed have been thought to weaken the vertical mixing of lake water, which may be the cause of the hypoxia [
13]. However, few quantitative analyses have been conducted. The main factor of interrupting the supply of dissolved oxygen to the bottom layer is the thermocline. As the stratification is strengthened, oxygen supply from the surface layer to the bottom layer is suppressed.
The rise in air temperature may strengthen stratification and impede oxygen supply to the bottom layer [
5]. In Lake Zurich, Switzerland, since the rising rate of surface temperature (0.024 K/year) was larger than the rate of deep-water temperature (0.013 K/year) from the 1950s to the 1990s, the period of the stratification was extended to 2–3 weeks [
5,
16]. In addition, there are some lakes where a complete circulation occurs once a year or more shift to partially circulating lakes where a circulation does not reach all layers as global warming progresses. For example, Lake Constance in Germany was a lake in which complete circulation occurred once a year, but since the temperature rise rate in winter became higher from the 1960s to the 1990s, it was reported that complete circulation did not occur [
11,
17]. Tsujimura et al. [
11] also showed that the period of the stratification increased by 0.5 days/year in Lake Biwa during about 30 years from 1980 to 2008. Furthermore, it is pointed out that as the temperature in winter has risen, the delay of the complete circulation has occurred [
18,
19,
20].
As for the effect of the wind, it causes various phenomena such as wind-driven current and destruction of stratification due to vertical mixing occurs. Furthermore, the wind causes internal waves, and vertical mixing becomes active with the breaking wave. Piling-up by wind and vertical mixing by stirring of wind, and internal waves have been observed by continuous observation of the vertical distribution of water temperature with using mooring system [
21,
22]. Along with the strong wind, the depth of thermocline rises, and when the wind stops, it falls rapidly, and waves (internal surge) affecting the deep layer can be generated. Hayami et al. [
23] observed that in the southern part of Lake Biwa in the summer of 1992, the thermocline declined sharply over 20 m due to the passage of this internal surge. Jiao and Kumagai [
24] showed that when a typhoon approached in the summer of 1993, a strong wind having a wind speed of 20 m/s or more blew continuously, then a nonlinear wave with an amplitude of approximately 40 m appeared and reached the bottom of the lake, which caused vertical mixing.
In most cases, the observation data is not enough for analyzing the structure of the stratification in the vertical and horizontal direction. Thus, some researchers use one-dimensional models to assess it. Butcher et al. [
25] assessed the lake response to climate change by using one-dimensional model in US lakes and reservoirs and reported that the increase in surface water temperature increased thermal resistance to vertical mixing and fluctuations in wind could also have an important effect, with increased wind stress potentially counteracting the increase in thermal stratification. Edlund et al. [
26] showed that water temperatures in the surface layer increased in summer and the duration of thermocline also increased in northern wilderness lakes by using the model which solves one-dimensional, unsteady differential equation describing heat transfer with depth in a lake. We also built the one-dimensional model to analyze the vertical distribution of water temperature; however, the surface water temperature of the one-dimensional model was cooler than that of the three-dimensional model due to not expressing the variation of horizontal distribution of water temperature. Therefore, it is necessary to use the three-dimensional model to analyze the effects of the wind speed and gravity currents. Madeline [
27] reported that increasing the air temperatures and decreasing wind speeds may be large drivers to thermal structures in three morphometrically different lakes in the US by using the dynamic reservoir simulation model for water quality adopting a one-dimensional model. These one-dimensional models cannot express the horizontal distribution of stratification; however, there are a few papers that analyze the response of the thermal structure to meteorological elements by using the three-dimensional model. The stratification varies horizontally with the difference in water depth due to the bottom topographical features. In addition, the structure of the stratification also varies in the horizontal direction due to the wind-driven current and the internal wave. Therefore, we used a three-dimensional hydrodynamic model to understand how the structure of the stratification varies due to meteorological changes throughout the whole waters of Lake Biwa.
The structure of the stratification varies seasonally with changes in air temperature and wind speed. It is not clarified, however, how the change of each climate element can influence the structure of the stratification seasonally. Therefore, it is important to distinguish the effect of each element on the stratification and evaluate them quantitatively. In this study, the sensitivity of the structure of the stratification due to the meteorological changes in Lake Biwa was analyzed. The results of numerical simulation of the flow field in Lake Biwa during the five years from 2007 to 2012 and the hypothetical cases using the meteorological data with changing the average temperature and wind speed were compared.
3. Results and Discussion
In this section, at first, the model results are compared with the observation to validate the reproducibility of the mixed layer and thermocline by three-dimensional results in Lake Biwa. Then, the simulation results of the change in air temperature and wind speed can be compared with the baseline case each other to investigate the difference in strength of stratification and the period of stratification.
3.1. Evaluation of the Reproducibility of the Three-Dimensional Hydrodynamic Model
Koue et al. [
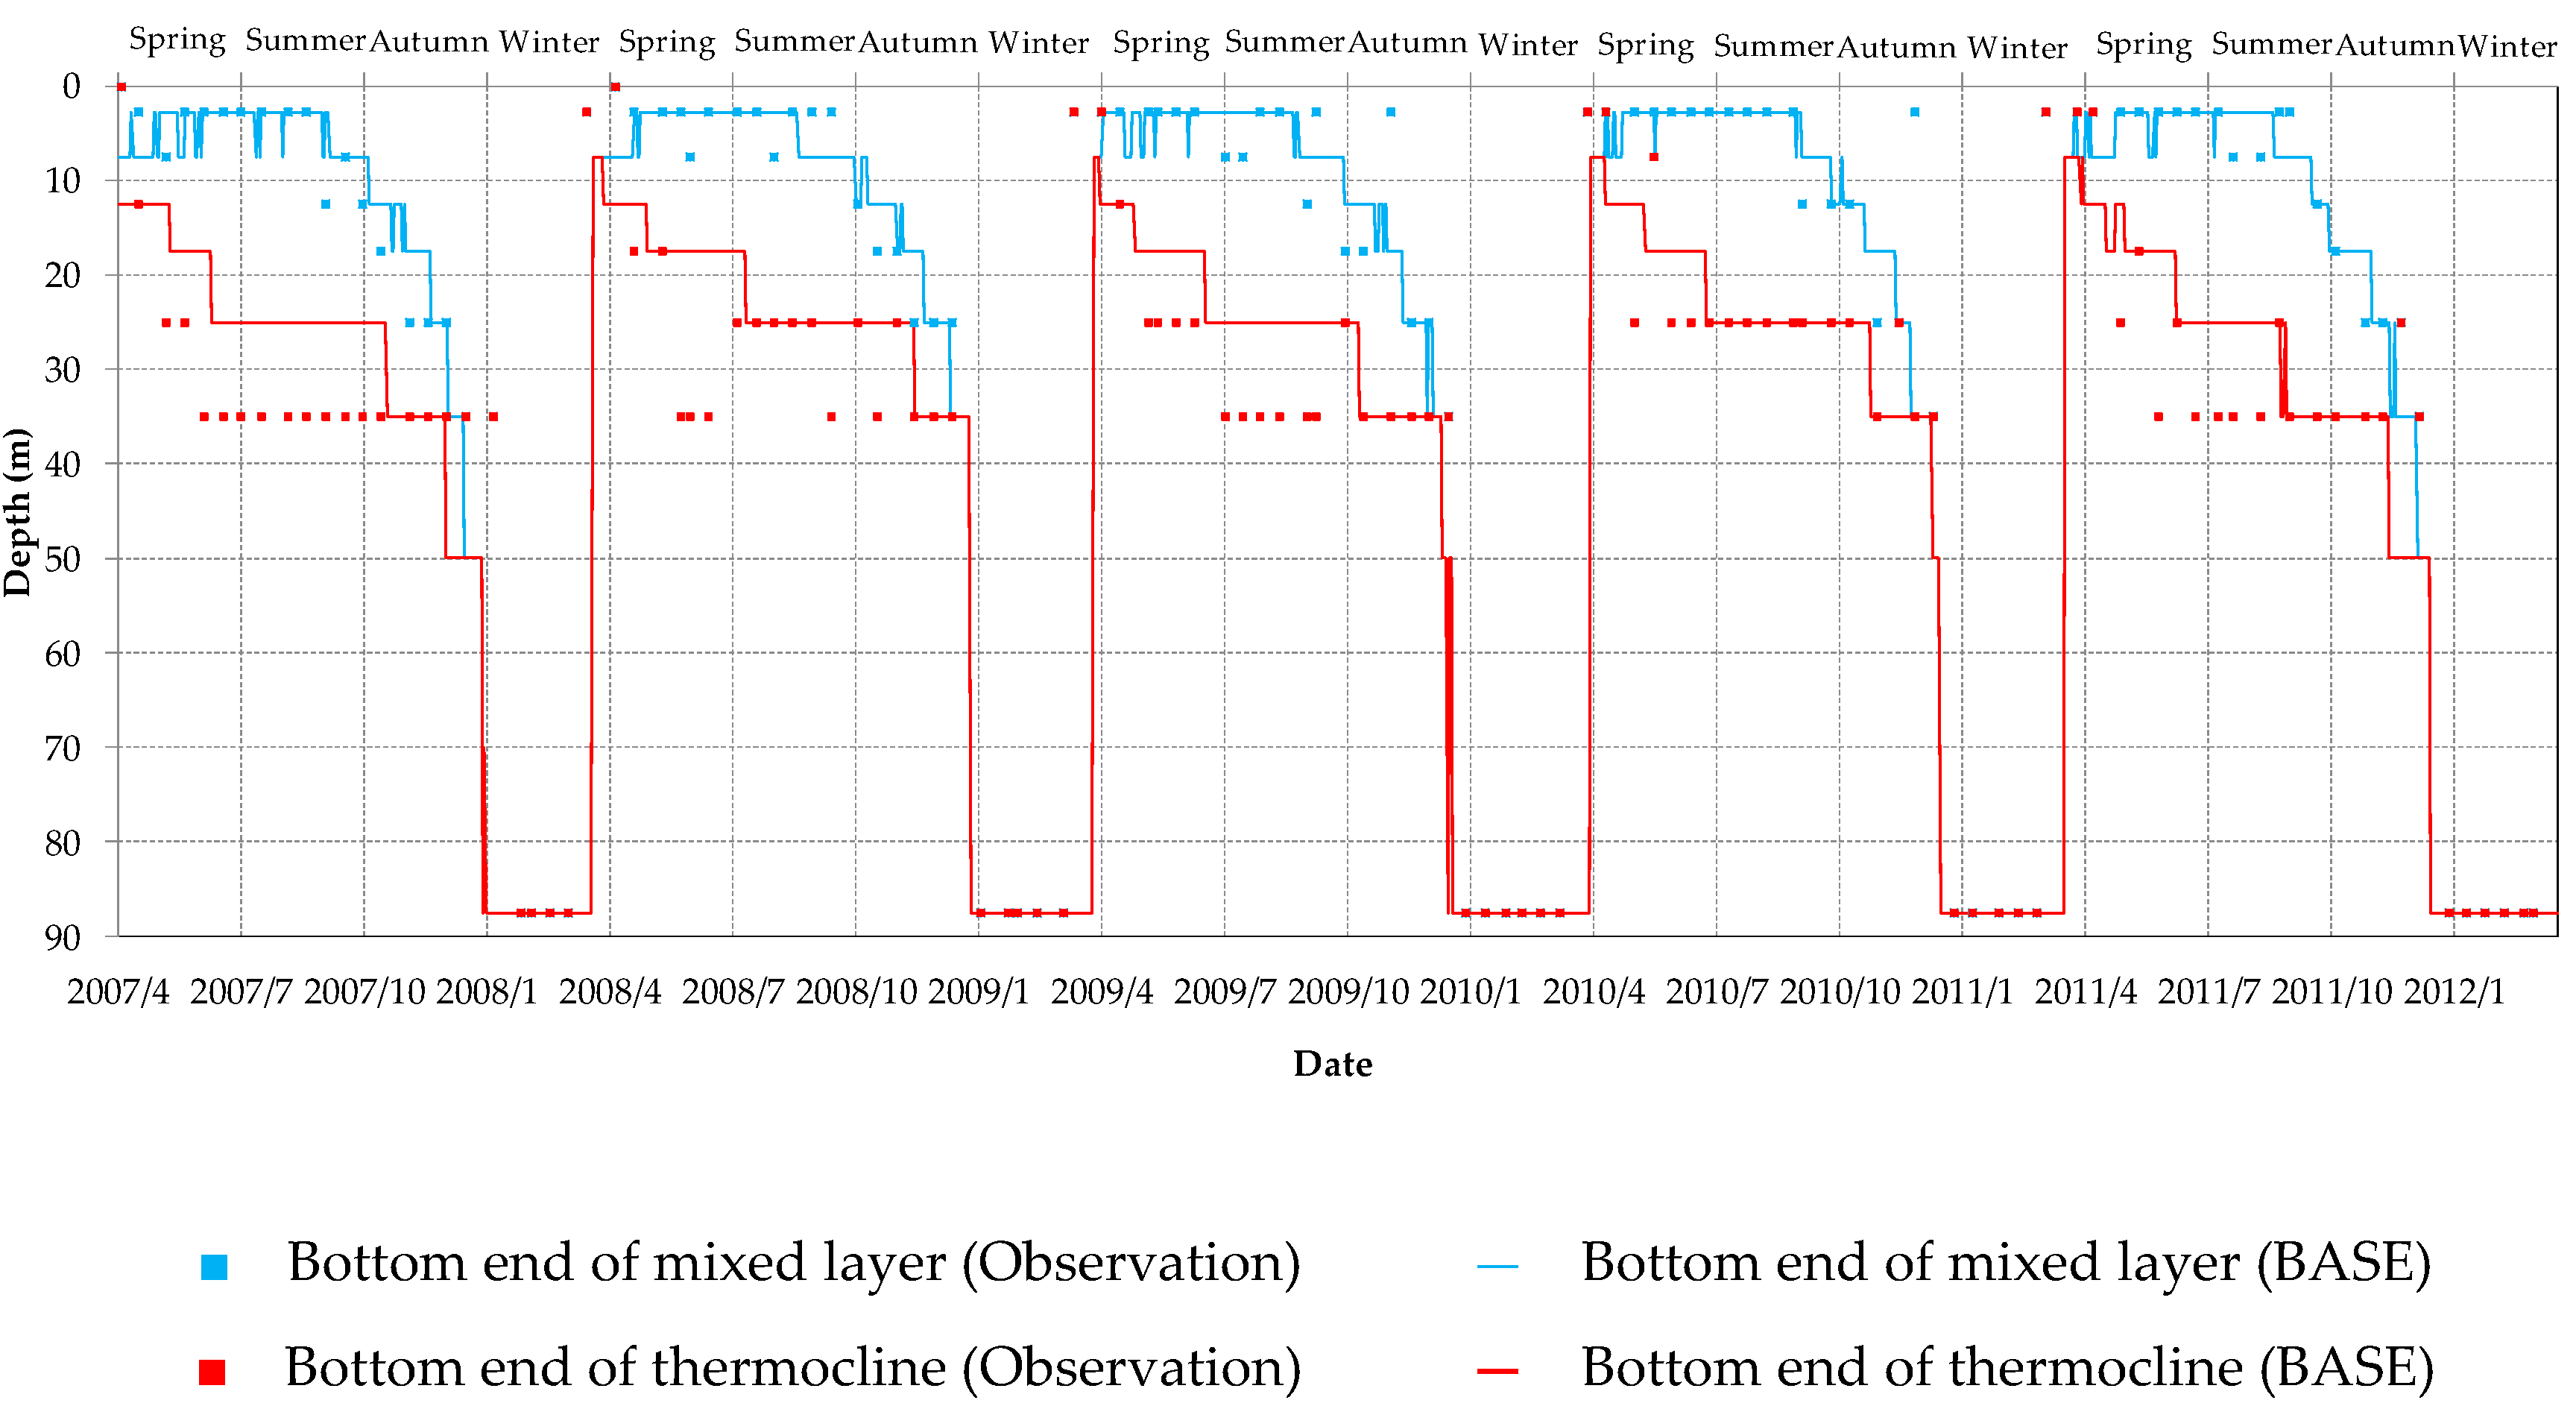
30] reported that the model was well simulated for the vertical distribution of water temperature and the characteristics of the flow field in Lake Biwa compared to the observation. Besides, to evaluate the model reproducibility, the depth of the mixed layer and thermocline were compared between the observed and the simulated water temperature. In this study, the mixed layer and thermocline were defined as the area where the change of water temperature was less than +0.1 K/m and the area that the one was more than +0.1 K/m, respectively. To compare with the observation, the simulated depth of mixed layer and thermocline were defined by using the water temperature at the observation depth, which was the temperature averaged between the middle points of each observation depth.
The time series of the depth of the mixed layer and thermocline at Imazu-oki is shown in
Figure 4. The mixed layer began from the surface of the lake and its thickness was less than 10 m from spring to summer as shown in
Figure 4. Then, the thickness increased over time and the complete circulation finally occurred in winter. The thermocline was located just under the mixed layer, and its thickness was around 30 m in summer. It became thinner from autumn, and finally disappeared in winter. The model reproduced the thicknesses of the mixed layer and the starting time of complete circulation quite well; however, the model slightly underestimated the thickness of thermocline in summer and autumn.
As statistical indicators, the correlation coefficient (
r) between observed and calculated values, mean absolute error (
MAE), and mean bias (
MB) were calculated, respectively, using:
where
are observed thicknesses of mixed layer and thermocline at each point twice a month,
are simulated thicknesses of mixed layer and thermocline at each point twice a month, and
is the number of samples.
Table 3 shows the statistical indicators of annual mean thicknesses of mixed layer and thermocline. The correlation coefficients were more than 0.75. Therefore, it can be said that the thicknesses of the mixed layer and thermocline were well reproduced by the model.
MAE was approximately 2 to 10 m in the thicknesses of mixed layer and thermocline.
MB were approximately 0.5 to 9.0, −1.0 to −3.3 m in the thicknesses of the mixed layer and thermocline, respectively. Since the mean interval of observed values was approximately more than 10 m,
MAE and
MB were less than 10 m. The mixed layer tended to be a little thicker in the simulation because the effect of stirring of the wind remained in the surface layer. Since the heat flux was not transferred to the deep layer, the thermocline became a little thinner in a stratified season. However, the trend of simulated thicknesses of the mixed layer and thermocline agreed well with the observed ones.
From the above, it was confirmed that the model had good reproducibility to use the sensitivity analysis of the meteorological elements.
3.2. Heat Flux on the Water Surface at Imazu-Oki
To investigate how the heat flux on the surface of the lake varies seasonally and supplies the heat flux into the lake, the time series of the daily mean of heat flux on the water surface at Imazu-oki in BASE from 2007 to 2012 is shown in
Figure 5. The formulas for obtaining each heat flux were written in Koue et al. [
30].
The net long wave radiation is the difference between the long wave radiation from the atmosphere to the lake surface and that from the lake surface to the atmosphere. The largest amount of cooling flux is net long wave radiation except summer when latent heat flux is greater than net long wave radiation. In summer, sensible heat flux decreases because of the small difference between water temperature and air temperature. However, in winter, the cooling components of sensible heat flux is high because the water temperature is higher than air temperature. The loss of the latent heat flux due to evaporation is also influential.
3.3. Influence on the Structure of the Stratification by the Change of Meteorological Elements
The impact of the change of the meteorological elements was investigated by the analysis of the depths of mixed layer and thermocline. The depths of the mixed layer and thermocline in the model were calculated by using the water temperature averaged vertically (between the middle points of each observation depth) and horizontally (whole lake).
Figure 6 shows the mean depths of mixed layer and thermocline in the cases using the pseudo-weather data of air temperature (AT+, AT−) and wind speed (WS+, WS−). The results in winter are omitted from the figure because in winter the complete circulation occurred in all cases. By examining the heat flux differences in each case, we can grasp which flux affects the surface temperature in the lake.
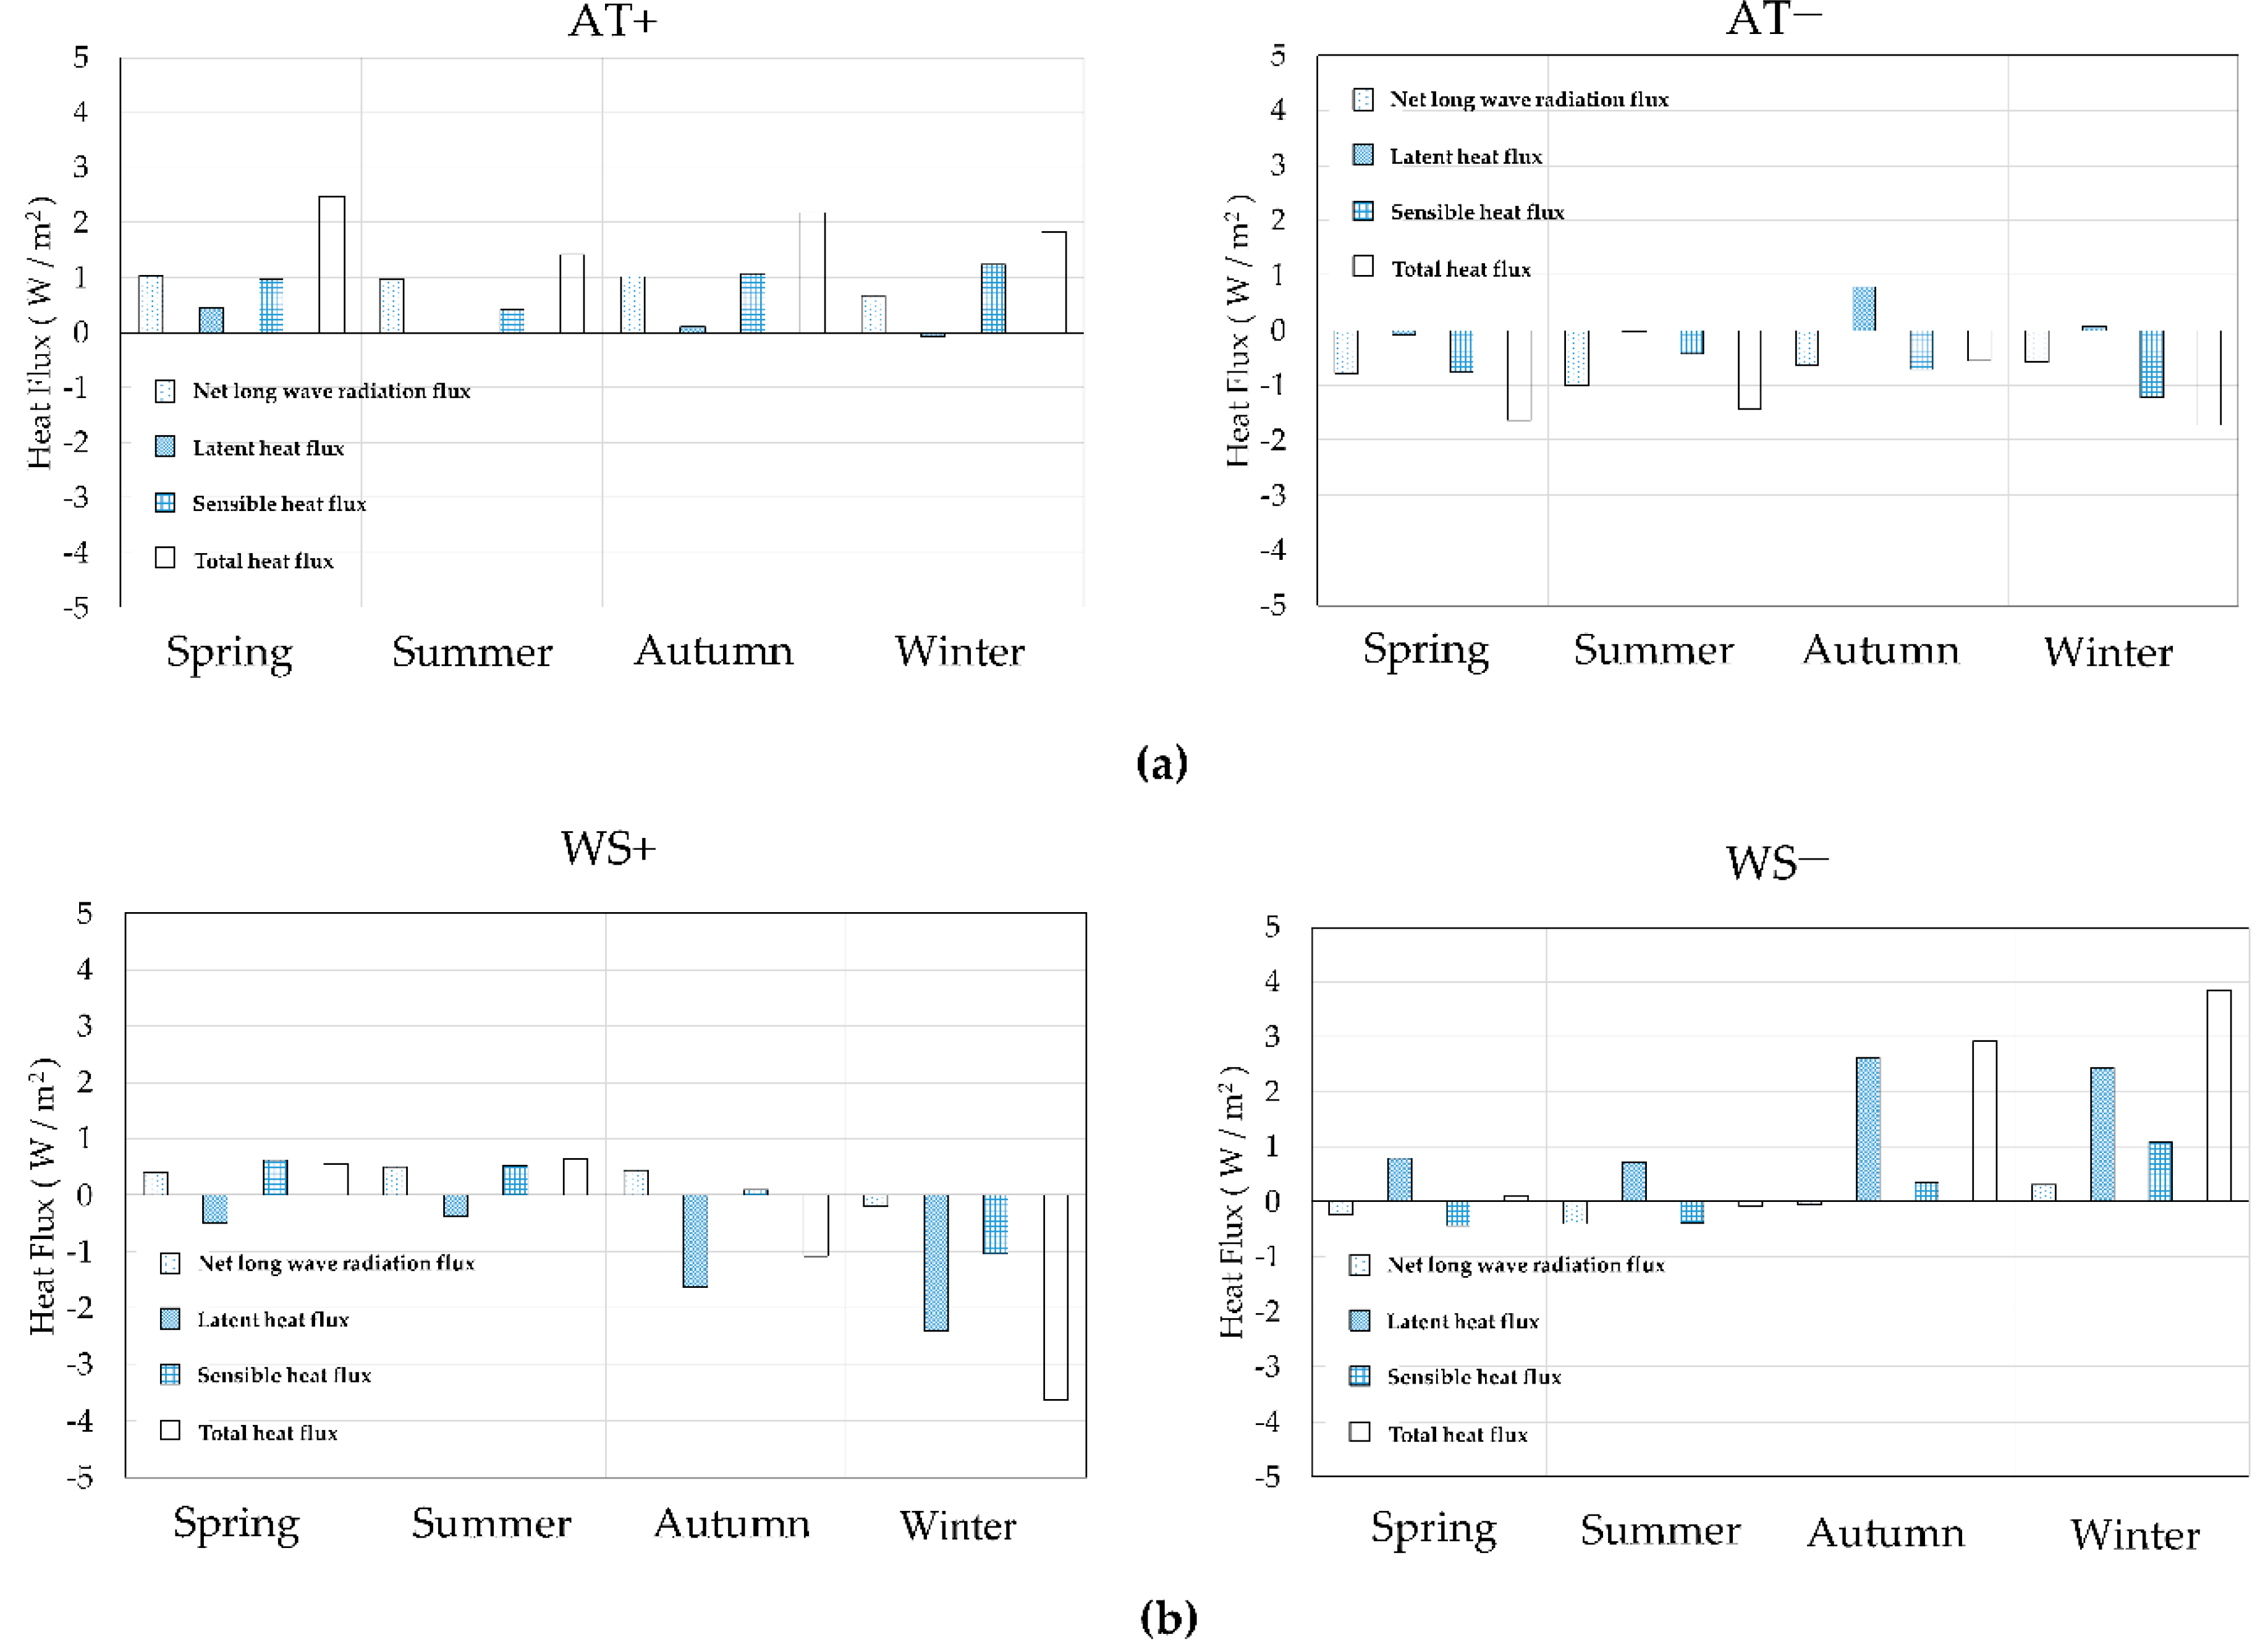
Figure 7 shows the seasonal heat flux differences between each hypothetical case and the baseline case at the surface of Imazu-oki. Since the short-wave radiation did not vary, the result of it is omitted from the figure.
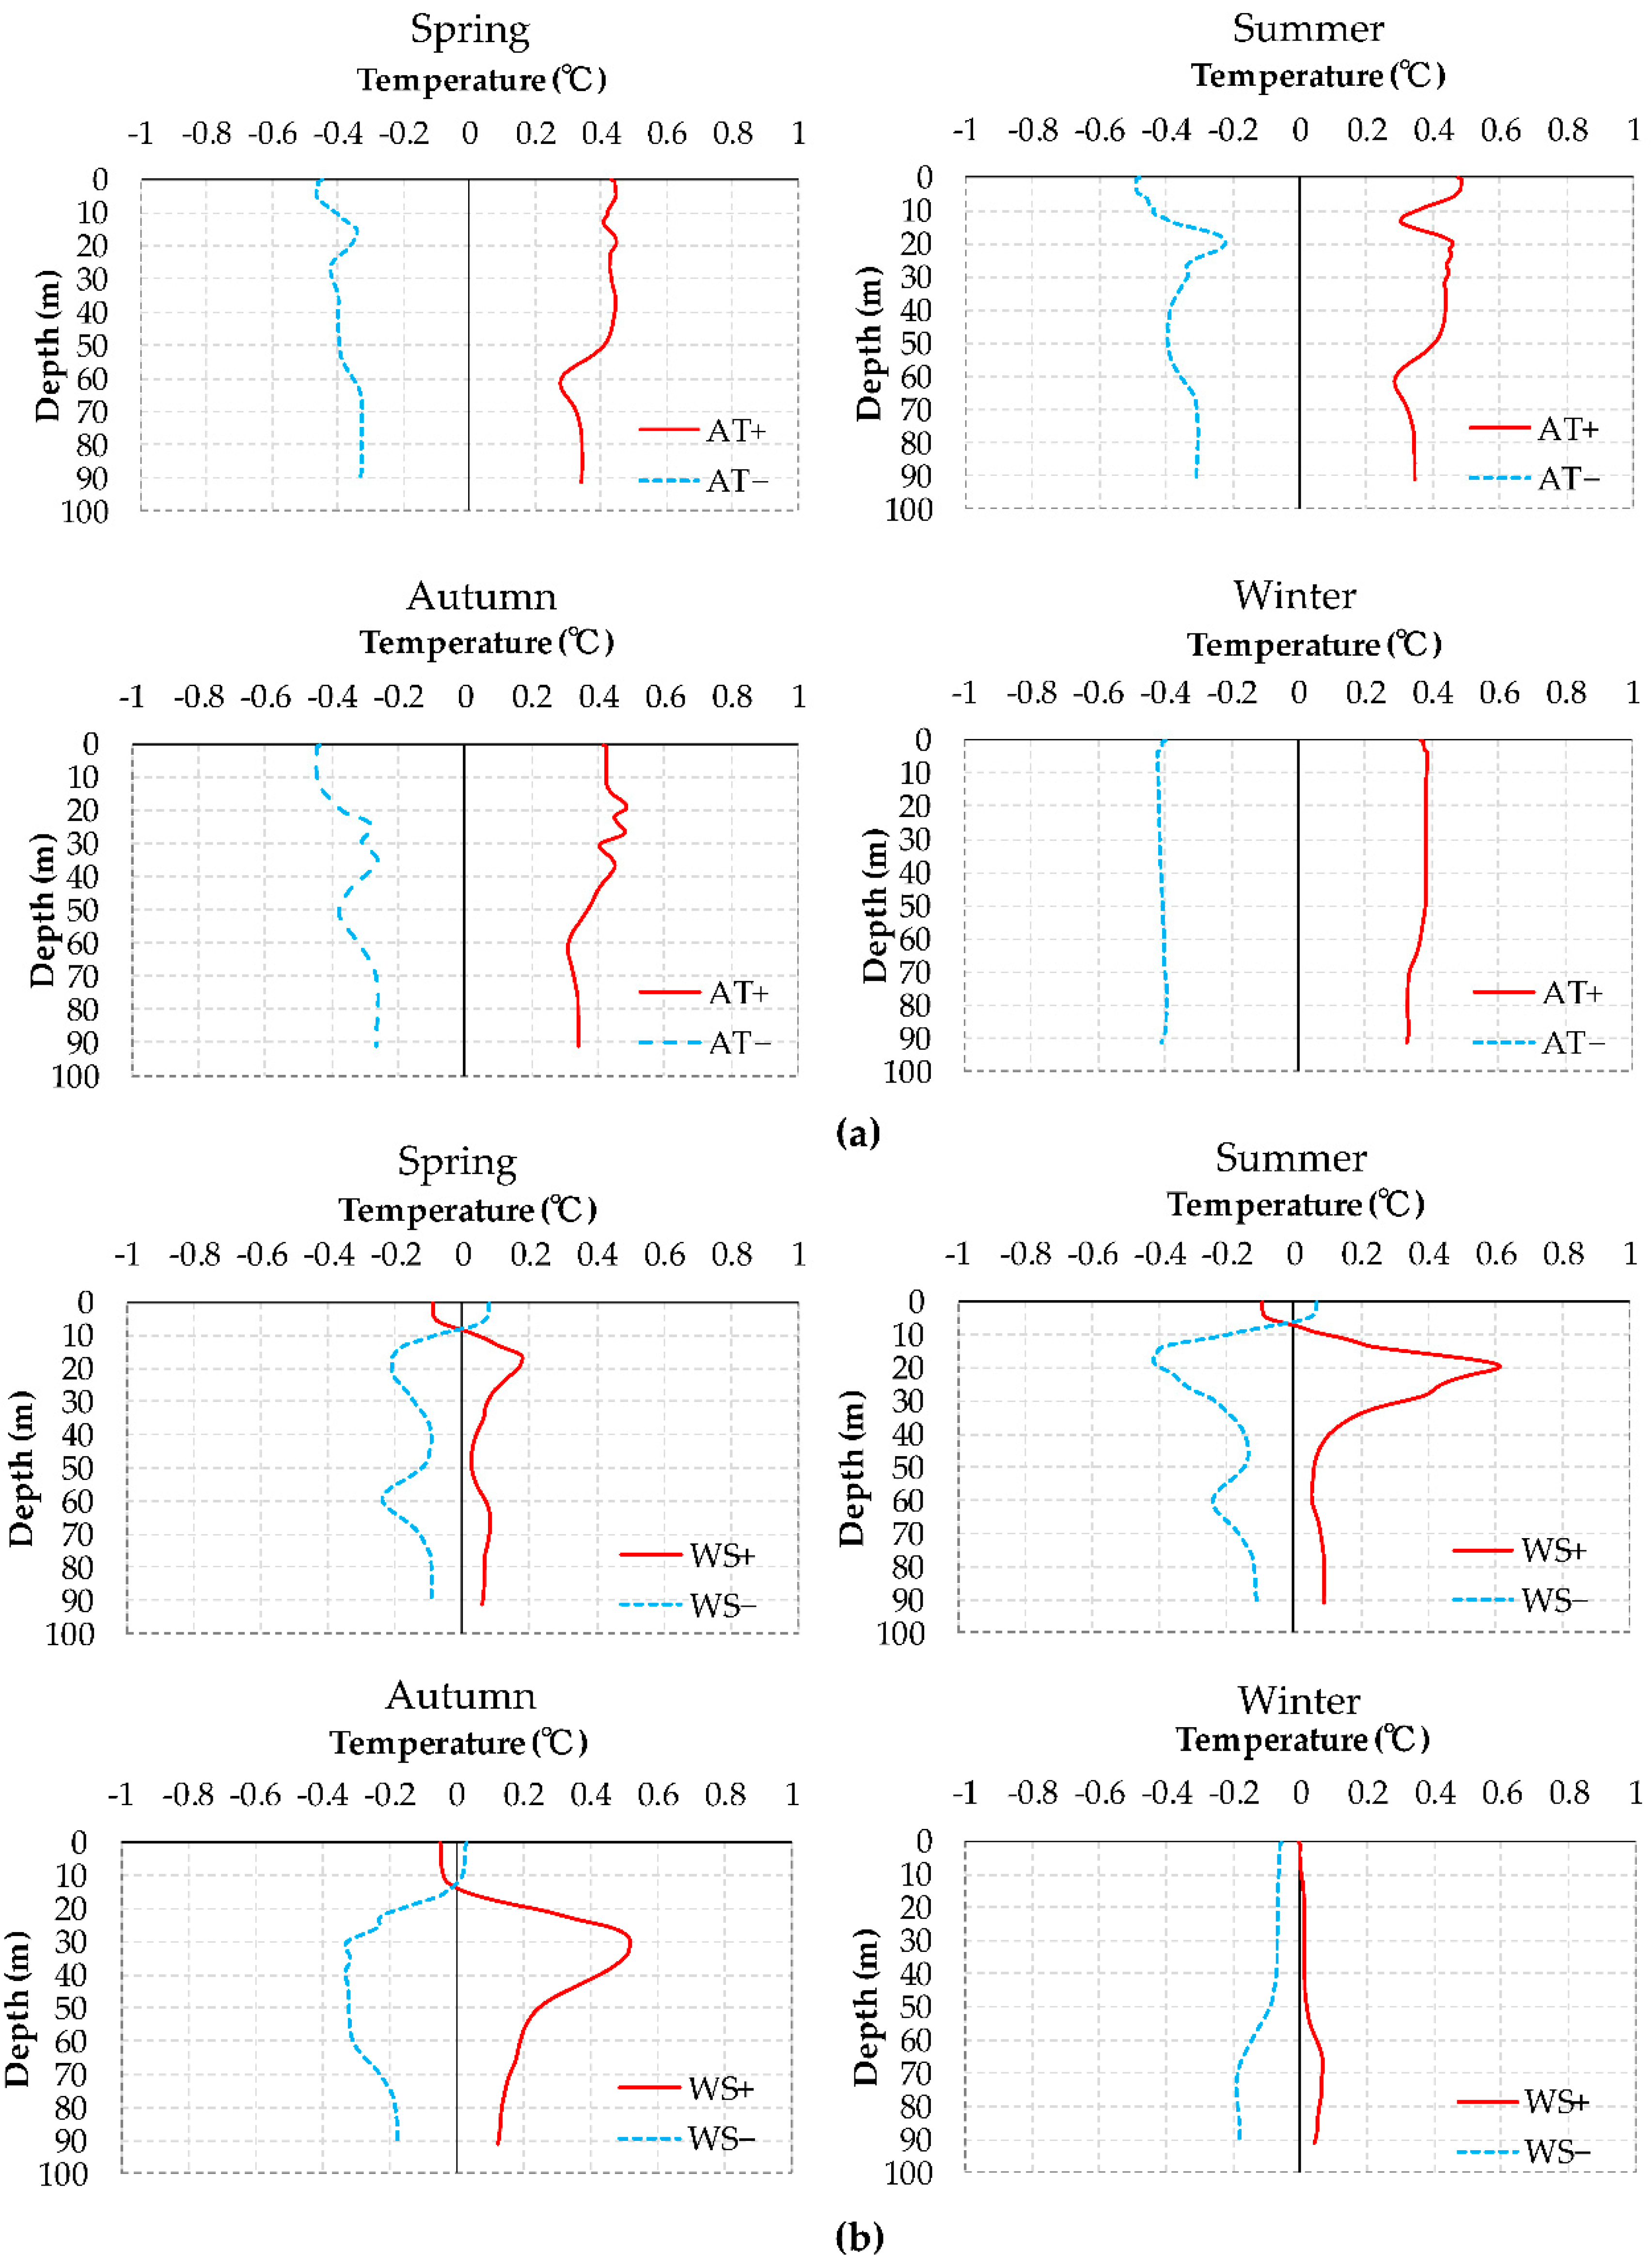
Figure 8 shows the difference of seasonal mean vertical distribution of water temperature between the hypothetical cases and the baseline case.
In case of AT+ (−), the structure of stratification altered little compared with the one in BASE. In
Figure 6a, the 5-year average value of the depth of the mixed layer and the thickness of the thermocline layer did not vary so much in AT+ (−). The difference between the heat balance of AT+ (−) and BASE was approximately 1 (−1) W/m
2 in each season for upward net long wave radiation and upward sensible heat flux (
Figure 7a). As the radiation of heat from the surface of the lake decreased, the surface water temperature tended to rise, and the mixed layer became thinner. In case of AT+ (−), the water temperature in all layers increased (decreased) almost equally (+0.2 to +0.5 K, (−0.5 to −0.2K)), therefore, the stratification strengthened little (
Figure 8a). The reason water temperature in all layers increased (decreased) almost equally is that due to the increase (decrease) in the heat flux from the atmosphere almost all the year, the water parcels of lake were not sufficiently cooled (warmed) during the complete circulation in winter The bottom water temperature was decided by the air temperature in winter according to Koue et al. [
30]. As a result, the difference between the surface temperature and bottom one did not become large, and the stratification hardly altered.
In case of WS+ (−), the thickness of the mixed layer and thermocline became thicker (thinner) in almost all the season. In WS+, the mixed layer became thicker especially in autumn (
Figure 6b). It is considered that the stratification easily collapsed due to the strong wind so that the vertical mixing occurred during the cooling period. The 5-year mean thicknesses of the mixed layer in autumn were 1 m larger than that in BASE, and the depth of mixed layer and thermocline were also larger (
Figure 6b). The reason the position of thermocline deepened is that because of the wind, the amplitude of internal wave was large, and the effect of wind stress reached the lower layer.
As for the difference in heat balance in WS+ (−), due to the increase (decrease) in wind speed, the upward latent heat flux increased (decreased) in each season (
Figure 7b). Evaporation from the lake surface increased in autumn and winter in general, and it decreased in spring and early summer when there was not much difference between the surface water temperature and the air temperature. Since the upward latent heat flux increased (decreased) by about 2 W/m
2 in autumn and winter, the total downward thermal flux decreased (increased) in autumn and winter (
Figure 8b). Water temperature in the surface layer decreased (increased) more than that in BASE (−0.2 to −0.1 K, (0.1 K)) from spring to autumn, the one near the thermocline increased (decreased) (+0.4 to +0.6 K, (−0.5 to −0.2 K)) from summer to autumn, and the other one in the bottom layer increased approximately 0.1 K (−0.2 K) in all seasons (
Figure 8b).
As the wind speed increased, the diffusivity increased. Thus, the vertical mixing was promoted. In addition, the warm water parcels were transported to the lower layer. Then, the colder water parcels near the thermocline were transported to the upper layer, and the vertical mixing was promoted. When the wind speed decreased, the water parcels between the surface layer and the thermocline became less mixed, and the stratification strengthened. Near the bottom layer, the transport of heat from the upper layer was reduced due to the weakening of the wind and the temperature was lower than the one in the surface layer. In WS−, from
Figure 8b, whereas the gradient of the vertical distribution of water temperature was larger than that in BASE, the thickness of the thermocline became thin. This suggests that as the wind speed weakened, the motion of the water parcels weakened, and a thinner and more solid stratification was formed.
According to Ito et al. [
32], a sensitivity analysis was performed for Lake Ikeda, Kagoshima prefecture, Japan. The area of Lake Ikeda is approximately 11 km
2 and the maximum water depth is 233 m. In the study, the sensitivities of the 10%-increased solar radiation, air temperature, relative humidity, and wind speed were estimated based on numerical calculations for 1981–2005 with the validated one-dimensional mathematical model that computes thermal transfer in the lake. The results showed that the meteorological component which brings the largest lake-heating was air temperature and the wind speed was the secondary large lake-heating factor. In their study, in the case that the increase in air temperature and wind speeds were approximately 1.8 K (10%) and 0.3 m/s (10%), they lead to the increase approximately 1.6 K and the decrease approximately 0.6 K in surface temperature. In the present study, in the case that the increase in air temperature and wind speeds were approximately 0.6 K (σ/µ) and 0.1 m/s (σ/µ), they lead to the increase approximately 0.45 K and the decrease approximately 0.1 K in surface temperature. We had the same result that the effect of the change in air temperature on surface temperature is larger than the one of wind speed as they did. In the present study, the hypothetical scenarios by obtaining the more realistic meteorological variation were considered. In addition, the detailed analyses for the vertical distribution of water temperature due to the change of air temperature and wind speed were performed by using the three-dimensional hydrodynamic model to take the effect of internal waves and gravity currents into account. Considering the climate change for the past 30 years, the rate of the variation of wind was a larger percentage than the one of air temperature, the wind effect on the structure of the stratification was larger than the one of air temperature. In the lake where the overturning occurs in winter, the sensitivity of stratification due to the change of air temperature was not so high. The difference between Lake Biwa and Lake Ikeda is the existence of the overturning in winter. Unlike Lake Ikeda, it is more likely that the difference of water temperature between the upper layer and the bottom layer does not become large in Lake Biwa year by year.
3.4. Influence on the Strength of Stratification by the Change of Meteorological Elements
To figure out the strength of the stratification more accurately in each case in detail, the buoyancy frequency is calculated. The buoyancy frequency (Brunt-Vaisala frequency) is an indicator of the strength of stratification. The square of the buoyancy frequency is given by the following equation.
If
N2 > 0, it is hydrostatically stable, and when
N2 < 0, it becomes hydrostatically unstable.
Figure 9 shows the vertical distribution of the 5-year average differences between the seasonal mean squares of the buoyancy frequency in each case and the baseline case.
In AT+ (−) stratification was strengthened (weakened) mainly in water depth 10 m from spring to summer, compared with BASE. The position where the stratification was strengthened (weakened) from autumn to winter varied from the water depth of 20 to 30 m to the water depth of 60 to 70 m (
Figure 9a). From spring to summer, due to the rise in air temperature, the heat flux from the atmosphere increased. The heat accumulated from the surface layer to just above the thermocline, and the stratification was strengthened. From autumn to winter, the surface layer was cooled as the air temperature decreased, and the cooling flux was transported to the lower layer.
Regarding the change in wind speed, in WS+ (−), the stratification was weakened (strengthened) mainly in water depth 10 m from spring to summer compared with BASE. In autumn, in WS+, the stratification was weakened at a water depth of 10 to 30 m, and the stratification was strengthened from 30 to 50 m. It is considered that the warm water parcel in the surface layer was transported downward, the water parcel of lower temperature near the thermocline was transported upward, and the vertical mixing was promoted in the mixed layer. The heat flux was not transported from the upper layer to the lower, since the wind stirred in the mixed layer directly.
In WS−, the stratification was strengthened at a water depth of 10 to 30 m, and the stratification was not strengthened beyond that. In winter, in WS+ (−), the stratification was strengthened (weakened) at a depth of 50 m or more (
Figure 9b). From the period of weak stratification in spring and autumn, the effect of wind was stronger than the effect of the change of air temperature. Even in summer when the stratification was strong, the influence of the change of wind speed had a wider influence on the deep-water layer than the change in the air temperature regarding the trend of climate change for 30 years.
3.5. Influence on the Period of Existence of Thermocline by the Change of Meteorological Elements
The change of the air temperature and wind speed alters the period of existence of thermocline.
Table 4 shows the start and end date, and period of the thermocline in BASE, AT+, AT−, WS+, and WS−. As described in
Section 3.1, the start date of thermocline was defined as the date when the thermocline began to be formed. The end date of thermocline was defined as the date when the thermocline disappeared. As shown in
Table 4, the start date varies with each weather condition. The end date of thermocline tends to be delayed due to the rise in air temperature. In the case of an increase (decrease) in wind speed, the start date of the thermocline became later (earlier) than that in BASE, and the end date became earlier (later) than that in BASE. As shown in
Table 4, the variation of air temperature had a little impact on the period of existence of thermocline by around 1 day. On the other hand, the variation of wind speed had a great impact on the period of existence of thermocline by 4 to 5 days. Under the condition of changing the wind speed, the period of thermocline greatly fluctuates more than in the case of changing air temperature, considering the trend of climate change for 30 years.
4. Conclusions
The stratification causes low dissolved oxygen especially in the bottom of the lake, which leads to the deterioration of water quality. In this study, the impacts of meteorological elements such as air temperature and wind speed on the structure of stratification in Lake Biwa, Japan were investigated by using the simulation outputs of the three-dimensional hydrodynamic model. To validate the model reproducibility, the structure of the stratification of Lake Biwa from 2007 to 2012 was simulated and the result of the model was compared with the observed data. Although the model slightly underestimated the thickness of thermocline, the simulated structure of stratification showed good agreement with the observation. In particular, the thickness of the mixed layer and the starting time of complete circulation were reproduced well. After evaluating the reproducibility of the model, we analyzed the sensitivity to the stratification structure by changing the meteorological elements. The standard deviation of the average yearly temperature and wind speed over 30 years from 1981 to 2010 were calculated. Then the pseudo-weather data were created by an increase or decrease the hourly air temperature or wind speed based on the standard deviation of them. Using pseudo-weather data, the hypothetical simulations were conducted for 5 years (from April 2007 to March 2012) to assess the effect of the change of the air temperature and wind speed.
The simulation result shows that the increase of the air temperature caused the increase of the net long wave radiation and the sensible heat flux of each season, and the increase of the heat flux in winter, the period of complete circulation, caused the uniform rise in water temperature. As a result, the structure of stratification fluctuated little because the vertical distribution of water temperature did not alter so much. When the air temperature decreased, the opposite result was obtained. As the wind speed increased, the vertical mixing increased, and the mixed layer became deeper. Especially in the cooling season (in autumn and winter), the strong wind increased the upward latent heat flux and the vertical convection. In addition, during the weak stratification period in spring and autumn, the thermocline gradually deepened and became thicker. In the condition of decreasing the wind speed, the water parcels between the surface layer and the thermocline became less mixed and a thinner and more solid stratification was formed. Moreover, the variation of wind speed has about five times greater impact on the period of existence of thermocline than the variation of air temperature, considering the trend of climate change for 30 years.
These findings indicate that the variation of wind speed has a larger effect on the structure of the stratification than the variation of air temperature regarding the trend of climate change for 30 years.


