Optimized Water and Fertilizer Management of Mature Jujube in Xinjiang Arid Area Using Drip Irrigation


1
College of Water and Architectural Engineering, Shihezi University, Shihezi 832000, Xinjiang, China
2
Key Laboratory of Modern Water-Saving Irrigation of Xinjiang Production and Construction Corps, Shihezi University, Shihezi 832000, Xinjiang, China
3
College of Agricultural and Life Sciences, University of Wisconsin-Madison, Madison, WI 53706, USA
*
Authors to whom correspondence should be addressed.
Water 2018, 10(10), 1467; https://doi.org/10.3390/w10101467
Submission received: 7 September 2018
/
Revised: 12 October 2018
/
Accepted: 15 October 2018
/
Published: 17 October 2018
(This article belongs to the Special Issue Data-Driven Methods for Agricultural Water Management)
Abstract
:Studying water–fertilizer coupling effects in a drip irrigation system is critical for sustainable agricultural development in arid areas, such as that of Xinjiang in China, to find out the optimized water and fertilizer management. Therefore, a two-year field experiment was conducted to find out how the combination of three levels of irrigation quotas and three levels of fertilizer amounts would affect the physiological and growth indexes of jujube, as well as ascertain the differences between drip irrigation and flood irrigation. The results showed that the interacted and coupled effects of irrigation and fertilization influenced most of the physiological indicators and growth indexes. On the other hand, the physiological and growth indexes were increased after transferring flood irrigation to drip irrigation, as the maximum chlorophyll content (CC) and photosynthetic nitrogen use efficiency (PNUE) values increased on average by 6.00%, and 11.39% in 2016, and 1.47% and 6.83% in 2017, respectively. Undoubtedly, inappropriate water and fertilizer management had negative impacts on jujube growth and yield. Based on the treatments and results in this paper, low fertilizer and moderate irrigation would be the best choice. The crop yield, irrigation water use efficiency (iWUE), and fertilizer partial productivity (PFP) increased by 6.77%, 29.48%, and 193.62% in 2016, and similar increments were also found in 2017 of 6.17%, 78.72%, and 133.06%, respectively. This indicated that fertilizer efficiency was promoted along with water use, and in turn, the water amounts were adjusted by the amount of fertilizer that was applied. Based on a comprehensive consideration of the physiological and growth indexes, a mathematical model was established, and the optimized irrigation and fertilizer amounts of jujube in northern Xinjiang area were found to be 815 mm and 400 kg ha−1 (with N–P2O5–K2O proportioned at 2–1–1.5). The results that were obtained in this paper would provide theoretical reference to the sustainable development of jujube plantation using drip irrigation in the arid areas.
1. Introduction
Jujube (Zizyphus jujube mill) is one of the most important economical crops in the northern desert of Xinjiang area in China, and it has become one of the Chinese’s favorite fruits due to its good taste, sufficient nutrition, and medical value [1]. The planting area of jujube in Xinjiang has reached 4.3 × 10⁵ hm2, which has made it the most planted fruit in China. However, the majority of jujube are still using flood irrigation, and the irrigation quota exceeds 1000 m3/mu, leaving merely 9.5% applying drip irrigation. The traditional flood irrigation applied to a jujube plantation has disadvantages in its water-usage efficiency (WUE), production efficiency, and effects on the ecological environment [2]. On the contrary, drip irrigation is a high-efficiency water-saving irrigation method that directly supplies water and nutrients to the root of crops. As an extreme water shortage has always been the key barrier of agriculture in this area, scholars have increasingly paid more and more attention to drip irrigation technology [3].
Some related results indicated that different crops and soil types all showed positive responses to drip irrigation, compared with the traditional flood irrigation, as the crop yield increased to some extent [4]. Fertigation is the other critical factor that affects water and nutrient supplements, and thus affects crop yield and WUE [5]. In general, the rational management of water–fertilizer showed positive impacts on improving water and fertilizer management [6,7]. The effects of water and fertilizer on crop growth are not isolated, but instead interact with each other, and show a coupling effect [8]. Some scholars have explored multiple crops using drip irrigation and fertilization, such as wheat [9], cotton [10], and fruit trees [11,12]. Although the results were different as the irrigation quota and fertilizer requirement were obviously different for each type of crop studied, these studies determined that reasonable irrigation and fertilization was beneficial to the improvement of the physiological characteristics and yield of crops. Although several scholars studied the effects of irrigation or fertilizer on the jujube plantation, limited results were related to deficit irrigation [13,14] and drip irrigation [15], and no direct results were reported on the water–fertilizer interaction using the drip irrigation system, especially in extremely arid areas, such as Xinjiang province in China [1]. The difference between drip irrigation and flood irrigation were also unknown.
Based on these, a two-year field experiment was conducted to study the effects of different water and fertilizer treatments on the physiological growth and yield of jujube in Xinjiang, China. The study aims to find out the optimized water–fertilizer management of jujube in northern Xinjiang area, and thus provide guidance for the sustainable development of the jujube plantation using drip irrigation in the arid areas.
2. Materials and Methods
2.1. Experimental Site
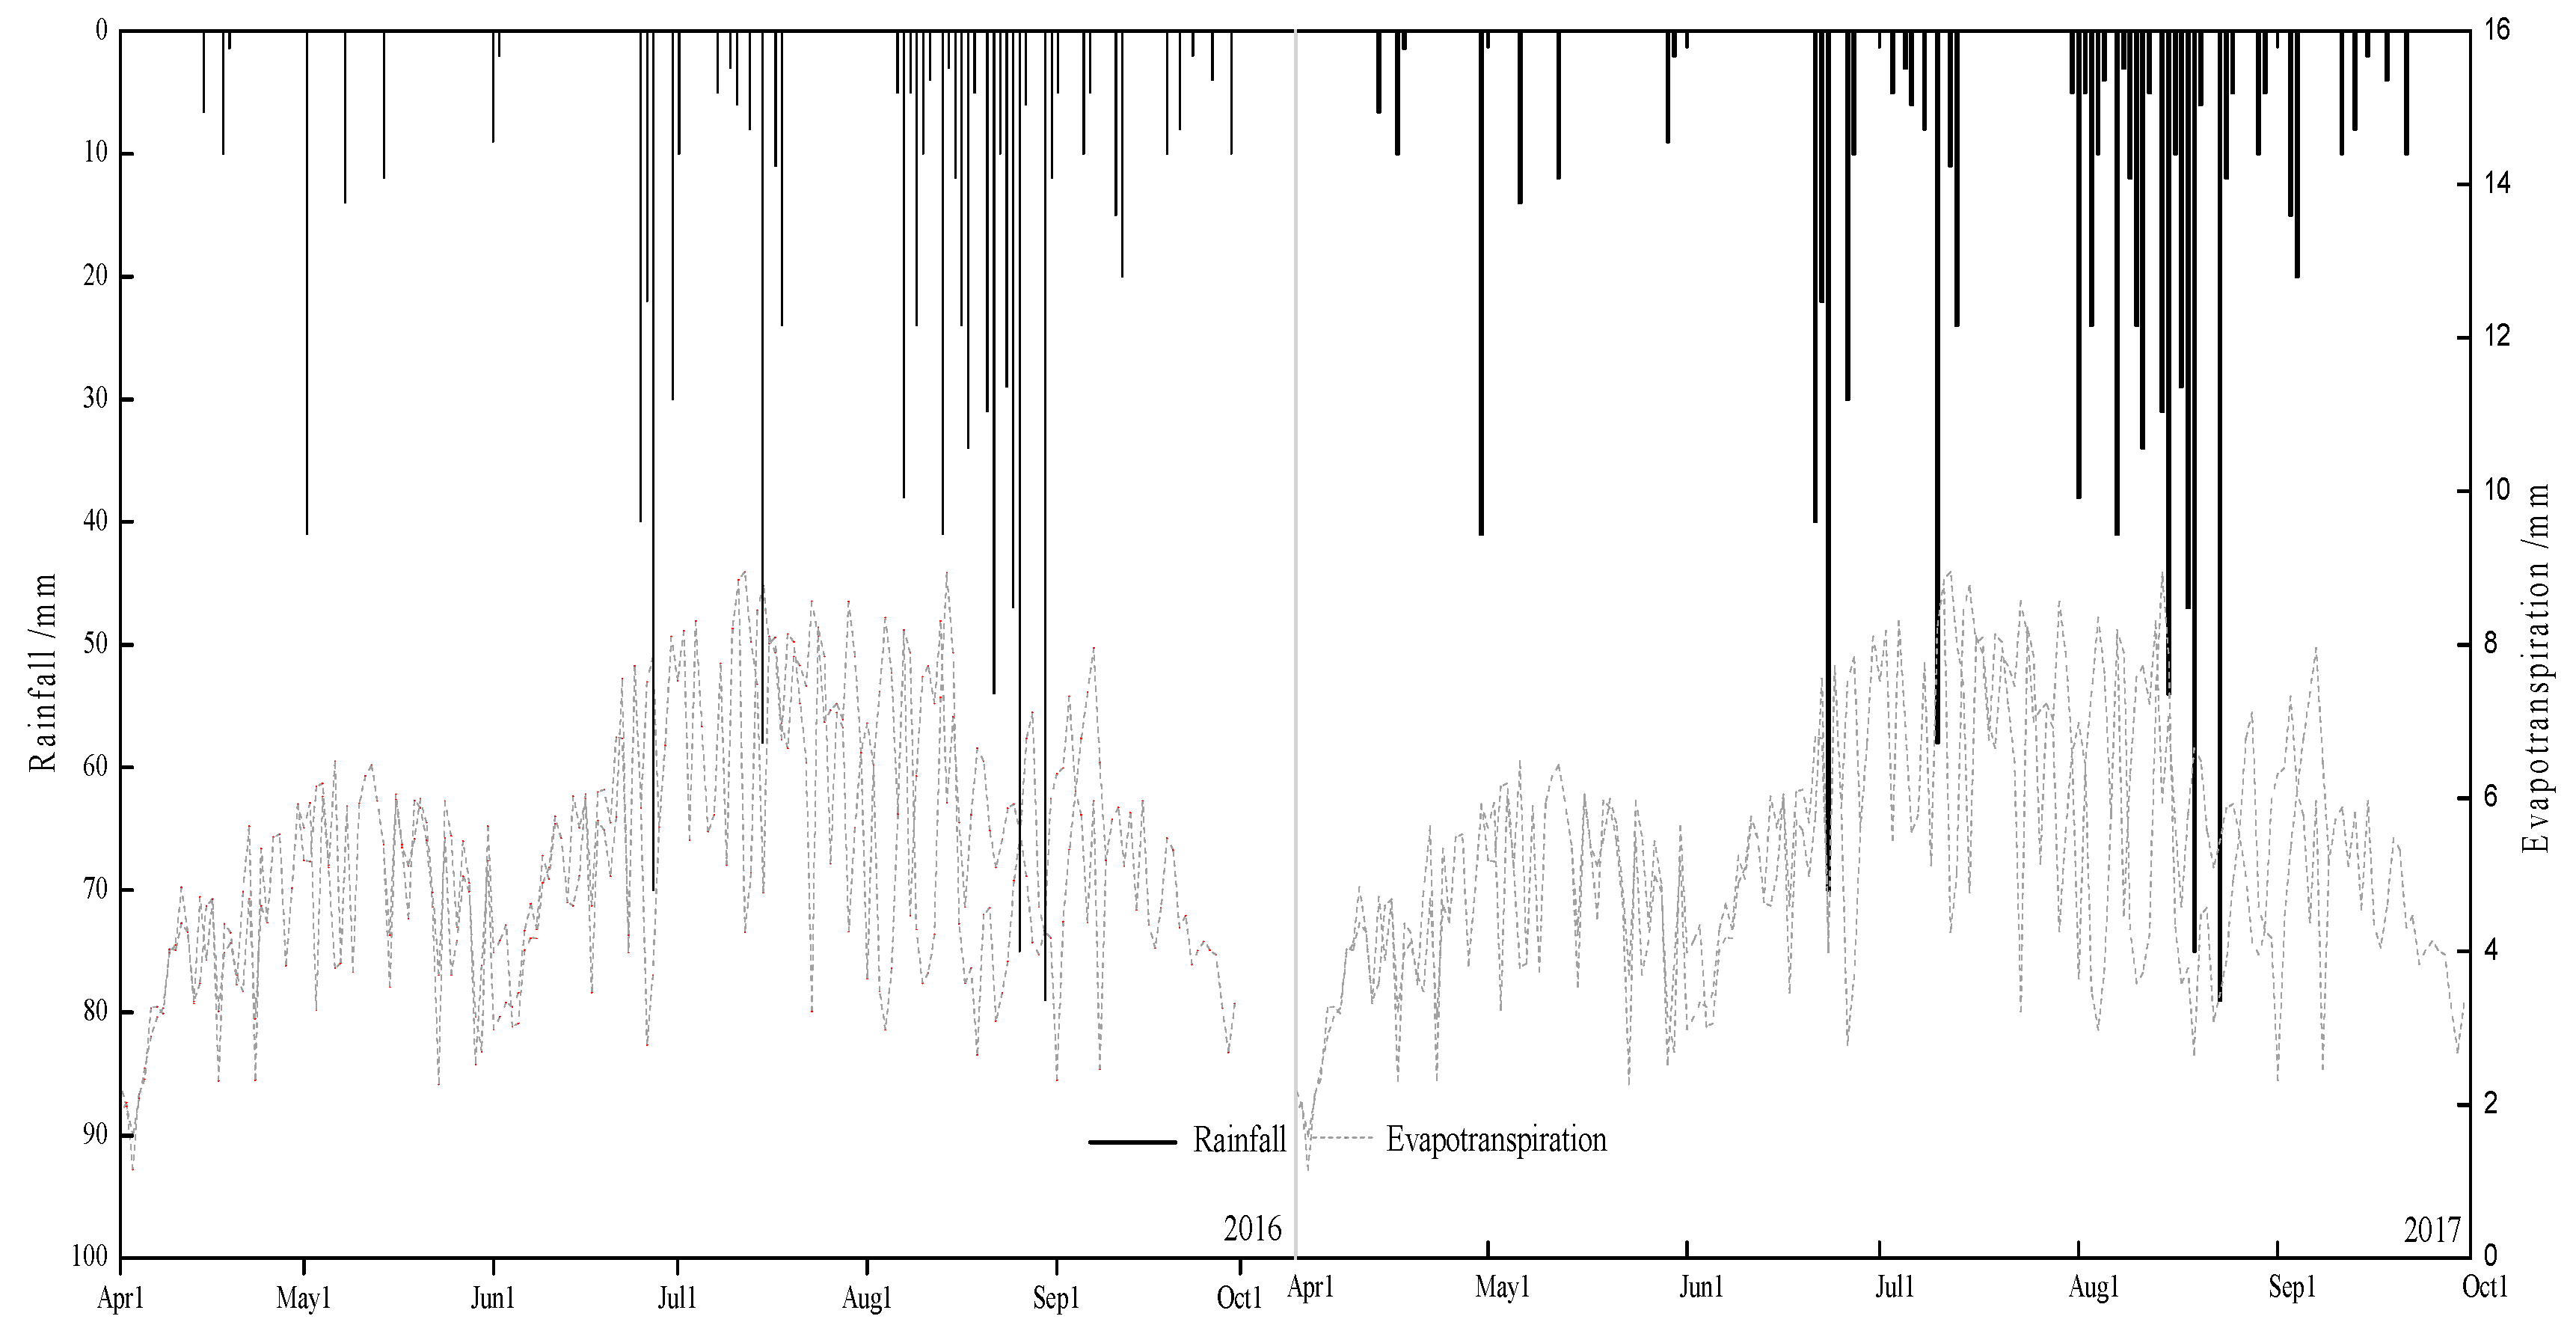
The experiment was conducted at Alar agricultural irrigation experiment station, Xinjiang, China (40°34′28′′ N, 81°14′12′′ E, altitude 1015 m, Figure 1), which has a typical extreme continental arid climate. The experiment was carried out in 2016 and 2017, the average annual rainfall was 67 mm (May–October), and the average sunshine hours and temperature were 2865 h and 10.7 °C, separately. Local groundwater was below 3.5 m, and the atmospheric pressure, ground temperature, effective radiation, minimum relative humidity, and solar radiation were automatically monitored and recorded using a meteorological station (TRM-ZS2). Figure 2 represents the rainfall and reference evapotranspiration during the experiment. Besides, the organic matter, total nitrogen, available P, and available K, were 3.81 g·kg−1, 0.47 mg·kg−1, 9.4 mg·kg−1, and 68 mg·kg−1 in the upper 0.2 m soil layer, respectively, and the other soil properties are shown in Table 1.
2.2. Field Experiment Layout
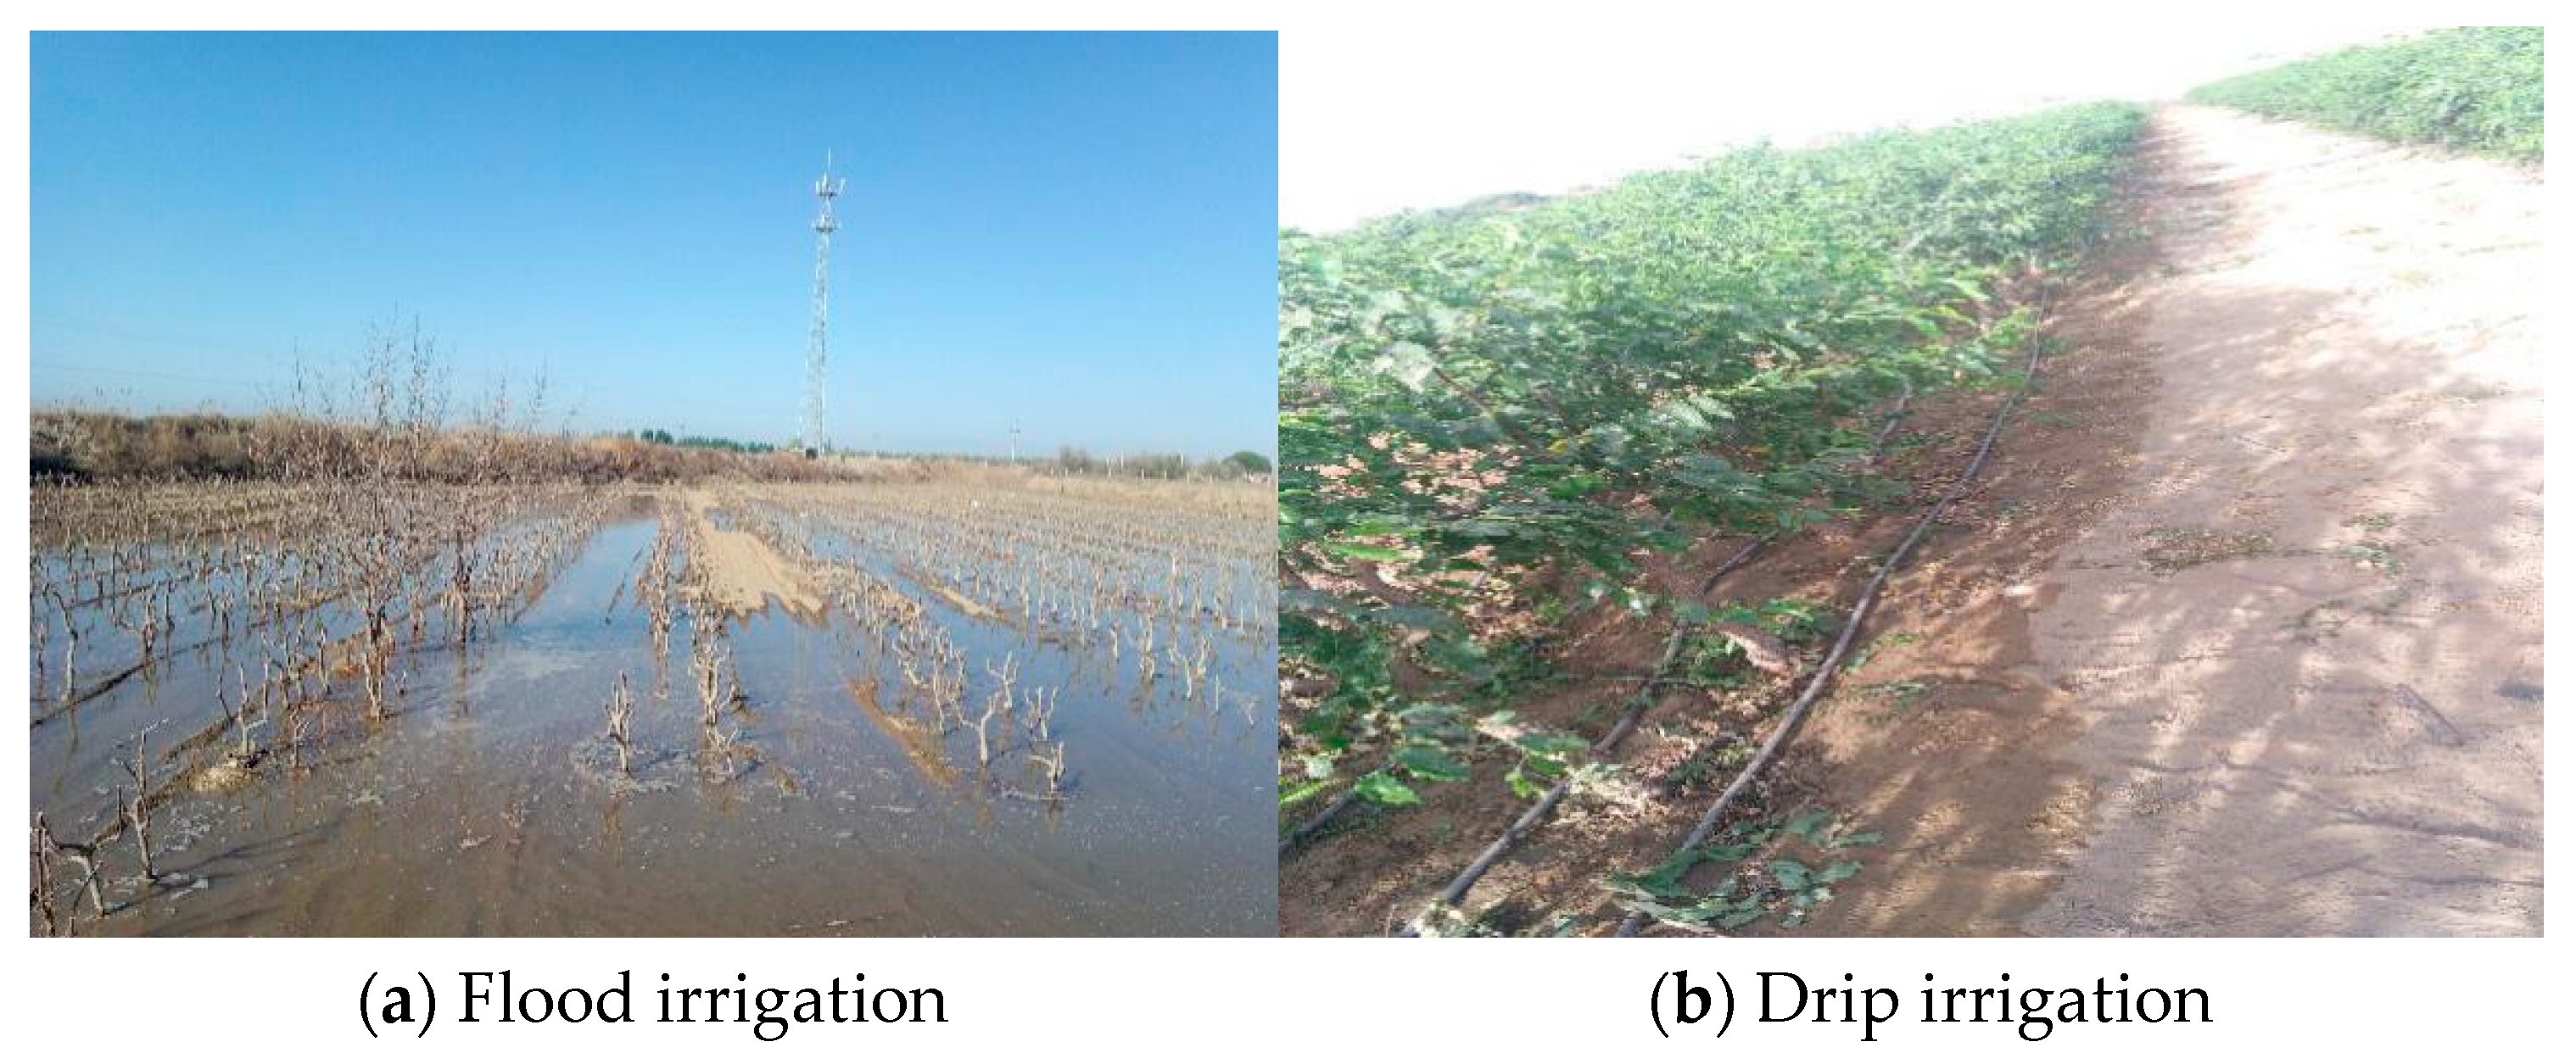
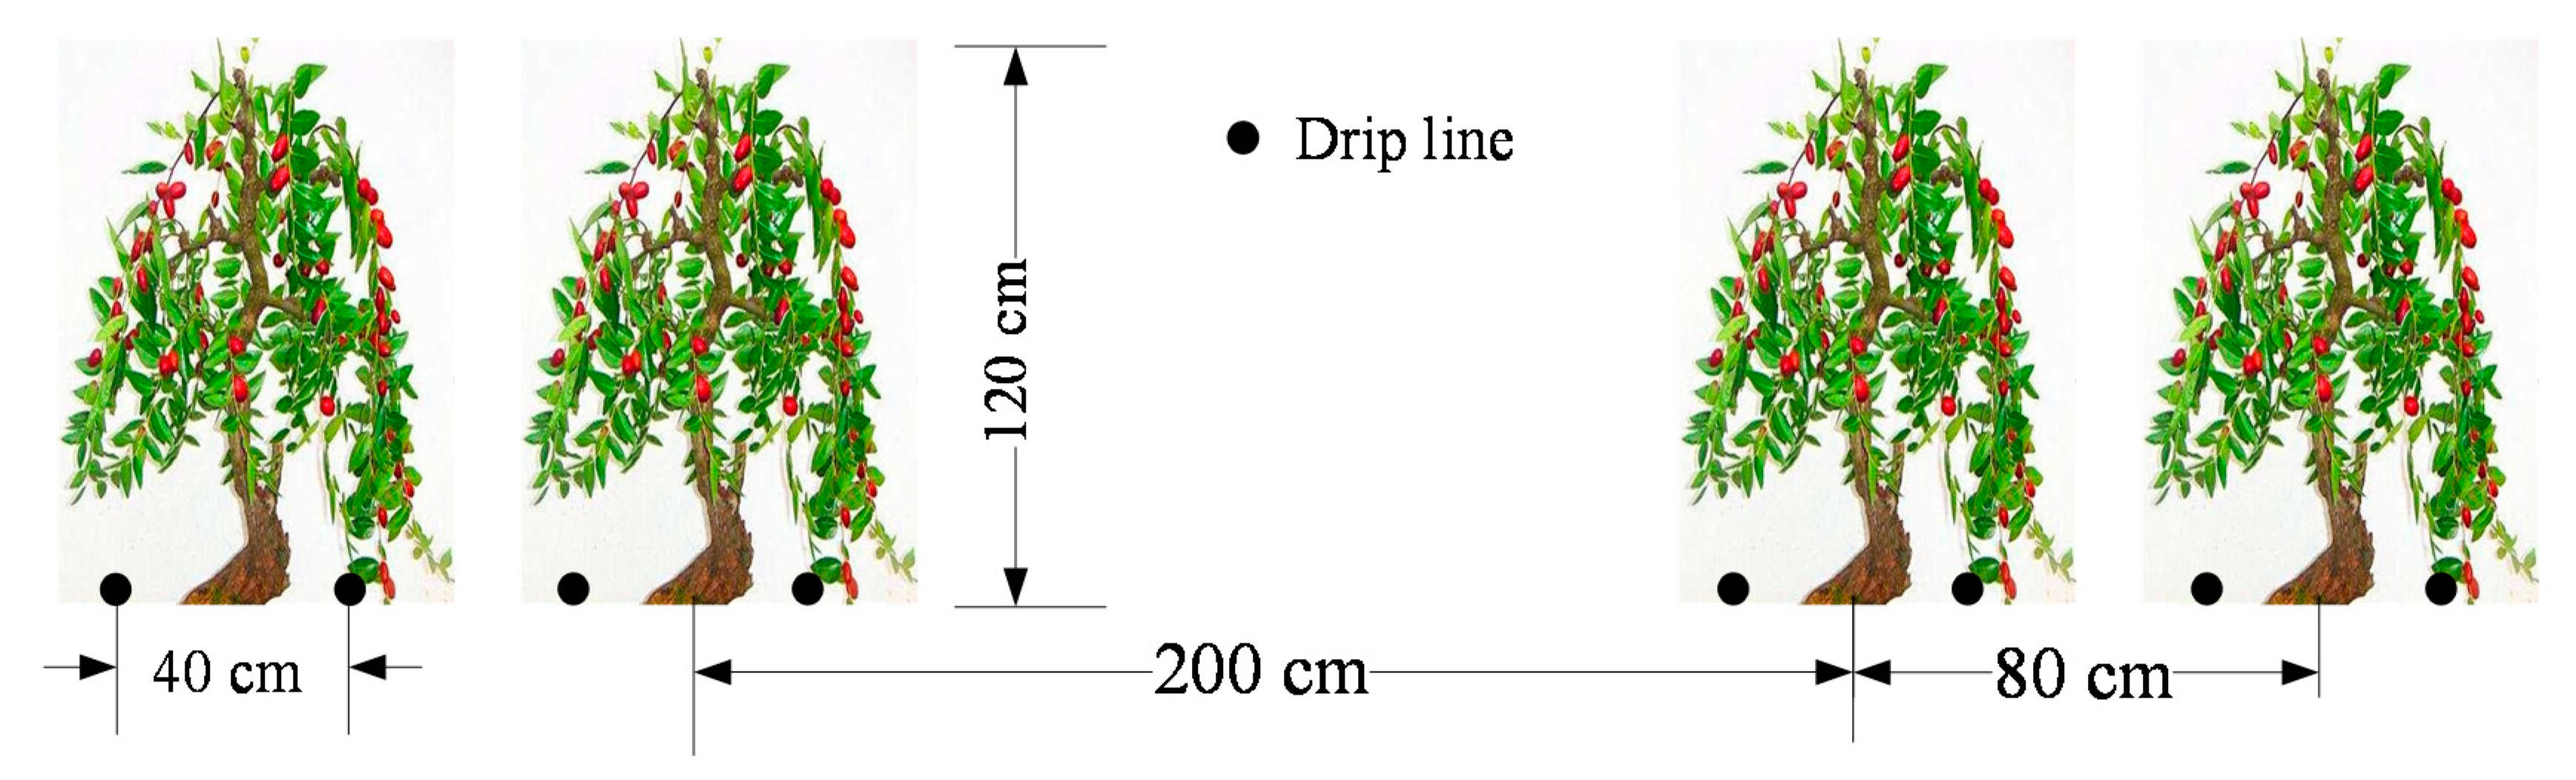
Eight-year-old mature jujube trees (Zizyphus Jujube Mill) were selected for the experiment. They were planted in 2008 and grafted in 2009, and flood irrigation was applied until 2015. The annual irrigation and fertilization amounts (N–P–K) were 1020 mm and 600–300–450 kg ha−1, respectively. Their water and fertilizer management transferred from flood irrigation to drip irrigation on 2016 (Figure 3). The wide–narrow row-planting mode was applied, which means that the distance between jujube rows were 200 cm (wide row) and 80 cm (narrow row) by turns. Each row of jujube was irrigated with two driplines centered in narrow rows with 40 cm on each side. Jujube was planted at constant intervals of 80 cm in each row, and the emitter spacing was 30 cm. The overall layout of the experiment was displayed in Figure 4. The drip irrigation system was operated under the constant working pressure of 0.10 MPa and was 20 m in length, and the rated outflow of each emitter was 2 L h−1 with an internal diameter of 12 mm.
2.3. Experiment Design
To find out the optimized water and fertilizer management of jujube when changing from traditional flood irrigation to drip irrigation, two factors and three levels of treatments were set up for two years. The irrigation quota and fertilizer amount (N:P:K = 2:1:1.5 based on local agricultural management) were defined as the two factors. In 2016, three levels were included in irrigation amounts as 620 mm (W1), 820 mm (W2), and 1020 mm (W3), and the fertilizer treatments were 450 kg ha−1 (F1), 900 kg ha−1 (F2), and 1350 kg ha−1 (F3). In 2017, irrigation amounts were 570 mm (W1), 770 mm (W2), and 970 mm (W3), and the fertilizer treatments were 410 kg ha−1 (F1), 860 kg ha−1 (F2), and 1310 kg ha−1 (F3), respectively. These values were based on the comprehensive consideration of local evaporation, seeding time, and the flood irrigation references. The traditional flood irrigation was treated as control check (CK), and thus, there were 10 treatments in total for the orthogonal experiment, and three replications for each treatment. The detailed water and fertilizer managements during the experiment are shown in Table 2. During the experiment, fertilization was conducted both for 30 min after operation began and 30 min before irrigation stopped.
2.4. Measurements and Methods Applied
2.4.1. Crop Growth
The ISL were measured on 5 May 2016 for the first time, and continued until 10 July with the constant interval of seven days. In 2017, the two indicators were first measured on 10 May, and continued until 15 July with same interval. During each measurement, five jujube trees were selected, and ISL was measured with the tapeline.
2.4.2. Photosynthetic Characteristics
Leaf photosynthetic characteristics, including Pn, Gs, Ci, and Tr were measured on 30 July 2016 and 25 July 2017, respectively. Validation experiment was conducted between 10:00 and 20:00 on 31 July 2016 and 25 July 2017, on three expanded upper canopy leaves of each tree (five trees for each treatment) with the Li-6400 Portable Photosynthetic System (manufactured by Li-Cor Inc., Lincoln, NE, USA). This system was equipped with a red/blue light source (6400-02B LED).
2.4.3. Chlorophyll and Nitrogen Contents
In this experiment, the chlorophyll content (CC) was measured by Minolta SPAD 502 m. Three jujube trees were selected for each treatment, and the upper, middle, and lower leaves of each tree were measured. Each treatment totaled nine leaves and took the average. Then, the CC was separated from the plant at 105 °C for 30 min, and then dried at 80 °C to constant quality. Then, the leaf nitrogen content (NC) was measured by a semi-micro Kjeldahl method [16]. Photosynthetic nitrogen use efficiency (PNUE) was calculated by Pn/NC [17].
2.4.4. Water and Fertilizer Efficiency and Crop Yield
The irrigation water use efficiency (iWUE) (unit: kg·m−3) was calculated according to the method used by Kuslu et al. [18]. The fertilizer partial productivity (PFP) (unit: kg·kg−1) referred to the method that was used by Ierna et al. [19]. The jujube yield was measured with five trees and took their average value. Then, its EI was calculated using the method applied by Badr et al. [20], which was based on the difference between the yield of treatments and CK.
2.4.5. Water and Fertilizer Optimization Method
The binary quadratic regression equation was applied for optimized water and fertilizer management. Y was regarded as the dependent variable (Y), and the irrigation amount (W) and fertilizer amount (F) were treated as the independent variables.
3. Results and Analysis
3.1. Effects of Water–Fertilizer Treatments on the Physiological Indicators
The effects of the different water and fertilizer treatments on the physiological indicators (Pn, Tr, Gs, Ci CC, and PNUE) are shown in Table 3.
Seen from Table 3, the Pn, Tr, Gs, and Ci values of different water and fertilizer treatments ranged within 7.26~8.94 μmol·m−2·s−1, 3.15~3.86 mmol·m−2·s−1, 0.31~0.49 μmol·m−2·s−1, and 447.5~707.41 μmol·m−2·s−1, respectively, in 2016. Similar values were acquired in 2017 as 7.54~8.51 μmol·m−2·s−1, 3.24~3.68 mmol·m−2·s−1, 0.36~0.48 μmol·m−2·s−1, and 568.48~678.22 μmol·m−2·s−1, respectively. The maximum values were all observed in W2F1 treatment for two years, and they were larger than those of CK by 3.65~12.61%, 3.67~17.32%, 6.67~8.89%, and 10.66~19.30%, respectively. These results indicated that the medium irrigation quota was helpful to improve the efficiency of lower-level fertilizer and resulted in the most positive effects on these four indexes. Generally speaking, the Pn, Tr, Gs, and Ci values were significantly affect by an irrigation quota of (p < 0.01), but their dynamic responses to fertilizer amounts failed to reach a significant level (p < 0.05). As the effects of irrigation were higher than fertilization, their coupling effects also reached the significant level (p < 0.05).
Meanwhile, the CC of different water and fertilizer treatments ranged from 43.17 mg·g−1 (W1F3) to 53.00 mg·g−1 (W3F3) in 2016, and from 44.2 mg·g−1 (W1F3) to 51.81 mg·g−1 (W3F3) in 2017. The minimum and maximum values were obtained in the same treatments. Compared with W1F3 and CK, the CC value under W3F3 treatment was increased by 17.22~22.77% and 1.47~6.00%, respectively. The CC was not affected by the fertilizer level, as the effects of the irrigation quota was much more significant. However, the maximum and minimum PUNE were obtained in different treatments, which were W1F2 (1.95 μmolCO2·g−1·Ns−1) and W2F2 (2.25 μmolCO2·g−1·Ns−1) in 2016, and turned out to be W1F1 (1.96 μmolCO2·g−1·Ns−1) and W2F1 (2.19 μmolCO2·g−1·Ns−1) in 2017. A small irrigation quota seemed to be beneficial for improving the PUNE. However, their effects were combined with those of different fertilizer treatments. According to the significant test, the effect of merely irrigation or fertilization on these three indicators that were mentioned above was not significant (p < 0.05), but their interactions on CC and PUNE reached significant values (p < 0.01).
3.2. Effects of Water–Fertilizer Treatments on the Growth Indexes and Crop Yield
The effects of different water and fertilizer treatments on the growth indexes are shown in Table 4.
As shown in Table 4, ISL values were 48~49 cm (W1F1) to 62~64 cm (W3F2) in 2016 and 2017, and ISL values under W3F2 treatment were 26.53~51.32% and 3.33~21.58% larger than those of W1F1 and CK. Seen from the results obtained, the irrigation quota was more related to ISL, as more irrigated water were helpful to obtain larger ISL values, and the effects of irrigation quotas on the differences of ISL values reached a significant level (p < 0.05), while those of fertilizer amounts failed. However, their coupling effects were enhanced to significant impacts under the significant level of p < 0.01. On the other hand, Ymax and Ymin were acquired in W2F1 (7256 kg·ha−1) and W1F2 (4661 kg·ha−1), while that of YCK was 6976 kg·ha−1 in 2016. Similar results were obtained in 2017. Besides, the highest PFP values were in both W2F1 treatments for two years, and it was 133.06~193.62% higher than that of CK (5.49 kg·kg−1). However, the highest iWUE value was obtained under W1F3 treatment in both 2016 and 2017 (8.17 kg·m−3 and 14.86kg·m−3), which increased by 29.48% and 78.72% when compared with CK (6.31 kg·m−3 and 8.31 kg·m−3). The improving effect (EI) of W1F2, W3F2, and W3F3 treatments were negative values, and the EImax was acquired in W2F1 treatment (33.14% and 24.86%). Based on the two-year data analysis, the iWUE was significantly affected by irrigation quotas (p < 0.05), the PFP was significantly influenced by fertilizer amounts (p < 0.01), and they were both significantly affected by the coupling effects of water–fertilizer (p < 0.01). Besides, the crop yield was significantly affected neither by the irrigation quota nor the fertilizer amount; only their interaction reached the significant level (p < 0.01).
3.3. Optimized Water and Fertilizer Managements of Jujube in the Xinjiang Area
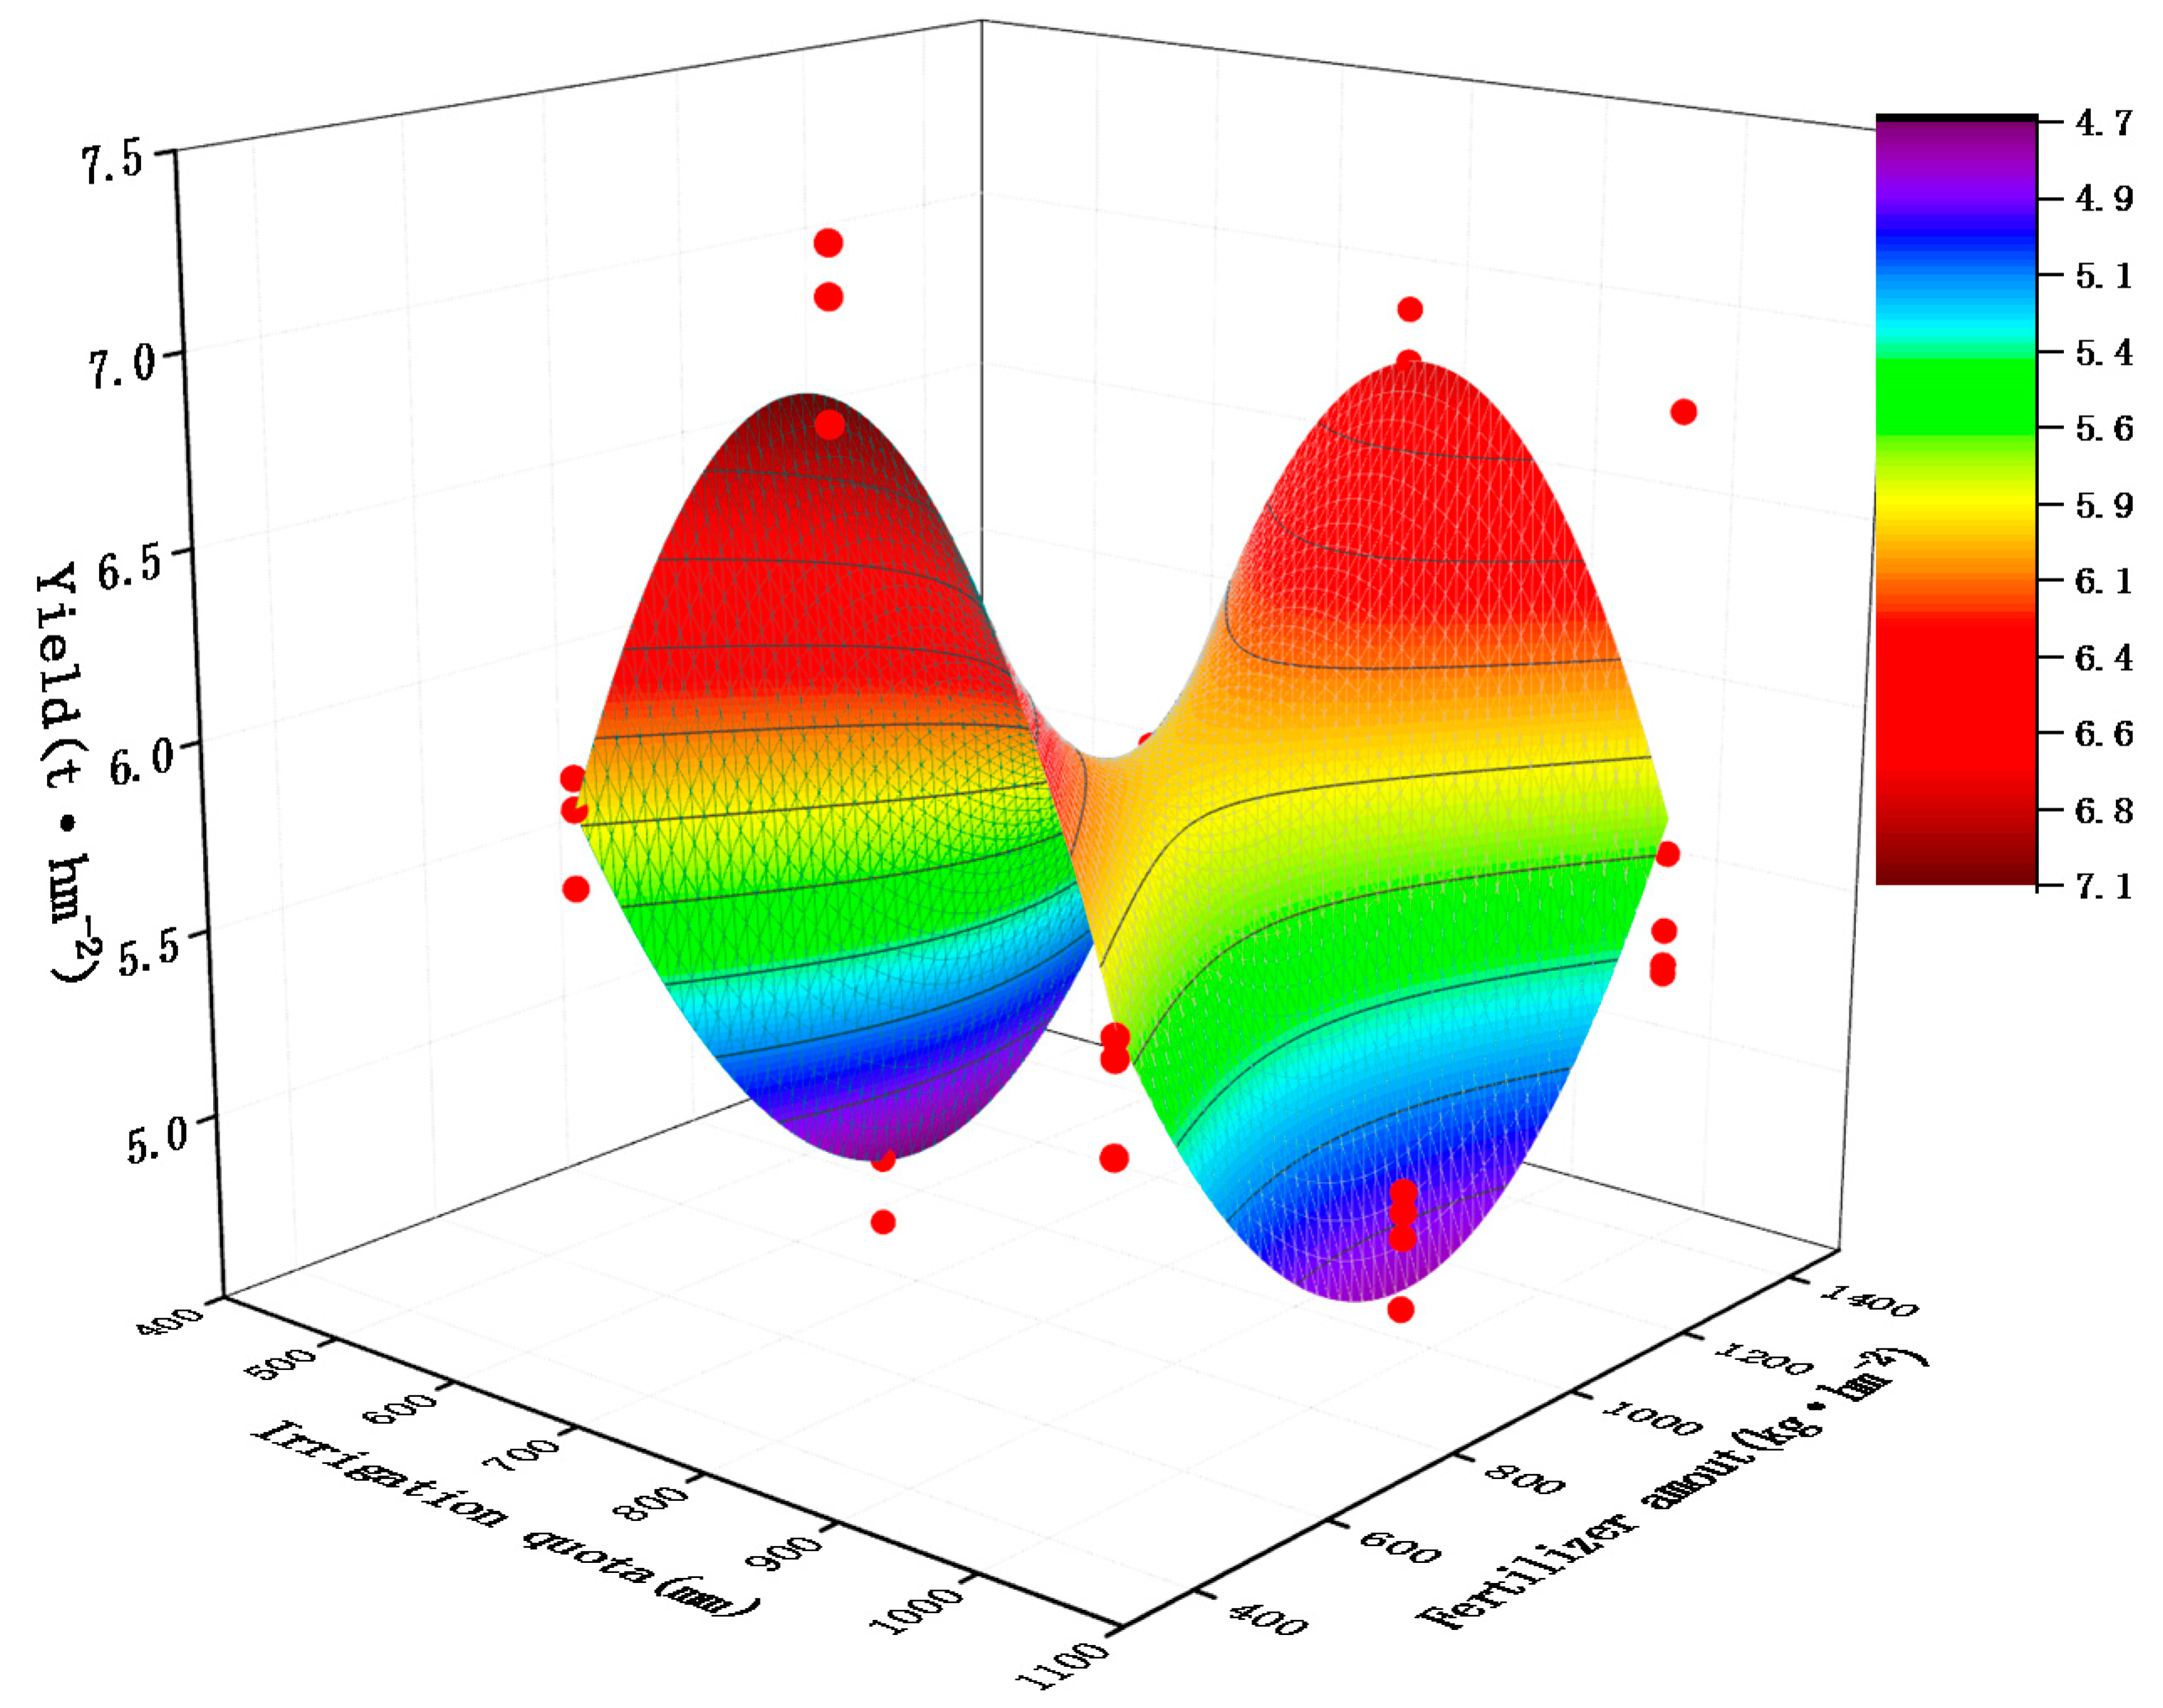
Based on the results mentioned above, the impact of water and fertilizer managements on physiological indicators and growth indexes varied among different treatments. The corresponding yield effect model was obtained by regression in Equation (1), and the optimized results of the yield model were shown in Figure 5. According to Equation (1), the interaction coefficient of water and fertilizer was a positive value, which meant that the positive impacts were increasing. Seen from Figure 5, the effect of the water and fertilizer coupling model showed a bimodal surface; the relatively higher yield was acquired with either low fertilizer or high fertilizer amount when irrigated with a moderate quota. Low fertilizer and moderate irrigation would be a better choice, as the maximum yield was acquired as 6.87 Mg ha−1, and the optimized irrigation quota should be 815 mm while applying fertilizer with the amount of 400 kg ha−1.
where Y represents the jujube yield (kg ha−1); W is the irrigation quota (mm), and F is the fertilizer amount (kg ha−1).
4. Discussion
Water and fertilizer management is critical to crop production, especially for agriculture in arid areas [21]. When the coupling effects of water and fertilizer are optimized, the crop yield is significantly increased [20]. The key of water and fertilizer coupling is “using water to promote fertilizer [and] using fertilizer to adjust water”. In recent years, water–fertilizer management has become a hot research topic, especially when applying water-saving technology [22,23]. However, the related studying results related to jujube plantations are lacking.
In this paper, water and fertilizer interaction showed significant effects on jujube CC, NC, and PNUE, which indicated that fertilizer efficiency was promoted by the irrigation water, and in turn the amount of water that was needed was adjusted by the fertilizer applied, on the condition that neither water nor fertilizer showed significant impacts. We failed to find results on jujube CC, NC, and PNUE in the arid area, but the trend that we observed was consistent with the results of the wheat photosynthetic characteristics under water and fertilizer coupling conditions that were reported by Wang et al. [24]. After applying the drip irrigation technology in 2016, the maximum CC, NC, and PUNE values increased on average by 6.00%, 9.49%, and 11.39%, respectively, upon comparing those using flood irrigation in 2015, which indicated the great improvement due to changing the irrigation method. Although these contents continued to increase after application in the second year of 2017, the increasing rates decreased to 1.47%, 3.37%, and 6.83%, respectively, as they were compared with those using drip irrigation. Meanwhile, neither excessive irrigation nor deficit irrigation was beneficial for photosynthetic characteristics, and the best effects occurred at the low fertilization level, which was similar to the results of Li et al. [25] and Zhou et al. [26]. Compared with flood irrigation, fertigation with drip irrigation could not only promote the nutrient absorption of crops, it could also improve the utilization rate of water fertilizer [21,27]. The results in this paper also showed that the highest yield was obtained with moderate irrigation and low fertigation treatment (W2F1) using drip irrigation, when the iWUE and PFP reached higher levels.
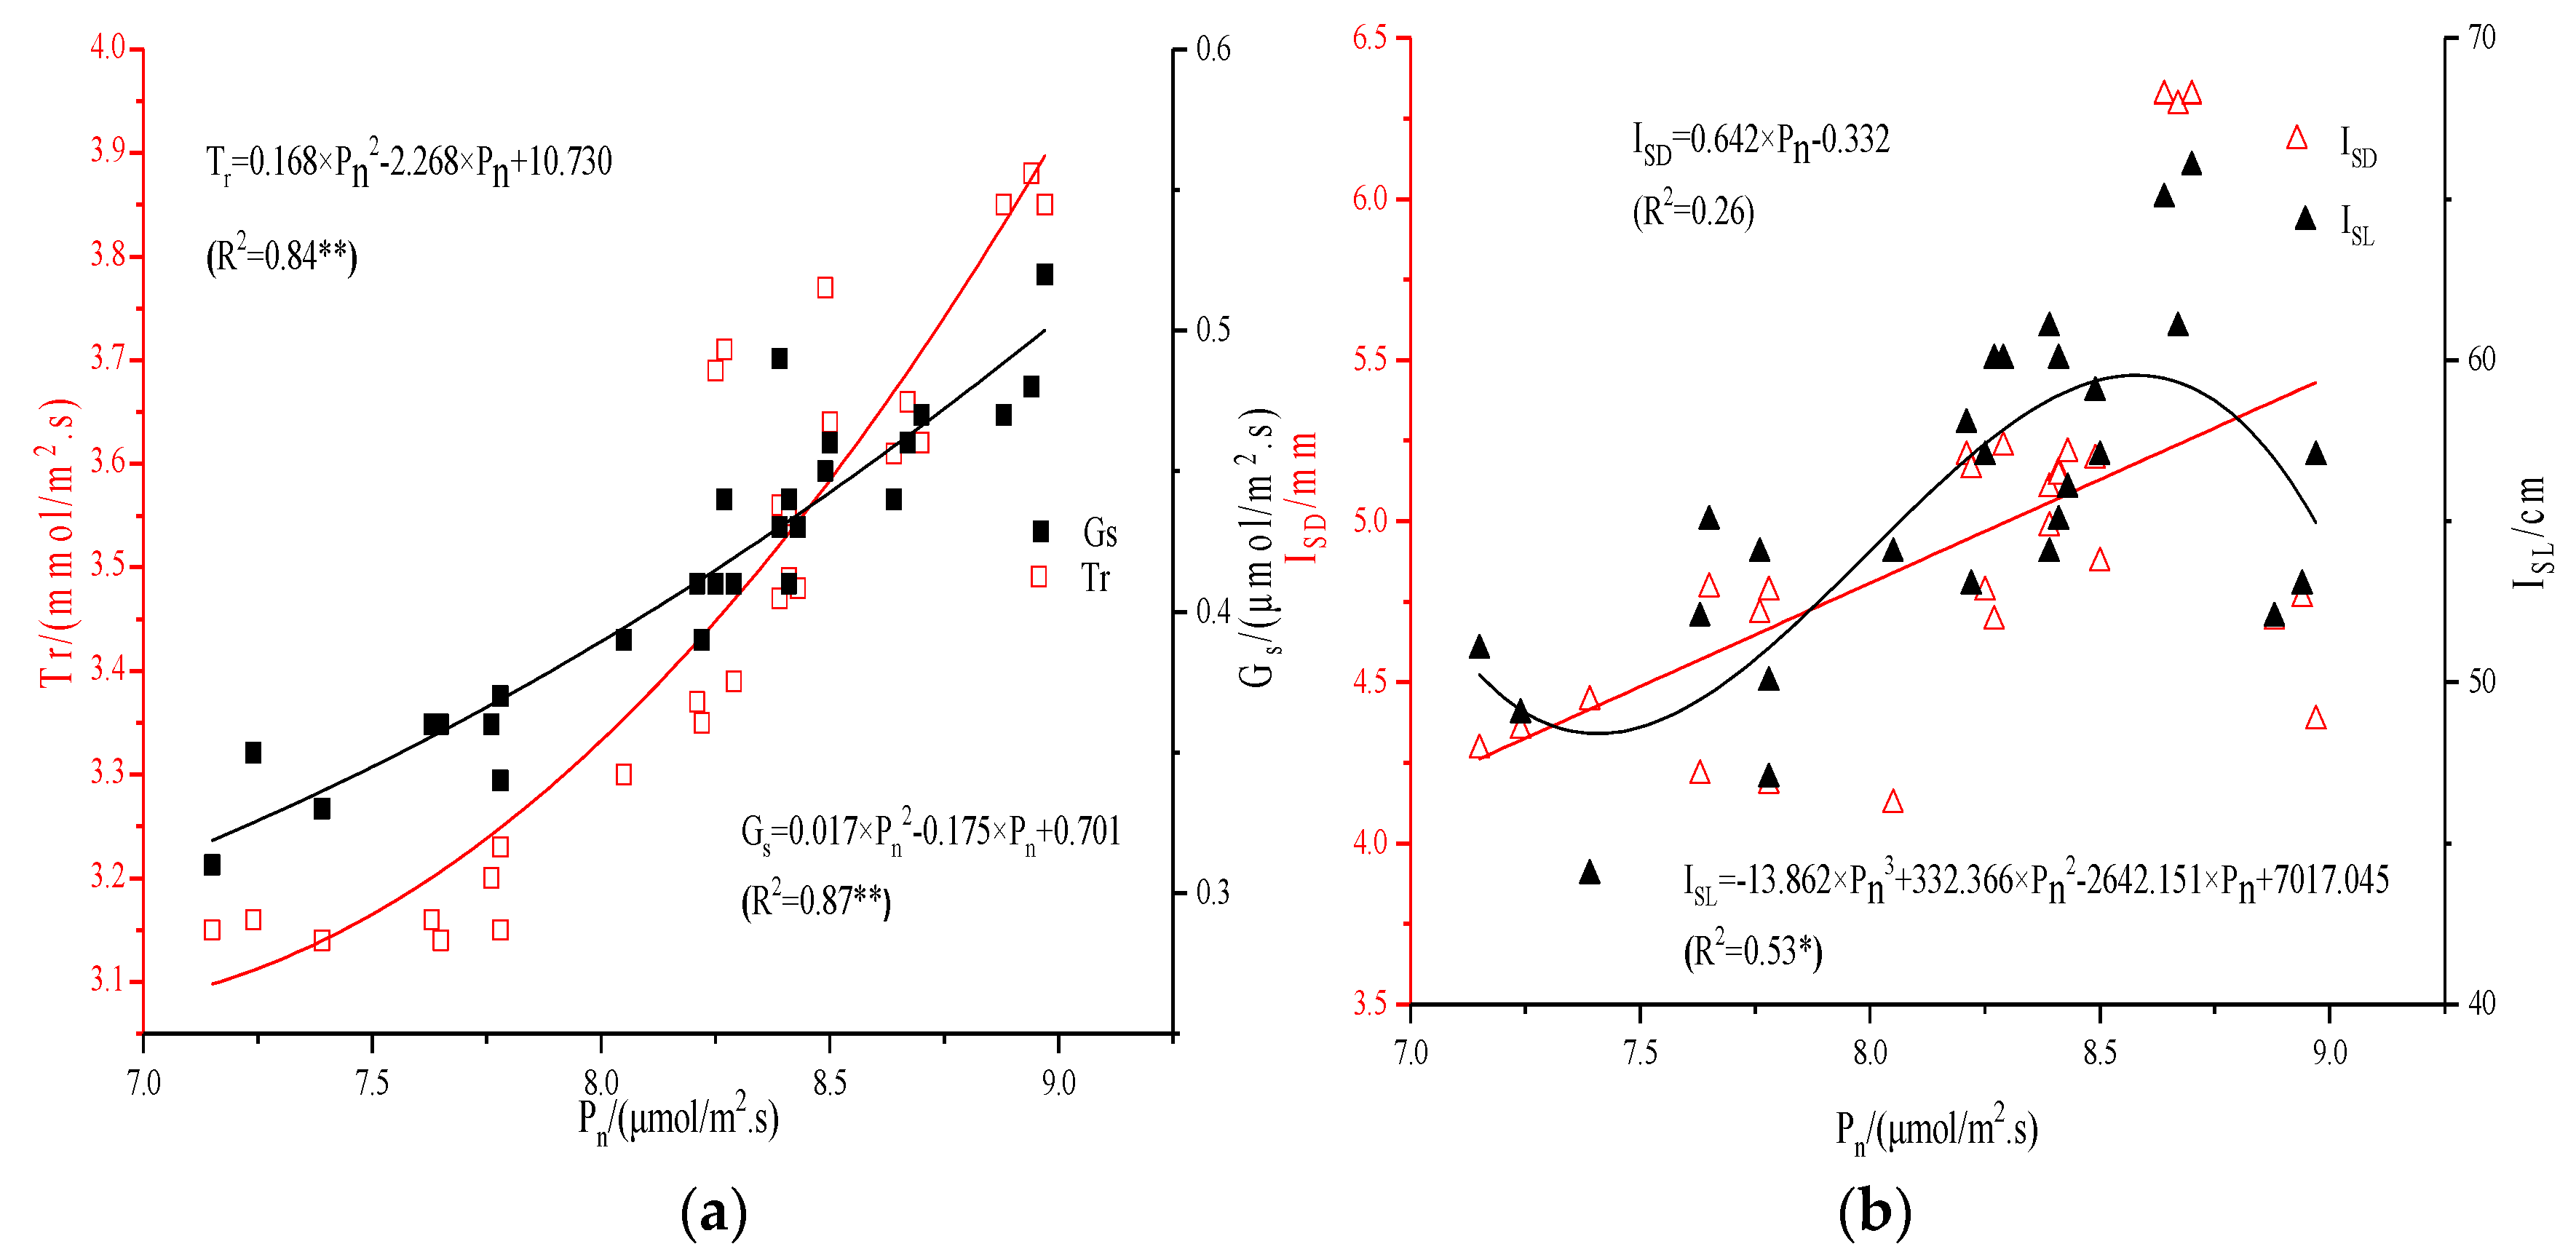
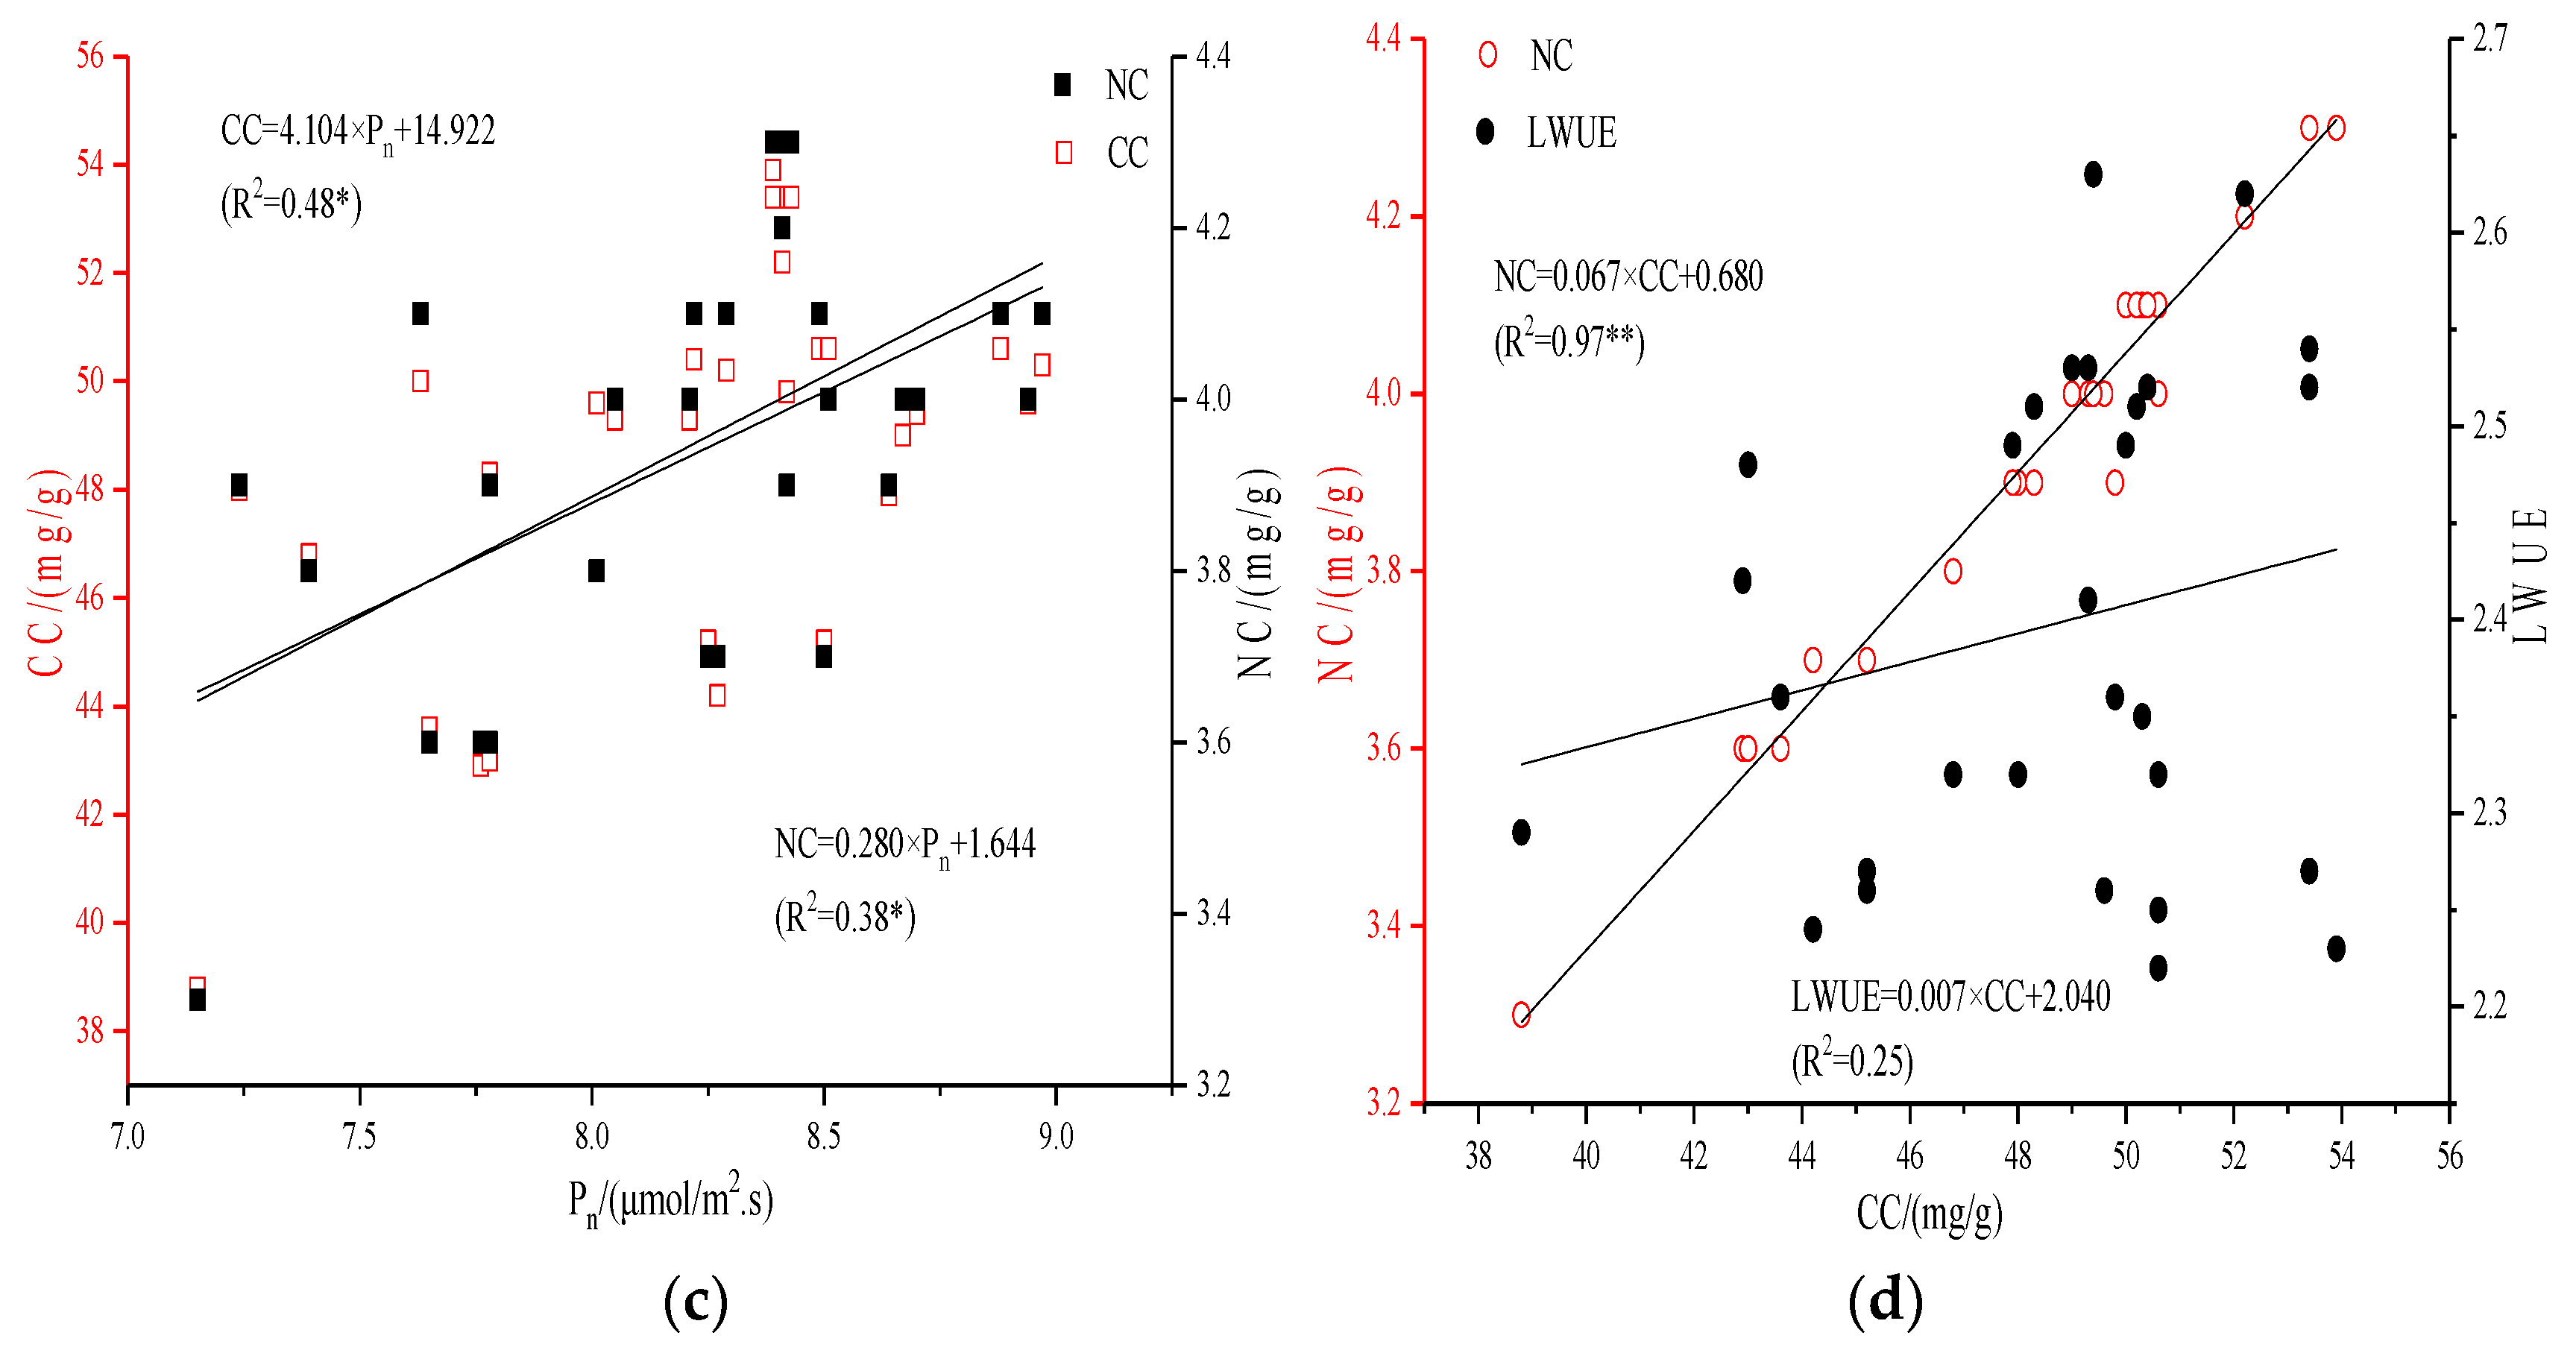
On the other hand, some scholars argued whether the net photosynthetic rate could increase crop yield significantly, especially under water stress conditions [28]. Actually, photosynthesis and the transpiration of jujube were directly affected by stomatal conductance, as leaves could control the jujube net photosynthetic rate and transpiration rate through the opening size of stomatal conductance. Therefore, it is important to study the relations between Pn and other indicators. In this paper, we studied the quantitative relations between physiological indicators and growth indexes (Figure 6). The results showed that Pn, Tr, and Gs were closely related (R2 > 0.84 **, p < 0.01). Meanwhile, a significant linear relation was found between Pn and ISL (R2 = 0.52*, p < 0.05), while those of Pn and ISL failed (R2 = 0.26, p < 0.05). On the other hand, the realization of photosynthesis depends on the absorption of light energy obtained by chlorophyll. Seen from Figure 6, Pn had linear relations with CC and NC (R2 > 0.39 *, p < 0.05). Among them, CC was not only the most important pigment for the photosynthesis of crops, it was also the basic substance of the photosynthesis of plants [29]. We also found linear relations between leaf CC and NC (R2 = 0.97 **, p < 0.01).
Through the experiment, we acquired some meaningful results on how water–fertilizer management would affect jujube growth and yield. However, there were still some issues to study in the future: (1) the experiment was conducted with three irrigation quotas and three fertilizer amounts according to the local planting mode. More water and fertilizer gradients are needed, especially with higher irrigation and fertilization levels, in order to identify the most appropriate water–fertilizer management; (2) long-term experiment verifications are needed to find out the water–fertilizer coupling treatments after we turned flood irrigation to drip irrigation in the Xinjiang area. Besides, their effects on a healthy soil and microorganism community are also unknown.
5. Conclusions
When planting jujube in the Xinjiang area using drip irrigation and integrating fertilization, most of the physiological indicators and growth indexes were not significantly affected merely by the irrigation quota nor the fertilizer amounts; only the water–fertilizer interaction showed significant effects. The physiological indicators and growth indexes were increased when transferring flood irrigation to drip irrigation. After applying drip irrigation technology, fertilizer efficiency was promoted with the irrigation water input, and in turn, the water requirements were adjusted by the fertilizer applied. However, inappropriate water and fertilizer management would show negative impacts on jujube growth and yield. Among the treatments in this paper, low fertilizer and moderate irrigation would be the best choice. Therefore, the optimized irrigation and fertilizer amounts of jujube in northern Xinjiang area should be 815 mm and 400 kg ha−1, on the basis of a comprehensive consideration of physiological indicators and growth indexes.
Author Contributions
Z.W. and B.Z. provided the idea of the study and writing of the manuscript, Q.B. conducted the data analysis, and J.Z. provided important advice on the concept of the methodology.
Acknowledgments
We are grateful for the financial support from the National Key Technology Support Program (2014BAC14B01) and the National Natural Science Fund of China (51669032).
Conflicts of Interest
The authors declare that there is no conflict of interest.
Abbreviations
Pn, net photosynthetic rate; Gs, stomatal conductance; Ci, intercellular CO2 concentration; Tr, transpiration rate; ISL, length increment; PFP, partial fertilizer productivity; PNUE, photosynthetic nitrogen use efficiency; iWUE, irrigation water use efficiency; NC, nitrogen content; CC, chlorophyll content; EI, improving effect.
References
- Sun, S.M.; Yang, P.L.; An, Q.X.; Xu, R.; Yao, B.L.; Li, F.Y.; Zhang, X.X. Investigation into surface and subsurface drip irrigation for jujube trees grown in saline soil under extremely arid climate. Eur. J. Hortic. Sci. 2016, 81, 165–174. [Google Scholar] [CrossRef]
- Liu, G.H.; Wei, Y.Q.; Wang, Z.Y.; Xie, X.W. Water and fertilizer management of jujube in arid area of Xinjiang province using microirrigation system. Bull. Agric. Sci. Technol. 2015, 5, 307–309. [Google Scholar]
- Nelson, S.D.; Young, M.; Enciso, J.M.; Klose, S.L.; Sétamou, M. Impact of irrigation method on water savings and ‘rio red’ grapefruit pack-out in south texas. Subtropical Plant Sci. 2011, 63, 14–22. [Google Scholar]
- Wang, F.X.; Kang, Y.; Liu, S.P. Effects of drip irrigation frequency on soil wetting pattern and potato growth in north china plain. Agric. Water Manag. 2006, 79, 248–264. [Google Scholar] [CrossRef]
- Lafarge, T.A.; Hammer, G.L. Predicting plant leaf area production: Shoot assimilate accumulation and partitioning, and leaf area ratio, are stable for a wide range of sorghum population densities. Field Crop Res. 2002, 77, 137–151. [Google Scholar] [CrossRef]
- Hammad, H.M.; Ahmad, A.; Abbas, F.; Farhad, W.; Cordoba, B.C.; Hoogenboom, G. Water and nitrogen productivity of maize under semiarid environments. Crop Sci. 2015, 55, 877–888. [Google Scholar] [CrossRef]
- Man, J.; Yu, Z.; Zhang, Y.; Shi, Y.; Wang, L. Water and nitrogen use of winter wheat under different supplemental irrigation regimes. Crop Sci. 2016, 56, 3237–3249. [Google Scholar] [CrossRef]
- Ma, D.Y.; Zhang, J.; Hou, J.F.; Li, Y.G.; Huang, X.; Wang, C.Y.; Lu, H.F.; Zhu, Y.J.; Guo, T.C. Evaluation of yield, processing quality, and nutritional quality in different-colored wheat grains under nitrogen and phosphorus fertilizer application. Crop Sci. 2017, 58, 402–415. [Google Scholar] [CrossRef]
- Albrizio, R.; Todorovic, M.; Matic, T.; Stellacci, A.M. Comparing the interactive effects of water and nitrogen on durum wheat and barley grown in a mediterranean environment. Field Crop Res. 2010, 115, 179–190. [Google Scholar] [CrossRef]
- Yang, R.; Su, Y.Z. Responses of net photosynthetic rate in flowering and boll-forming stages, and cotton yield to irrigation and nitrogen fertilizer application. Plant Nutr. Fert. Sci. 2011, 17, 404–410, (In Chinese with English abstract). [Google Scholar]
- Wang, J.X.; Zhang, X.P.; Gao, B.S. Accelerating function of fertilizer and irrigation on shoot growth and flowering of young dwarfing apple tree. Agric. Res. Arid Areas 2004, 22, 47–50, (In Chinese with English abstract). [Google Scholar]
- Wang, Z.H.; Quan, L.S.; He, J.B. Effect of water and fertilizer coupling on water consumption and yield of drip irrigation grape in extreme arid region. Water Saving Irrig. 2014, 6, 634–637, (In Chinese with English abstract). [Google Scholar]
- Feng, Y.; Cui, N.B.; Du, T.S.; Gong, D.Z.; Hu, X.T.; Zhao, L. Response of sap flux and evapotranspiration to deficit irrigation of greenhouse pear-jujube trees in semi-arid northwest china. Agric. Water Manag. 2017, 194, 1–12. [Google Scholar] [CrossRef]
- Cui, N.B.; Du, T.S.; Li, F.S.; Tong, L.; Kang, S.Z.; Wang, M.X.; Liu, X.Z.; Li, Z.J. Response of vegetative growth and fruit development to regulated deficit irrigation at different growth stages of pear-jujube tree. Agric. Water Manag. 2009, 96, 1237–1246. [Google Scholar] [CrossRef]
- Ma, L.H.; Liu, X.L.; Wang, Y.K.; Wu, P.T. Effects of drip irrigation on deep root distribution, rooting depth, and soil water profile of jujube in a semiarid region. Plant Soil 2013, 373, 995–1006. [Google Scholar] [CrossRef]
- Qin, S.H.; Zhang, J.L.; Dai, H.L.; Wang, D.; Li, D.M. Effect of ridge–furrow and plastic-mulching planting patterns on yield formation and water movement of potato in a semi-arid area. Agric. Water Manag. 2014, 131, 87–94. [Google Scholar] [CrossRef]
- Guan, L.L.; Wen, D.Z. More nitrogen partition in structural proteins and decreased photosynthetic nitrogen-use efficiency of pinus massoniana under in situ polluted stress. J. Plant Res. 2011, 124, 663–673. [Google Scholar] [CrossRef] [PubMed]
- Kuslu, Y.; Sahin, U.; Kiziloglu, F.M.; Memis, S. Fruit yield and quality, and irrigation water use efficiency of summer squash drip-irrigated with different irrigation quantities in a semi-arid agricultural area. J. Integr. Agric. 2014, 13, 2518–2526. [Google Scholar] [CrossRef]
- Ierna, A.; Pandino, G.; Lombardo, S.; Mauromicale, G. Tuber yield, water and fertilizer productivity in early potato as affected by a combination of irrigation and fertilization. Agric. Water Manag. 2011, 101, 35–41. [Google Scholar] [CrossRef]
- Badr, M.A.; El-Tohamy, W.A.; Zaghloul, A.M. Yield and water use efficiency of potato grown under different irrigation and nitrogen levels in an arid region. Agric. Water Manag. 2012, 110, 9–15. [Google Scholar] [CrossRef]
- Zotarelli, L.; Dukes, M.D.; Scholberg, J.M.S.; Muñoz-Carpena, R.; Icerman, J. Tomato nitrogen accumulation and fertilizer use efficiency on a sandy soil, as affected by nitrogen rate and irrigation scheduling. Agric. Water Manag. 2009, 96, 1247–1258. [Google Scholar] [CrossRef]
- Brück, H.; Payne, W.A.; Sattelmacher, B. Effects of phosphorus and water supply on yield, transpirational water-use efficiency, and carbon isotope discrimination of pearl millet. Crop Sci. 2000, 40, 120–125. [Google Scholar] [CrossRef]
- Cechin, I.; Fumis, T.D.F. Effect of nitrogen supply on growth and photosynthesis of sunflower plants grown in the greenhouse. Plant Sci. 2004, 166, 1379–1385. [Google Scholar] [CrossRef] [Green Version]
- Wang, D.Q.; Ma, Z.M.; Yang, R.J.; Sun, J.L.; Wang, P.; Du, S.P. Response of intercropping wheat photosynthetic characteristics during the water and fertilizer coupling condition. Chin. Agric. Sci. Bull. 2009, 25, 215–218, (In Chinese with English abstract). [Google Scholar]
- Li, Y.K.; Wu, X.P.; Wu, H.J.; Wu, Q.F.; Zhang, Y.C.; Li, R.N.; Wang, L.Y. Effects of water and nitrogen conditions on the diurnal variation of photosynthesis and yield of cucumber in greenhouse. Trans. CSAE 2010, 26, 122–129, (In Chinese with English abstract). [Google Scholar]
- Zhou, H.M.; Zhang, F.C.; Roger, K.; Wu, L.F.; Gao, M.X.; Li, Z.J. Response of physiological properties and crop water productivity of young apple tree to water and fertilizer. Trans. CSAM 2015, 46, 77–87. [Google Scholar]
- Hebbar, S.S.; Ramachandrappa, B.K.; Nanjappa, H.V.; Prabhakar, M.J.E.J.O.A. Studies on npk drip fertigation in field grown tomato (lycopersicon esculentum mill.). Eur. J. Agron. 2004, 21, 117–127, (In Chinese with English abstract). [Google Scholar] [CrossRef]
- Ainsworth, E.A.; Long, S.P. What have we learned from 15 years of free-air CO2 enrichment (face)? A meta-analytic review of the responses of photosynthesis, canopy properties and plant production to rising CO2. New Phytol. 2010, 165, 351–372. [Google Scholar] [CrossRef] [PubMed]
- Flexas, J.; Carriquí, M.; Coopman, R.E.; Gago, J.; Galmés, J.; Martorell, S.; Morales, F.; Diaz-Espejo, A. Stomatal and mesophyll conductances to CO2 in different plant groups: Underrated factors for predicting leaf photosynthesis responses to climate change? Plant Sci. 2014, 226, 41–48. [Google Scholar] [CrossRef] [PubMed]
Figure 1.
The location of the experimental site.
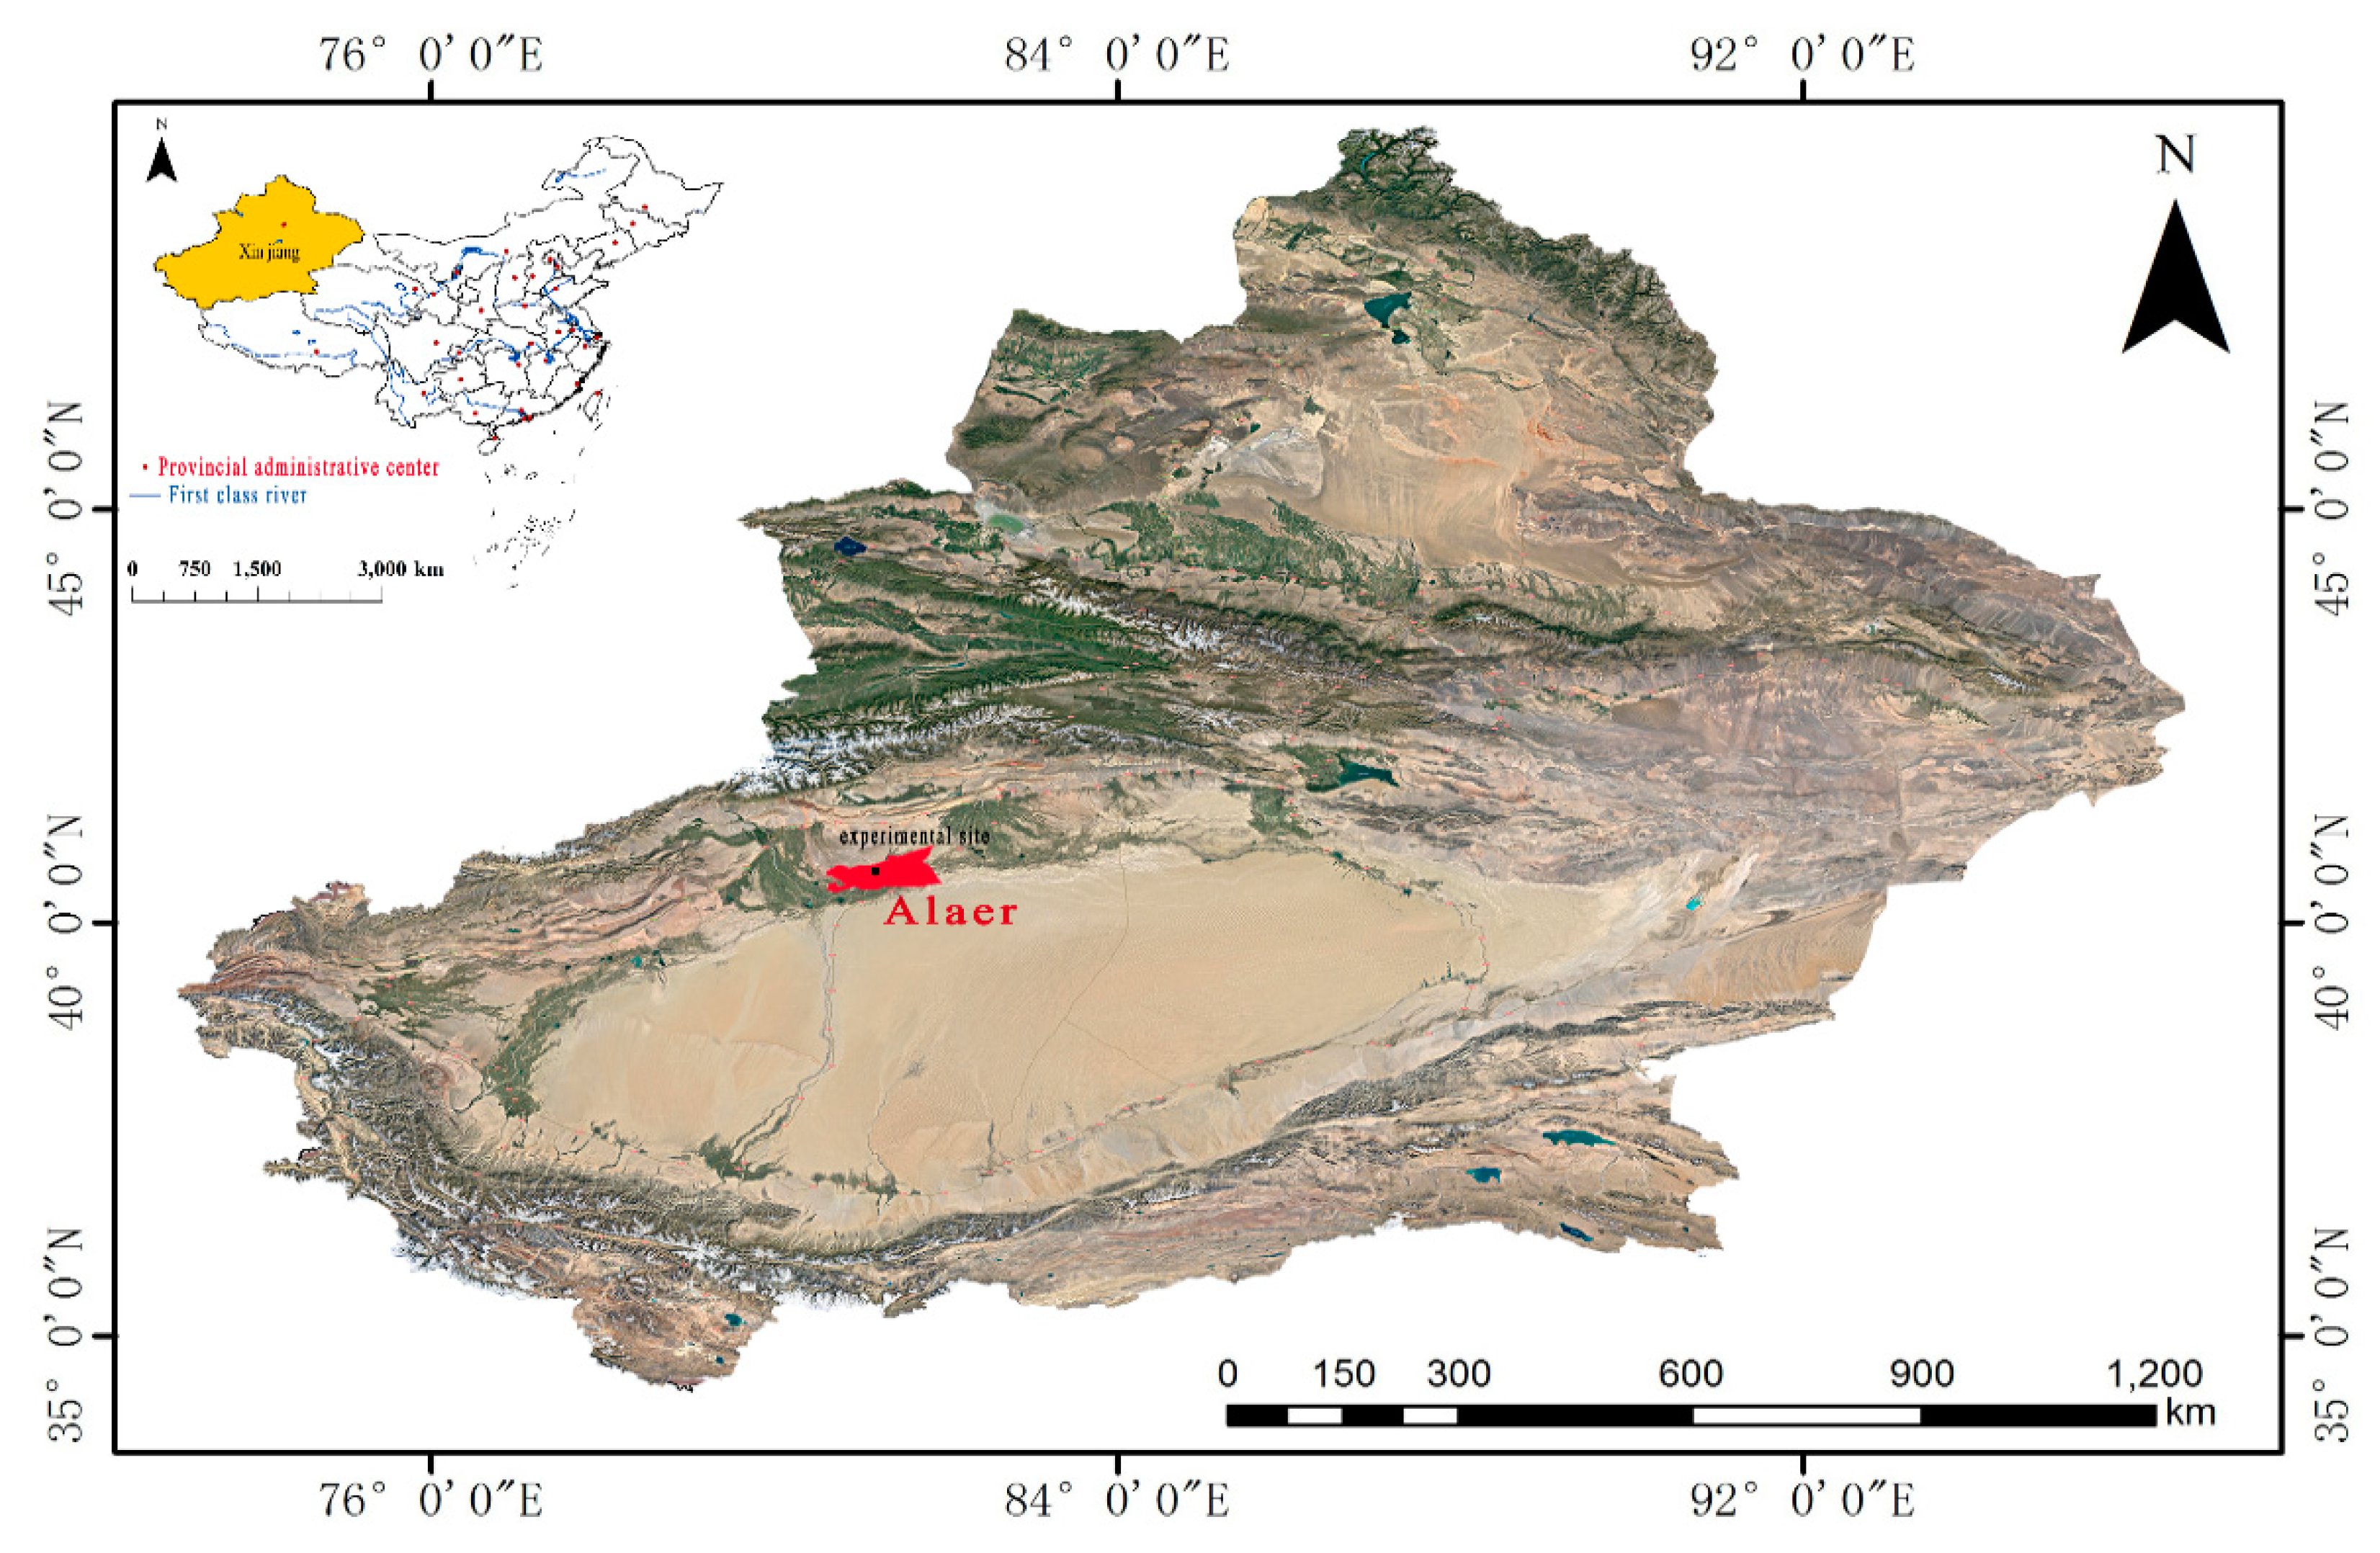
Figure 2.
Reference evapotranspiration and rainfall during the experiment.

Figure 3.
Different irrigation methods of jujube.

Figure 4.
Planting patterns of jujube.

Figure 5.
Water–fertilizer optimization based on maximum jujube yield.

Figure 6.
Quantitative relations between physiological indicators and growth indexes. (a) The relationship between Pn and Tr, Gs; (b) The relationship between Pn and ISD, ISL; (c) The relationship between Pn and CC, NC; (d) The relationship between CC and NC, LWUE.
Figure 6.
Quantitative relations between physiological indicators and growth indexes. (a) The relationship between Pn and Tr, Gs; (b) The relationship between Pn and ISD, ISL; (c) The relationship between Pn and CC, NC; (d) The relationship between CC and NC, LWUE.


Table 1.
Soil properties used in the experiment.
| Soil Layer/cm | Soil Type | Field Moisture Capacity/(g·g−1) | Soil Bulk Density/(g·cm−3) | Soil Density/(g·cm−3) | Soil Total Porosity/% | Capillary Porosity/% |
|---|---|---|---|---|---|---|
| 0–20 | loamy sand soil | 0.19 | 1.51 ± 0.03 | 2.05 ± 0.08 | 47.6 ± 1.35 | 45.28 ± 0.78 |
| 20–40 | sand soil | 0.20 | 1.57 ± 0.03 | 1.89 ± 0.05 | 42.11 ± 1.45 | 40.12 ± 0.98 |
| 40–60 | loamy sand soil | 0.19 | 1.53 ± 0.04 | 1.43 ± 0.06 | 43.27 ± 0.42 | 41.02 ± 0.87 |
| 60–80 | sand soil | 0.20 | 1.58 ± 0.07 | 2.09 ± 0.05 | 41.74 ± 1.05 | 39.24 ± 0.66 |
Table 2.
Irrigation and fertilizer managements in jujube.
| Year | Growth Stage | Period | Irrigation Treatment/mm | Fertilization Treatment/kg ha−1 | Flood Irrigation | Irrigation Times | Fertilization Times | |||||
|---|---|---|---|---|---|---|---|---|---|---|---|---|
| W1 | W2 | W3 | F1 | F2 | F3 | W | F | |||||
| 2016 | Budding and shooting | 04/30–06/20 | 70 | 110 | 150 | 90 | 180 | 270 | 150 | 270 | 1 | 1 |
| Flowering | 06/21–07/20 | 160 | 200 | 240 | 120 | 240 | 360 | 240 | 360 | 2 | 2 | |
| Fruiting | 07/21–08/17 | 160 | 200 | 240 | 120 | 240 | 360 | 240 | 360 | 2 | 2 | |
| White maturity | 08/18–09/18 | 160 | 200 | 240 | 120 | 240 | 360 | 240 | 360 | 2 | 2 | |
| Fully maturity | 09/19–10/30 | 70 | 110 | 150 | — | — | — | 150 | — | 1 | 0 | |
| 2017 | Budding and shooting | 05/05–06/15 | 60 | 100 | 140 | 80 | 170 | 260 | 140 | 260 | 1 | 1 |
| Flowering | 06/16–07/15 | 150 | 190 | 230 | 110 | 230 | 350 | 230 | 350 | 2 | 2 | |
| Fruiting | 07/16–08/06 | 150 | 190 | 230 | 110 | 230 | 350 | 230 | 350 | 2 | 2 | |
| White maturity | 08/07–09/16 | 150 | 190 | 230 | 110 | 230 | 350 | 230 | 350 | 2 | 2 | |
| Fully maturity | 09/17–11/05 | 60 | 100 | 140 | — | — | — | 140 | — | 1 | 0 | |
Table 3.
Effects of water–fertilizer treatments on photosynthetic characteristics.
| Years | Treatments | Pn/μmol·m−2·s−1 | Tr/mmol·m−2·s−1 | Gs/μmol·m−2·s−1 | Ci/μmol·m−2·s−1 | CC/mg·g−1 | PNUE/μmol·CO2·g−1 Ns−1 |
|---|---|---|---|---|---|---|---|
| 2016 | W1F1 | 7.26 ± 0.07 f | 3.15 ± 0.06 b | 0.31 ± 0.01 c | 447.50 ± 2.78 f | 49.2 ± 0.85 b | 1.96 ± 0.16 c |
| W1F2 | 7.82 ± 0.12 e | 3.17 ± 0.02 b | 0.33 ± 0.02 c | 519.89 ± 3.38 e | 44.5 ± 1.25 c | 1.96 ± 0.08 c | |
| W1F3 | 7.73 ± 0.04 e | 3.19 ± 0.05 b | 0.35 ± 0.10 c | 365.07 ± 5.11 g | 43.2 ± 0.38 c | 2.15 ± 0.02 b | |
| W2F1 | 8.93 ± 0.03 a | 3.86 ± 0.01 a | 0.49 ± 0.02 a | 707.41 ± 4.48 a | 52.2 ± 0.51 ab | 2.20 ± 0.04 a | |
| W2F2 | 8.34 ± 0.08 cd | 3.68 ± 0.02 a | 0.47 ± 0.04 ab | 639.25 ± 3.45 b | 44.9 ± 0.58 c | 2.25 ± 0.04 a | |
| W2F3 | 8.43 ± 0.03 c | 3.76 ± 0.02 a | 0.45 ± 0.02 b | 710.42 ± 2.79 a | 52.6 ± 1.77 ab | 1.99 ± 0.07 c | |
| W3F1 | 8.24 ± 0.05 d | 3.27 ± 0.06 b | 0.35 ± 0.02 c | 631.01 ± 2.52 b | 51.9 ± 0.58 ab | 2.03 ± 0.02 c | |
| W3F2 | 8.67 ± 0.13 b | 3.40 ± 0.06 b | 0.36 ± 0.02 c | 592.06 ± 2.04 c | 43.8 ± 0.77 c | 2.19 ± 0.03 a | |
| W3F3 | 8.41 ± 0.09 cd | 3.28 ± 0.05 b | 0.44 ± 0.03 b | 536.53 ± 1.44 d | 53.0 ± 0.69 a | 1.97 ± 0.03 c | |
| CK | 7.93 ± 0.15 e | 3.29 ± 0.04 b | 0.45 ± 0.27 b | 639.26 ± 2.56 b | 50.0 ± 0.53 ab | 2.03 ± 0.06 b | |
| 2017 | W1F1 | 7.54 ± 0.05 c | 3.24 ± 0.05 bc | 0.36 ± 0.01 c | 568.48 ± 2.78 d | 44.2 ± 0.74 d | 1.96 ± 0.05 c |
| W1F2 | 7.78 ± 0.09 c | 3.28 ± 0.04 bc | 0.32 ± 0.02 c | 597.89 ± 4.31 c | 46.5 ± 1.17 c | 1.99 ± 0.07 c | |
| W1F3 | 8.05 ± 0.06 bc | 3.09 ± 0.03 c | 0.42 ± 0.10 bc | 604.19 ± 6.48 c | 46.9 ± 0.98 c | 2.06 ± 0.03 b | |
| W2F1 | 8.51 ± 0.04 a | 3.68 ± 0.06 a | 0.48 ± 0.02 a | 678.22 ± 4.48 a | 51.5 ± 0.74 a | 2.19 ± 0.05 a | |
| W2F2 | 8.49 ± 0.07 ab | 3.57 ± 0.07 b | 0.41 ± 0.04 ab | 659.69 ± 3.45 ab | 46.6 ± 0.78 c | 2.14 ± 0.03 ab | |
| W2F3 | 8.36 ± 0.06 cb | 3.49 ± 0.06 b | 0.45 ± 0.02 b | 654.42 ± 6.74 ab | 51.6 ± 1.47 ab | 1.90 ± 0.05 c | |
| W3F1 | 8.41 ± 0.08 b | 3.54 ± 0.06 b | 0.46 ± 0.02 ab | 648.27 ± 3.75 b | 50.9 ± 0.14 b | 2.11 ± 0.04 ab | |
| W3F2 | 8.39 ± 0.08 b | 3.48 ± 0.03 b | 0.45 ± 0.02 b | 652.34 ± 3.48 ab | 44.4 ± 0.87 cd | 2.12 ± 0.06 ab | |
| W3F3 | 8.35 ± 0.10 b | 3.39 ± 0.02 b | 0.44 ± 0.03 b | 649.26 ± 5.10 b | 51.8 ± 0.79 a | 2.06 ± 0.04 b | |
| CK | 8.21 ± 0.09 b | 3.45 ± 0.06 b | 0.45 ± 0.03 b | 635.19 ± 3.07 b | 51.1 ± 0.93 ab | 2.05 ± 0.05 b | |
| Significant Analysis | |||||||
| 2016 | W (irrigation) | 10.35 * | 63.20 ** | 13.90 ** | 13.43 ** | 1.93 | 0.79 |
| F (fertilization) | 0.39 | 0.10 | 0.15 | 0.17 | 0.20 | 0.12 | |
| W × F | 77.55 ** | 10.52 ** | 10.60 ** | 1251.19 * | 10.87 ** | 7.89 ** | |
| 2017 | W (irrigation) | 11.72 * | 54.69 ** | 25.49 ** | 19.48 ** | 0.86 | 0.99 |
| F (fertilization) | 0.45 | 0.69 | 0.75 | 0.48 | 0.22 | 0.24 | |
| W × F | 100.55 ** | 25.44 ** | 16.46 ** | 69.13 * | 14.59 ** | 10.01 ** | |
Note: The data in the Table 3 is mean value ± standard error, different letters indicate significant difference between treatments (p < 0.05). * and ** in the significance test represent reached significant values under p < 0.05 and p < 0.01, respectively.
Table 4.
Effects of water–fertilizer treatments on yield indexes.
| Cropping Year | Treatments | ISL/mm | Y/kg ha−1 | iWUE/kg·m−3 | PFP/kg·kg−1 | EI/% |
|---|---|---|---|---|---|---|
| 2016 | W1F1 | 48 ± 2.08 c | 5450 ± 104.58 d | 7.57 ± 0.15 b | 12.11 ± 0.54 b | — |
| W1F2 | 51 ± 2.08 bc | 4661 ± 85.58 e | 6.47 ± 0.12 c | 5.53 ± 0.25 d | −14.48 | |
| W1F3 | 53 ± 1.53 bc | 5879 ± 84.79 c | 8.17 ± 0.25 a | 4.75 ± 0.36 d | 7.87 | |
| W2F1 | 54 ± 2.08 b | 6956 ± 125.79 a | 7.87 ± 0.14 ab | 16.12 ± 0.58 a | 33.14 | |
| W2F2 | 58 ± 1.53 b | 6803 ± 84.89 b | 7.38 ± 0.19 b | 8.06 ± 0.44 c | 24.83 | |
| W2F3 | 56 ± 1.53 b | 5799 ± 55.65 c | 6.29 ± 0.16 c | 4.69 ± 0.35 d | 6.40 | |
| W3F1 | 57 ± 1.53 b | 5603 ± 89.81 cd | 5.19 ± 0.15 d | 12.45 ± 0.66 b | 2.81 | |
| W3F2 | 64 ± 1.00 a | 4894 ± 95.73 e | 4.53 ± 0.14 e | 5.81 ± 0.45 d | −10.20 | |
| W3F3 | 59 ± 1.53 ab | 5414 ± 105.23 d | 5.01 ± 0.21 d | 4.37 ± 0.22 d | −0.66 | |
| CK | 61 ± 1.46 ab | 6796 ± 89.78 b | 6.31 ± 0.12 c | 5.49 ± 0.12 d | 24.70 | |
| 2017 | W1F1 | 49 ± 1.52 c | 5651 ± 97.85 d | 13.89 ± 0.15 b | 13.78 ± 0.54 b | — |
| W1F2 | 51 ± 1.70 c | 5798 ± 106.46 e | 14.25 ± 0.12 c | 6.74 ± 0.25 d | 2.60 | |
| W1F3 | 50 ± 2.03 c | 6047 ± 88.69 c | 14.86 ± 0.25 a | 4.62 ± 0.36 d | 7.01 | |
| W2F1 | 55 ± 1.25 b | 7056 ± 111.45 a | 13.74 ± 0.14 ab | 17.20 ± 0.58 a | 24.86 | |
| W2F2 | 57 ± 1.26 b | 6803 ± 109.48 b | 13.25 ± 0.19 b | 7.91 ± 0.44 c | 20.38 | |
| W2F3 | 56 ± 1.73 b | 6716 ± 78.95 c | 13.07 ± 0.16 c | 5.12 ± 0.35 d | 18.84 | |
| W3F1 | 60 ± 1.26 a | 6841 ± 97.58 cd | 10.57 ± 0.15 d | 16.68 ± 0.66 b | 21.06 | |
| W3F2 | 62 ± 2.00 a | 5984 ± 108.44 e | 9.24 ± 0.14 e | 6.96 ± 0.45 d | 5.89 | |
| W3F3 | 58 ± 1.25 ab | 6144 ± 97.52 d | 9.50 ± 0.21 d | 4.69 ± 0.22 d | 8.72 | |
| CK | 61 ± 2.00 a | 6648 ± 91.42 b | 8.31 ± 0.12 c | 7.38 ± 0.12 d | 24.70 | |
| Significant Analysis | ||||||
| 2016 | W (irrigation) | 8.46 * | 4.71 | 11.32 ** | 0.20 | / |
| F (fertilization) | 0.70 | 0.41 | 0.17 | 29.01 ** | / | |
| W × F | 78.12 ** | 78.01 ** | 155.82 ** | 758.71 ** | / | |
| 2017 | W (irrigation) | 10.11 * | 1.59 | 9.48 * | 0.22 | / |
| F (fertilization) | 0.41 | 0.13 | 0.14 | 18.75 ** | / | |
| W × F | 56.89 ** | 98.46 * | 205.49 ** | 544.17 ** | / | |
Note: The data in the Table 4 is the mean value ± standard error; different letters indicate significant difference between treatments (p < 0.05). * and ** in the significance test represent reaching significant values under p < 0.05 and p < 0.01, respectively.
© 2018 by the authors. Licensee MDPI, Basel, Switzerland. This article is an open access article distributed under the terms and conditions of the Creative Commons Attribution (CC BY) license (http://creativecommons.org/licenses/by/4.0/).
Share and Cite
MDPI and ACS Style
Wang, Z.; Bian, Q.; Zhang, J.; Zhou, B. Optimized Water and Fertilizer Management of Mature Jujube in Xinjiang Arid Area Using Drip Irrigation. Water 2018, 10, 1467. https://doi.org/10.3390/w10101467
AMA Style
Wang Z, Bian Q, Zhang J, Zhou B. Optimized Water and Fertilizer Management of Mature Jujube in Xinjiang Arid Area Using Drip Irrigation. Water. 2018; 10(10):1467. https://doi.org/10.3390/w10101467
Chicago/Turabian StyleWang, Zhenhua, Qingyong Bian, Jinzhu Zhang, and Bo Zhou. 2018. "Optimized Water and Fertilizer Management of Mature Jujube in Xinjiang Arid Area Using Drip Irrigation" Water 10, no. 10: 1467. https://doi.org/10.3390/w10101467
Note that from the first issue of 2016, this journal uses article numbers instead of page numbers. See further details here.