The Construction and Comparison of Regional Drought Severity-Duration-Frequency Curves in Two Colombian River Basins—Study of the Sumapaz and Lebrija Basins

Abstract
1. Introduction
2. Materials and Methods
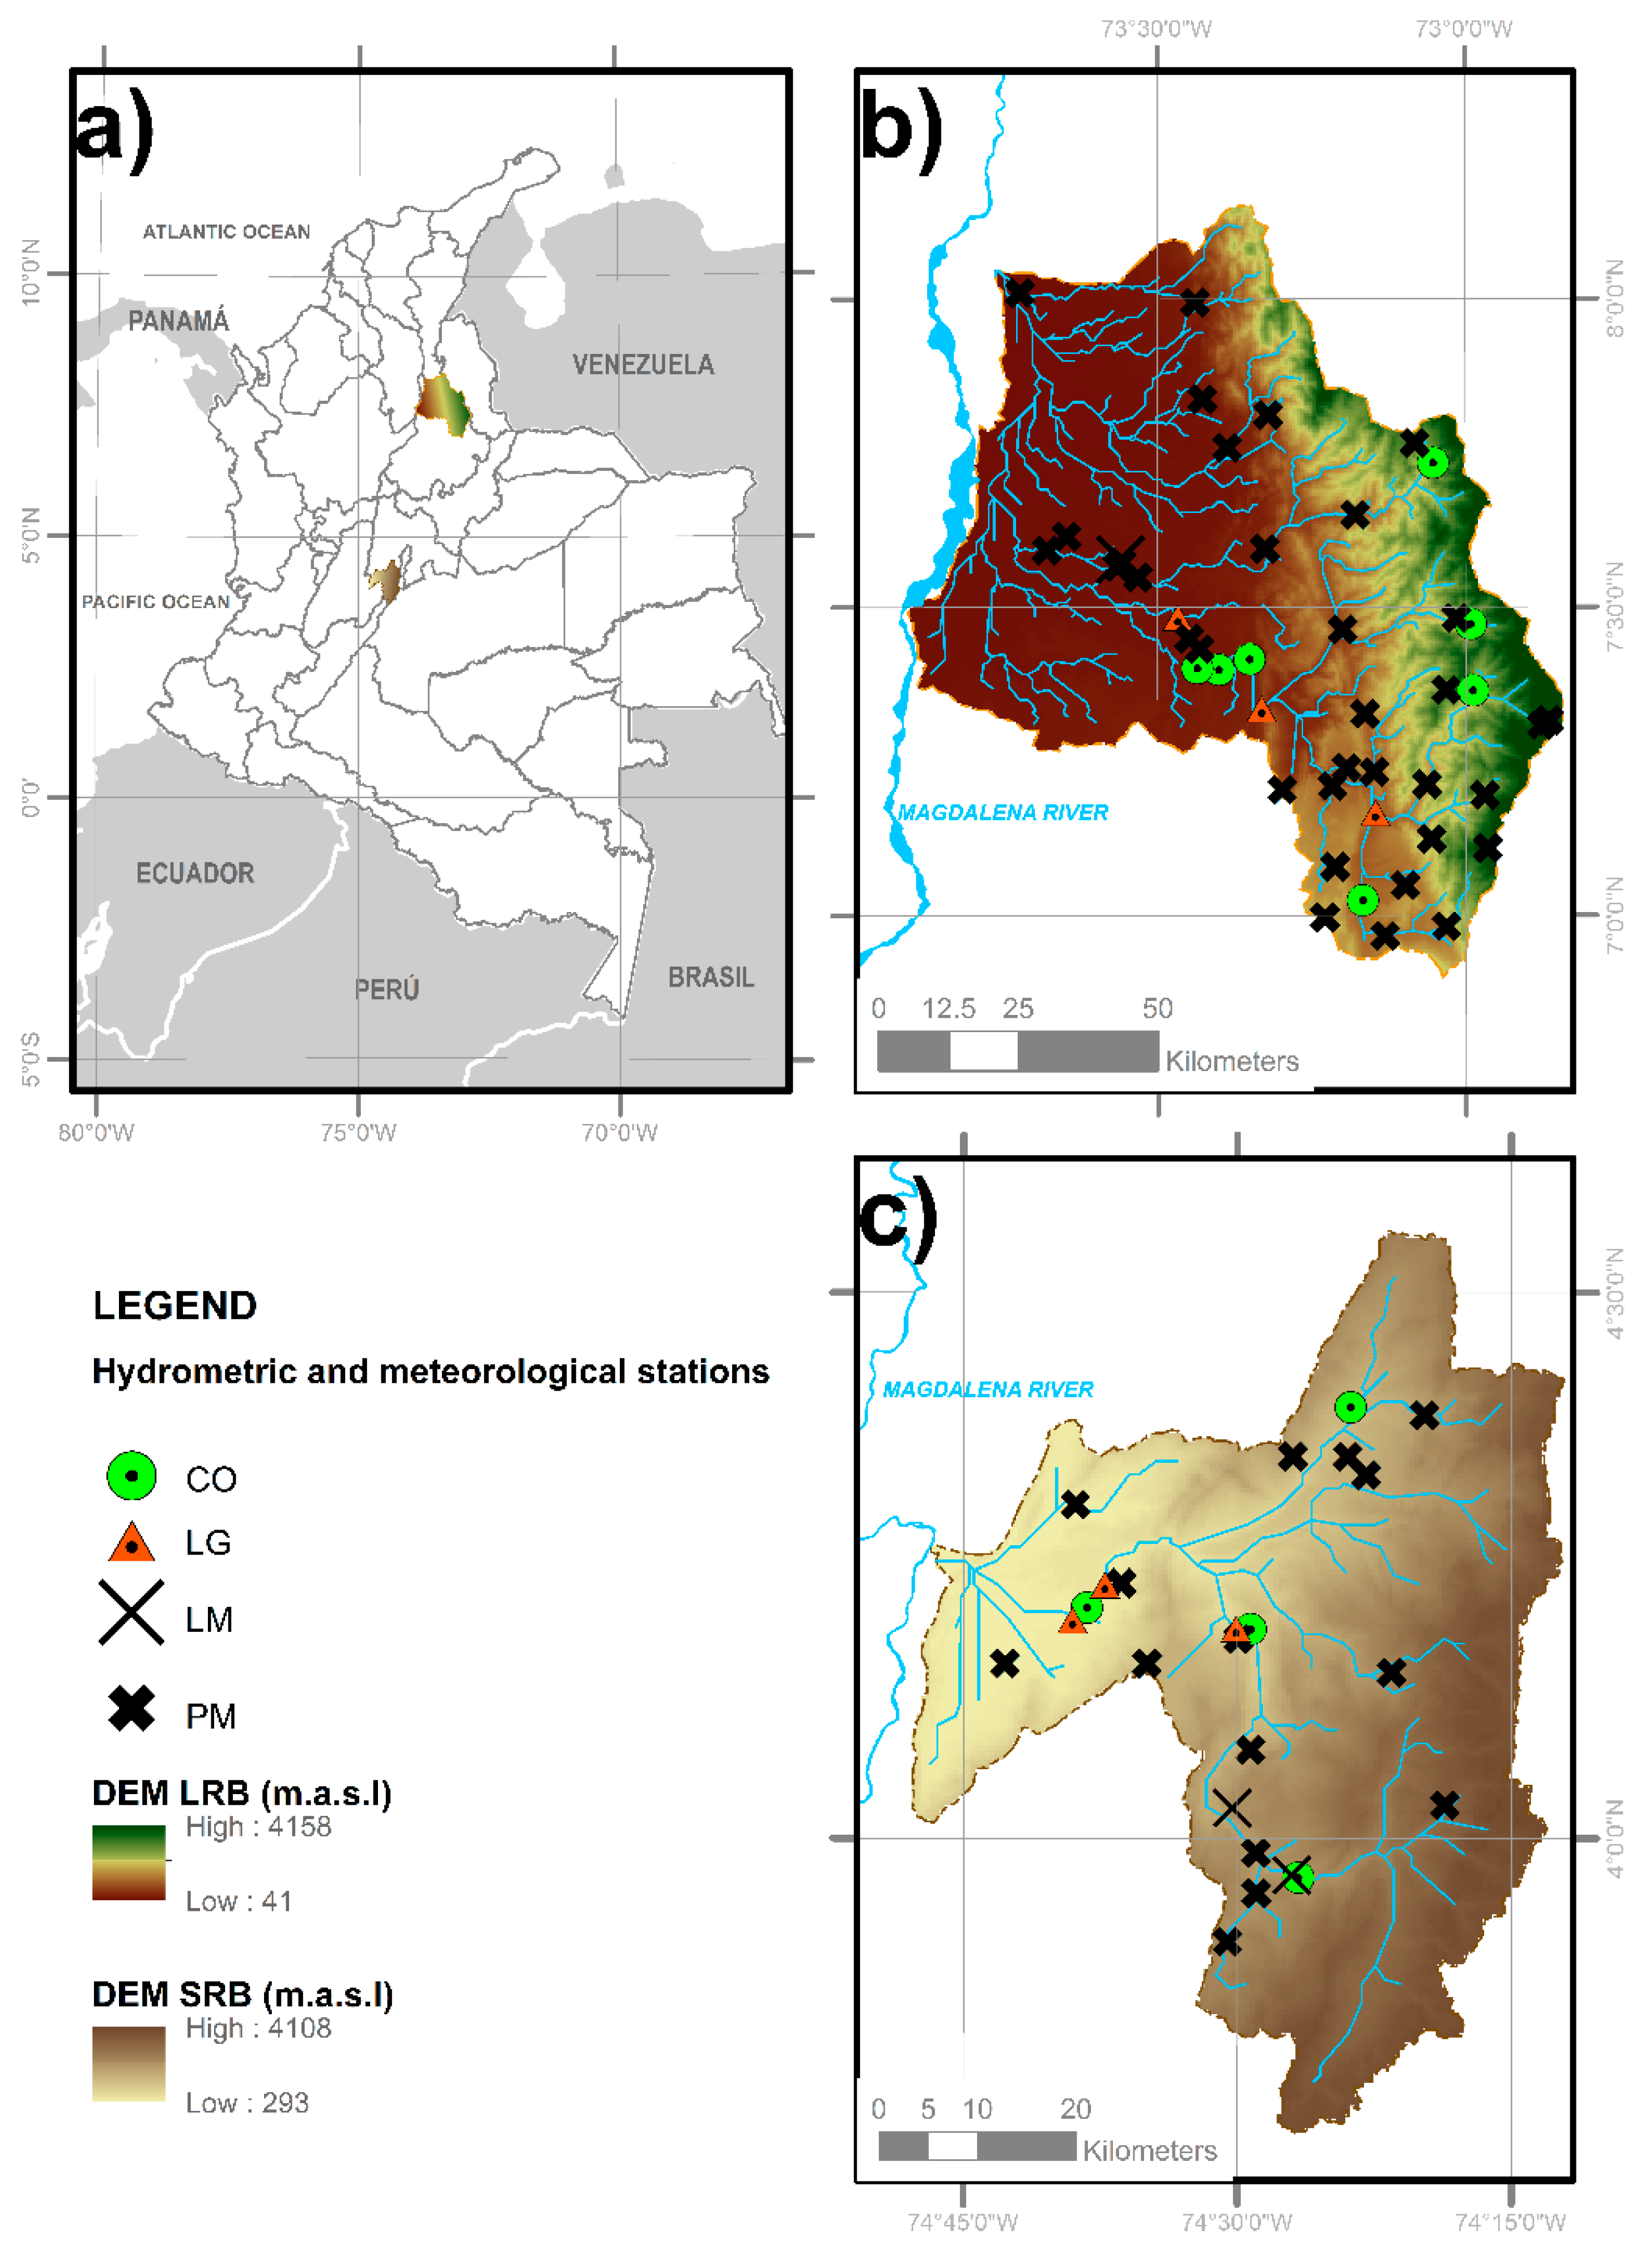
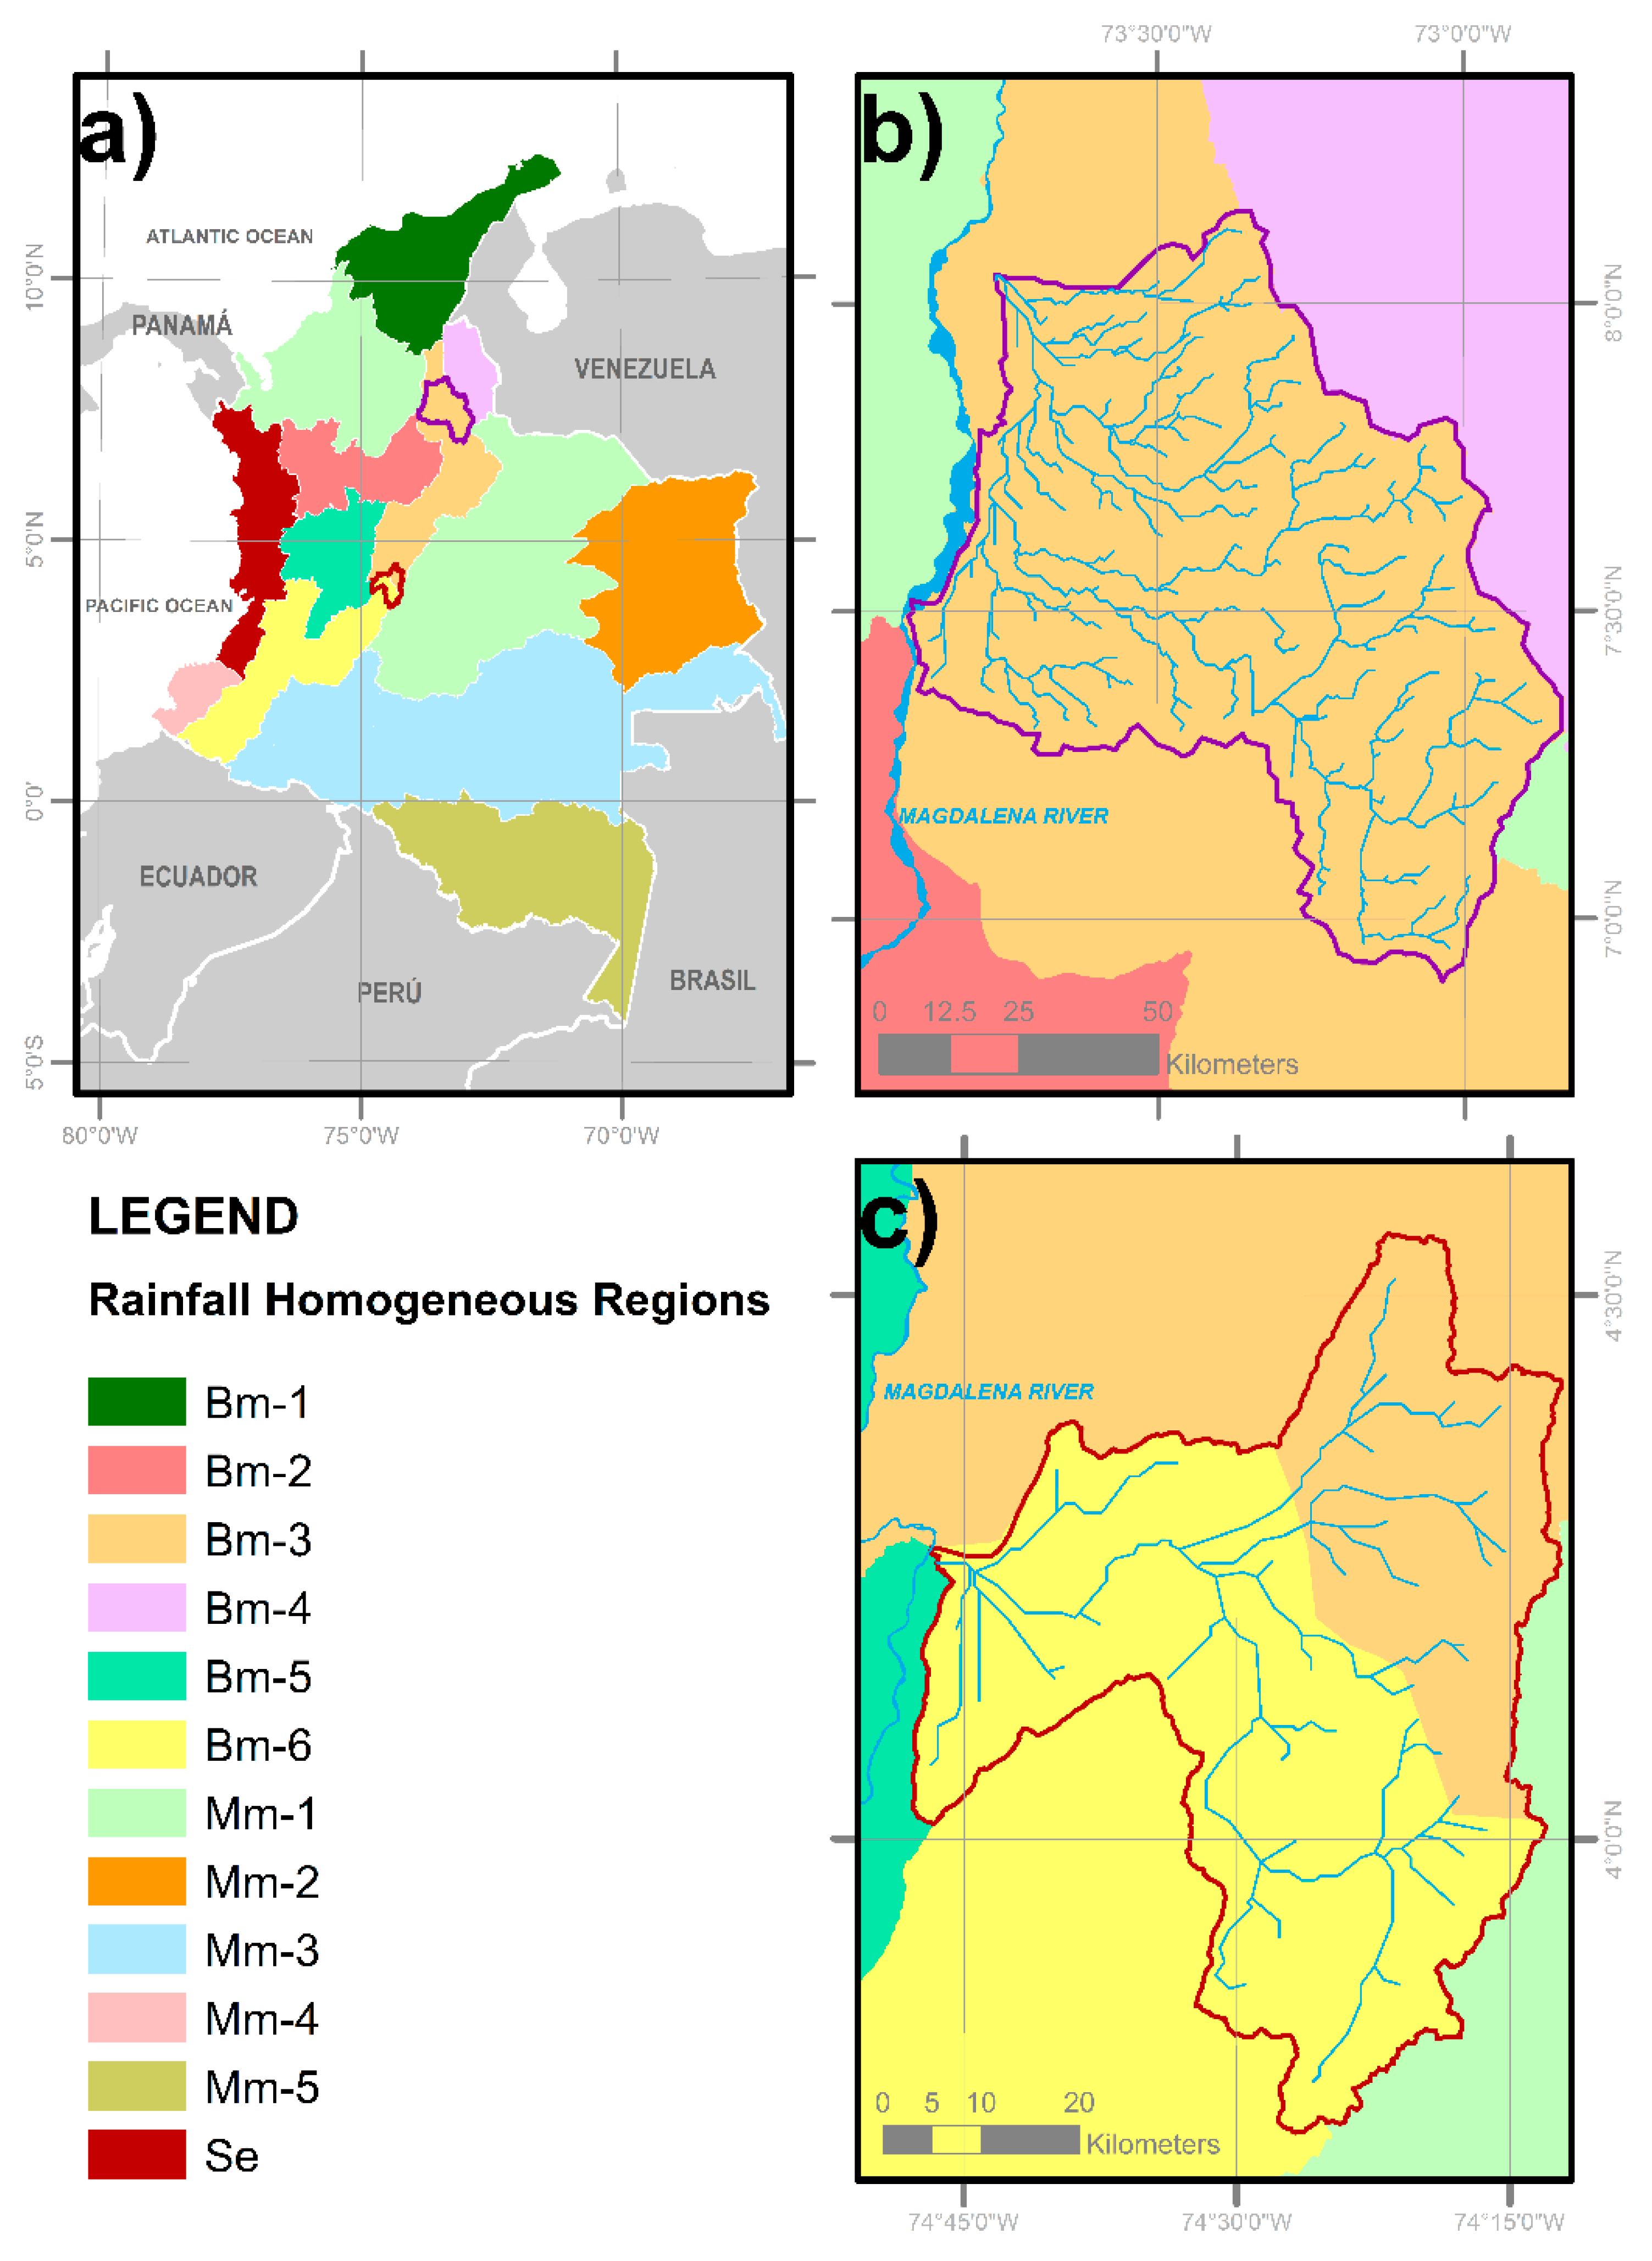
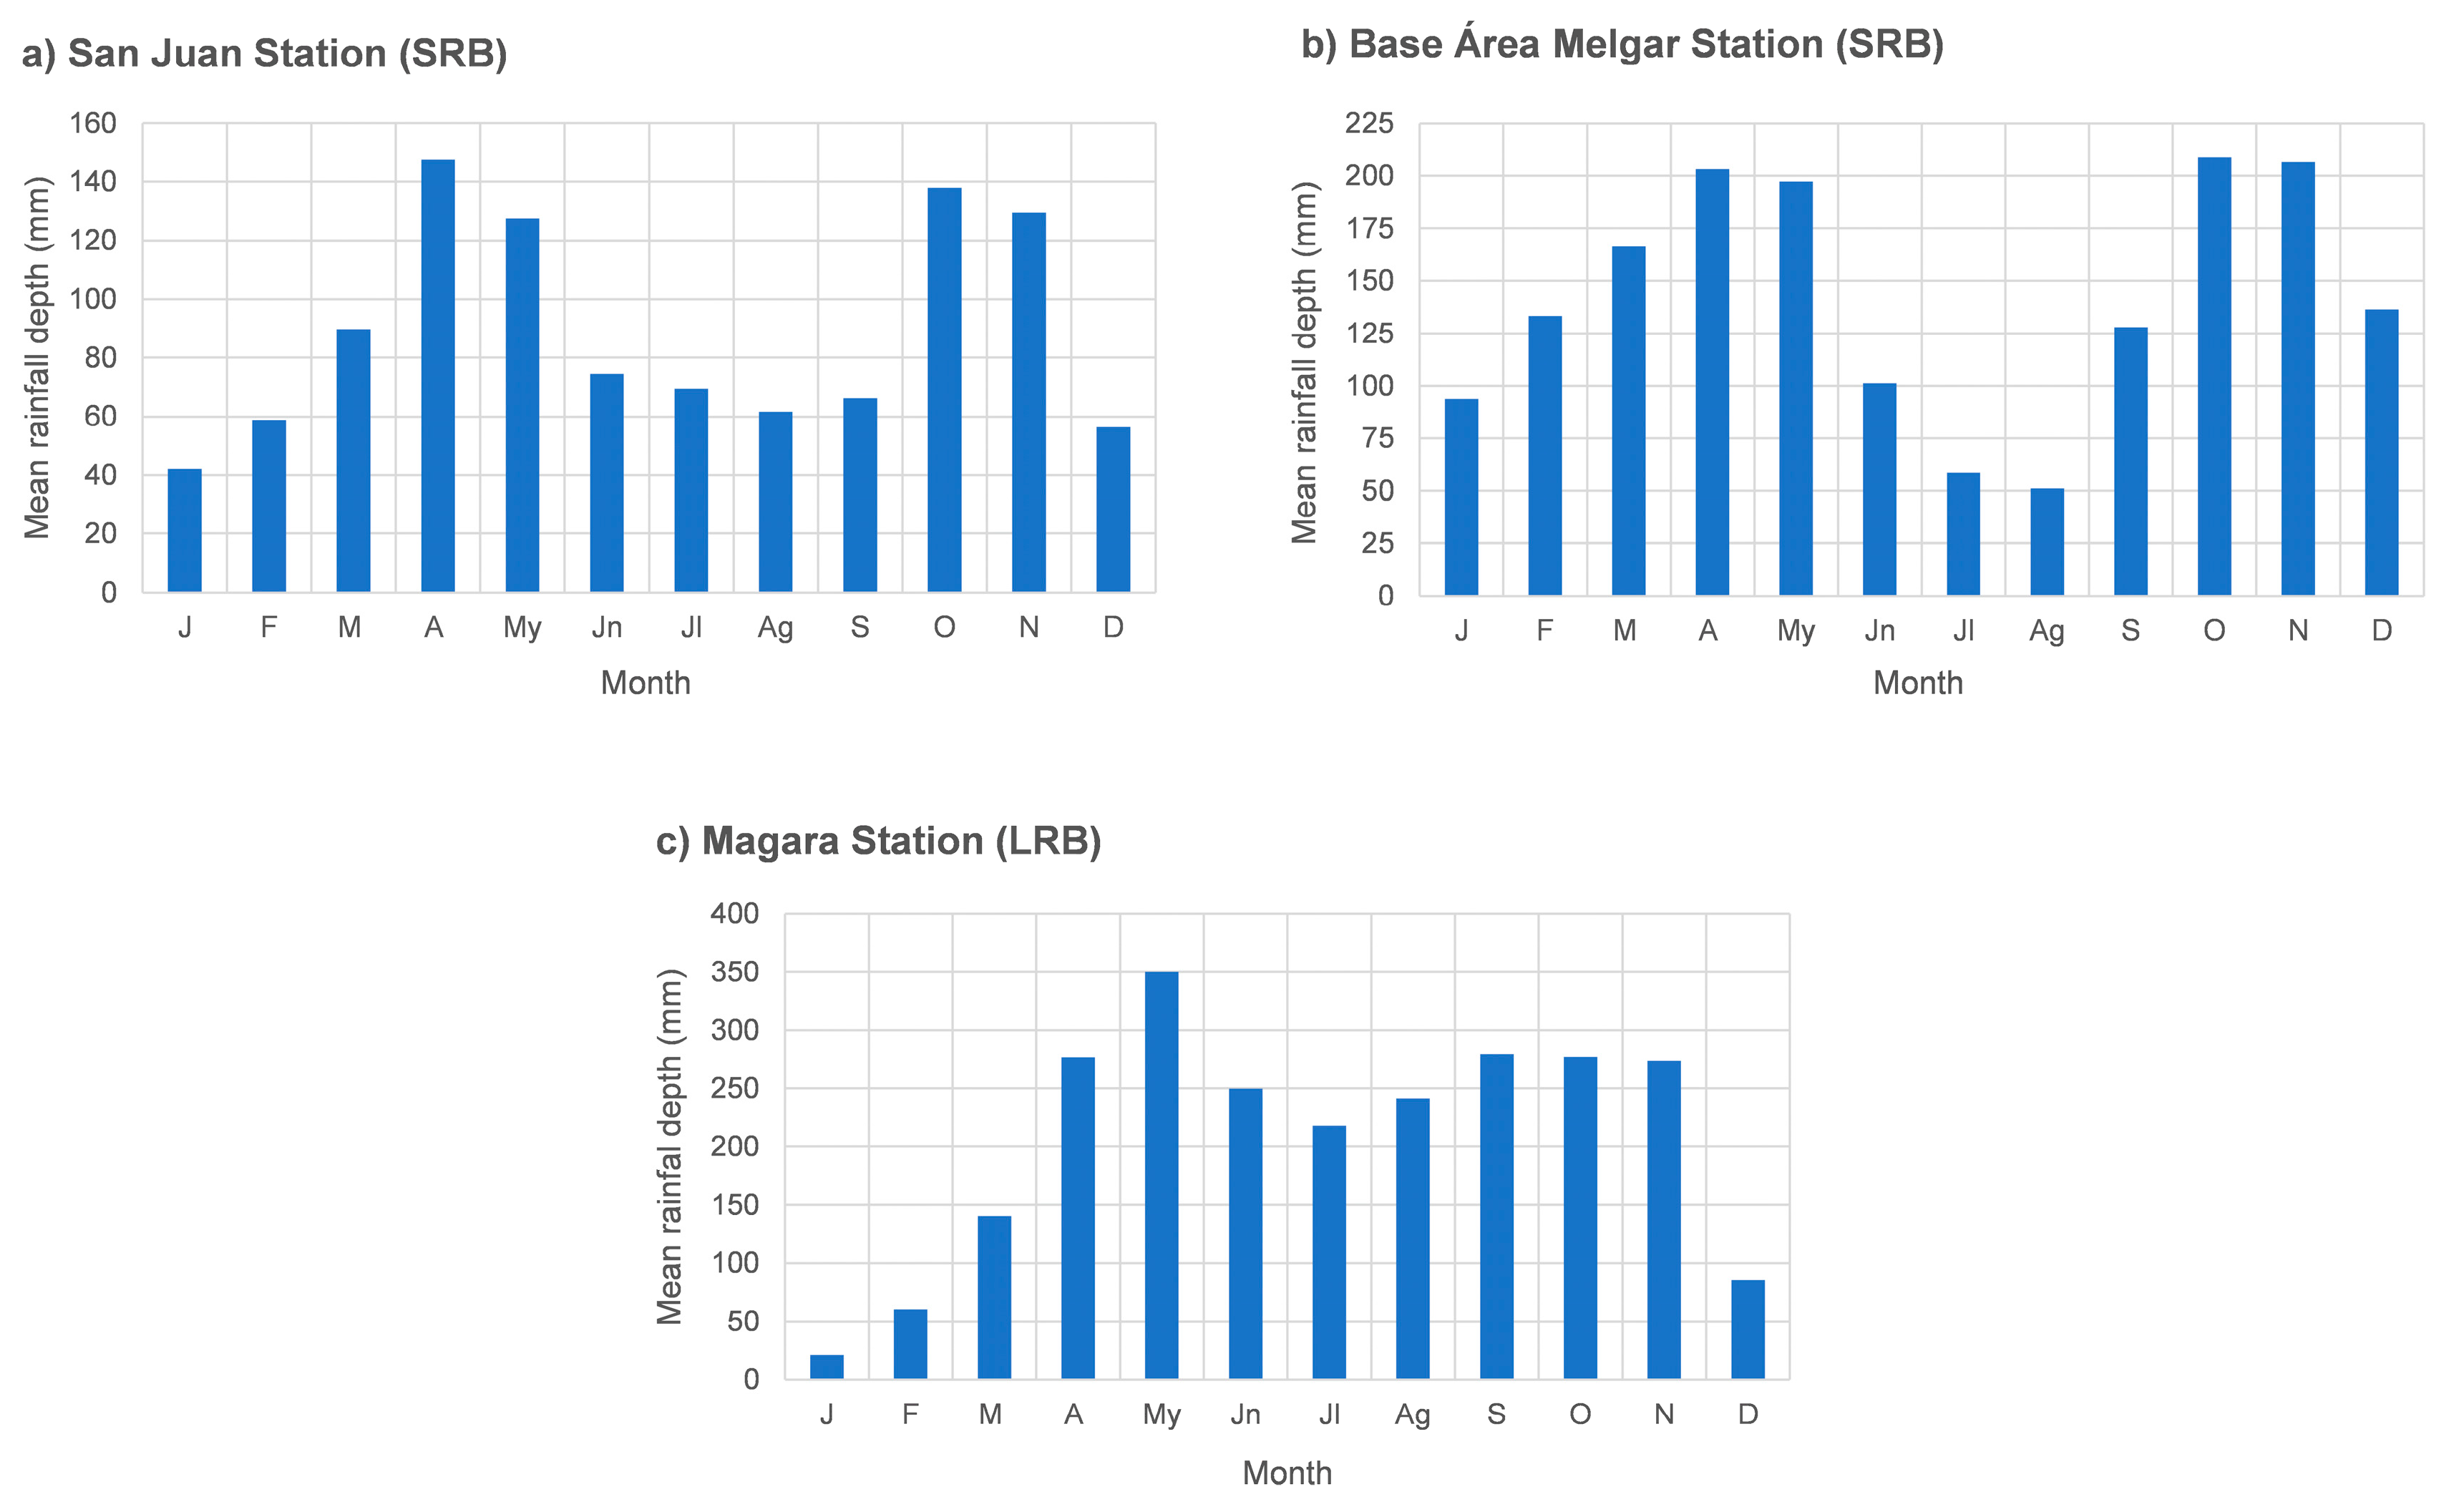
2.1. Study Areas and Datasets
- For rainfall: A weighted average of the four closest surrounding stations was used. The method used was to weight the inverse of the square of the distances between stations.
- For temperature: Two methods were employed, depending on the number of missing values.
- ○
- If the number of missing consecutive registers were between one and six, data was calculated as a simple average for previous seven months.
- ○
- Alternatively, a multiple-regression technique was used when the number or consecutive missing registers was seven or more. In this method, only regressions with coefficients of determination of 0.5 or bigger were accepted.
- For streamflow: Two options were evaluated. First, the use of ratings curves for hydrometric stations was tested. If stage data was unavailable for the required period, the same two techniques employed in temperature were used.
2.1.1. Sumapaz River Basin
2.1.2. Lebrija River Basin
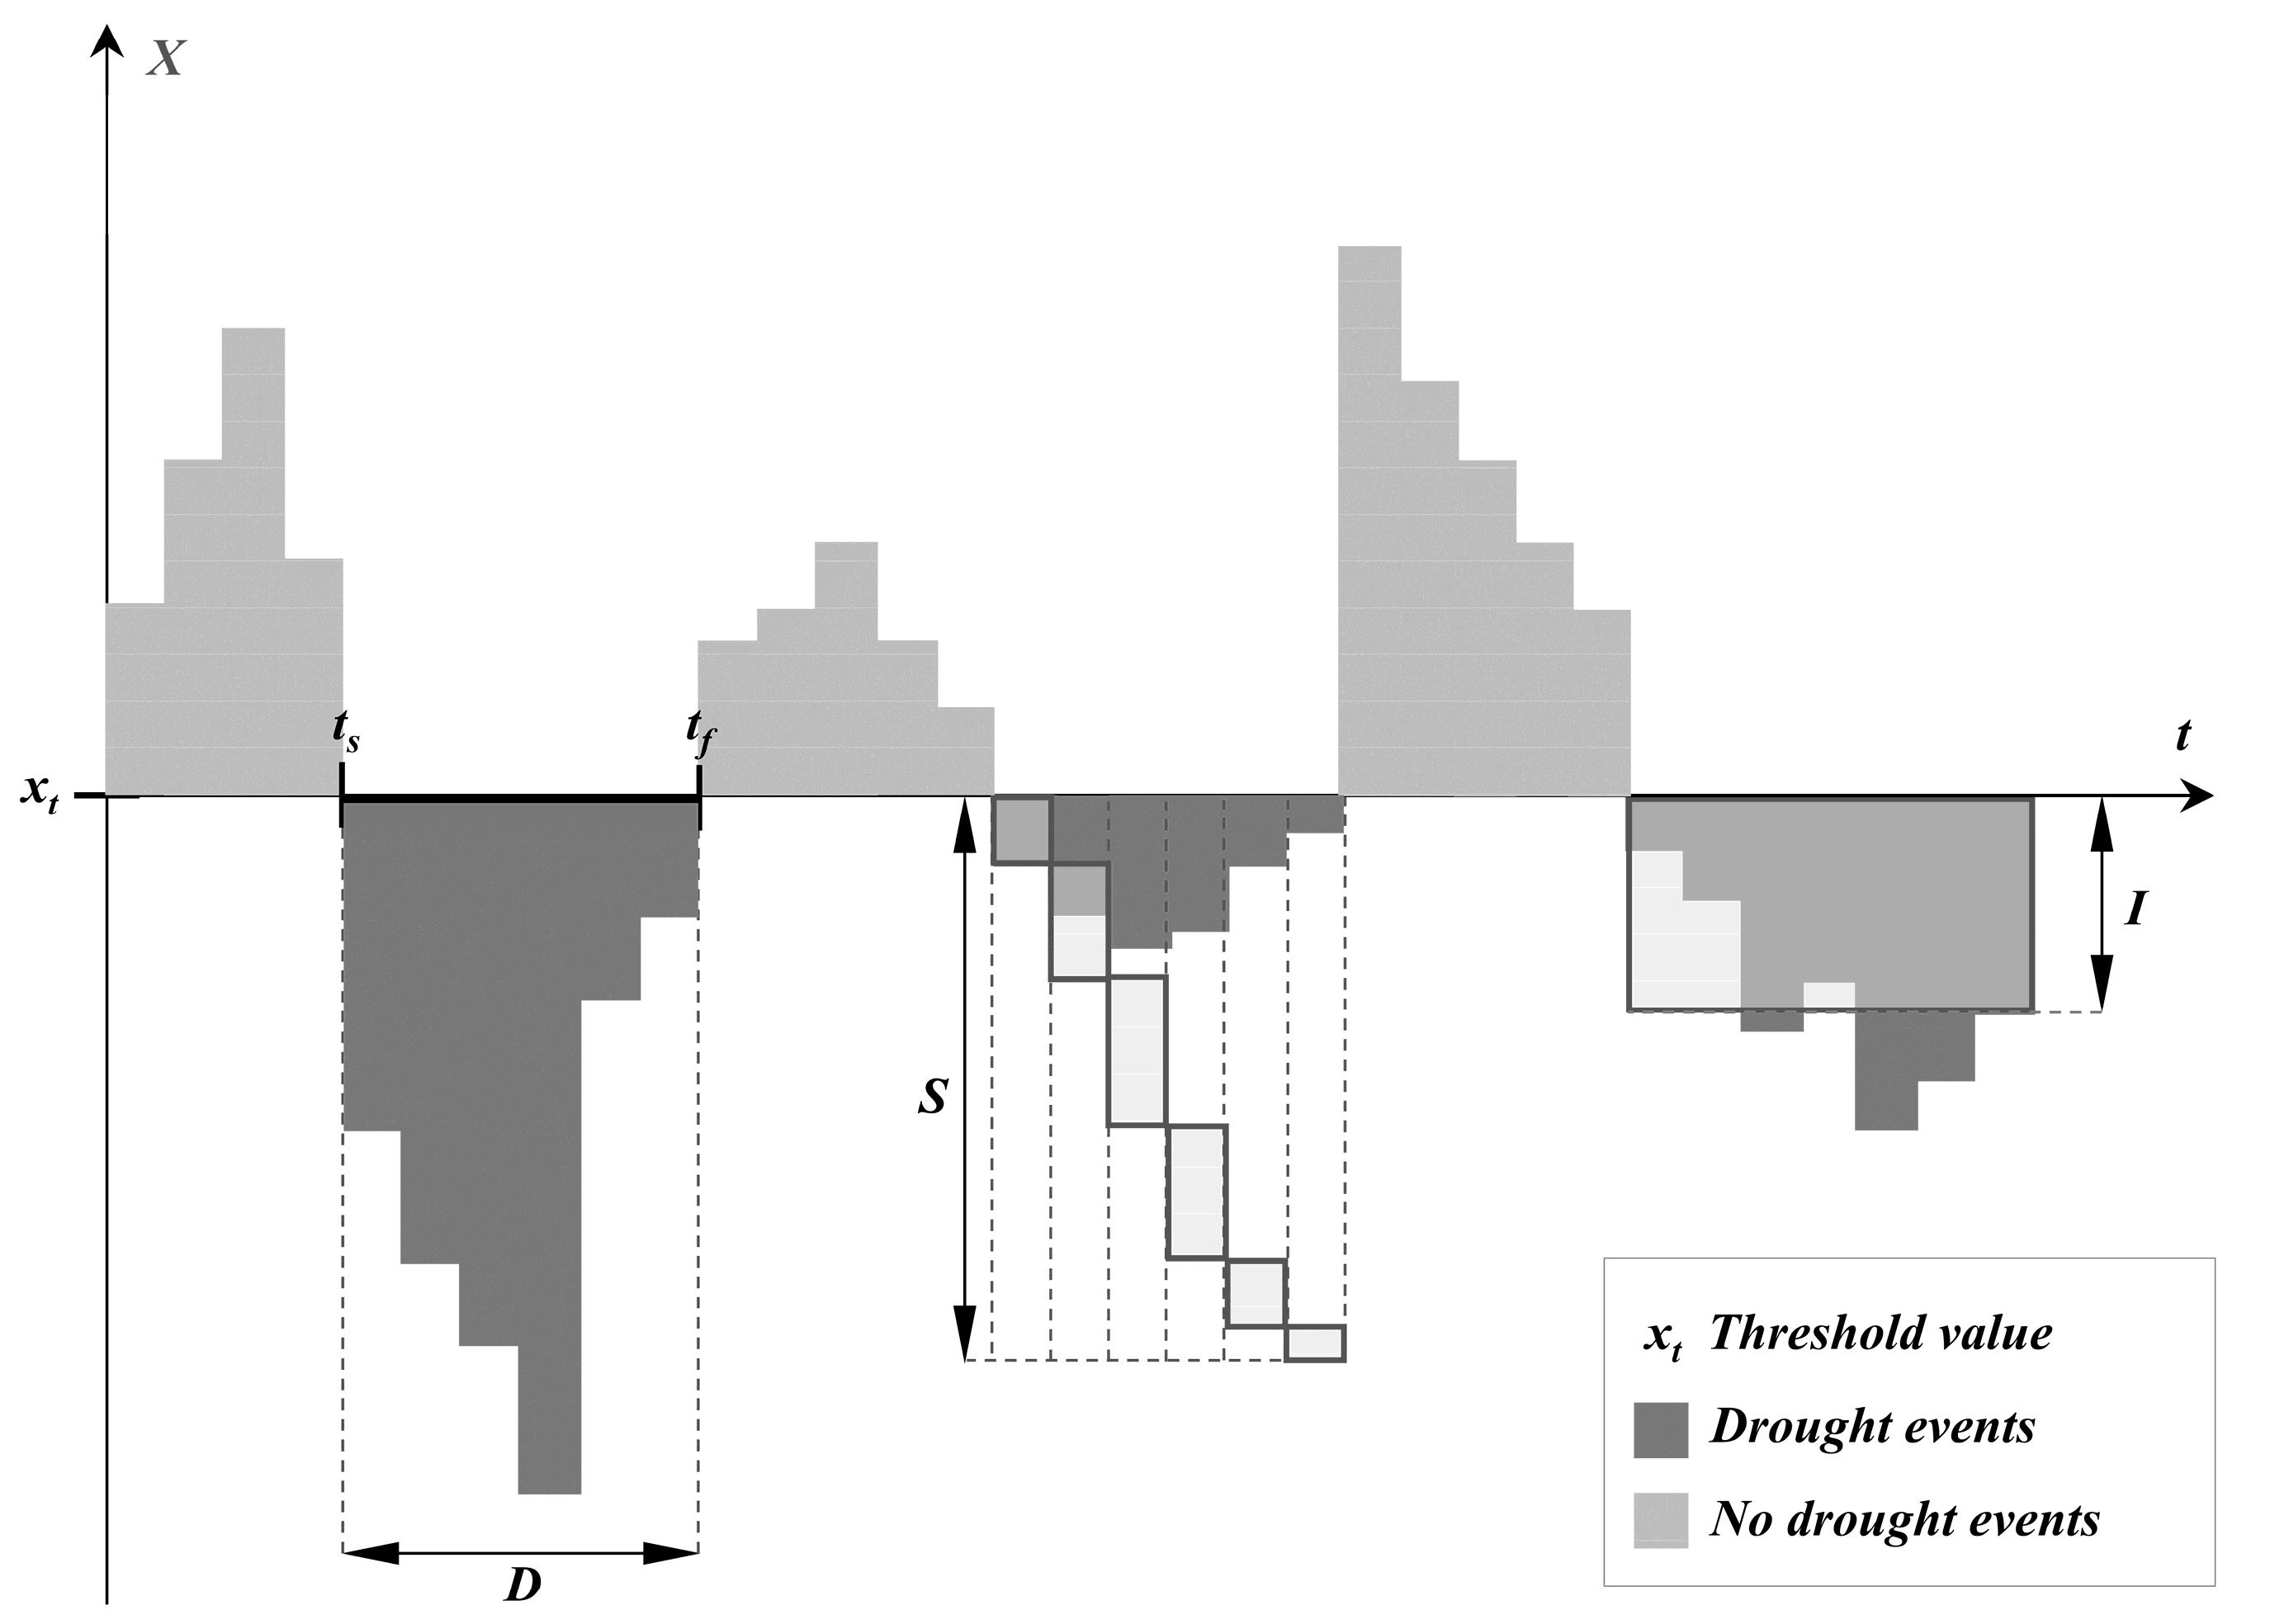
2.2. Drought Characterization
- Start time (ts): beginning of the drought event, equivalent to the time at which the index value crosses the threshold value.
- Finish time (tf): time at which the index value returns to a normal level.
- Duration (D): period between the start and finish times. During this period, the drought index is above or below the corresponding threshold value.
- Severity (S): cumulative deficiency of drought index during the duration. It is calculated as the sum of drought index values throughout the drought duration.
- Intensity (I): average index value over the drought duration, calculated as the severity and duration ratio.
2.3. Drought Indices (DI)
2.3.1. Percent of Normal Precipitation Index (PN)
2.3.2. Standardized Precipitation Index (SPI)
2.3.3. Moisture Anomaly Index (Z)
2.3.4. Palmer Drought Severity Index (PDSI)
2.3.5. Reconnaissance Drought Index (RDI)
2.3.6. Palmer Hydrological Drought Index (PHDI)
2.3.7. Streamflow Drought Index (SDI)
2.3.8. Drought Indices and Drought Types
2.4. Point SDF Curves Construction
2.5. SDF Curves Regionalization
3. Results and Discussion
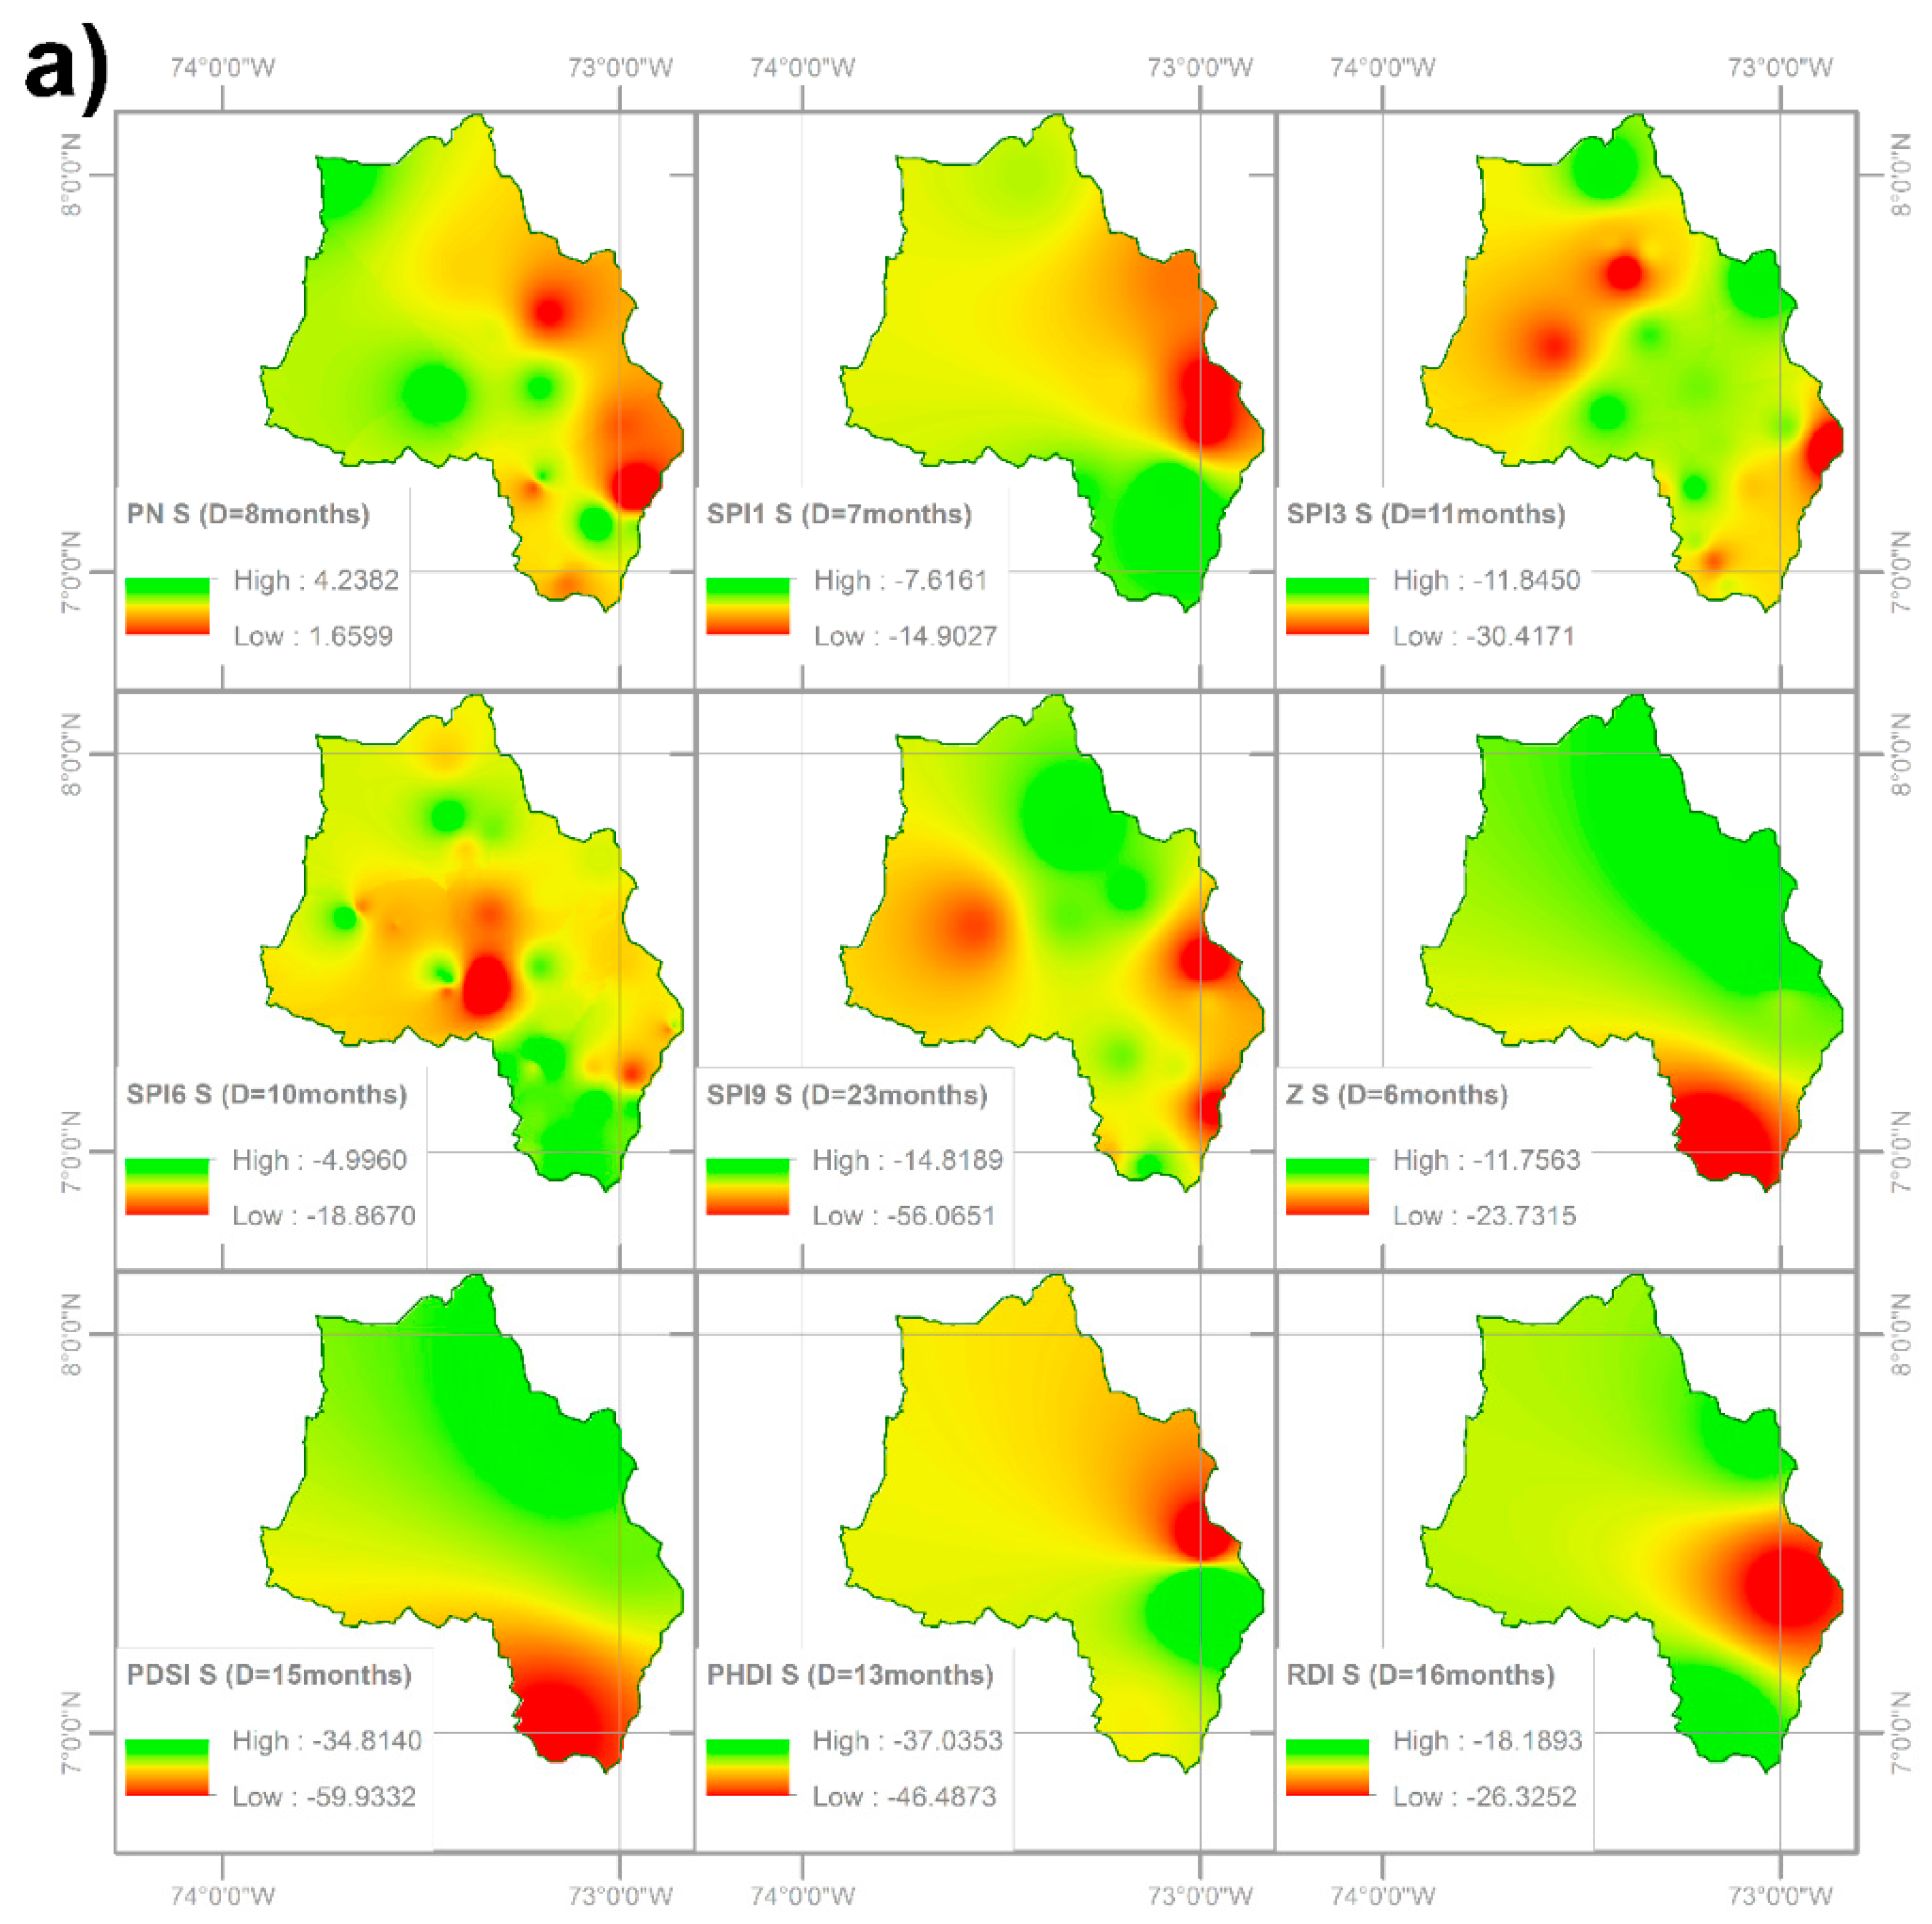
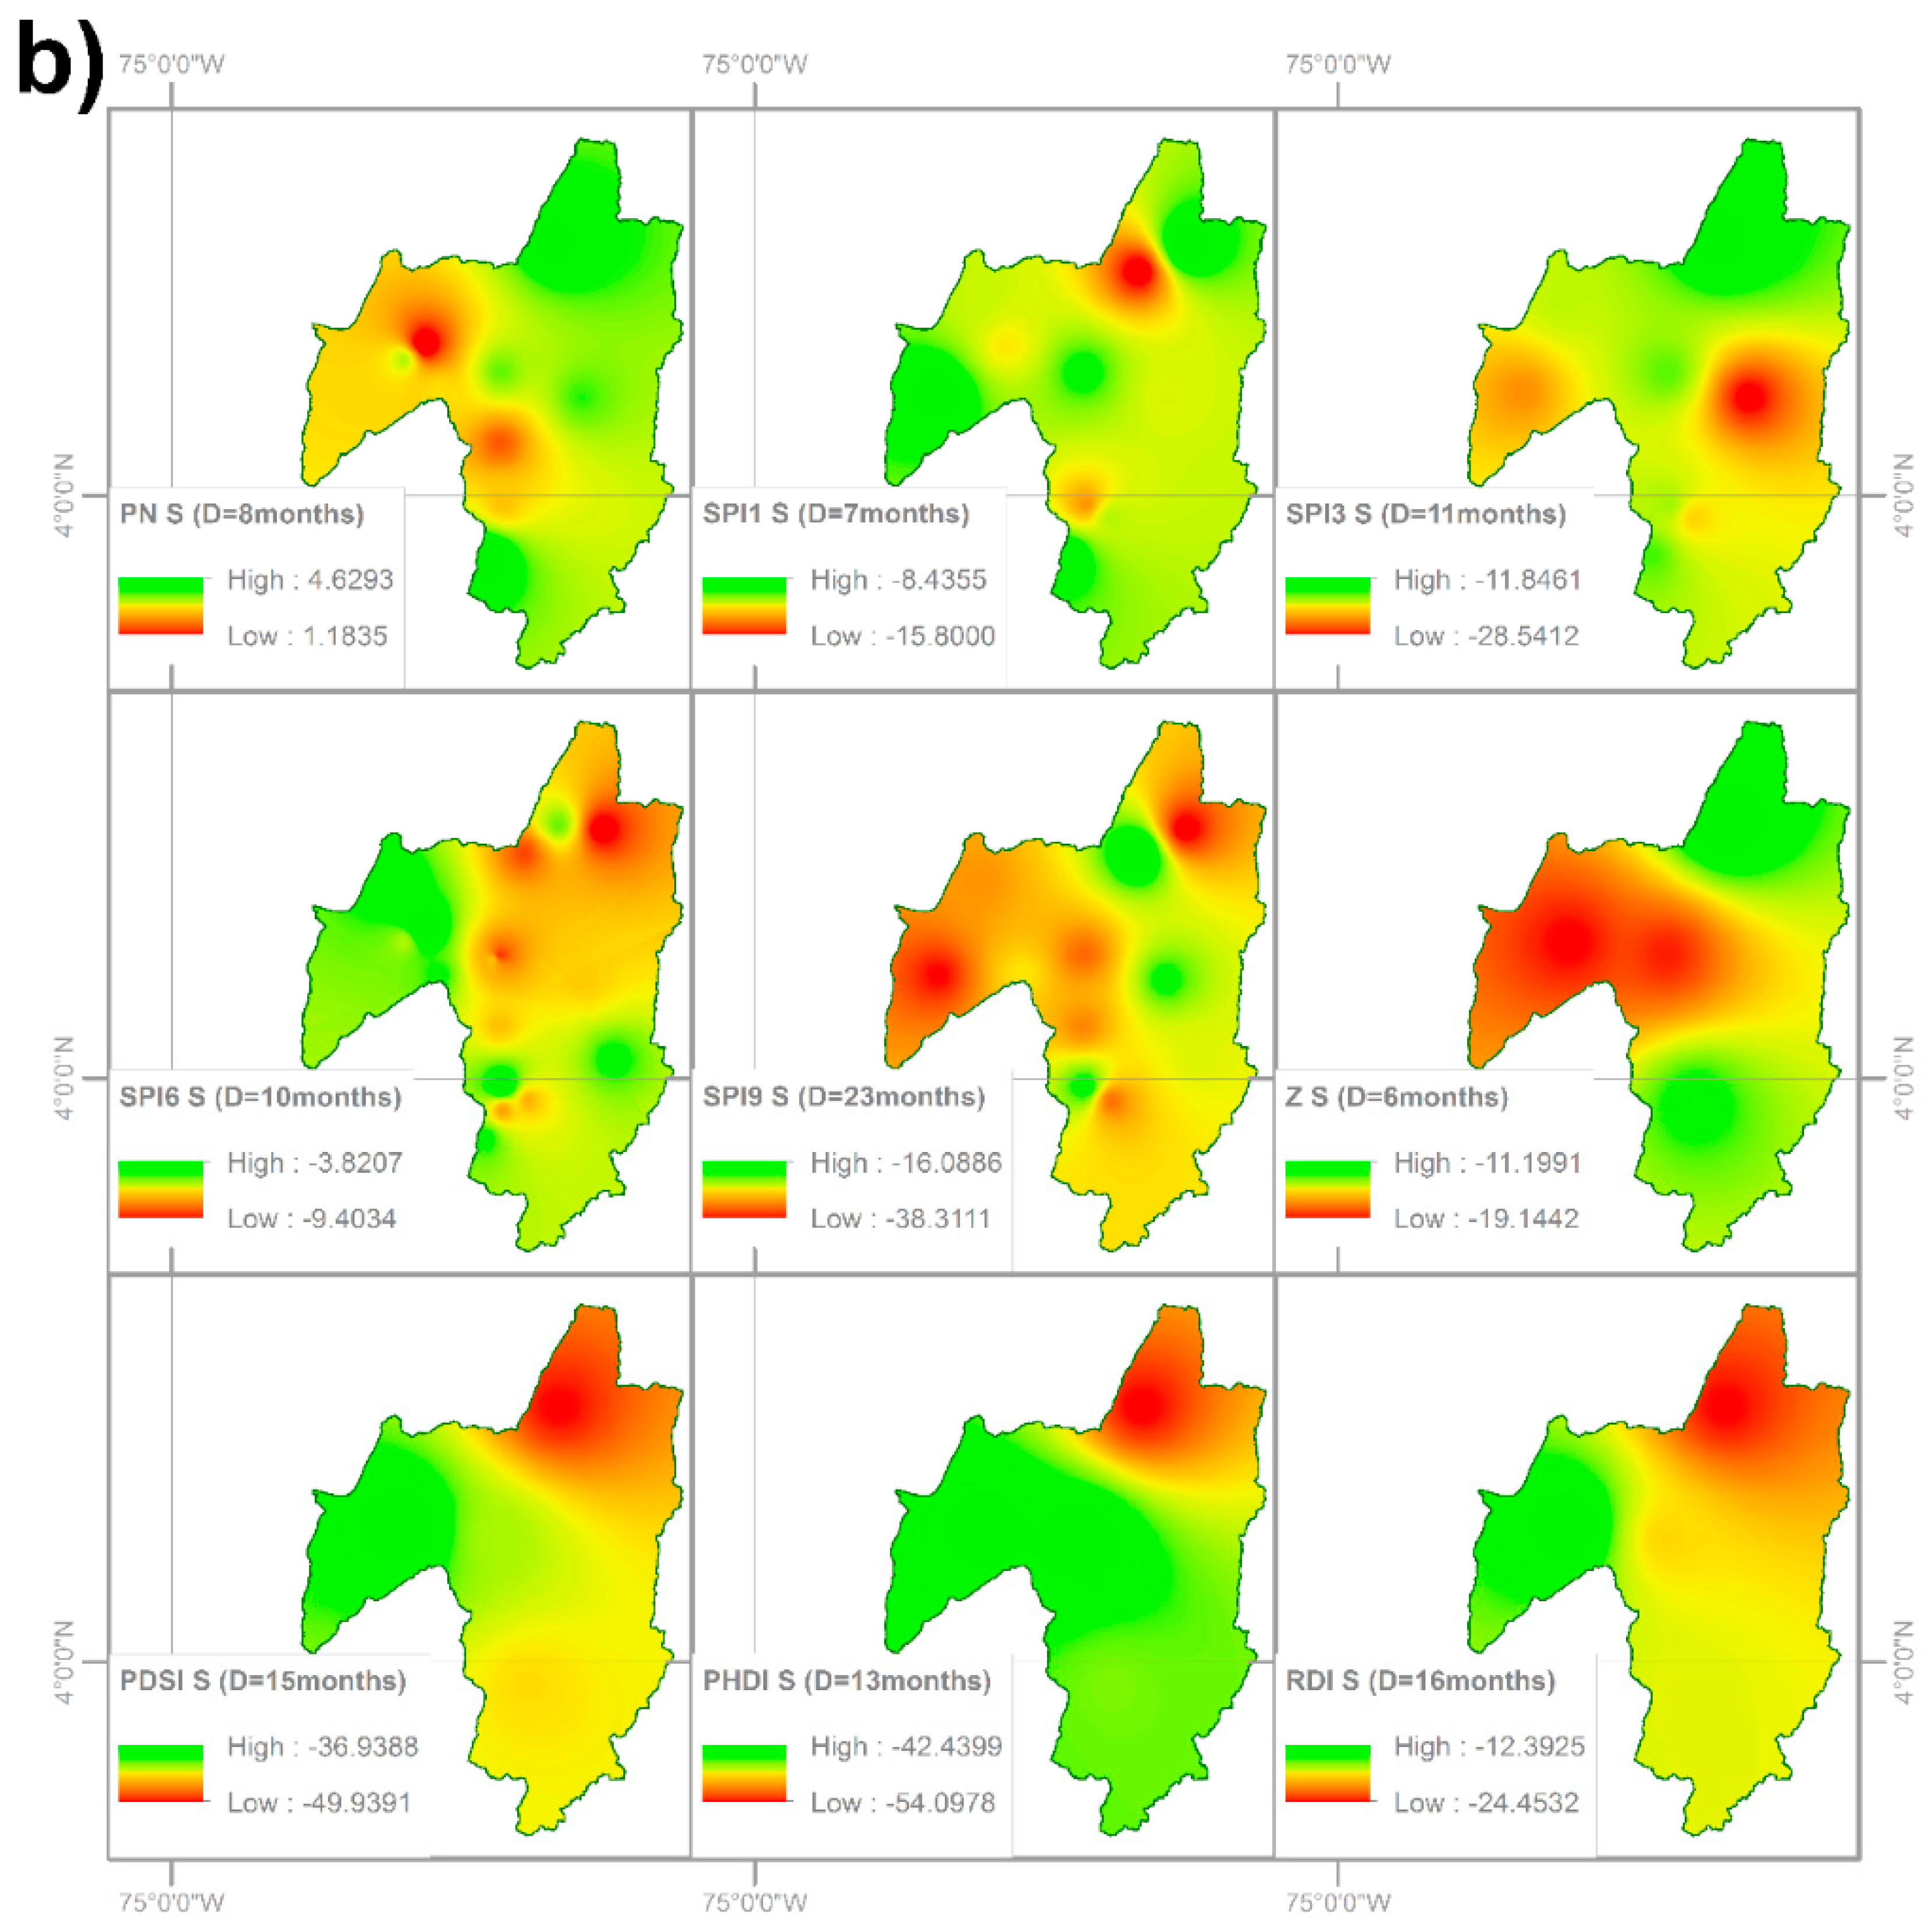
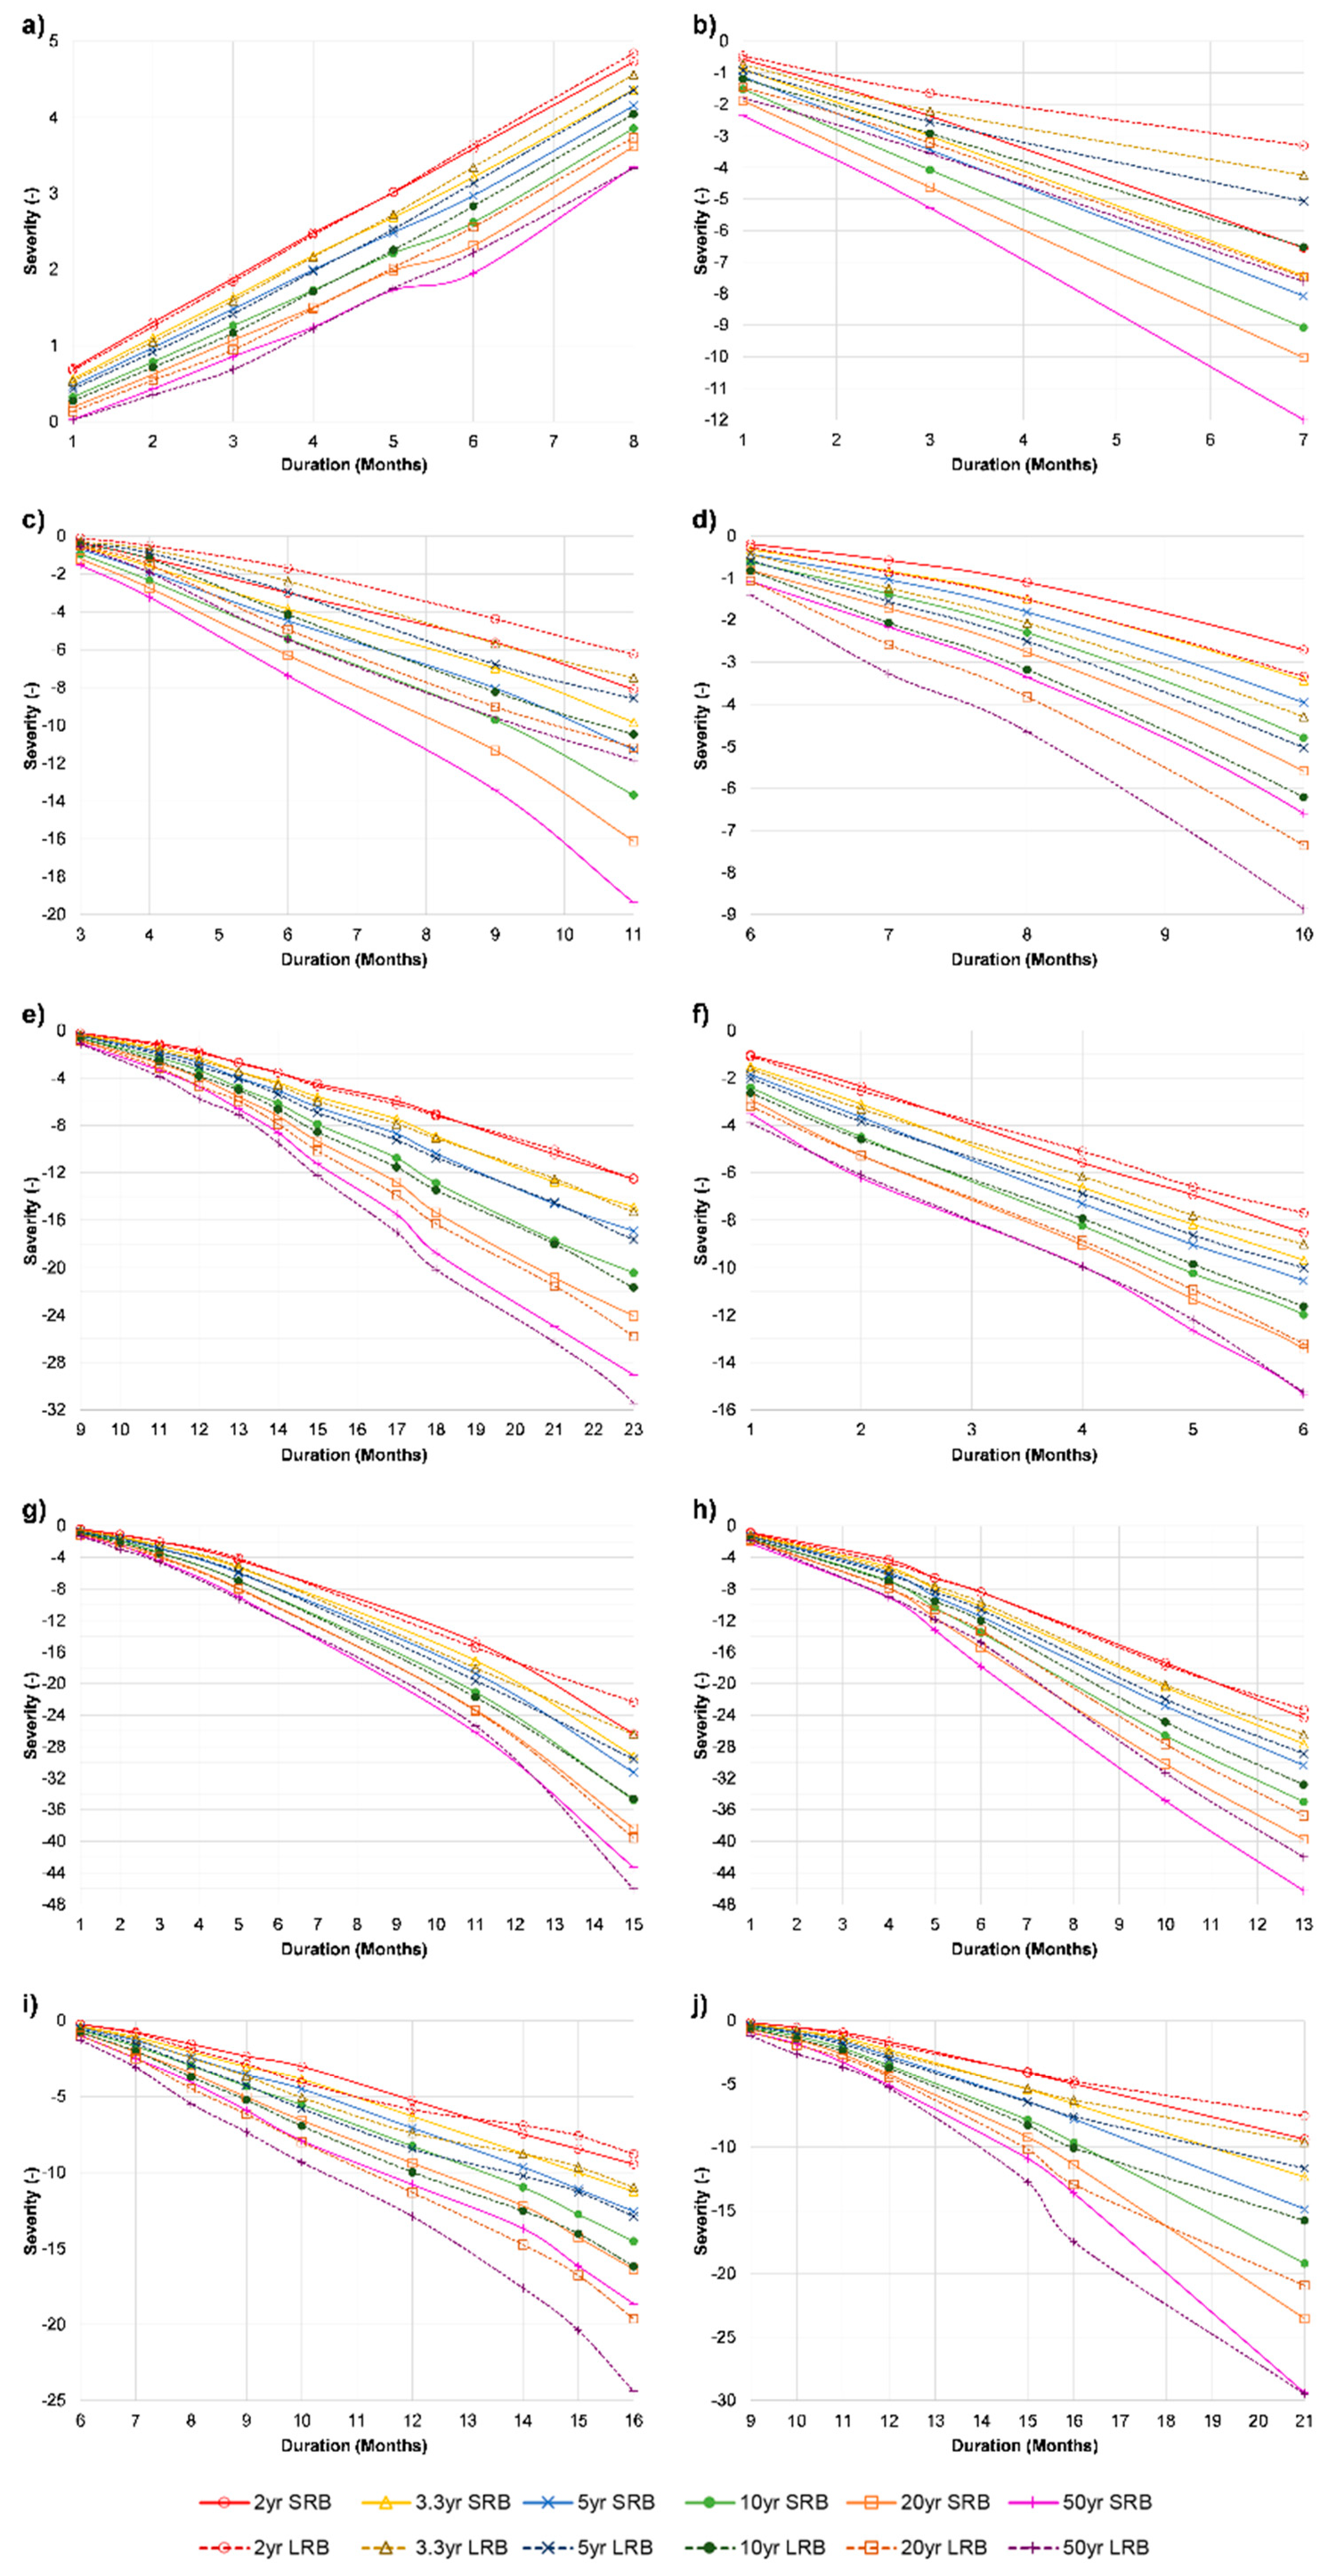
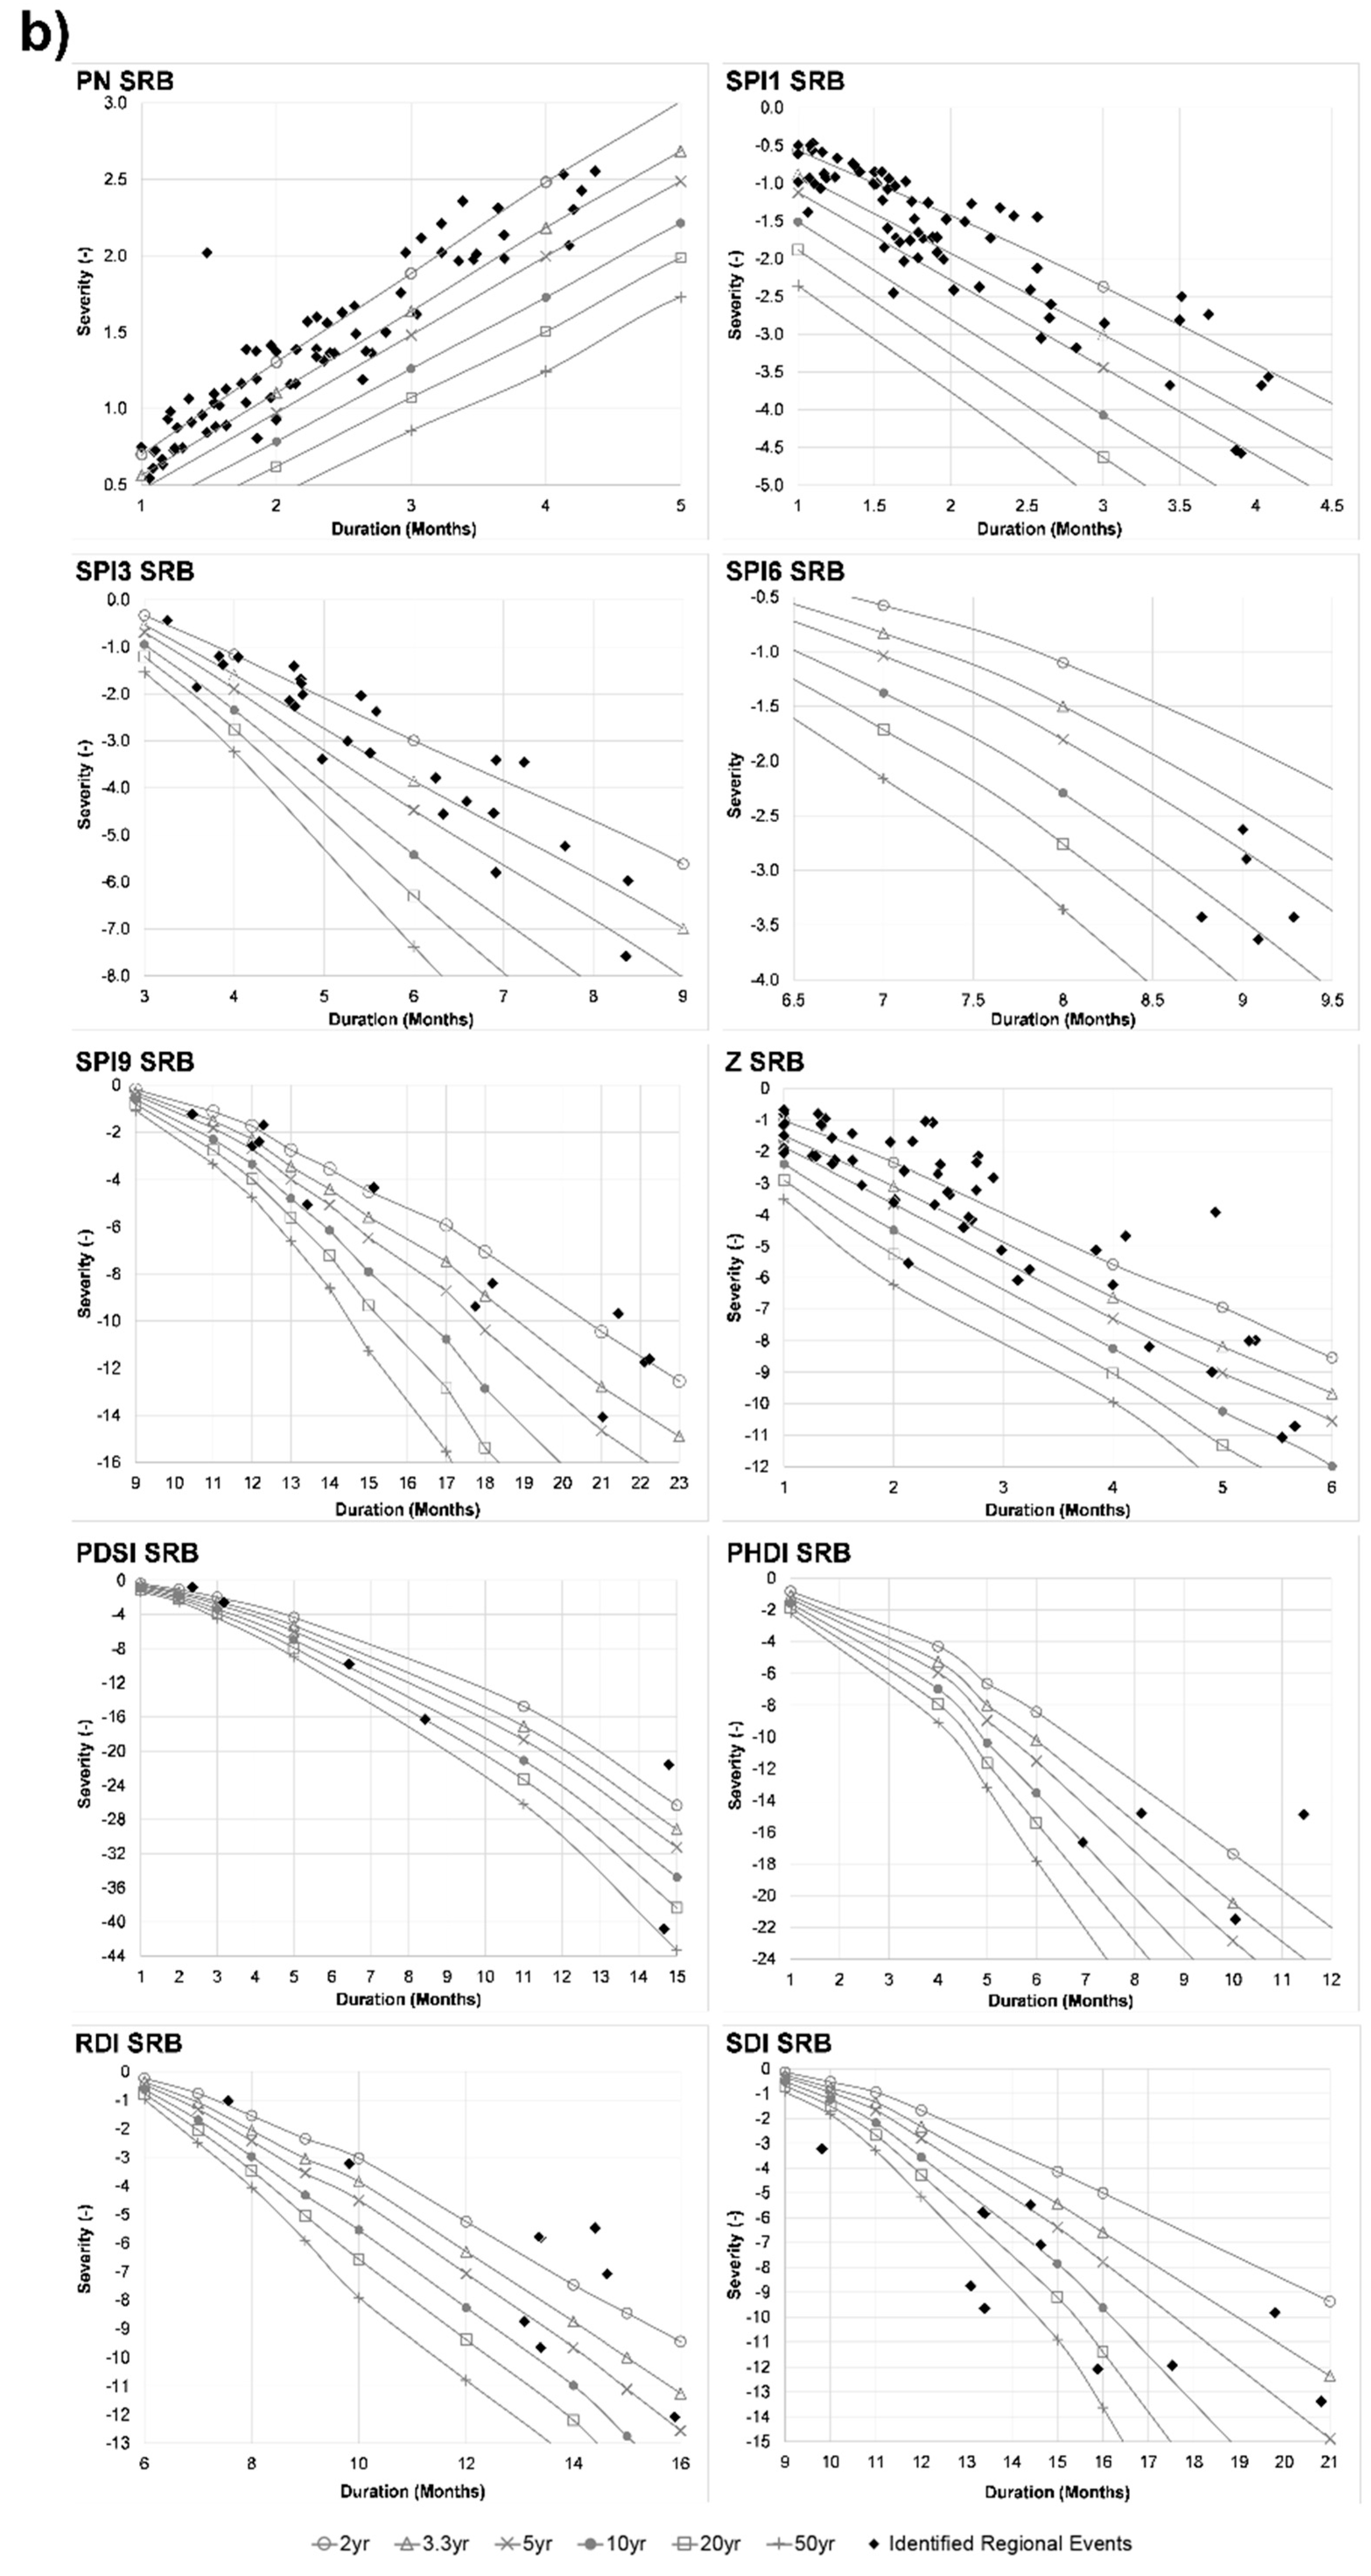
3.1. Regional SDF Curves
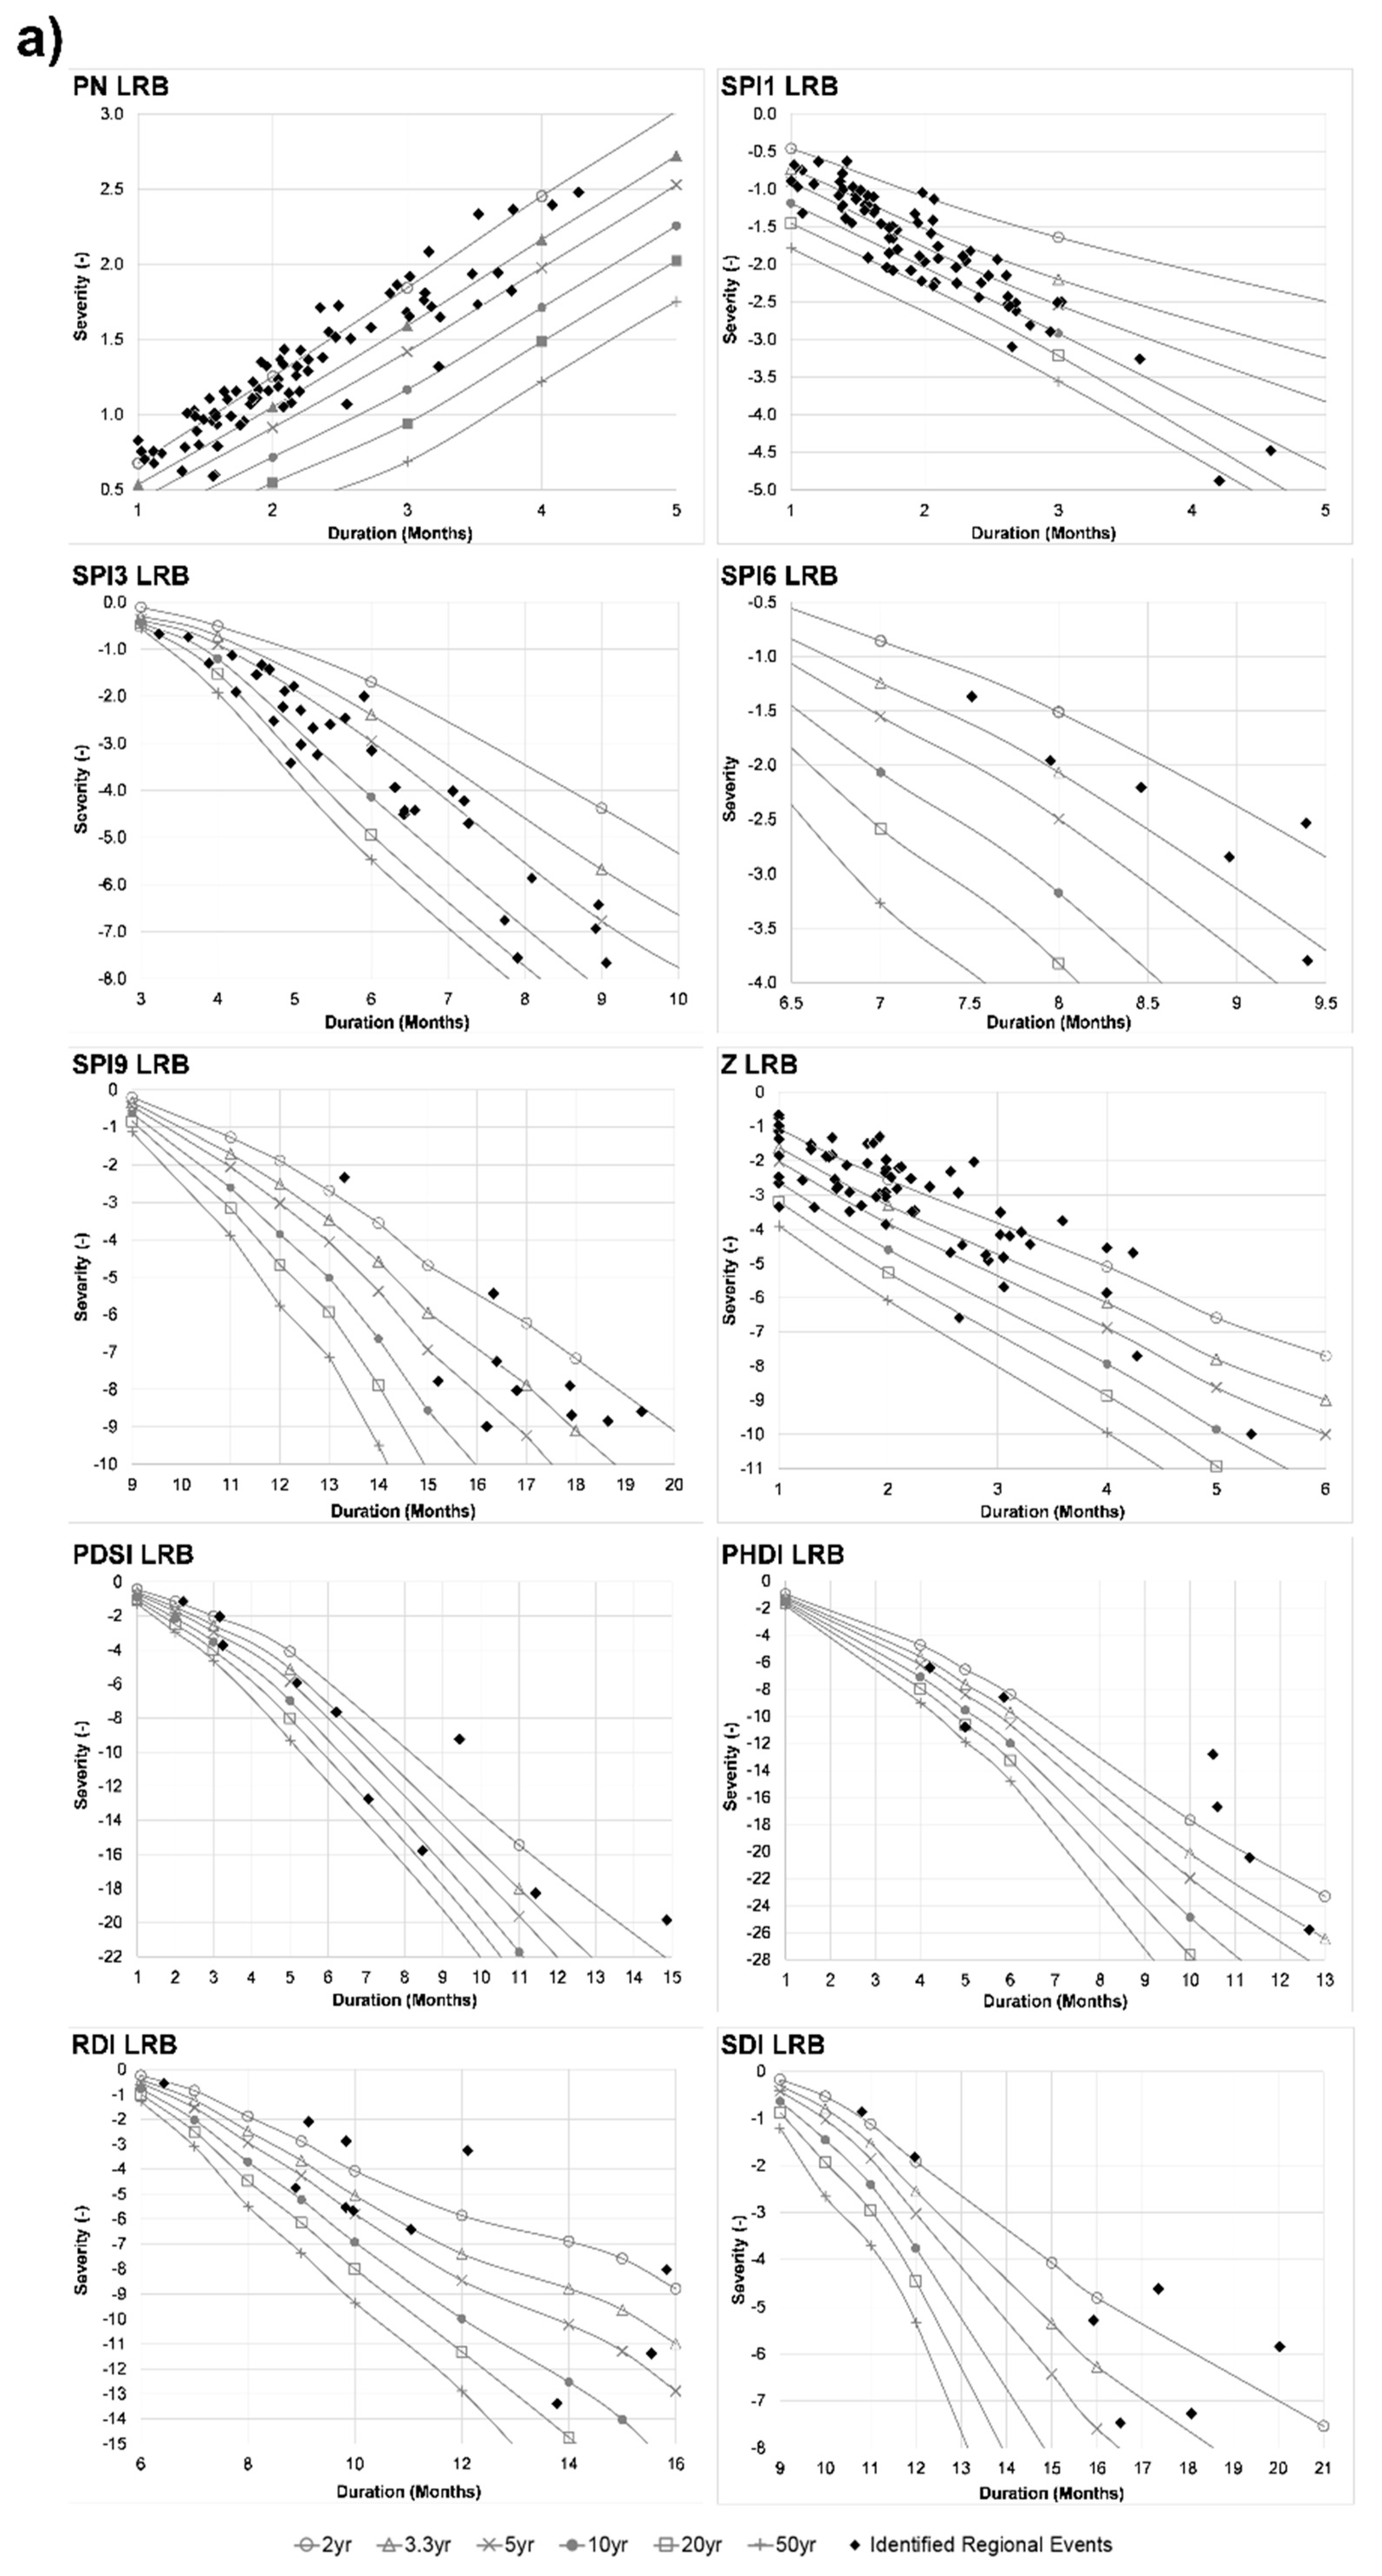
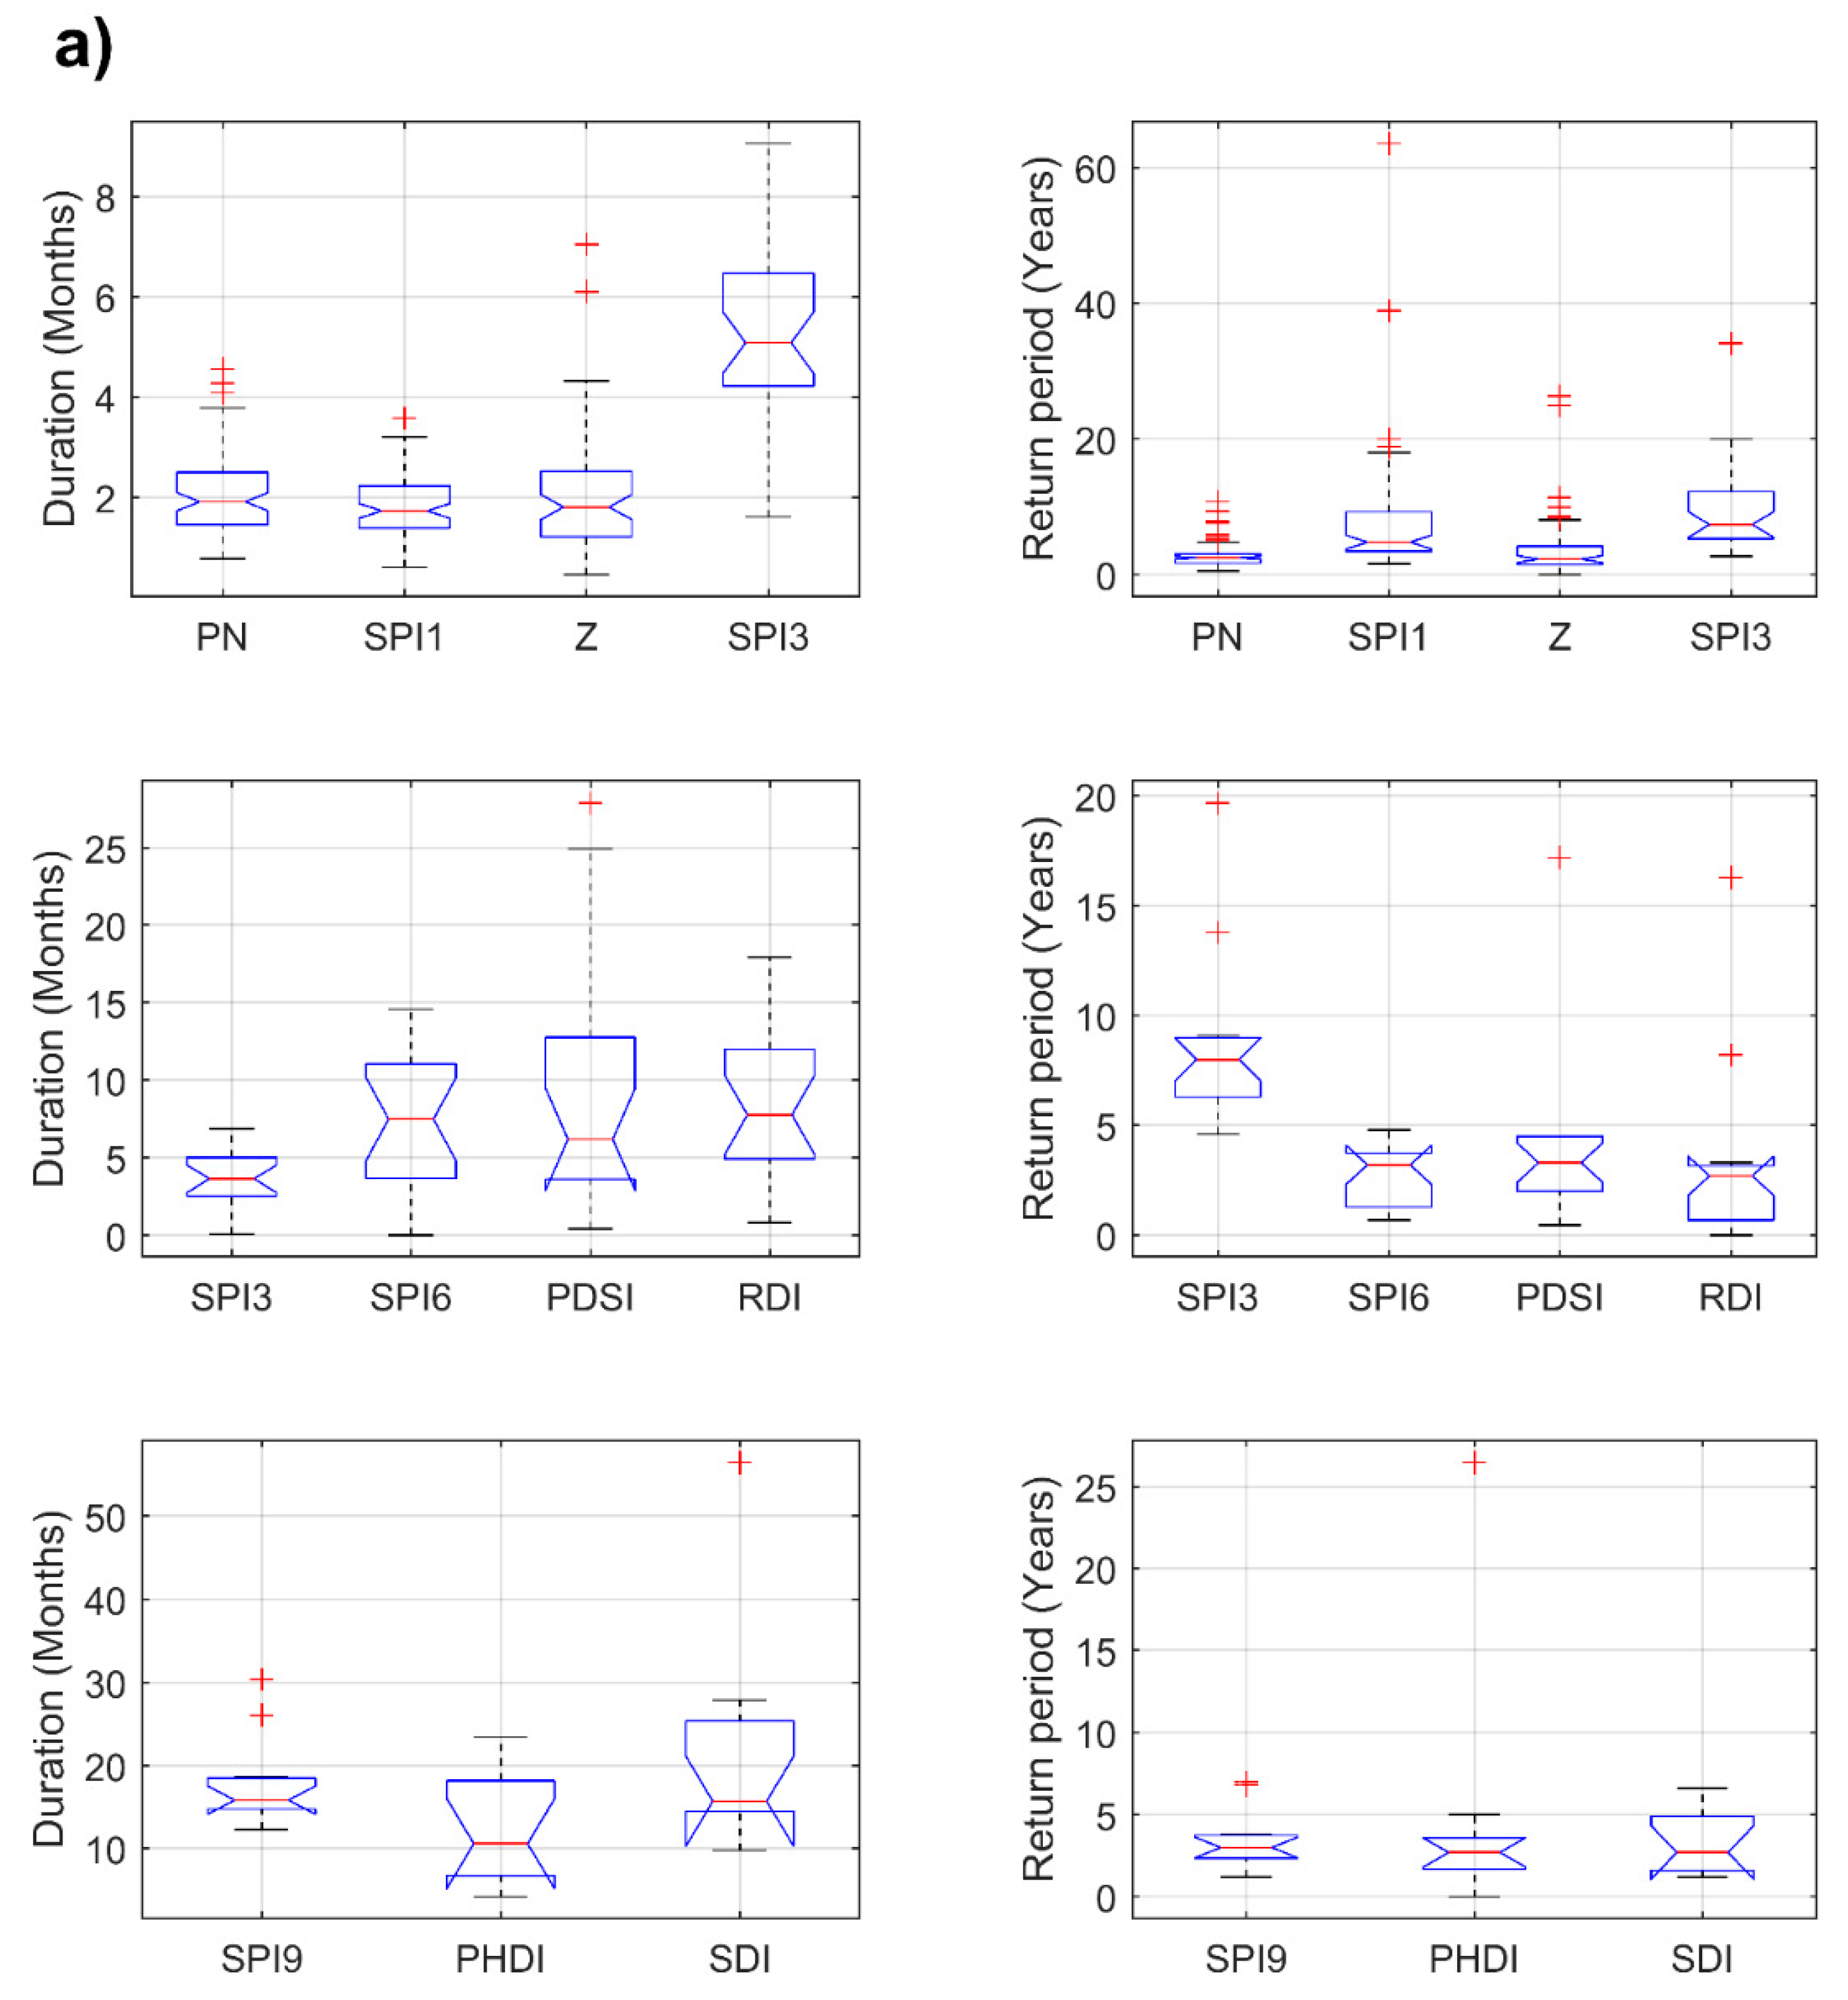
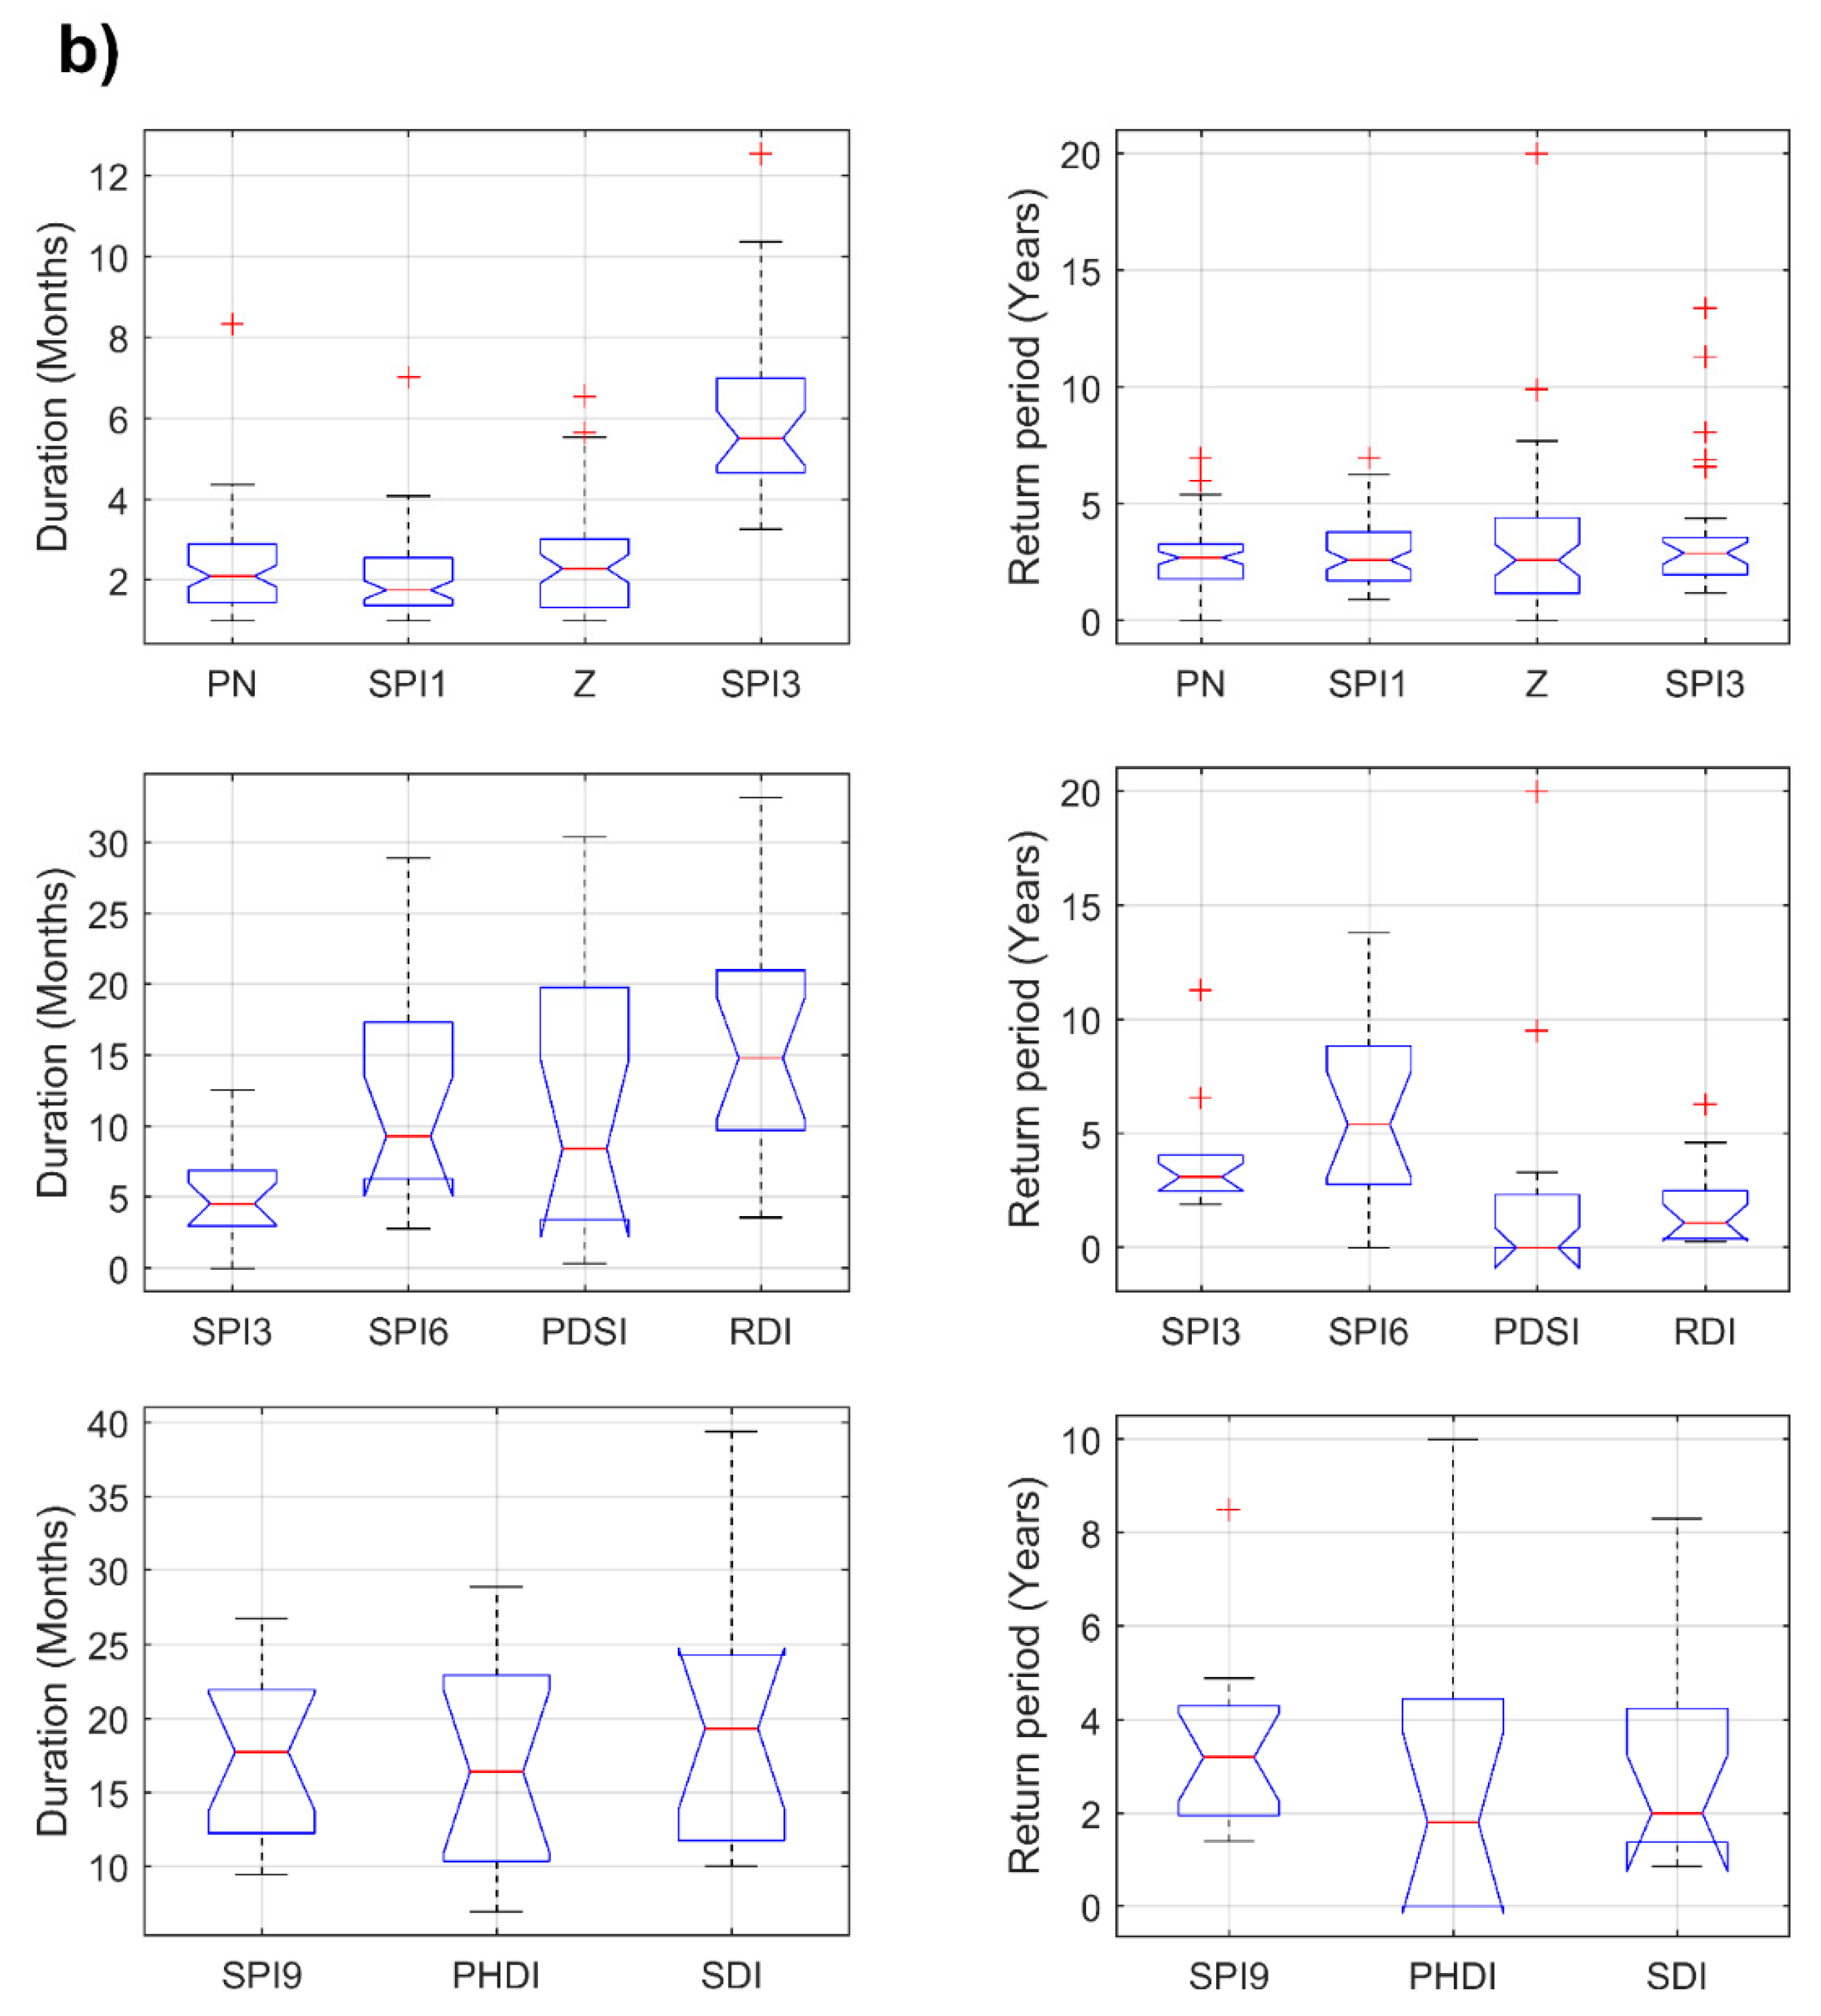
3.2. Location of Regional Drought-Events on Regional SDF Curves
4. Conclusions
- The SDF curves regionalization procedure was clearly influenced by measuring station density inside the study areas, as well as by the parameter’s spatial distribution. Hydrologic and soil-specific features of basins also determined the presence of drought events. Particular attention must be given to the rainfall, temperature, and streamflow series employed for the generation of DI datasets to have long enough records to generate robust point frequency analyses and accurate regional approximations.
- When comparing both catchments generated by regional SDF curves, consistent results are found. This fact supports the supposition that distinctive correlations between severity and duration for all drought indices were conserved during the regionalization procedure. Undoubtedly, magnitudes differed between catchments because specific hydrological attributes also varied, i.e., spatial distribution of stations, rainfall and temperature magnitudes, regularity of extreme event occurrences, etc. However, it is possible to group DI methodologies that lead to consistent results for the same drought type. This is useful in terms of regional planning and operation, because it allows indices with simpler calculation procedures and fewer information requirements to be selected as monitoring tools. It is not intended to imply that one drought index methodology can be considered better than another. However, in terms of regional planning and operation, it is possible to consider that there are some methods than can be more easily applied than others. Given that the purpose of this research was the trial of procedures useful for operational purposes in Colombia, simplicity should be accomplished. The Colombian regional environmental agencies, which are in charge of designing and implementing drought response plans, do not always possess sufficient data resolution and the technical capacity to carry out complex operations. For that reason, this research was focused on simple and well-known methods, which could be easily used, despite data availability and/or specialized capabilities.
- Regarding the location of specific historical events on regional SDF curves, the incidence of meteorological droughts was greater than the other drought types for both case studies. The duration and gravity associated with agricultural and hydrological droughts made them less frequent than those associated with rainfall reductions only. In addition, when the length of the record employed on frequency analyses was consistent, most of the identified regional events displayed low return periods. The importance of the length of the dataset used during this kind of assessment is considered as one of the decisive factors for obtaining an accurate diagnosis of regional historical occurrences.
- When verifying the consistency of different DI methodologies regarding the identification of historical regional drought events, the obtained values of linear correlations between series of durations and frequencies affirmed that consistency tends to increase when analyzing durations instead of frequencies, for the two study-basins. This result indicated, to some extent, that the regionalization process increased variability between methodologies for frequencies, whilst for durations, its impact was not very significant (in agreement with conclusion 2). Secondly, it can be noted that consistency among DI methodologies was greater in the SRB than in the LRB. It implied that the particular features of the study region, including climatic factors, spatial density of measuring stations, and length of available datasets, influenced the coherence of calculation procedures.
- A certain degree of consistency was found when comparing different DI methodologies, for specific drought types, for both duration and frequency parameters. It was possible to observe that medians for DIs that identify the same drought type tended to overlap with a 95% confidence level, and that occurrences identified as ‘outliers’ tended to be persistent among calculation procedures, for both of the analyzed criterion: Duration and frequency.
Author Contributions
Funding
Conflicts of Interest
References
- Food and Agriculture Organization of the United Nations. The Impact of Disasters and Crises on Agriculture and Food Security, 2017; FAO: Rome, Italy, 2018; ISBN 978-92-5-130359-7. [Google Scholar]
- Food and Agriculture Organization of the United Nations. AQUASTAT. Available online: http://www.fao.org/nr/water/aquastat/data/query/index.html?lang=en (accessed on 27 September 2018).
- Yadav, S.S.; Redden, R.J.; Hatfield, J.L.; Lotze-Campen, H.; Hall, A.E. Crop Adaptation to Climate Change; Wiley-Blackwell: Oxford, UK, 2011; ISBN 978-0-470-96092-9. [Google Scholar]
- Espinoza, G.; Hajek, E. Riesgos climáticos: Evidencias en Chile central. In Ecología del Paisaje en Chile Central: Estudios Sobre sus Espacios Montañosos; Fuentes, E.R., Prenafeta, S., Eds.; Universidad Católica de Chile: Santiago, Chile, 1998; pp. 41–51. [Google Scholar]
- Oxford Bussiness Group (OBG). The Report: Colombia 2016; OBG: London, UK, 2016. [Google Scholar]
- Richard, Y.; Fauchereau, N.; Poccard, I.; Rouault, M.; Trzaska, S. 20th century droughts in southern Africa: Spatial and temporal variability, teleconnections with oceanic and atmospheric conditions. Int. J. Climatol. 2001, 21, 873–885. [Google Scholar] [CrossRef]
- Brown, J.F.; Wardlow, B.D.; Tadesse, T.; Hayes, M.J.; Reed, B.C. The vegetation drought response index (VegDRI): A new integrated approach for monitoring drought stress in vegetation. GISci. Remote Sens. 2008, 45, 16–46. [Google Scholar] [CrossRef]
- Raziei, T.; Saghafian, B.; Paulo, A.A.; Pereira, L.S.; Bordi, I. Spatial patterns and temporal variability of drought in Western Iran. Water Resour. Manag. 2009, 23, 439–455. [Google Scholar] [CrossRef]
- Santos, J.F.; Pulido-Calvo, I.; Portela, M.M. Spatial and temporal variability of droughts in Portugal. Water Resour. Res. 2010, 46. [Google Scholar] [CrossRef]
- Martins, D.S.; Raziei, T.; Paulo, A.A.; Pereira, L.S. Spatial and temporal variability of precipitation and drought in Portugal. Nat. Hazards Earth Syst. Sci. 2012, 12, 1493–1501. [Google Scholar] [CrossRef]
- Wang, H.; Chen, Y.; Pan, Y.; Li, W. Spatial and temporal variability of drought in the arid region of China and its relationships to teleconnection indices. J. Hydrol. 2015, 523, 283–296. [Google Scholar] [CrossRef]
- Wilhite, D.A.; Glantz, M.H. Understanding: The drought phenomenon: The role of definitions. Water Int. 1985, 10, 111–120. [Google Scholar] [CrossRef]
- Mishra, A.K.; Singh, V.P. A review of drought concepts. J. Hydrol. 2010, 391, 202–216. [Google Scholar] [CrossRef]
- Zhang, Q.; Li, J.; Singh, V.P.; Bai, Y. SPI-based evaluation of drought events in Xinjiang, China. Nat. Hazards 2012, 64, 481–492. [Google Scholar] [CrossRef]
- Paparrizos, S.; Maris, F.; Matzarakis, A. Mapping of drought for Sperchios River basin in central Greece. Hydrol. Sci. J. 2016, 1–11. [Google Scholar] [CrossRef]
- Dabanlı, İ.; Mishra, A.K.; Şen, Z. Long-term spatio-temporal drought variability in Turkey. J. Hydrol. 2017, 552, 779–792. [Google Scholar] [CrossRef]
- Kaluba, P.; Verbist, K.M.J.; Cornelis, W.M.; Van Ranst, E. Spatial mapping of drought in Zambia using regional frequency analysis. Hydrol. Sci. J. 2017, 62, 1825–1839. [Google Scholar] [CrossRef]
- Bayissa, Y.A.; Moges, S.A.; Xuan, Y.; Van Andel, S.J.; Maskey, S.; Solomatine, D.P.; Griensven, A.V.; Tadesse, T. Spatio-temporal assessment of meteorological drought under the influence of varying record length: The case of Upper Blue Nile Basin, Ethiopia. Hydrol. Sci. J. 2015, 60, 1–16. [Google Scholar] [CrossRef]
- Ganguli, P.; Ganguly, A.R. Space-time trends in U.S. meteorological droughts. J. Hydrol. Reg. Stud. 2016, 8, 235–259. [Google Scholar] [CrossRef]
- Kazemzadeh, M.; Malekian, A. Spatial characteristics and temporal trends of meteorological and hydrological droughts in northwestern Iran. Nat. Hazards 2016, 80, 191–210. [Google Scholar] [CrossRef]
- Dash, B.K.; Rafiuddin, M.; Khanam, F.; Islam, M.N. Characteristics of meteorological drought in Bangladesh. Nat. Hazards 2012, 64, 1461–1474. [Google Scholar] [CrossRef]
- Li, B.; Liang, Z.; Yu, Z.; Acharya, K. Evaluation of drought and wetness episodes in a cold region (Northeast China) since 1898 with different drought indices. Nat. Hazards 2014, 71, 2063–2085. [Google Scholar] [CrossRef]
- Yacoub, E.; Tayfur, G. Evaluation and assessment of meteorological drought by different methods in Trarza Region, Mauritania. Water Resour. Manag. 2017, 31, 825–845. [Google Scholar] [CrossRef]
- Wong, G.; van Lanen, H.A.J.; Torfs, P.J.J.F. Probabilistic analysis of hydrological drought characteristics using meteorological drought. Hydrol. Sci. J. 2013, 58, 253–270. [Google Scholar] [CrossRef]
- Lin, Q.; Wu, Z.; Singh, V.P.; Sadeghi, S.H.R.; He, H.; Lu, G. Correlation between hydrological drought, climatic factors, reservoir operation, and vegetation cover in the Xijiang Basin, South China. J. Hydrol. 2017, 549, 512–524. [Google Scholar] [CrossRef]
- Bonaccorso, B.; Bordi, I.; Cancelliere, A.; Rossi, G.; Sutera, A. Spatial variability of drought: An analysis of the SPI in Sicily. Water Resour. Manag. 2003, 17, 273–296. [Google Scholar] [CrossRef]
- Wu, J.; Chen, X.; Yao, H.; Gao, L.; Chen, Y.; Liu, M. Non-linear relationship of hydrological drought responding to meteorological drought and impact of a large reservoir. J. Hydrol. 2017, 551, 495–507. [Google Scholar] [CrossRef]
- Pandey, R.P.; Mishra, S.K.; Singh, R.; Ramasastri, K.S. Streamflow drought severity analysis of Betwa river system (India). Water Resour. Manag. 2008, 22, 1127–1141. [Google Scholar] [CrossRef]
- Jeong, S.; Yu, I.; Felix, M.L.A.; Kim, S.; Oh, K. Drought assessment for real-time hydrologic drought index of the Nakdong River Basin in Korea. Desalin. Water Treat. 2014, 52, 2826–2832. [Google Scholar] [CrossRef]
- Razmkhah, H. Comparing threshold level methods in development of stream flow drought severity-duration-frequency curves. Water Resour. Manag. 2017, 31, 4045–4061. [Google Scholar] [CrossRef]
- Vu, M.T.; Vo, N.D.; Gourbesville, P.; Raghavan, S.V.; Liong, S.-Y. Hydro-meteorological drought assessment under climate change impact over the Vu Gia–Thu Bon River Basin, Vietnam. Hydrol. Sci. J. 2017, 62, 1654–1668. [Google Scholar] [CrossRef]
- Farrar, T.J.; Nicholson, S.E.; Lare, A.R. The Influence of soil type on the relationships between NDVI, rainfall, and soil moisture in semiarid Botswana. II. NDVI response to soil moisture. Remote Sens. Environ. 1994, 50, 121–133. [Google Scholar] [CrossRef]
- Wang, J.; Price, K.P.; Rich, P.M. Spatial patterns of NDVI in response to precipitation and temperature in the central Great Plains. Int. J. Remote Sens. 2001, 22, 3827–3844. [Google Scholar] [CrossRef]
- Ji, L.; Peters, A.J. Assessing vegetation response to drought in the northern Great Plains using vegetation and drought indices. Remote Sens. Environ. 2003, 87, 85–98. [Google Scholar] [CrossRef]
- Wan, Z.; Wang, P.; Li, X. Using MODIS land surface temperature and normalized difference vegetation index products for monitoring drought in the southern Great Plains, USA. Int. J. Remote Sens. 2004, 25, 61–72. [Google Scholar] [CrossRef]
- Jain, S.K.; Keshri, R.; Goswami, A.; Sarkar, A.; Chaudhry, A. Identification of drought-vulnerable areas using NOAA AVHRR data. Int. J. Remote Sens. 2009, 30, 2653–2668. [Google Scholar] [CrossRef]
- Quiring, S.M.; Ganesh, S. Evaluating the utility of the Vegetation Condition Index (VCI) for monitoring meteorological drought in Texas. Agric. For. Meteorol. 2010, 150, 330–339. [Google Scholar] [CrossRef]
- Bajgain, R.; Xiao, X.; Wagle, P.; Basara, J.; Zhou, Y. Sensitivity analysis of vegetation indices to drought over two tallgrass prairie sites. ISPRS J. Photogramm. Remote Sens. 2015, 108, 151–160. [Google Scholar] [CrossRef]
- Vicente-Serrano, S.M.; Beguería, S.; Lorenzo-Lacruz, J.; Julio, J.; López-Moreno, J.I.; Azorín-Molina, C.; Revuelto, J.; Sánchez-Lorenzo, A. Análisis Comparativo de Diferentes Índices de Sequía para Aplicaciones Ecológicas, Agrícolas e Hidrológicas; Asociación Española de Climatología (AEC): Salamanca, Spain, 2012; pp. 679–690.
- Hayes, M.J. Drought indices. Intermt. West Clim. Summ. 2007, 3, 2–6. [Google Scholar]
- McKee, T.B.; Doesken, N.J.; Kleist, J. The Relationship of Drought Frequency and Duration to Time Scales; American Meteorological Society: Anaheim, CA, USA, 1993; p. 6. [Google Scholar]
- Palmer, W. Meteorological Drought; Research Paper; U.S. Weather Bureau: Washington, DC, USA, 1965; p. 65.
- Tsakiris, G.; Vangelis, H. Establishing a drought index incorporating evapotranspiration. Eur. Water 2005, 9, 3–11. [Google Scholar]
- Tsakiris, G.; Pangalou, D.; Vangelis, H. Regional drought assessment based on the Reconnaissance Drought Index (RDI). Water Resour. Manag. 2007, 21, 821–833. [Google Scholar] [CrossRef]
- Vicente-Serrano, S.M.; Beguería, S.; López-Moreno, J.I. A multiscalar drought index sensitive to global warming: The standardized precipitation evapotranspiration index. J. Clim. 2010, 23, 1696–1718. [Google Scholar] [CrossRef]
- Nalbantis, I.; Tsakiris, G. Assessment of hydrological drought revisited. Water Resour. Manag. 2009, 23, 881–897. [Google Scholar] [CrossRef]
- Onyutha, C. On rigorous drought assessment using daily time scale: Non-stationary frequency analyses, revisited concepts, and a new method to yield non-parametric indices. Hydrology 2017, 4, 48. [Google Scholar] [CrossRef]
- Chow, V.T. Handbook of Applied Hydrology; McGraw Hill: New York, NY, USA, 1964. [Google Scholar]
- World Meteorological Organization. Guide to Hydrological Practices, 6th ed.; WMO: Geneva, Switzerland, 2008; ISBN 978-92-63-10168-6. [Google Scholar]
- Dalezios, N.R.; Loukas, A.; Vasiliades, L.; Liakopoulos, E. Severity-duration-frequency analysis of droughts and wet periods in Greece. Hydrol. Sci. J. 2000, 45, 751–769. [Google Scholar] [CrossRef]
- Todisco, F.; Mannocchi, F.; Vergni, L. Severity–duration–frequency curves in the mitigation of drought impact: An agricultural case study. Nat. Hazards 2013, 65, 1863–1881. [Google Scholar] [CrossRef]
- Janga Reddy, M.; Ganguli, P. Application of copulas for derivation of drought severity–duration–frequency curves. Hydrol. Process. 2012, 26, 1672–1685. [Google Scholar] [CrossRef]
- Halwatura, D.; Lechner, A.M.; Arnold, S. Drought severity–duration–frequency curves: A foundation for risk assessment and planning tool for ecosystem establishment in post-mining landscapes. Hydrol. Earth Syst. Sci. 2015, 19, 1069–1091. [Google Scholar] [CrossRef]
- Rahmat, S.; Jayasuriya, N.; Bhuiyan, M. Development of drought severity–duration–frequency curves in Victoria, Australia. Austral. J. Water Resour. 2015, 19. [Google Scholar] [CrossRef]
- Saghafian, B.; Shokoohi, A.; Raziei, T. Drought spatial analysis and development of severity–duration–frequency curves for an arid region. In Hydrology of the Mediterranean and Semiarid Regions; IAHS Publ.: Montpellier, France, 2003; Volume 278, pp. 305–311. [Google Scholar]
- Yoo, C.; Kim, D.; Kim, T.-W.; Hwang, K.-N. Quantification of drought using a rectangular pulses Poisson process model. J. Hydrol. 2008, 355, 34–48. [Google Scholar] [CrossRef]
- Vicente-Serrano, S.M. Spatial and temporal analysis of droughts in the Iberian Peninsula (1910–2000). Hydrol. Sci. J. 2006, 51, 83–97. [Google Scholar] [CrossRef]
- Zhu, G.; Yang, L.; Qin, D.; Tong, H.; Liu, Y.; Li, J. Spatial and temporal variation of drought index in a typical steep alpine terrain in Hengduan Mountains. J. Mt. Sci. 2016, 13, 1186–1199. [Google Scholar] [CrossRef]
- Ayantobo, O.O.; Li, Y.; Song, S.; Yao, N. Spatial comparability of drought characteristics and related return periods in mainland China over 1961–2013. J. Hydrol. 2017, 550, 549–567. [Google Scholar] [CrossRef]
- Instituto de Hidrología, Meteorología y Estudios Ambientales (IDEAM). Zonificación y Codificación de Unidades Hidrográficas e Hidrogeológicas de Colombia; IDEAM: Bogotá, Colombia, 2013.
- Guzmán, D.; Ruiz, J.F.; Cadena, M. Regionalización de Colombia Según la Estacionalidad de la Precipitación Media Mensual, a Través de Análisis de Componentes Principales (ACP); Instituto de Hidrología, Meteorología y Estudios Ambientales (IDEAM): Bogotá, Colombia, 2014.
- Bates, B.C.; Chandler, R.E.; Bowman, A.W. Trend estimation and change point detection in individual climatic series using flexible regression methods: Trend and Change Point Detection. J. Geophys. Res. Atmos. 2012, 117. [Google Scholar] [CrossRef]
- Salarijazi, M. Trend and change-point detection for the annual stream-flow series of the Karun River at the Ahvaz hydrometric station. Afr. J. Agric. Res. 2012, 7. [Google Scholar] [CrossRef]
- Vezzoli, R.; Pecora, S.; Zenoni, E.; Tonelli, F. Data analysis to detect inhomogeneity, change points, trends in observations: an application to Po river discharge extremes. SSRN Electron. J. 2012. [Google Scholar] [CrossRef]
- Yerdelen, C. Change point of river stream OW in Turkey. Sci. Iran. 2014, 21, 306–317. [Google Scholar]
- Instituto de Hidrología, Meteorología y Estudios Ambientales (IDEAM). Estudio Nacional del Agua 2014; IDEAM: Bogotá, Colombia, 2015; ISBN 978-958-8067-70-4.
- Yevjevich, V. An objective approach to definitions and investigations of continental hydrologic droughts. J. Hydrol. 1969, 7, 353. [Google Scholar] [CrossRef]
- Chang, J.; Li, Y.; Wang, Y.; Yuan, M. Copula-based drought risk assessment combined with an integrated index in the Wei River Basin, China. J. Hydrol. 2016, 540, 824–834. [Google Scholar] [CrossRef]
- U.S. Geological Survey (USGS). 3sec GRID: Void-Filled DEM; USGS: Reston, VA, USA, 2013.
- Gibbs, W.J.; Maher, J.V. Rainfall Deciles as Drought Indicators; Bulletin; Commonwealth Bureau of Meteorology: Melbourne, Australia, 1967; p. 84.
- Hurtado, G.; Cadena, M. Aplicación de índices de sequía en Colombia. Meteorol. Colomb. 2002, 5, 131–137. [Google Scholar]
- Morid, S.; Smakhtin, V.; Moghaddasi, M. Comparison of seven meteorological indices for drought monitoring in Iran. Int. J. Climatol. 2006, 26, 971–985. [Google Scholar] [CrossRef]
- Quiring, S.M. Developing objective operational definitions for monitoring drought. J. Appl. Meteorol. Climatol. 2009, 48, 1217–1229. [Google Scholar] [CrossRef]
- Quiring, S.M. Monitoring drought: An evaluation of meteorological drought indices. Geogr. Compass 2009, 3, 64–88. [Google Scholar] [CrossRef]
- Nikbakht, J.; Tabari, H.; Talaee, P.H. Streamflow drought severity analysis by percent of normal index (PNI) in northwest Iran. Theor. Appl. Climatol. 2013, 112, 565–573. [Google Scholar] [CrossRef]
- Gocic, M.; Trajkovic, S. Spatiotemporal characteristics of drought in Serbia. J. Hydrol. 2014, 510, 110–123. [Google Scholar] [CrossRef]
- Komuscu, A.U. Using the SPI to analyze spatial and temporal patterns of drought in Turkey. Drought Netw. News (1994–2001) 1999, 11, 8. [Google Scholar]
- Agnew, C.T. Using the SPI to identify drought. Drought Netw. News (1994–2001) 2000, 12, 8. [Google Scholar]
- Livada, I.; Assimakopoulos, V.D. Spatial and temporal analysis of drought in Greece using the Standardized Precipitation Index (SPI). Theor. Appl. Climatol. 2007, 89, 143–153. [Google Scholar] [CrossRef]
- Łabędzki, L. Estimation of local drought frequency in central Poland using the standardized precipitation index SPI. Irrig. Drain. 2007, 56, 67–77. [Google Scholar] [CrossRef]
- Chortaria, C.; Karavitis, C.A.; Alexandris, S. Development of the SPI Drought Index for Greece Using Geo-Statistical Methods; Republic of Macedonia: Ohrid, Republic of Macedonia, 2010; pp. 1–11. [Google Scholar]
- Belayneh, A.; Adamowski, J.; Khalil, B.; Ozga-Zielinski, B. Long-term SPI drought forecasting in the Awash River Basin in Ethiopia using wavelet neural network and wavelet support vector regression models. J. Hydrol. 2014, 508, 418–429. [Google Scholar] [CrossRef]
- Seiler, R.A.; Hayes, M.; Bressan, L. Using the standardized precipitation index for flood risk monitoring. Int. J. Climatol. 2002, 22, 1365–1376. [Google Scholar] [CrossRef]
- Rouault, M.; Richard, Y. Intensity and spatial extension of drought in South Africa at different time scales. Water SA 2004, 29, 489–500. [Google Scholar] [CrossRef]
- Vicente-Serrano, S.M.; Lopez-Moreno, J.I. Hydrological response to different time scales of climatological drought: An evaluation of the Standardized Precipitation Index in a mountainous Mediterranean basin. Hydrol. Earth Syst. Sci. 2005, 9, 523–533. [Google Scholar] [CrossRef]
- Vicente-Serrano, S.M.; Cuadrat-Prats, J.M.; Romo, A. Early prediction of crop production using drought indices at different time-scales and remote sensing data: Application in the Ebro Valley (north-east Spain). Int. J. Remote Sens. 2006, 27, 511–518. [Google Scholar] [CrossRef]
- Pasho, E.; Camarero, J.J.; de Luis, M.; Vicente-Serrano, S.M. Impacts of drought at different time scales on forest growth across a wide climatic gradient in north-eastern Spain. Agric. For. Meteorol. 2011, 151, 1800–1811. [Google Scholar] [CrossRef]
- Potop, V.; Možný, M.; Soukup, J. Drought evolution at various time scales in the lowland regions and their impact on vegetable crops in the Czech Republic. Agric. For. Meteorol. 2012, 156, 121–133. [Google Scholar] [CrossRef]
- Sakamoto, C.M. The Z-index as a variable for crop yield estimation. Agric. Meteorol. 1978, 19, 305–313. [Google Scholar] [CrossRef]
- Karl, T.R. The sensitivity of the Palmer drought severity index and Palmer’s Z-index to their calibration coefficients including potential evapotranspiration. J. Appl. Meteorol. Climatol. 1986, 25, 77–86. [Google Scholar] [CrossRef]
- Loukas, A.; Vasiliades, L.; Dalezios, N.R. Hydroclimatic variability of regional droughts in greece using the Palmer Moisture Anomaly index. Hydrol. Res. 2002, 33, 425–442. [Google Scholar] [CrossRef]
- Guttman, N.B.; Wallis, J.R.; Hosking, J.R.M. Spatial comparability of the Palmer drought severity index. J. Am. Water Resour. Assoc. 1992, 28, 1111–1119. [Google Scholar] [CrossRef]
- Briffa, K.R.; Jones, P.D.; Hulme, M. Summer moisture variability across Europe, 1892–1991: An analysis based on the palmer drought severity index. Int. J. Climatol. 1994, 14, 475–506. [Google Scholar] [CrossRef]
- Guttman, N.B. Comparing the palmer drought index and the standarized precipitation index. J. Am. Water Resour. Assoc. 1998, 34, 113–121. [Google Scholar] [CrossRef]
- Lohani, V.K.; Loganathan, G.V.; Mostaghimi, S. Long-term analysis and short-term forecasting of dry spells by Palmer Drought Severity Index. Hydrol. Res. 1998, 29, 21–40. [Google Scholar] [CrossRef]
- Hu, Q.; Willson, G.D. Effects of temperature anomalies on the Palmer Drought Severity Index in the central United States. Int. J. Climatol. 2000, 20, 1899–1911. [Google Scholar] [CrossRef]
- Dai, A.; Trenberth, K.E.; Qian, T. A global dataset of Palmer Drought Severity index for 1870–2002: relationship with soil moisture and effects of surface warming. J. Hydrometeorol. 2004, 5, 1117–1130. [Google Scholar] [CrossRef]
- Li, J.; Chen, F.; Cook, E.R.; Gou, X.; Zhang, Y. Drought reconstruction for North Central China from tree rings: The value of the Palmer drought severity index. Int. J. Climatol. 2007, 27, 903–909. [Google Scholar] [CrossRef]
- Dai, A. Characteristics and trends in various forms of the Palmer Drought Severity Index during 1900–2008. J. Geophys. Res. 2011, 116. [Google Scholar] [CrossRef]
- Pashiardis, S.; Michaelides, S. Implementation of the standardized precipitation index (SPI) and the reconnaissance drought index (RDI) for regional drought assessment: A case study for Cyprus. Eur. Water 2008, 23–24, 57–65. [Google Scholar]
- Vangelis, H.; Tigkas, D.; Tsakiris, G. The effect of PET method on Reconnaissance Drought Index (RDI) calculation. J. Arid Environ. 2013, 88, 130–140. [Google Scholar] [CrossRef]
- Kousari, M.R.; Dastorani, M.T.; Niazi, Y.; Soheili, E.; Hayatzadeh, M.; Chezgi, J. Trend Detection of Drought in Arid and Semi-Arid Regions of Iran Based on Implementation of Reconnaissance Drought Index (RDI) and Application of Non-Parametrical Statistical Method. Water Resour. Manag. 2014, 28, 1857–1872. [Google Scholar] [CrossRef]
- Nalbantis, I. Evaluation of a Hydrological Drought Index. Eur. Water 2008, 23–24, 67–77. [Google Scholar]
- Dehghani, M.; Saghafian, B.; Nasiri Saleh, F.; Farokhnia, A.; Noori, R. Uncertainty analysis of streamflow drought forecast using artificial neural networks and Monte-Carlo simulation. Int. J. Climatol. 2014, 34, 1169–1180. [Google Scholar] [CrossRef]
- Tabari, H.; Nikbakht, J.; Hosseinzadeh Talaee, P. Hydrological drought assessment in Northwestern Iran based on streamflow drought index (SDI). Water Resour. Manag. 2013, 27, 137–151. [Google Scholar] [CrossRef]
- Hong, X.; Guo, S.; Zhou, Y.; Xiong, L. Uncertainties in assessing hydrological drought using streamflow drought index for the upper Yangtze River basin. Stoch. Environ. Res. Risk Assess. 2015, 29, 1235–1247. [Google Scholar] [CrossRef]
- Chair in Statistical Hydrology. INRS-ETE HYFRAN; Chaire Indusrielle Hydro-Québec/CRSNG en Hydrologie Statistique/Institut National de la Recherche Scientifique (INRS)/Centre Eau, Terre et Environnement: Montréal, QC, Canada, 2002. [Google Scholar]
- Aboodi, A.H.A. Probability analysis of extreme monthly rainfall in Baghdad city, middle of Iraq. Basrah J. Eng. Sci. 2014, 14, 1–12. [Google Scholar]
- Dawood, A.S. Probability analysis of extreme monthly rainfall in Mosul City, North of Iraq. March Bull. 2009, 4, 60–74. [Google Scholar]
- Restle, E.M.; El Adlouni, S.; Bobée, B.; Ouarda, T.B. Le Test GPD et son Implémentation Dans le Logiciel HYFRAN PRO; Chaire Indusrielle Hydro-Québec/CRSNG en Hydrologie Statistique/Institut National de la Recherche Scientifique (INRS)/Centre Eau, Terre et Environnement: Montréal, QC, Canada, 2004; p. 47. [Google Scholar]
- Bobée, B.; Des Groseilliers, L. Ajustement des Distributions Pearson Type 3, Gamma, Gamma Généralisée, Log-Pearson Type 3 et Log-Gamma; INRS-Eau, Université du Québec: Montréal, QC, Canada, 1985; p. 154. [Google Scholar]
- Paria Christ Jesus Barriga; Lima Hernani Mota. O uso de Geotêxtil para o Controle de Drenagem de Água de Superfície—A Solução Utilizada para Fechamento Adequado de uma Pilha Estéril; Associação Brasileira de Mecânica dos Solos e Engenharia Geotécnica (ABMS): Belo Horizonte, Brasil, 2016. [Google Scholar]
- Perreault, L.; Bobée, B.; Legendre, P. Rapport Général du Logiciel AJUSTE II: Théorie et Application; INRS-Eau, Université du Québec: Montréal, QC, Canada, 1994; p. 102. [Google Scholar]
- El Adlouni, S.; Bobée, B. Analyse Fréquentielle avec le Logiciel HYFRAN-PLUS; Chaire Indusrielle Hydro-Québec/CRSNG en Hydrologie Statistique/Institut National de la Recherche Scientifique (INRS)/Centre Eau, Terre et Environnement: Montréal, QC, Canada, 2014; p. 71. [Google Scholar]
- El Adlouni, S.; Bobée, B. Hydrological Frequency Analysis Using HYFRAN-PLUS Software; Chaire Indusrielle Hydro-Québec/CRSNG en Hydrologie Statistique/Institut National de la Recherche Scientifique (INRS)/Centre Eau, Terre et Environnement: Montréal, QC, Canada, 2015; p. 71. [Google Scholar]
- Bobée, B.; El Adlouni, S. Éléments Théoriques d’Analyse Fréquentielle Utilisation du Logiciel Hyfran-Plus; Chaire Indusrielle Hydro-Québec/CRSNG en Hydrologie Statistique/Institut National de la Recherche Scientifique (INRS)/Centre Eau, Terre et Environnement: Montréal, QC, Canada, 2015; p. 77. [Google Scholar]
- Ware, C.; Knight, W.; Wells, D. Memory intensive statistical algorithms for multibeam bathymetric data. Comput. Geosci. 1991, 17, 985–993. [Google Scholar] [CrossRef]


| No. | Station Name | Code | Type | Measured Parameters | Period | Statistics | ||||||||
|---|---|---|---|---|---|---|---|---|---|---|---|---|---|---|
| R. | T. | S. | From | To | CV R. | Skewness R. | CV T. | Skewness T. | CV S. | Skewness S. | ||||
| 1 | BASE AEREA MELGAR | 21195080 | CO | X | X | - | 03–73 | 12–11 | 0.7093 | 0.9385 | 0.1020 | −0.4878 | - | - |
| 2 | PANDI | 21195060 | CO | X | X | - | 07–89 | 12–15 | 0.6648 | 1.0294 | 0.0360 | 0.4917 | - | - |
| 3 | PENAS BLANCAS | 21195110 | CO | X | X | - | 01–81 | 10–15 | 0.5857 | 0.8475 | 0.0398 | −0.9395 | - | - |
| 4 | ITA VALSALICE | 21195120 | CO | X | X | - | 04–80 | 03–16 | 0.6459 | 0.8629 | 0.0387 | 0.5289 | - | - |
| 5 | SALERO EL | 21190300 | PM | X | - | - | 11–71 | 04–12 | 0.8425 | 1.4193 | - | - | - | - |
| 6 | CARMEN DE APICALA | 21190290 | PM | X | - | - | 02–72 | 09–15 | 0.6728 | 0.7414 | - | - | - | - |
| 7 | GRANJA LA HDA | 21190410 | PM | X | - | - | 01–83 | 09–15 | 0.6933 | 0.8530 | - | - | - | - |
| 8 | PLAYA LA | 21190080 | PM | X | - | - | 06–55 | 05–71 | 0.7230 | 1.0027 | - | - | - | - |
| 9 | OSPINA PEREZ | 21190240 | PM | X | - | - | 02–72 | 05–16 | 0.6032 | 1.1078 | - | - | - | - |
| 10 | CABRERA | 21190090 | PM | X | - | - | 10–58 | 04–16 | 0.6599 | 1.5539 | - | - | - | - |
| 11 | BATAN | 21190460 | PM | X | - | - | 01–98 | 04–16 | 0.6040 | 1.2519 | - | - | - | - |
| 12 | TULCAN EL | 21190350 | PM | X | - | - | 03–81 | 04–16 | 0.7704 | 1.6815 | - | - | - | - |
| 13 | PINAR EL | 21190310 | PM | X | - | - | 08–80 | 06–16 | 0.6399 | 1.0388 | - | - | - | - |
| 14 | SAN JUAN | 21190270 | PM | X | - | - | 01–81 | 04–16 | 0.7041 | 1.2771 | - | - | - | - |
| 15 | QUEBRADA NEGRA | 21190340 | PM | X | - | - | 01–81 | 07–88 | 0.6357 | 1.1452 | - | - | - | - |
| 16 | NILO | 21190210 | PM | X | - | - | 02–72 | 10–15 | 0.8584 | 2.5707 | - | - | - | - |
| 17 | NUNEZ | 21190330 | PM | X | - | - | 01–81 | 04–16 | 0.5425 | 1.2244 | - | - | - | - |
| 18 | TIBACUY | 21190250 | PM | X | - | - | 01–52 | 04–89 | 0.7110 | 1.1264 | - | - | - | - |
| 19 | ITUC | 21195130 | PM | X | - | - | 10–89 | 01–93 | 0.7825 | 1.3351 | - | - | - | - |
| 20 | PROFUNDO EL AUTOMATICA | 21197010 | LM | - | - | X | 01–59 | 12–13 | - | - | - | - | 0.6568 | 1.0209 |
| 21 | MELGAR | 21197100 | LG | - | - | X | 01–73 | 12–84 | - | - | - | - | 0.6742 | 1.0134 |
| 22 | PLAYA LA | 21197030 | LG | - | - | X | 01–59 | 12–14 | - | - | - | - | 0.6219 | 1.1115 |
| 23 | LIMONAR EL | 21197150 | LG | - | - | X | 01–65 | 12–14 | - | - | - | - | 0.7106 | 1.6598 |
| 24 | DOS MIL | 21197090 | LM | - | - | X | 01–59 | 12–01 | - | - | - | - | 0.6734 | 1.0219 |
| No. | Station Name | Code | Type | Measured Parameters | Period | Statistics | ||||||||
|---|---|---|---|---|---|---|---|---|---|---|---|---|---|---|
| R. | T. | S. | From | To | CV R. | Skewness R. | CV T. | Skewness T. | CV S. | Skewness S. | ||||
| 1 | VIVERO SURATA | 23195090 | CO | X | X | - | 09–68 | 07–16 | 0.7767 | 0.9615 | 0.0331 | 0.7549 | - | - |
| 2 | LLANO GRANDE | 23195110 | CO | X | X | - | 07–71 | 07–16 | 0.6388 | 1.2136 | 0.0341 | −0.3363 | - | - |
| 3 | ESC AGR CACHIRA | 23195180 | CO | X | X | - | 04–72 | 08–16 | 0.8049 | 1.0455 | 0.0477 | 0.1358 | - | - |
| 4 | CACHIRI | 23195200 | CO | X | X | - | 06–71 | 05–16 | 0.8896 | 1.1363 | 0.0417 | 0.0543 | - | - |
| 5 | SABANA DE TORRES | 23195120 | CO | X | X | - | 08–66 | 12–70 | 0.5556 | 0.2137 | 0.0197 | 0.7474 | - | - |
| 6 | PROVINCIA | 23195170 | CO | X | X | - | 02–77 | 04–16 | 0.6563 | 0.5378 | 0.0265 | 0.4871 | - | - |
| 7 | URBINA LA | 23195080 | CO | X | X | - | 05–68 | 12–79 | 0.6310 | 0.7100 | 0.0421 | 0.1230 | - | - |
| 8 | URBINA LA | 23197030 | LG | - | - | X | 01–73 | 12–79 | - | - | - | - | 0.5842 | 1.4227 |
| 9 | CAFE MADRID | 23197290 | LG | - | - | X | 01–65 | 05–10 | - | - | - | - | 0.5213 | 1.5926 |
| 10 | ANGOSTURAS | 23197400 | LG | - | - | X | 01–65 | 08–10 | - | - | - | - | 0.4969 | 1.5857 |
| 11 | SAN RAFAEL | 23197370 | LM | - | - | X | 01–65 | 12–14 | - | - | - | - | 0.5282 | 1.3820 |
| 12 | LIBANO EL | 23190110 | PM | X | - | - | 01–77 | 03–16 | 0.6582 | 0.7326 | - | - | - | - |
| 13 | MATANZA | 23190120 | PM | X | - | - | 06–58 | 09–71 | 0.7654 | 1.0145 | - | - | - | - |
| 14 | PLAYON EL | 23190140 | PM | X | - | - | 06–58 | 08–16 | 0.5857 | 1.0952 | - | - | - | - |
| 15 | VETAS | 23190160 | PM | X | - | - | 08–58 | 07–72 | 0.7889 | 1.0108 | - | - | - | - |
| 16 | MAGARA | 23190210 | PM | X | - | - | 12–89 | 04–16 | 0.7003 | 0.4784 | - | - | - | - |
| 17 | CAMPOHERMOSO | 23190250 | PM | X | - | - | 11–65 | 11–77 | 0.6226 | 0.4080 | - | - | - | - |
| 18 | LIMONCITO | 23190270 | PM | X | - | - | 06–67 | 08–73 | 0.4956 | 0.9217 | - | - | - | - |
| 19 | PICACHO EL | 23190300 | PM | X | - | - | 07–67 | 07–16 | 0.7411 | 0.8850 | - | - | - | - |
| 20 | MATAJIRA | 23190340 | PM | X | - | - | 11–67 | 07–16 | 0.7442 | 1.6528 | - | - | - | - |
| 21 | PORTACHUELO | 23190360 | PM | X | - | - | 11–67 | 07–16 | 0.5547 | 1.0397 | - | - | - | - |
| 22 | GALVICIA LA | 23190400 | PM | X | - | - | 01–68 | 04–16 | 0.5413 | 0.8942 | - | - | - | - |
| 23 | NORMA LA | 23190420 | PM | X | - | - | 11–74 | 03–88 | 0.7503 | 0.7900 | - | - | - | - |
| 24 | NARANJO EL | 23190440 | PM | X | - | - | 05–71 | 07–16 | 0.7525 | 1.6759 | - | - | - | - |
| 25 | VETAS-EL POZO | 23190450 | PM | X | - | - | 05–71 | 07–16 | 0.8456 | 1.1779 | - | - | - | - |
| 26 | PAPAYAL | 23190460 | PM | X | - | - | 06–71 | 09–02 | 0.7121 | 0.5574 | - | - | - | - |
| 27 | PALMERAS HDA | 23190470 | PM | X | - | - | 06–71 | 07–78 | 0.7166 | 0.9898 | - | - | - | - |
| 28 | SAN ALBERTO | 23190500 | PM | X | - | - | 07–71 | 03–16 | 0.6553 | 0.6490 | - | - | - | - |
| 29 | CAOBO EL | 23190510 | PM | X | - | - | 01–73 | 03–16 | 0.6496 | 0.9153 | - | - | - | - |
| 30 | DORADA LA | 23190520 | PM | X | - | - | 11–71 | 03–16 | 0.7367 | 1.3824 | - | - | - | - |
| 31 | COOPERATIVA LA | 23190530 | PM | X | - | - | 01–74 | 01–99 | 0.6849 | 0.7337 | - | - | - | - |
| 32 | VEGA LA | 23190540 | PM | X | - | - | 08–76 | 05–16 | 0.7716 | 1.3418 | - | - | - | - |
| 33 | SAN RAFAEL | 23190560 | PM | X | - | - | 12–76 | 04–16 | 0.6870 | 0.5405 | - | - | - | - |
| 34 | PANTANO EL | 23190600 | PM | X | - | - | 11–67 | 07–16 | 0.6660 | 0.9824 | - | - | - | - |
| 35 | BARRANCA LEBRIJA | 23190710 | PM | X | - | - | 10–83 | 03–16 | 0.8512 | 0.7684 | - | - | - | - |
| 36 | PLANES LOS | 23190810 | PM | X | - | - | 12–84 | 03–16 | 0.5779 | 0.7746 | - | - | - | - |
| 37 | PLANTA ELECTRICA | 23190100 | PM | X | - | - | 06–58 | 08–71 | 0.5710 | 0.8036 | - | - | - | - |
| 38 | TONA | 23190130 | PM | X | - | - | 06–58 | 07–16 | 0.9170 | 1.6652 | - | - | - | - |
| 39 | ESC AGROPECUARIA | 23190150 | PM | X | - | - | 06–58 | 11–72 | 0.8724 | 1.3314 | - | - | - | - |
| 40 | CACHIRI | 23190200 | PM | X | - | - | 11–59 | 07–72 | 0.9190 | 1.3245 | - | - | - | - |
| 41 | LAGUNA LA | 23190260 | PM | X | - | - | 06–67 | 07–16 | 0.6253 | 1.0003 | - | - | - | - |
| 42 | PALO GORDO | 23190280 | PM | X | - | - | 06–67 | 07–16 | 0.6971 | 1.2884 | - | - | - | - |
| 43 | SAN IGNACIO | 23190310 | PM | X | - | - | 09–67 | 09–71 | 0.4838 | 0.2398 | - | - | - | - |
| 44 | LLANO DE PALMAS | 23190350 | PM | X | - | - | 11–67 | 07–16 | 0.6477 | 1.2548 | - | - | - | - |
| 45 | PALMAS | 23190380 | PM | X | - | - | 11–67 | 07–16 | 0.7315 | 1.9992 | - | - | - | - |
| Drought Indices | |
|---|---|
| Meteorological Drought | PN, SPI1, SPI3, Z |
| Agricultural Drought | SPI6, PDSI, RDI |
| Hydrological Drought | SPI9, PHDI, SDI |
| SRB | LRB | |||||||
|---|---|---|---|---|---|---|---|---|
| DI | Statistic | S (-) | D (Months) | I (-/Month) | S (-) | D (Months) | I (-/Month) | |
| Meteorological Drought | PN | Count | 73 | 81 | ||||
| Mean | 1.4039 | 2.3135 | 0.6215 | 1.3001 | 2.2197 | 0.5933 | ||
| Variance | 0.4065 | 1.3550 | 0.0144 | 0.2371 | 0.7549 | 0.0080 | ||
| SPI1 | Count | 72 | 80 | |||||
| Mean | –1.7762 | 2.0319 | –0.8372 | –1.7694 | 1.9900 | –0.8704 | ||
| Variance | 1.4105 | 1.0076 | 0.0551 | 0.7253 | 0.5793 | 0.0278 | ||
| Z | Count | 58 | 67 | |||||
| Mean | –3.4410 | 2.4220 | –1.3680 | –3.3505 | 2.2947 | –1.4666 | ||
| Variance | 6.7808 | 2.0277 | 0.2192 | 4.5467 | 1.4179 | 0.2550 | ||
| SPI3 | Count | 28 | 34 | |||||
| Mean | –3.7076 | 6.0000 | –0.5533 | –3.3767 | 5.8534 | –0.5343 | ||
| Variance | 7.9020 | 4.2672 | 0.0483 | 3.8572 | 2.4011 | 0.0366 | ||
| Agricultural Drought | SPI6 | Count | 16 | 20 | ||||
| Mean | –7.6286 | 12.8942 | –0.5294 | –6.0016 | 11.7824 | –0.4602 | ||
| Variance | 34.2660 | 18.2327 | 0.0421 | 18.2894 | 11.1559 | 0.0360 | ||
| PDSI | Count | 12 | 13 | |||||
| Mean | –32.5682 | 15.5806 | –1.8325 | –18.3403 | 10.9669 | –1.4075 | ||
| Variance | 471.3502 | 80.4588 | 0.4572 | 302.2755 | 64.1268 | 0.2605 | ||
| RDI | Count | 16 | 14 | |||||
| Mean | –10.4930 | 17.8989 | –0.5512 | –7.4902 | 12.9890 | –0.5266 | ||
| Variance | 32.3437 | 48.9207 | 0.0309 | 23.9745 | 21.3541 | 0.0521 | ||
| Hydrological Drought | SPI9 | Count | 15 | 12 | ||||
| Mean | –9.0822 | 18.3530 | –0.4405 | –9.7558 | 18.7969 | –0.4862 | ||
| Variance | 34.6455 | 28.3518 | 0.0412 | 33.2412 | 22.6491 | 0.0232 | ||
| PHDI | Count | 13 | 11 | |||||
| Mean | –40.0915 | 17.7421 | –2.2259 | –24.5365 | 12.8220 | –1.8297 | ||
| Variance | 349.5370 | 55.9322 | 0.1382 | 240.9521 | 44.4920 | 0.1201 | ||
| SDI | Count | 22 | 10 | |||||
| Mean | –11.7482 | 20.4533 | –0.4688 | 22.1519 | –11.9025 | –0.4161 | ||
| Variance | 129.4397 | 73.4869 | 0.0952 | 164.2914 | 201.1271 | 0.0567 | ||
| Durations | ||||||||||||
|---|---|---|---|---|---|---|---|---|---|---|---|---|
| PN | SPI1 | Z | SPI3 | SPI6 | PDSI | RDI | SPI9 | PHDI | SDI | |||
| Return Periods | PN | SRB | 0.8869 | 0.7053 | 0.4666 | |||||||
| LRB | 0.5940 | 0.1738 | 0.5050 | |||||||||
| SPI1 | SRB | 0.6032 | 0.6215 | 0.5746 | ||||||||
| LRB | 0.2064 | 0.3349 | 0.5245 | |||||||||
| Z | SRB | 0.3839 | 0.2098 | 0.4710 | ||||||||
| LRB | −0.1194 | 0.1844 | 0.4975 | |||||||||
| SPI3 | SRB | −0.0057 | 0.5109 | −0.0134 | 0.3159 | 0.1755 | 0.1799 | |||||
| LRB | 0.1454 | 0.4177 | 0.0046 | 0.5641 | 0.1554 | 0.2982 | ||||||
| SPI6 | SRB | 0.3607 | 0.8154 | 0.8214 | ||||||||
| LRB | 0.1247 | 0.1824 | 0.2630 | |||||||||
| PDSI | SRB | 0.2345 | −0.0600 | 0.6755 | ||||||||
| LRB | 0.0996 | 0.0700 | 0.1875 | |||||||||
| RDI | SRB | 0.5346 | 0.1305 | −0.03513 | ||||||||
| LRB | 0.8483 | 0.7020 | −0.1170 | |||||||||
| SPI9 | SRB | 0.6345 | 0.7419 | |||||||||
| LRB | 0.2175 | −0.0873 | ||||||||||
| PHDI | SRB | 0.3526 | 0.2286 | |||||||||
| LRB | −0.0992 | 0.6454 | ||||||||||
| SDI | SRB | 0.6691 | 0.4839 | |||||||||
| LRB | −0.1734 | −0.0844 | ||||||||||
| Duration | Frequency | |||
|---|---|---|---|---|
| SRB | LRB | SRB | LRB | |
| Meteorological Drought | 0.6210 | 0.4383 | 0.2815 | 0.1398 |
| 0.5296 | 0.2107 | |||
| Agricultural Drought | 0.4973 | 0.2751 | 0.1942 | 0.2879 |
| 0.3862 | 0.2410 | |||
| Hydrological Drought | 0.5350 | 0.2586 | 0.5019 | −0.1190 |
| 0.3968 | 0.1914 | |||
© 2018 by the authors. Licensee MDPI, Basel, Switzerland. This article is an open access article distributed under the terms and conditions of the Creative Commons Attribution (CC BY) license (http://creativecommons.org/licenses/by/4.0/).
Share and Cite
Torres Rojas, L.P.; Díaz-Granados, M. The Construction and Comparison of Regional Drought Severity-Duration-Frequency Curves in Two Colombian River Basins—Study of the Sumapaz and Lebrija Basins. Water 2018, 10, 1453. https://doi.org/10.3390/w10101453
Torres Rojas LP, Díaz-Granados M. The Construction and Comparison of Regional Drought Severity-Duration-Frequency Curves in Two Colombian River Basins—Study of the Sumapaz and Lebrija Basins. Water. 2018; 10(10):1453. https://doi.org/10.3390/w10101453
Chicago/Turabian StyleTorres Rojas, Laura Patricia, and Mario Díaz-Granados. 2018. "The Construction and Comparison of Regional Drought Severity-Duration-Frequency Curves in Two Colombian River Basins—Study of the Sumapaz and Lebrija Basins" Water 10, no. 10: 1453. https://doi.org/10.3390/w10101453
APA StyleTorres Rojas, L. P., & Díaz-Granados, M. (2018). The Construction and Comparison of Regional Drought Severity-Duration-Frequency Curves in Two Colombian River Basins—Study of the Sumapaz and Lebrija Basins. Water, 10(10), 1453. https://doi.org/10.3390/w10101453