Article

Potential Changes of Annual-Averaged Nutrient Export in the South Saskatchewan River Basin under Climate and Land-Use Change Scenarios

by
Luis Morales-Marín
*,†,
Howard Wheater
and
Karl-Erich Lindenschmidt
Global Institute for Water Security, School of Environment and Sustainability, University of Saskatchewan, 11 Innovation Boulevard , Saskatoon, SK S7N 3H5, Canada
*
Author to whom correspondence should be addressed.
These authors contributed equally to this work.
Water 2018, 10(10), 1438; https://doi.org/10.3390/w10101438
Submission received: 29 July 2018 / Revised: 24 September 2018 / Accepted: 29 September 2018 / Published: 12 October 2018
(This article belongs to the Special Issue Water Quality and Ecosystems in Times of Climate Change)

Abstract

:
Climate and land-use changes modify the physical functioning of river basins and, in particular, influence the transport of nutrients from land to water. In large-scale basins, where a variety of climates, topographies, soil types and land uses co-exist to form a highly heterogeneous environment, a more complex nutrient dynamic is imposed by climate and land-use changes. This is the case of the South Saskatchewan River (SSR) that, along with the North Saskatchewan River, forms one of the largest river systems in western Canada. The SPAtially Referenced Regression On Watershed (SPARROW) model is therefore implemented to assess water quality in the basin, in order to describe spatial and temporal patterns and identify those factors and processes that affect water quality. Forty-five climate and land-use change scenarios comprehended by five General Circulation Models (GCMs) and three Representative Concentration Pathways (RCPs) were incorporated into the model to explain how total nitrogen (TN) and total phosphorus (TP) export could vary across the basin in 30, 60 and 90 years from now. According to model results, annual averages of TN and TP export in the SSR are going to increase in the range 0.9–1.28 kg km 2 year 1 and 0.12–0.17 kg km 2 year 1 , respectively, by the end of the century, due to climate and land-use changes. Higher increases of TP compared to TN are expected since TP and TN are going to increase ∼36% and ∼21%, respectively, by the end of the century. This research will support management plans in order to mitigate nutrient export under future changes of climate and land use.

1. Introduction

Climate and land-use changes have important implications, not only for the hydrological functioning of river basins (e.g., [1,2]), but also for the nutrient dynamics (e.g., [3]). Whereas changes in precipitation and runoff may alter the mobility and the rate of solute dilution, increases of air temperature may affect the kinetics of chemical reactions in the transported substances. Whitehead et al. [4] showed that historical reductions of summer streamflows in the Thames River, UK, due to climate change, affected the dilution rate of phosphorus and thus increased its concentration. Similarly, Conlan et al. [5] concluded that more frequent and more severe summer stormflow events in recent decades substantially increased the discharge of nutrients and pollutants to UK rivers from combined sewer systems. Alterations of hydrological and nutrient dynamic processes due to climate change can lead to greater eutrophication and thus more frequent algae and cyanobacteria blooms, and depletion of oxygen [4].
Land-use changes have also affected the nutrient dynamics in river basins in recent decades. Since industrialization, nitrogen export in watersheds has increased by 3- to 20-fold in temperate developed areas due to human wastes, fertilizer applications and manure runoff from agricultural fields [6,7]. In temperate zones, changes in land use have increased the export of nutrients, particularly phosphorus, to lakes and rivers altering their water quality [8] and ecosystem productivity [9]. In western Canada, changes to agricultural management have included extensive use of zero till arable cultivation, which has reduced the delivery of sediment-associated phosphorus from fields, but increased dissolved phosphorus supply [10]. Despite the proven effects of climate and land-use changes on nutrient dynamics, the effects on nutrient exports in large river basins are poorly understood.
Our study case is the South Saskatchewan River (SSR) basin that, along with the North Saskatchewan River, is one of the largest basins in western Canada. Part of its importance is due to the fact that 80% of the Canadian agricultural crops are produced in this basin [11]. Recently, several studies have demonstrated that climate and land-use changes are affecting hydrological processes in the SSR basin (e.g., [11,12]). An analysis of seasonal precipitation and rain and snow dominated precipitation extremes in the Canadian Prairie Provinces using an multi-regional climate model ensemble yielded increases over nearly all of the study domain, except for seasonal precipitations whose changes were not statiscally significant [13]. Changes of streamflow between −32% and +12% in SSR headwater tributaries for the next decades could result in a decrease of up to 9% of downstream SSR discharges affecting water quality [14]. In the basin of the Oldman River (OR), one of the three main tributaries of the SSR, reductions in the snowpack and earlier snowmelt (e.g., [15]) have caused a 10% decrease in streamflows in the unregulated OR tributaries since 1949. As a consequence, lesser in-stream dilution and more pollutant sedimentation have been detected in the OR [16]. Although recent studies have inferred changes of water quality conditions as a consequence of probable reductions in SSR basin streamflows, an assessment of nutrient export changes in the SSR basin due to climate and land-use changes has not yet been performed.
Physically-based water quality models are commonly implemented to study the effects of climate and land-use changes on hydrological processes in river basins. Because of the amount of input information required and the computational resources needed for model calibration, physically-based and conceptual water quality models such as SWAT (Soil and Water Assessment Tool, [17]), HSPF (Hydrological Simulation Program-Fortran, [18]) and AGNPS (AGricultural Non-Point Source, [19]) are mostly implemented at local scales for relatively small and medium-sized watersheds with extensive data sources (e.g., [20]). In this study, the SPAtially Referenced Regression On Watershed (SPARROW) model [21], an empirically-based catchment model that integrates monitoring data with landscape information, is forced with climate and land-use change scenarios to estimate nutrient export changes in the SSR basin. SPARROW incorporates nonlinear physically-based functions from deterministic models in combination with statistical methods for model calibration, which make the model very suitable for nutrient transport estimations of large-scale basins. SPARROW has been extensively used to estimate annual averages of nutrient loads in large-scale basins including the Mississippi River basin (e.g., [22]), the SSR basin [23] and the Red-Assiniboine River basin [24].
The objective of this research paper is to model the impact of climate and land-use changes on the export of total phosphorus (TP) and total nitrogen (TN) in the SSR basin. To do this, changes in nutrient loads with respect to the baseline period (1975–2009) are computed for different land-use and climate change scenarios for the 2010–2039, 2040–2069 and 2070–2099 periods. An inter-comparison of nutrient load projections for different general circulation models (GCM) and carbon emission scenarios is also included. Sensitivities of future changes in climate and land-use variables on nutrient load estimates is analyzed. This research will support management plans to mitigate nutrient export under future changes of climate and land use in the SSR basin. Since SPARROW is a steady-state model, the implemented modelling approach does not consider the temporal dynamics of nutrient export (e.g., larger phosphorus export during wet years) but provides long-term averages of nutrient fluxes for specific time periods. Future work is suggested in the discussion section for further model developments to address certain limitations in the approach.

2. Materials and Methods

2.1. Study Site

The SSR, which joins the North Saskatchewan River to form the Saskatchewan River basin, is one of the largest river systems in western Canada (Figure 1). The SSR basin, consisting of the Red Deer River (RDR), the Bow River (BR), the Oldman River (OR) and the Lower SSR (LSSR), drains a surface area of approximately 168,600 km 2 . The SSR originates in the headwaters of the Rocky Mountains in southwestern Alberta and northern Montana, and flows across the Alberta and Saskatchewan prairies until it meets the North Saskatchewan River to form the Saskatchewan River, which ultimately drains into Lake Winnipeg. During fall and winter, the water in the basin is stored as snow and frozen soils exhibiting a classic cold region hydrology. Since one third of the annual precipitation occurs as snowfall, 80% of the annual runoff is produced by snowmelt during spring and early summer and most of the rainfall infiltrates and evaporates contributing little to summer runoff [12].

2.2. Calibration of the SPARROW Nutrient Export Model

TN and TP SPARROW models were calibrated for the 1975–2010 period to estimate annual-averaged nutrient loads using 142 flow and 126 water quality stations, respectively, for the SSR basin. Point waste-water discharges (represented in the model by population density), forested land, total fertilizer (manure and mineral fertilizer) and urbanized land represent nutrient source variables, while basin slope, precipitation, air temperature and soil permeability describe land-to-water delivery variables, which are statistically significant (p-value < 0.05) in the TN and TP SPARROW models (see Table 1). Since most of these landscape variables refer to the 2001 baseline year, the incompatibility of periods with nutrient load records is resolved in SPARROW by detrending the time series with respect to the base year. To detrend the time series, a simple function of time was fit and then subtracted from the original time series. The new time series do not include the dynamic factors causing trend and thus facilitate the estimation of annual average loads. In-stream nutrient decay and nutrient retention in reservoirs were also considered in the model calibration. Calibration performance was assessed by computing the root mean square error (RMSE), the coefficient of determination (R 2 ), and the R-square of the logarithm of contaminant yield (Yld R 2 ) based on annual averages of observed and simulated nutrient loads at the station locations. The percent RMSE for both models is approximately 47% (less than 60%, a threshold suggested by Schwartz et al. [25]); however, the R 2 and Yld R 2 were over 0.95 and 0.6, respectively, which demonstrates an acceptable model performance [21]. The calibrated models were used to estimate TN and TP loads and concentrations in 104,165 reaches and subbasins interconnected through the SSR river network. Further information about the model setup and calibration results are explained in [23].

2.3. Climate Change Scenarios

Climate change scenarios for precipitation and maximum and minimum air temperatures were obtained through the Pacific Climate Impacts Consortium (PCIC) website [26]. The PCIC data set consists of statistically downscaled and bias corrected (e.g., [27]) climate variables acquired from the output of Global Climate Model (GCM) projections contained in the coupled model intercomparison project phase 5 (CMIP5) [28] and from historical climate data for Canada [29]. Based on previously calibrated downscaled models for the period 1950–2005, the PCIC climate variables are simulated at daily time steps from 1950 to 2100. The data is then spatially interpolated on a 0.0833 degrees resolution grid (≈10 × 10 km) for all of Canada.
Three greenhouse gas concentration trajectories adopted by the IPCC are identified as Representative Concentration Pathways (RCPs) [30] and considered in this study: low emission scenario (RCP 2.6), mid-range emission scenario (RCP 4.5) and high emission scenario (RCP 8.5). Since the IPCC 2014 report [31] recommends using more than one GCM to obtain an appropriate range of climate variables to assess the impacts on a specific region, five different GCMs were considered: the Canadian Earth System Model (CanESM2), the Hadley Global Environment Model 2—Earth System (HadGEM2-ES), the Max Planck Institute Earth System Model running on low resolution grid (MPI-ESM-LR), the Geophysical Fluid Dynamics Laboratory Earth System Model (GFDL-ESM2G) and the Model for Interdisciplinary Research On Climate (MIROC5). These models were chosen based on previous analyses performed using Taylor diagrams by comparing the statistical properties of observed and GCM simulated precipitation for historical data in the provinces of Alberta, Saskatchewan and Manitoba.
Climate change could affect basin streamflows and nutrient transport in the future. As a common approach to predict approximate streamflows in river basins, hydrological models are calibrated and then forced with climate change scenarios. In a recent and comprehensive study, Tanzeeba and Gan [32] analyzed the potential hydrological impacts of climate change on the SSR basin using a physically-based distributed hydrological model. In this study, the implemented hydrological model was forced using downscaled climate projections of four different GCMs for four scenarios described in the Special Report on Emissions Scenarios (SRES) of the Intergovernmental Panel on Climate Change (IPCC4) [33]. A summary of the projected changes of the SSR streamflows at the basin outlets for each scenario and for the three future periods were obtained from Tanzeeba and Gan [32] and presented in Table 2. In this regard, the projected streamflow changes were estimated at the outlet of each upstream basin, and streamflow scenarios were set up by adjusting the streamflows calibrated in the SPARROW model with the area-weighted percent changes in each of the basins.

2.4. Land-Use Change Scenarios and Population Growth

According to the IPCC protocols, land classes are classified as forest, water, cropland, grassland, settlement and other-land (barren land, ice, rock and unclassified) [34]. Agricultural and Agri-Foods Canada (AAFC) has generated 30 m resolution land-use maps for 1990, 2000 and 2010 that cover an area of Canada encompassed by the UTM Zones 9–22 South of 60 North [35]. Based on these historical maps, the percentage of the area occupied by each land-use class within the SSR basin for 1990, 2000 and 2010 were computed as a first step to set up land-use change scenarios. Then, linear models were fitted to each of the 104,165 SPARROW model subbasins and to each land-use class to predict their occupied areas by 2025, 2055 and 2085 (middle years of the modeling periods 2010–2039, 2040–2069 and 2070–2099) assuming spatial heterogeneity. Finally, to create land-use change scenarios for the three modelling periods, the area occupied by each of the land uses in each of the model subbasins were modified according to the percentage changes for the future periods.
In accordance with future changes of land use, the human population in the SSR basin is expected to grow throughout this century. This growth was estimated based on the projections of population growth for Alberta and Saskatchewan stated in the Population Projections for Canada, Provinces and Territories (Catalogue no. 91-520-X) report produced by Statistics Canada [36]. This report contains short term projections from 2010 to 2036 of population growth at the scale of provinces and territories under low-, medium- and high-growth scenarios. According to the medium-growth M1 scenario, the populations in Alberta and Saskatchewan, between 2010 and 2036, are expected to grow by 29% and 15%, respectively. The projections of population growth for the other two future scenarios were estimated based on the rates of growth extracted from the report. Whereas the population in Alberta is expected to grow by 44% and 56% by 2055 and 2085, respectively, the population in Saskatchewan is predicted to grow by only 26% and 37% by 2055 and 2085, respectively.

2.5. Modeling Procedure

Based on the calibrated TN and TP SPARROW SSR models, simulations of annual averaged TN and TP loads were performed by forcing the models with 45 ( 5 G C M s × 3 R C P s × 3 p e r i o d s = 45 ) scenarios. Air temperature and precipitation projections were averaged for three periods of 30 years (2010–2039, 2040–2069 and 2070–2099) for each of the 15 climate data sets corresponding to five GCMs and three RCPs. Annual averages of runoff for each simulation period and each RCP were calculated and included within the modeling scenarios. Land-use scenarios and fertilizer supply amounts for each period were also included in the simulations. Other input data, such as river network topology, catchment topography (e.g., catchment slope) and soil permeability, required by SPARROW model were kept unchanged during the modeling periods. The SPARROW model was calibrated for the 1975–2010 period, and is hereafter considered as the reference period to compare with future nutrient changes.

3. Results

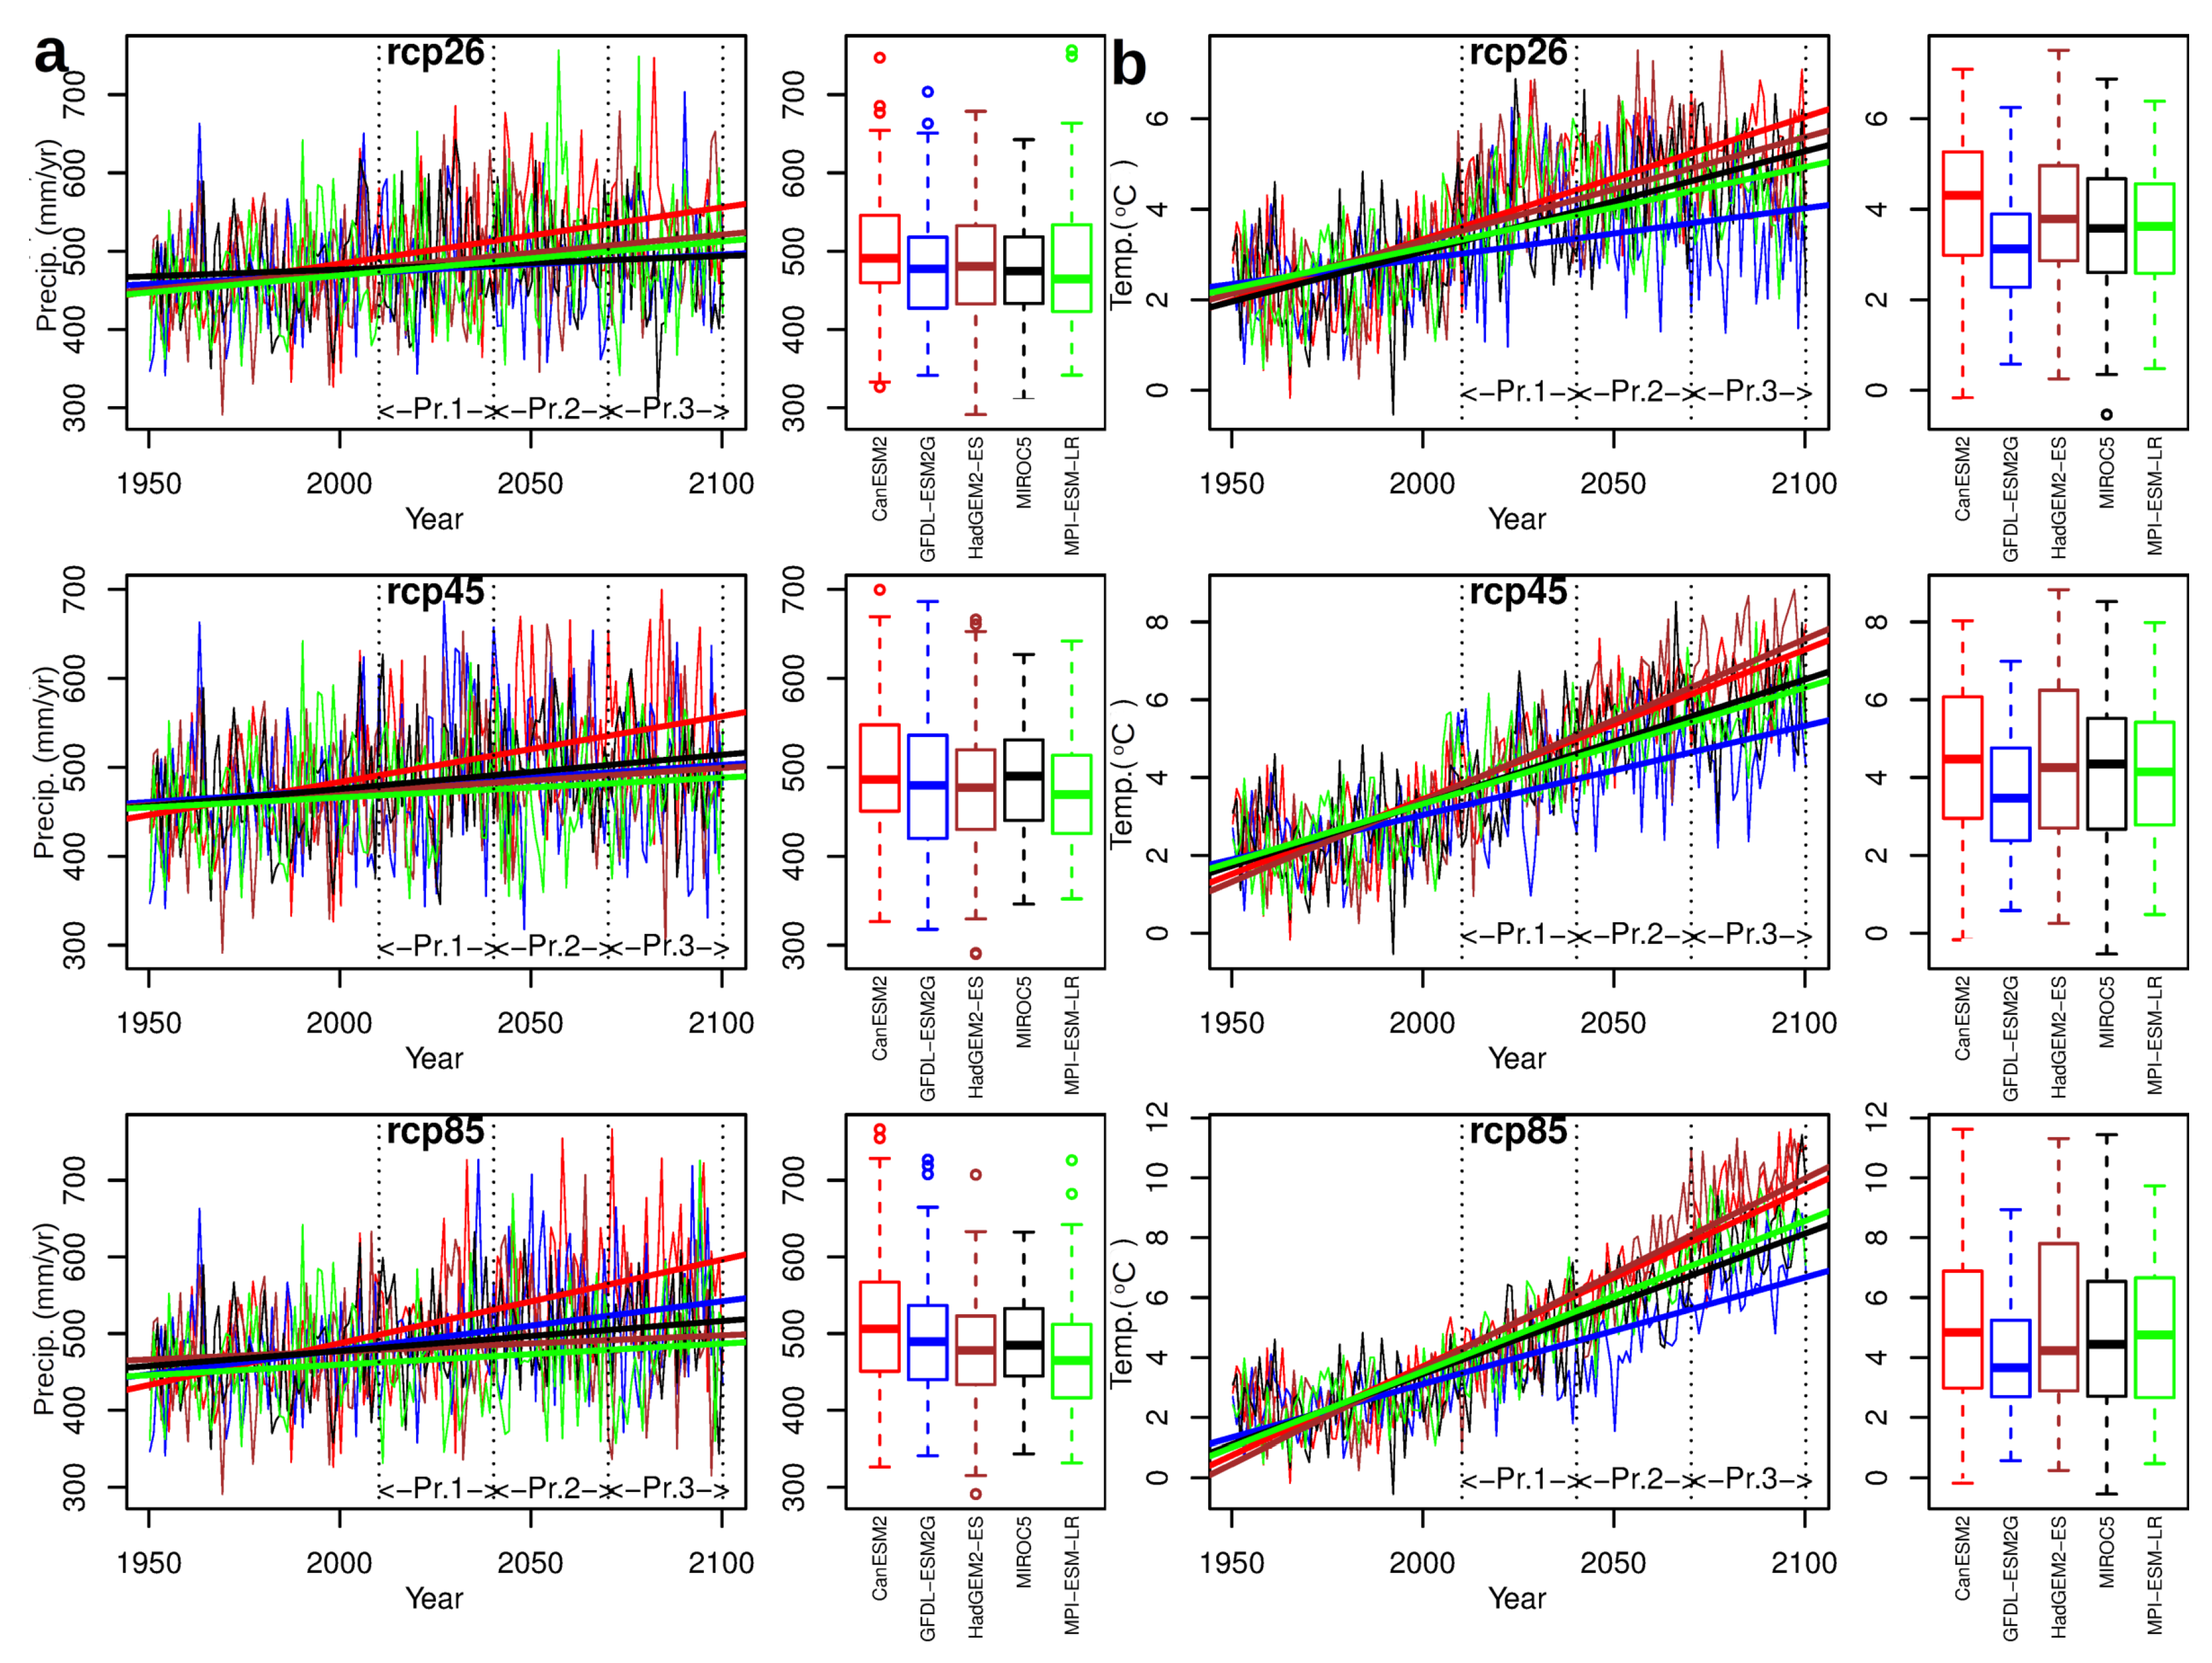
3.1. Analysis of Climate Change Scenarios

Spatially-averaged annual precipitation and mean air temperature data (estimated as the average of maximum and minimum air temperature data) for the SSR basin are shown in Figure 2a,b, respectively. Increases in precipitation and air temperature are more pronounced for the RCP 8.5 than for the RCP 2.6 scenario, which is probably related to higher carbon dioxide (CO 2 ) emissions expected under RCP 8.5 scenario. The intercomparison of GCM simulated climate data for each RCP scenario after 2005 shows significant discrepancies among GCMs predictions, where ranges are larger for the RCP 8.5 scenario. As can be observed in the figures, the variability of GCM precipitation and air temperature predictions increases with time and is more evident for air temperature. The intercomparison of GCM precipitation data also shows that CanESM2 is the model that predicts the highest precipitation and air temperature increase for all RCP scenarios. In contrast, the lowest precipitation and air temperature increases are simulated by the MPI-ESM-LR and GFDL-ESM2G models, respectively.
Changes in the PCIC annual precipitation and air temperature data for the modeled ongoing period, 2010–2039, and future periods, 2040–2069 and 2070–2099, with respect to the 1950–2009 reference period, were estimated. In general, substantial increases in both annual precipitation and air temperature are predicted by the GCMs during the first two future periods, but such increases tend to be less by the end of the century. According to the RCP 2.6 scenario, annual precipitation can increase between 1% and 9% during 2010–2039, between 0% and 17% during 2040–2069 and between 2% and 16% during 2070–2099. Similarly, annual precipitation under RCP 4.5 scenario can increase between 5% and 8% during 2010–2039, between 1% and 13% during 2040–2069 and between 3% and 17% during 2070–2099. Larger increases of up to 24% in precipitation by the end of the century and around 4% decreases of precipitation during the first future period are expected under the RCP 8.5 scenario.
Increases in air temperature during the three simulation periods are very significant. Positive trends of air temperature have been predicted by all GCM models and RCP scenarios except for RCP 2.6, where no incremental trends are predicted by some models after the second half of this century. According to the RCP 4.5 scenario, average air temperature could rise from 2.5 C to 7.1 C by the end of the century. Changes in temperature are still more dramatic according to RCP 8.5 because air temperature could increase from 2.5 C to 6.7 C and 8.7 C by the end of this century.

3.2. Future Changes of Nutrient Exports

Nutrient exports were estimated using SPARROW for each of the 45 climate and land-use change scenarios. The spatial average of upstream yields is defined as the total flux predicted to leave the reach divided by the upstream areas. Incremental yields are expressed as the total flux originating within a subbasin divided by the subbasin area. The in-stream nutrient concentration are shown in Figure 3 for TN and in Figure 4 for TP. In accordance with the climate change scenarios, the highest estimated changes of nutrient export are based on CanESM2 climate projections, whereas the lowest changes are based on MIROC5 and MPI-ESM-LR climate data. Although incremental trends of nutrient export are observed in most of the scenarios during the first two periods, for some scenarios, negative trends of nutrient exports are detected during the last period. Additionally, the uncertainty of nutrient export predictions not only increases with time but also with the RCP making the RCP 8.5 for the period 2070–2099 the most uncertain scenario.
Upstream TN yields are expected to increase from 0.84 kg km 2 year 1 (estimated during the reference period (1975–2009)) to between 0.88 and 1.19 kg km 2 year 1 for the RCP 2.6 and between 0.88 and 1.08 kg km 2 year 1 for the RCP 4.5 by the middle of the century. Similarly, upstream TP yields could increase from 0.1 kg km 2 year 1 to 0.12 kg km 2 year 1 and 0.16 kg km 2 year 1 by the second half of the century for all RCP scenarios. It is shown that the increases of nutrient yields are quite substantial during the first two periods; however, by the end of the century, the growth of upstream TN and TP yields tend to decelerate but can reach values of 1.28 kg km 2 year 1 and 0.17 kg km 2 year 1 for TN and TP, respectively, for RCP 8.5.
Increases of incremental TN and TP yields are predicted for most of the scenarios. For example, increases from 1.08 kg km 2 year 1 to 1.06 kg km 2 year 1 and 1.43 kg km 2 year 1 for RCP 2.6, between 1.05 kg km 2 year 1 and 1.29 kg km 2 year 1 for RCP 4.5 and between 1.08 kg km 2 year 1 and 1.45 kg km 2 year 1 for RCP 8.5 are expected by the middle of the century. Similarly, increases of incremental TP yields are expected to vary between 0.12 kg km 2 year 1 and 0.16 kg km 2 year 1 for all RCPs by the middle of the century. Although most of the modeling scenarios predict increases of incremental TN and TP yields, slight decreases are expected according to the MPI-ESM-LR model during the first two simulation periods. By the end of the century, the trend of incremental TN and TP yields could either remain unchanged, according to RCP 4.5 and RCP 8.5, or become negative for RCP 2.6, as predicted by the CanESM2 and MPI-ESM-LR models.
In-stream TN and TP concentrations tend to increase more rapidly than nutrient yields. According to RCP 8.5, TN concentration is expected to increase from 2.3 mg L 1 (concentration for the reference period) to 2.64 mg L 1 and 3.6 mg L 1 by the middle of the century. Similarly, increases from 0.36 mg L 1 to 0.43 mg L 1 and 0.57 mg L 1 of the TP concentration are expected during the second half of the century for RCP 8.5. By the end of the century, a trend change from positive to negative nutrient concentrations is predicted for some scenarios (e.g., CanESM2, MPI-RSM-LR and MIROC5 for RCP 2.6 and RCP 8.5).
To quantify the changes of TN and TP nutrient export for different RCPs, GCM averages of upstream yields, incremental yields and concentrations of nutrients were estimated followed by the calculation of the percentage changes with respect to the reference period (see Figure 5). In general, relatively constant percentage increases are predicted for the first two periods reaching the maximum increase by 2040–2069 with a slight decrease by the end of the century. As is to be expected, minimum and maximum changes are predicted according to RCP 2.6 and RCP 8.5, respectively, for most of the periods. However, minimum and maximum percentage increases are expected for the periods 2040–2069, and 2010–2039 and 2070–2099, respectively, for RCP 4.5.
TP exports are expected to increase more rapidly than TN exports. Analyzing upstream yields, percentage increases are at a maximum by 2040–2069 reaching an approximate range of 18–25% for TN and 32–41% for TP. Similarly, percentage changes of TP incremental yields (25–31%) are higher than TN incremental yields (9–16%), as are predicted for 2040–2069. Additionally, percentage changes in nutrient concentrations are higher than changes in nutrient yield indicating less in-stream nutrient dilution.

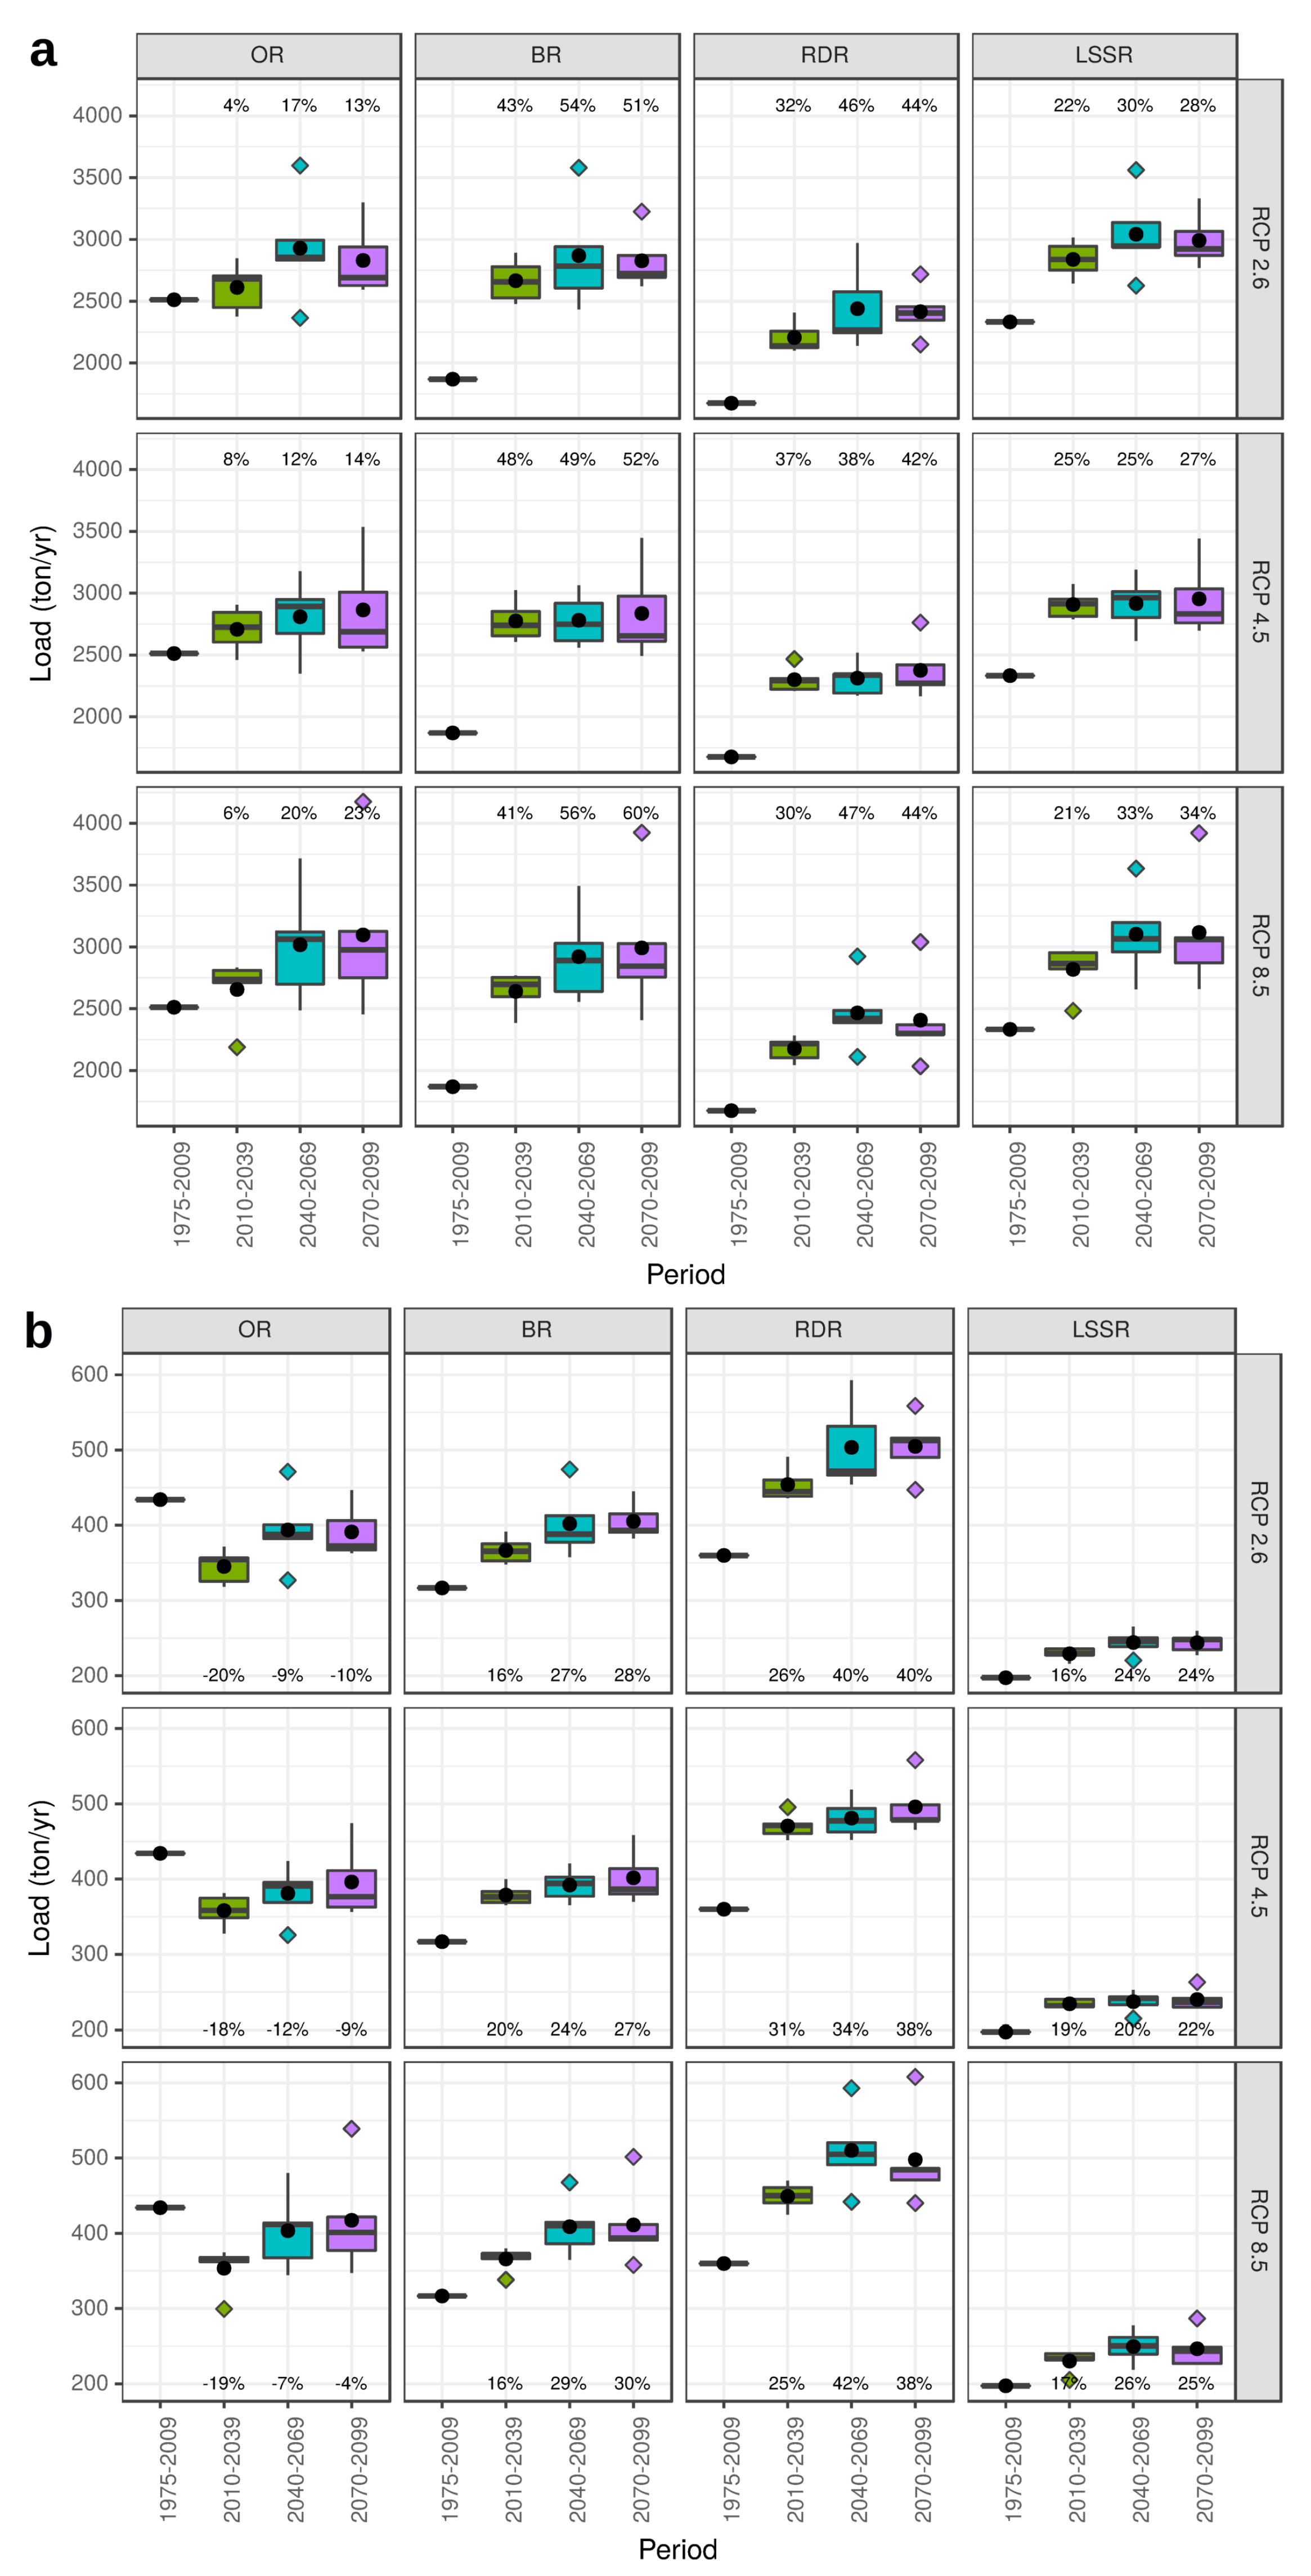
3.3. Changes of Nutrient Loads in the Main Basins

MultiGCM boxplots of predicted TN and TP loads and percentage changes with respect to the reference period at the outlet of the main SSR basins are shown in Figure 6a,b, respectively. These figures show that, in the OR basin, decreases of TP are expected for the following years, whereas increases of TN loads between 13% and 23% by 2070–2099 are expected. In the BR and RDR basins, large increases of TN loads of around 55% and 42%, respectively, are expected by the end of the century. It is important to mention that such increases in TN loads are large during the first period (2010–2039) and then, for the subsequent periods, the loads remain quite constant. Predicted TP loads differ from TN loads at the BR and RDR in that TP loads are expected to increase less and only around 28% and 39%, respectively. In the LSSR basin, current TN loads are slightly less than those in the OR basin; however, TP loads are the lowest. As was mentioned, predicted TN and TP load increases are quite substantial during the first period, but no increases are predicted after the second period reaching percentage changes of around 30% and 24%, respectively, by the third period.

3.4. Sensitivity Analysis of Nutrient Export Changes

A sensitivity analysis of nutrient export of future changes in nutrient sources, land-to-water delivery variables (precipitation and air temperature) and runoff was performed. The analysis consisted of examining how the percentages of the contribution from input variables affect nutrient export during the three modeling periods. The results indicate that nutrient export is quite sensitive to variations in the nutrient source variables. For example, when we analyzed upstream nutrient yields for the 2010–2039 period, we obtain an increase in the ranges 12–15% and 25–30% for TN and TP (see Figure 5), respectively. For these predicted increases in nutrients, a rise of 7% in the total fertilizer (mineral and organic) share and 11% in urban land use share are expected during this period for both TN and TP, although total fertilizer supply and urbanized areas with growth of 3.61% and 15.88%, respectively. In contrast, the forested land-use share is expected to decrease by 2% in accordance with the percentage reduction of forested areas for 2010–2039. Changes of nutrient source shares are expected to increase at a lower rate during the other two future periods. This tells us that land-use changes will have an important impact on the future of nutrient export in the SSR catchment.
Nutrient exports are also very sensitive to changes in land-to-water delivery variables and runoff. By the 2070–2099 period, whereas TN and TP upstream yields are expected to increase in the ranges 17–22% and 35–39% (see Figure 5), respectively, air temperature is expected to substantially increase between 99% and 193% and precipitation is expected to increase moderately between 2% and 19%. This indicates that export of TP seems to be more sensitive than TN to climate change. Changes in runoff are also expected to affect future nutrient export. This is evident in the disproportionate increases in nutrient concentrations with respect to nutrient loads and is triggered, although nutrient sources increase (e.g., total fertilizer supply), by a decrease in runoff due to climate change causing lower dilution with subsequent higher concentrations. This is evident in all of the SSR basins, but in particular in the BR basin where the highest reduction of runoff (∼13%) is projected. This will lead to a relatively low TN and TP load increase of 54% and 28%, respectively, but to a quite substantial increase in TN and TP concentrations (87% and 55%, respectively).

4. Discussion

4.1. Impact of Climate and Land-Use Changes on Nutrient Exports

Significant increases of nutrient exports are expected as a consequence of climate and land use changes in the SSR basin. Increases of TN and TP exports in the ranges of 18–22% and 35–39%, respectively, are expected by the end of the century, due to projected increases between 35% and 289% in air temperature and between 2% and 24% in precipitation. In a study undertaken by Bouraoui et al. [3] in a small English river catchment, increases of 27% in nitrogen and 34% in phosphorus by 2080 were projected due to climate change scenarios of air temperature and precipitation. Similarly, Kaste et al. [37] predicted a 40–50% increase in nitrate flux by 2070–2100 in a Norwegian river basin. Increases from 3.3% to 16% in phosphorus loads delivered from land to streams were also estimated during the 21 century in the northern coastal regions of Denmark due to rises in winter precipitation [38]. In contrast, a study conducted by [39] in the Lake Michigan basin, investigating the effects of climate change on phosphorus loads, yielded no substantial P changes, although a few scenarios projected increases of 10% in P loading by the end of the century. Discrepancies in future nutrient export changes could be related to the more frequent and intensive precipitation events [40] along with higher air temperatures [41] expected in the Canadian Prairies compared to the Lake Michigan catchment.
Not only climate change affects nutrient export in the SSR basin, but also land-use changes. It is known that changes in land use have large impacts on nutrient transport in river catchments. For example, the expansion of maize and wheat crops in the second-half of the twentieth century in the Mississippi River basin has led to the transformation of the nitrogen cycle in the catchment and to the increase of nitrate export to the Gulf of Mexico (e.g., [42]). As shown in the results, the projected increases of nutrient export are also related to increases of 79% in urbanized areas and 18% in cropland and fertilizer supply. Similarly, a study performed by Wiley et al. [43] in a Great Lakes river basin reports increases of 53% in TP loads and 31% in inorganic nitrogen loads by the end of the century due to the expansion of urbanized areas and associated runoff increases. For the period 2010–2039, LaBeau et al. [44] found that increases in phosphorus yields between 3.5% and 9.5% are expected in the Laurentian Great Lakes due to increases of 100% in urbanized land and 10% of cropland inducing increases of point and non-point sources, respectively. This contrasts with increases of 19% and 22% in TN and TP export, respectively, during the period 2010–2039.
The manner in which climate variables and land-use transformations affect future nutrient loads is complex. According to our results, TP exports are expected to increase faster than TN exports. From our modeling approach, this condition is partially explained by the analysis of statistical significance during the model calibrations since climate and nutrient source variables appear to better explain TP exports than TN exports. Similar SPARROW model implementations to estimate nutrient export have shown that precipitation and air temperature are more relevant to the transport of phosphorus than of nitrogen (e.g., [45]). On the other hand, it is known that global warming will extend growing seasons followed by an acceleration of organic matter decomposition through soil mineralization (e.g., [4]). These conditions are going to increase the fluxes of nutrients to streams. In the case of phosphorus, more frequent and intense precipitation events will facilitate the phosphorus detachment from soils and their transport to streams (e.g., [38]).

4.2. Model Uncertainty and Limitations

Estimates of nutrient exports are affected by different inputs of uncertainty. Such uncertainties are associated with spatial and temporal variability of climate, topography, land uses and nutrient source variables. In this study, uncertainties in the nutrient yield projections is quite high (0.9–1.28 kg km 2 year 1 of TN and 0.12–0.17 kg km 2 year 1 of TP) and are associated with climate and land-use change scenarios. In the case of climate variables, GCM model projections of averaged air temperature and precipitation in the SSR basin are in the range 3.4–9.5 C and 460–580 mm year 1 , respectively, by the end of the century. Uncertainty in runoff estimates would be similar to uncertainty in climate variable estimates. However, in order to reduce uncertainty in runoff estimates, the ideal approach would be to force a pre-calibrated hydrological model of the SSR basin with GCM climate change scenarios to project high-resolution runoff scenarios. In the case of land-use projections, uncertainties are significant due to the lack of historical data to project future land-use changes. Although our approach to predict land-use change is acceptable regarding the little available information and the main purpose of this work, land-use change projections must consider longer historical values (e.g., extracted from satellite images) of land use combined with socio-economic, environmental and political drivers of land-use change to improve modeling approaches. In spite the model uncertainties and limitations, this work presents a valuable estimate of annually averaged nutrient exports that can support management plans to mitigate nutrient export under future changes of climate and land use in the SSR basin. While the analysis of steady state nutrient fluxes presented here is an important first step in providing guidance for management, future work must be orientated to analyze the dynamic response of nutrients, particularly phosphorus, during peak flows, to climate and land-use changes.
Limitations are also related to how the SPARROW model is implemented, here to project future changes of nutrient exports. As we stated before, SPARROW uses a multivariate regression analysis to relate water quality observations and landscaped variables. As it is known, regression analysis implies certain interdependence among explanatory variable coefficients. In the case of land-to-water delivery variables, for example, changes in one coefficient associated with one variable (e.g., annual averaged precipitation) can bring changes to other coefficients associated with other variables [25]. In this paper, we present the future projections of almost all the explanatory variables involved within the model calibration, except the soil permeability and the catchment slope, changes of which were difficult to quantify due to the lack of information. Although we understand that there is an interdependence of variables in models such as SPARROW, in our approach, we force the model with the projection of most of the explanatory variables in order to reduce the imbalance in model coefficients produced when only one variable is changed. Despite our model limitations to project nutrient export changes due to imprecise streamflow projections, we believe that our approach is viable to present potential future changes of nutrient fluxes under uncertainty levels.

5. Conclusions

This is, to the best of our knowledge, the first research presented to estimate changes of annually-averaged TN and TP exports in a large basin due to both climate and land-use changes in Canada. Our modeling approach uses a previously calibrated SPARROW model, which was forced with climate and land-use scenarios, to simulate future changes of TN and TP export within the SSR basin. The model results indicate increases of nutrient exports in the SSR basin by the end of the century that will trigger new challenges in water quality control. This model simulations can serve to guide physically-based models to understand the effects of climate and land use changes on water quality and nutrient transport at different spatial and temporal scales. The main conclusions of this research are:
  • Annual averages of TN and TP export in the SSR are going to increase in the range of 0.9–1.28 kg km 2 year 1 and 0.12–0.17 kg km 2 year 1 , respectively, by the end of the century, due to climate and land-use changes.
  • Since runoff is predicted to decrease in the next decades, annual-averaged nutrient concentrations are expected to increase at a more rapid rate than loads; this will bring significant challenges in meeting water quality standards in the SSR basin.
  • According to the model projections, higher increases of TP compared to TN are expected: TP is going to increase by ∼36%, and TN is going to increase by ∼21%, by the end of the century.
  • Projected changes of nutrient export are expected to vary at the basin scale; the largest changes of annual-averaged nutrient loads are predicted to occur in the BR and RDR basins and nutrient loads from the OR basin could vary the least.

Author Contributions

The paper was conceptualized by all three authors. L.M.-M. wrote the paper as well as the software for the simulation study and the application. L.M-M. conducted the formal analysis. K.-E.L. and H.W. reviewed the paper and supervised all steps.

Funding

This study was funded by the University of Saskatchewan’s Global Institute for Water Security through the Canada Excellence Research Chair (CERC) in Water Security.

Acknowledgments

We acknowledge the University of Saskatchewan’s Global Institute for Water Security through the CERC in Water Security for funding this research.

Conflicts of Interest

The authors declare no conflict of interest.

References

  1. Wheater, H.; Evans, E. Land use, water management and future flood risk. Land Use Policy 2009, 26, S251–S264. [Google Scholar] [CrossRef]
  2. DeBeer, C.M.; Wheater, H.S.; Carey, S.K.; Chun, K.P. Recent climatic, cryospheric, and hydrological changes over the interior of western Canada: A review and synthesis. Hydrol. Earth Syst. Sci. 2016, 20, 1573. [Google Scholar] [CrossRef]
  3. Bouraoui, F.; Galbiati, L.; Bidoglio, G. Climate change impacts on nutrient loads in the Yorkshire Ouse catchment (UK). Hydrol. Earth Syst. Sci. Discuss. 2002, 6, 197–209. [Google Scholar] [CrossRef] [Green Version]
  4. Whitehead, P.; Wilby, R.; Battarbee, R.; Kernan, M.; Wade, A.J. A review of the potential impacts of climate change on surface water quality. Hydrol. Sci. J. 2009, 54, 101–123. [Google Scholar] [CrossRef] [Green Version]
  5. Conlan, K.; Lane, S.; Ormerod, S.; Wade, T. Preparing for climate change impacts on freshwater ecosystems (PRINCE): Results. In Science Report to Environment Agency No. SC030300/SR; Environment Agency: Bristol, UK, 2007. [Google Scholar]
  6. Cole, J.J.; Peierls, B.L.; Caraco, N.F.; Pace, M.L. Nitrogen loading of rivers as a human-driven process. In Humans as Components of Ecosystems; Springer: Berlin, Germany, 1993; pp. 141–157. [Google Scholar]
  7. Howarth, R.W.; Billen, G.; Swaney, D.; Townsend, A.; Jaworski, N.; Lajtha, K.; Downing, J.; Elmgren, R.; Caraco, N.; Jordan, T.; et al. Regional nitrogen budgets and riverine N & P fluxes for the drainages to the North Atlantic Ocean: Natural and human influences. In Nitrogen Cycling in the North Atlantic Ocean and Its Watersheds; Springer: Berlin, Germany, 1996; pp. 75–139. [Google Scholar]
  8. Cooke, G.D.; Welch, E.B.; Peterson, S.; Nichols, S.A. Restoration and Management of Lakes and Reservoirs; CRC Press: Boca Raton, FL, USA, 2005. [Google Scholar]
  9. Ross, M.R. Fisheries Conservation and Management; Prentice Hall: Upper Saddle River, NJ, USA, 1997. [Google Scholar]
  10. Li, S.; Elliott, J.A.; Tiessen, K.H.; Yarotski, J.; Lobb, D.A.; Flaten, D.N. The effects of multiple beneficial management practices on hydrology and nutrient losses in a small watershed in the Canadian Prairies. J. Environ. Qual. 2011, 40, 1627–1642. [Google Scholar] [CrossRef] [PubMed]
  11. Wheater, H.; Gober, P. Water security in the Canadian Prairies: Science and management challenges. Philos. Trans. R. Soc. Lond. A Math. Phys. Eng. Sci. 2013, 371. [Google Scholar] [CrossRef] [PubMed]
  12. Pomeroy, J.; Fang, X.; Williams, B. Impacts of Climate Change on Saskatchewan’s Water Resources; Centre for Hydrology, University of Saskatchewan: Saskatoon, Canada, 2009. [Google Scholar]
  13. Khaliq, M.; Sushama, L.; Monette, A.; Wheater, H. Seasonal and extreme precipitation characteristics for the watersheds of the Canadian Prairie Provinces as simulated by the NARCCAP multi-RCM ensemble. Clim. Dyn. 2015, 44, 255–277. [Google Scholar] [CrossRef]
  14. Bruneau, J.; Toth, B. Dove-Tailed Physical and Socioeconomic Results in the SSRB. In Climate Change and Water: SSRB Final Technical Report; Martz, L., Bruneau, J., Rolfeeds, J.T., Eds.; Technical Report; University ofSasaktchewan: Saskatoon, SK, Canada, 2007. [Google Scholar]
  15. Lapp, S.; Byrne, J.; Townshend, I.; Kienzle, S. Climate warming impacts on snowpack accumulation in an alpine watershed. Int. J. Climatol. 2005, 25, 521–536. [Google Scholar] [CrossRef] [Green Version]
  16. Byrne, J.; Kienzle, S.; Johnson, D.; Duke, G.; Gannon, V.; Selinger, B.; Thomas, J. Current and future water issues in the Oldman River Basin of Alberta, Canada. Water Sci. Technol. 2006, 53, 327. [Google Scholar] [CrossRef] [PubMed]
  17. Arnold, J.G.; Srinivasan, R.; Muttiah, R.S.; Williams, J.R. Large area hydrologic modeling and assessment part I: Model Development 1. J. Am. Water Resour. Assoc. 1998, 34, 73–89. [Google Scholar] [CrossRef]
  18. Bicknell, B.R.; Imhoff, J.C.; Kittle, J.L., Jr.; Donigan, A.S., Jr.; Johanson, R.C. Hydrological Simulation Program: Fortran User’s Manual for Release 11; EPA/600/R-97/080; Environment Protection Agency: Cincinnati, OH, USA, 1997; 755p.
  19. Young, R.; Onstad, C.; Bosch, D.; Anderson, W. AGNPS: A nonpoint-source pollution model for evaluating agricultural watersheds. J. Soil Water Conserv. 1989, 44, 168–173. [Google Scholar]
  20. Borah, D.K.; Bera, M. Watershed-scale hydrologic and nonpoint-source pollution models: Review of applications. Trans. ASAE 2004, 47, 789. [Google Scholar] [CrossRef]
  21. Smith, R.A.; Schwarz, G.E.; Alexander, R.B. Regional interpretation of water-quality monitoring data. Water Resour. Res. 1997, 33, 2781–2798. [Google Scholar] [CrossRef] [Green Version]
  22. Robertson, D.M.; Saad, D.A.; Schwarz, G.E. Spatial variability in nutrient transport by HUC8, state, and subbasin based on Mississippi/Atchafalaya River Basin SPARROW models. J. Am. Water Resour. Assoc. 2014, 50, 988–1009. [Google Scholar] [CrossRef]
  23. Morales-Marín, L.; Wheater, H.; Lindenschmidt, K. Assessment of nutrient loadings of a large multipurpose prairie reservoir. J. Hydrol. 2017, 550, 166–185. [Google Scholar] [CrossRef]
  24. Benoy, G.A.; Jenkinson, R.W.; Robertson, D.M.; Saad, D.A. Nutrient delivery to Lake Winnipeg from the Red—Assiniboine River Basin–A binational application of the SPARROW model. Can. Water Resour. J. Hydr. 2016, 41, 429–447. [Google Scholar] [CrossRef]
  25. Schwarz, G.E.; Hoos, A.B.; Alexanser, R.B.; Smith, R.A. The SPARROW Surface Water-Quality Model—Theory, Applications and User Documentation; Technical Report 6–B3; U.S. Geological Survey: Reston, VA, USA, 2006.
  26. Consortium, P.C.I. Statistically Downscaled Climate Scenarios; 2016. Available online: https://www.pacificclimate.org/data/statistically-downscaled-climate-scenarios (accessed on 12 October 2018).
  27. Bürger, G.; Sobie, S.; Cannon, A.; Werner, A.; Murdock, T. Downscaling extremes: An intercomparison of multiple methods for future climate. J. Clim. 2013, 26, 3429–3449. [Google Scholar] [CrossRef]
  28. Taylor, K.E.; Stouffer, R.J.; Meehl, G.A. An overview of CMIP5 and the experiment design. Bull. Am. Meteorol. Soc. 2012, 93, 485–498. [Google Scholar] [CrossRef]
  29. McKenney, D.W.; Hutchinson, M.F.; Papadopol, P.; Lawrence, K.; Pedlar, J.; Campbell, K.; Milewska, E.; Hopkinson, R.F.; Price, D.; Owen, T. Customized spatial climate models for North America. Bull. Am. Meteorol. Soc. 2011, 92, 1611. [Google Scholar] [CrossRef]
  30. Meinshausen, M.; Smith, S.J.; Calvin, K.; Daniel, J.S.; Kainuma, M.; Lamarque, J.; Matsumoto, K.; Montzka, S.; Raper, S.; Riahi, K.; et al. The RCP greenhouse gas concentrations and their extensions from 1765 to 2300. Clim. Chang. 2011, 109, 213–241. [Google Scholar] [CrossRef] [Green Version]
  31. Pachauri, R.K.; Allen, M.R.; Barros, V.R.; Broome, J.; Cramer, W.; Christ, R.; Church, J.A.; Clarke, L.; Dahe, Q.; Dasgupta, P.; et al. Climate Change 2014: Synthesis Report; Contribution of Working Groups I, II and III to the Fifth Assessment Report of the Intergovernmental Panel on Climate Change; IPCC: Geneva, Switzerland, 2014. [Google Scholar]
  32. Tanzeeba, S.; Gan, T.Y. Potential impact of climate change on the water availability of South Saskatchewan River Basin. Clim. Chang. 2012, 112, 355–386. [Google Scholar] [CrossRef]
  33. Solomon, S. Climate Change 2007—The Physical Science Basis: Working Group I Contribution to the Fourth Assessment Report of the IPCC; Cambridge University Press: Cambridge, UK, 2007; Volume 4. [Google Scholar]
  34. Schlamadinger, B.; Bird, N.; Johns, T.; Brown, S.; Canadell, J.; Ciccarese, L.; Dutschke, M.; Fiedler, J.; Fischlin, A.; Fearnside, P.; et al. A synopsis of land use, land-use change and forestry (LULUCF) under the Kyoto Protocol and Marrakech Accords. Environ. Sci. Policy 2007, 10, 271–282. [Google Scholar] [CrossRef]
  35. Agriculture and Agri-Food Canada. Agriculture and Agri-Food Canada—Land Use 1990, 2000, 2010. 2016. Available online: https://open.canada.ca/data/en/dataset/18e3ef1a-497c-40c6-8326-aac1a34a0dec (accessed on 12 October 2018).
  36. Statistics Canada. Population Projections for Canada, Provinces and Territories, Catalogue No. 91-520-X; Statistics Canada: Ottawa, ON, Canada, 2010.
  37. Kaste, Ø.; Wright, R.; Barkved, L.; Bjerkeng, B.; Engen-Skaugen, T.; Magnusson, J.; Sælthun, N. Linked models to assess the impacts of climate change on nitrogen in a Norwegian river basin and fjord system. Sci. Total Environ. 2006, 365, 200–222. [Google Scholar] [CrossRef] [PubMed]
  38. Jeppesen, E.; Kronvang, B.; Meerhoff, M.; Søndergaard, M.; Hansen, K.M.; Andersen, H.E.; Lauridsen, T.L.; Liboriussen, L.; Beklioglu, M.; Özen, A.; et al. Climate change effects on runoff, catchment phosphorus loading and lake ecological state, and potential adaptations. J. Environ. Qual. 2009, 38, 1930–1941. [Google Scholar] [CrossRef] [PubMed]
  39. Robertson, D.M.; Saad, D.A.; Christiansen, D.E.; Lorenz, D.J. Simulated impacts of climate change on phosphorus loading to Lake Michigan. J. Great Lakes Res. 2016, 42, 536–548. [Google Scholar] [CrossRef]
  40. Mailhot, A.; Beauregard, I.; Talbot, G.; Caya, D.; Biner, S. Future changes in intense precipitation over Canada assessed from multi-model NARCCAP ensemble simulations. Int. J. Climatol. 2012, 32, 1151–1163. [Google Scholar] [CrossRef]
  41. Jeong, D.I.; Sushama, L.; Diro, G.T.; Khaliq, M.N.; Beltrami, H.; Caya, D. Projected changes to high temperature events for Canada based on a regional climate model ensemble. Clim. Dyn. 2016, 46, 3163–3180. [Google Scholar] [CrossRef]
  42. Donner, S.D.; Kucharik, C.J.; Foley, J.A. Impact of changing land use practices on nitrate export by the Mississippi River. Glob. Biogeochem. Cycles 2004, 18. [Google Scholar] [CrossRef]
  43. Wiley, M.; Hyndman, D.; Pijanowski, B.; Kendall, A.; Riseng, C.; Rutherford, E.; Cheng, S.; Carlson, M.; Tyler, J.; Stevenson, R.; et al. A multi-modeling approach to evaluating climate and land use change impacts in a Great Lakes River Basin. Hydrobiologia 2010, 657, 243–262. [Google Scholar] [CrossRef]
  44. LaBeau, M.B.; Robertson, D.M.; Mayer, A.S.; Pijanowski, B.C.; Saad, D.A. Effects of future urban and biofuel crop expansions on the riverine export of phosphorus to the Laurentian Great Lakes. Ecol. Model. 2014, 277, 27–37. [Google Scholar] [CrossRef]
  45. Robertson, D.M.; Saad, D.A. SPARROW models used to understand nutrient sources in the Mississippi/Atchafalaya River Basin. J. Environ. Qual. 2013, 42, 1422–1440. [Google Scholar] [CrossRef] [PubMed]
Figure 1. Geographical location of the South Saskatchewan River basin, Canada. Main rivers and water bodies, cities, basin divisions and a digital elevation model (see value colorbar for terrain elevation) are included.
Water 10 01438 g001
Figure 2. Spatially-averaged time series of PCIC (a) annual-averaged precipitation and (b) annual-averaged air temperature data for the SSR basin for three RCPs and five GCMs. Colored straight lines, which match boxplot colors, indicate GCM’s linear trends and dotted vertical lines indicate the three SPARROW modelling periods Pr.1 (2010–2039), Pr.2 (2040–2069) and Pr.3 (2070–2099). GCM’s box plots, grouped by RCPs for the 1950–2099 period, show 25, 50 (median) and 75 percentiles box plot whiskers represent upper and lower extremes. Outliers are also included in the box plots.
Water 10 01438 g002
Figure 3. Projections of spatio-temporal annual averages of (a) upstream yield (kg km 2 year 1 ); (b) incremental yield (kg km 2 year 1 ) and (c) concentration (mg L 1 ) for TN. Minimum and maximum values are indicated for each of the future periods (2010–2039, 2040–2069 and 2070–2099) and RCPs. Values for the reference period 1975–2009 are also indicated.
Water 10 01438 g003
Figure 4. Projections of spatio-temporal annual averages of (a) upstream yield (kg km 2 year 1 ); (b) incremental yield (kg km 2 year 1 ) and (c) concentration (mg L 1 ) for TP. Minimum and maximum values are indicated for each of the future periods (2010–2039, 2040–2069 and 2070–2099) and RCPs. Values for the reference period 1975–2009 are also indicated.
Water 10 01438 g004
Figure 5. Percentage changes of upstream yield (kg km 2 year 1 ), incremental yield (kg km 2 year 1 ) and concentration (mg L 1 ) for (a) TN and (b) TP stemming from GCM averages for each RCP and future periods. Percentages were estimated with respect to values for the reference period 1975–2009.
Water 10 01438 g005
Figure 6. MultiGCM box plots (25, 50 (median) and 75 percentiles) of (a) total nitrogen (TN) and (b) total phosphorus (TP) predicted loads for each of the future periods, 2010–2039, 2040–2069 and 2070–2099, and RCP scenarios at the outlets of the main SSR basins, OR, BR, RDR and LSSR basins. Percentage changes with respect to the 1975–2009 TN average loads are shown. Box plot whiskers representing upper and lower extremes and outliers are also included in the box plots. The black filled dots represent nutrient load averages.
Water 10 01438 g006
Table 1. SPARROW model calibrated parameters for total nitrogen (TN) and total phosphorus (TP).
Model ParameterUnitsMeanStandardp-Value
CoefficientError
Total nitrogen (TN)
Sources ( β )
  point (population)dimensionless0.340.200.028
  forest land kg km 2  year 1 210.1656.60<0.001
  total fertilizer kg km 2  year 1 0.030.008<0.001
  urban land kg km 2  year 1 55.96466.580.452
Land-to-water delivery ( α )
  catchment slope%−4.271.880.012
  precipitationcm0.0030.0010.001
  temperature C0.2030.0740.004
  soil permeabilitycm h 1 −0.1460.0510.002
Aquatic nutrient removal ( κ )
  small streams (Q ≤ 1 m 3 s 1 )m year 1 2.370.544<0.001
  large streams (Q > 1 m 3 s 1 )m year 1 0.0190.1700.455
  reservoirsm year 1 5.752.350.008
Total phosphorous (TP)
Sources ( β )
  point (population)dimensionless0.0810.0450.038
  forest land kg km 2  year 1 26.318.370.001
  total fertilizer kg km 2  year 1 0.0020.001<0.001
  urban land kg km 2  year 1 191.6693.610.021
Land-to-water delivery ( α )
  catchment slope%−6.402.360.004
  precipitationcm0.0030.0010.018
  temperature C0.4430.101<0.001
  soil permeabilitycm h 1 −0.0270.0380.246
Aquatic nutrient removal ( κ )
  small streams (Q ≤ 1 m 3 s 1 )m year 1 0.5230.3080.046
  reservoirsm year 1 25.357.870.001
Table 2. Percentage changes in the mean annual maximum flow for different scenarios with respect to the 1975–2009 base period of the SSR basins.
 Period ScenarioBasins
ORBRRDRLSSR
2010–2039RCP 2.63.10−5.55−0.10−1.26
RCP 4.5−4.31−13.20−13.75−10.02
RCP 8.5−2.45−16.85−9.85−10.12
2040–2069RCP 2.61.40−16.10−11.20−8.65
RCP 4.5−4.93−16.70−16.64−12.33
RCP 8.50.40−18.40−12.85−10.33
2070–2099RCP 2.6−1.85−11.00−12.25−7.86
RCP 4.5−4.40−16.25−20.41−12.70
RCP 8.53.65−10.85−7.90−4.90

