Article

FDOM Conversion in Karst Watersheds Expressed by Three-Dimensional Fluorescence Spectroscopy

1
801 Institute of Hydrogeology and Engineering Geology, Shandong Provincial Bureau of Geology & Mineral Resources, Jinan 250014, China
2
Ministry of Natural Resources, China, Key Laboratory of Karst Ecosystem and Treatment of Rocky Desertification, Guilin 541004, China
3
Ministry of Natural Resources & Guangxi Zhuang Autonomous Region, Key Laboratory of Karst Dynamics, Institute of Karst Geology, Chinese Academy of Geological Sciences, Guilin 541004, China
4
State Key Laboratory of Environmental Geochemistry, Institute of Geochemistry, Chinese Academy of Sciences, Guiyang 550081, China
5
School of Environmental Science and Engineering, Qingdao University, Qingdao 266071, China
6
School of Environmental and Planning, Liaocheng University, Liaocheng 252059, China
*
Author to whom correspondence should be addressed.
Water 2018, 10(10), 1427; https://doi.org/10.3390/w10101427
Submission received: 31 May 2018 / Revised: 4 October 2018 / Accepted: 4 October 2018 / Published: 11 October 2018
(This article belongs to the Special Issue Watershed Hydrology, Erosion and Sediment Transport Processes )

Abstract

:
A karst system, formed by the dissolution of carbonate rocks, is usually susceptible to contamination. Little is known about the composition of natural dissolved organic matter (DOM) in groundwater systems, especially in karstic groundwater. To reveal the characteristics of DOM in a karst aquifer, the Yufuhe River Basin, a typical karst watershed in northern China, was selected. DOM fluorescence (FDOM) was measured with the excitation-emission matrices (EEMs) spectroscopy technique. Parallel factor analysis (PARAFAC) was used to analyze the karst hydrogeological factors that affect FDOM biogeochemical behavior. Three fluorescent components, i.e., tyrosine-like, tryptophan-like, and ultraviolet fulvic acid were found. Their fluorescence properties were closely related to human activity and subterranean hydrology. Fluorescence properties suggested that FDOM in the Yufuhe River karst aquifer was predominant from anthropogenic activity. In addition, due to the effect of karstic heterogeneous hydrological conditions, FDOM showed obvious differentiation in the recharge, flow path, and discharge systems. The FDOM fluorescence intensity (FI) was weak in surface water and groundwater at the upper reaches (recharge area). In the middle of the flow path area, the percentage of tyrosine-like and tryptophan-like substances degraded and fulvic acid rose gradually. However, after infiltrating into the lower reaches (discharge area) of the deep karst aquifer system, the fulvic acid matter was consumed and protein-like matter accumulated.

Graphical Abstract

1. Introduction

A karst system is one of the most fragile ecological environmental systems in the world [1,2,3,4,5]. Due to the thin soil and the unique karst morphology [6], pollutants can enter the karst aquifer easily [6,7]. In addition, as an open system, a karst aquifer is closely connected with the surface environment [8,9]. The geochemical behaviors of pollutants can be significantly different from all other hydrogeological units.
Karst areas cover 2200 km2 and account for 15% of the earth’s land. About 25% of the drinking, agricultural and industrial water on earth is supplied by karst aquifers [5,10,11]. China has the largest karst area in the world, which accounts for 25% of the global karst area [12]. The sinkholes, shafts and fissure structures in karst areas allow the organic pollutants from pesticides, domestic waste, industrial activity, etc., to seep into the karst aquifer, which results in an increasingly serious groundwater pollution problem in karst areas [13].
Dissolved organic matter (DOM) compounds have diverse functional groups and molecular sizes [14,15,16,17]. The functional groups are mainly composed of aromatic and aliphatic hydrocarbon chains [18,19,20]. Different DOM functional groups have different fluorescence spectroscopy characteristics [21,22,23]. These fluorescence of DOM (FDOM) properties illuminate the chemical structure, the source of FDOM, and its biogeochemical behavior [24]. Forty to sixty percent of DOM contains fluorescent substances [24]. It has been reported that fluorescent substances are good tracers in water conversion [25], but less research has been done in the rapid exchange of karst aquifer systems.
Generally, traditional methods for DOM measurements such as chemical oxygen demand (COD), biochemical oxygen demand (BOD), total organic carbon (TOC), and dissolved organic carbon (DOC), always represent the overall DOM quantity (a mixture of organic substances) with some special properties. They are incapable of revealing its composition (different kinds of organic matter) and dynamics [26]. Peak picking and fluorescence regional integration (FRI) approaches are also limited and controversial [27]. To avoid these restrictions, an excitation–emission matrix combined with parallel factor analysis (EEM-PARAFAC) technique has been widely used to reveal the components, sources, and fate of organic matter [28]. EEM-PARAFAC, which can accurately reveal components and dynamics in different aqueous environments, can provide advantageous information on FDOM. Spectral components are identified by this method, which can provide further insight into the environmental dynamics of the organic matter in diverse ecosystems [29].
A typical karst watershed in north-eastern China was selected to study the composition and source of DOM using fluorescence spectroscopy and PARAFAC. The properties and behavior of FDOM in the recharge, runoff, and discharge systems in this karst watershed were conducted to explore the FDOM transformation. The aim of this study was to understand the FDOM geochemical cycle in a karstic critical zone using the fluorescence properties of DOM.

2. Materials and Methods
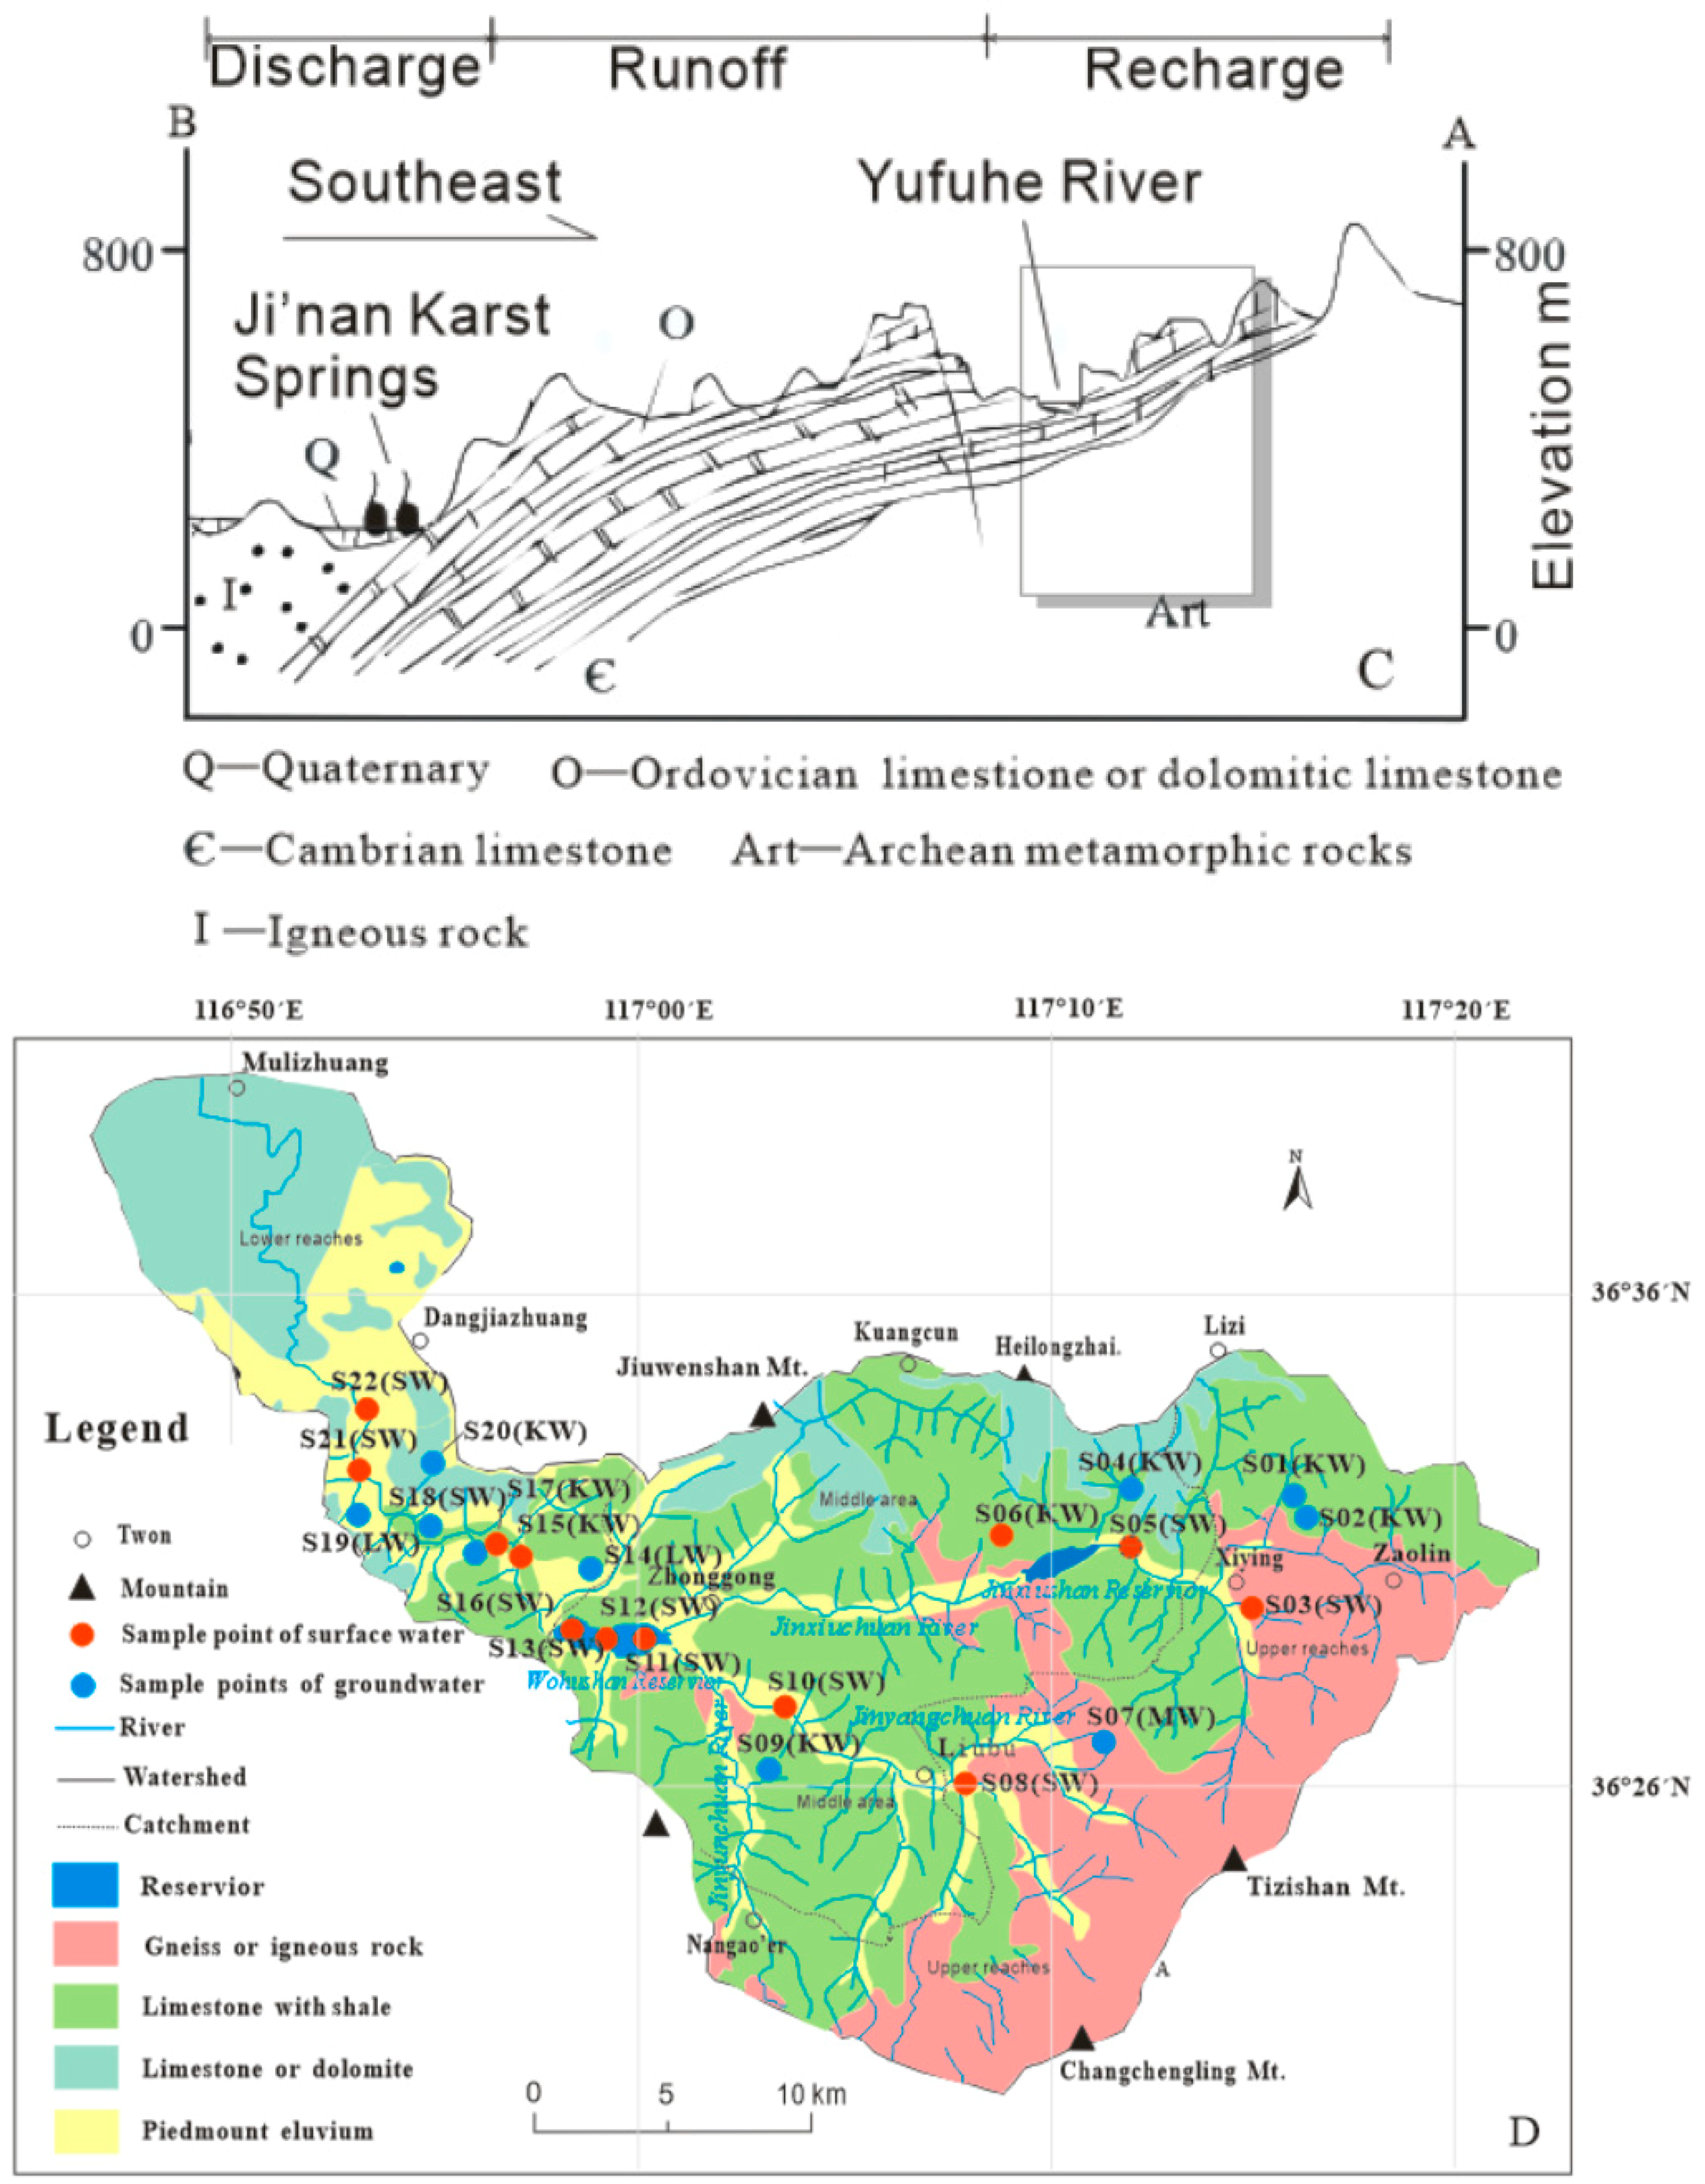
2.1. Field Site

Jinan Karst Springs (JKS) is an important historical heritage site in China and has been well known for hundreds of years [30]. The terrain is high in the south and low in the north, with the south being the crystalline basement of the former Sinian gneisses. The Cambrian–Ordovician strata are exposed, ranging from old to new northwards, and the Yanshanian magmatic rock is distributed in the north (Figure 1A,B). The direction of movement of the karst water, the direction of the topography and the direction of the stratum are generally consistent, moving from south to north [31]. As the karst water moves to the north, it is blocked by magmatic rocks. The groundwater becomes enriched and reaches the surface as a spring in Jinan (Figure 1C).
The Yufuhe River Basin is located in southern Jinan. It is the main recharge area for JKS (Figure 1B). The river watershed area is 764 km2 and its length is 95.7 km [32]. Most of the basin landform is low mountain and hilly. The southern part of the study area is a mountainous region with an average elevation of 500 m above sea level, and its elevation is about 100 m in the north. The water eventually flows into the Yellow River. Three tributaries, i.e., Jinxiuchuan, Jinyangchuan, and Jinyunchuan, compose its upstream. The main hydrogeological units in the study area were: (1) Cambrian aquifer, (2) Ordovician aquifer, (3) Quaternary aquifer and (4) Archaean aquifer (Figure 1D) [30].
The metamorphic rocks from the Taishan Group of the Archean Eonothem crop out in the upper reaches. The karst area, combined with the piedmont plain and residual sediments, comprises the middle and lower reaches. Limestone and dolostone from Ordovician and Cambrian strata are the main rocks in the karst area [33]. A small amount of shale trapped in carbonate rock has low organic content according to the report. It has two thin shale layers (10–15 cm) in carbonate rocks and the organic content is less than 1% [34]. Therefore, the shale layer shown in Figure 1D was not drawn up and the effect of shale organic matter on FDOM was not analyzed in this research.
Groundwater flow is controlled by the aquifers and confining layers. It is also affected by the surface water (e.g., the surface reservoir, river, etc.) as well as the pumping and recharge wells [30]. The water source from metamorphic rocks enters the karst aquifer system through karst fissures and pipes. The leakage of the Yufuhe River and reservoirs, such as the Wohushan Reservoir, and the lateral inflow contribute a great deal to the JKS groundwater recharge [30]. Seepage in loose sediments of middle and lower reaches is another source for JKS.
The study area has a warm temperate continental monsoon climate, an annual average temperature of 14.3 °C (1956–2013), and an average annual evaporation of 1500–1900 mm (1956–2013). The mean annual precipitation is around 676.94 mm (1956–2013), and the area has an uneven distribution of precipitation during the year, with about 73% of annual rainfall occurring from June to September [31]. The coefficient of the average (from 2009–2015) runoff depth is 120 mm and the multi-annual average runoff is calculated as 8.64 × 10⁶ m3/a [35].
The dynamics of the groundwater level is affected by many factors, such as precipitation, artificial mining, and the local topography [31]. Cultivated land, such as forest land, vegetable land, orchards, and cornfields, accounts for 33% of the basin area. Pesticide usage, mainly applied from March to September, is the primary sources of organic pollutants. An investigation showed that there were 59 kinds of organic pollutants in the Yufuhe River, which had a serious effect on JKS [36].

2.2. Sample Collection

According to different land use and lithology, 22 surface water and ground water samples were collected in May 2016. They were packed into 500-mL plastic bottles for chemical and fluorescence analyses without bubbles. After encapsulation, they were stored in a refrigerator at 4 °C and transported to the laboratory as soon as possible. Purified water was measured as a blank to deduce the external factors. Meanwhile, one bottle for each sampling point was collected for nitrate determination following the reference of Zhang et al. [38]. The pH, conductivity, temperature, and dissolved oxygen (DO) were tested in situ with a WTW instrument (WTW muti-3420, Wissenschaftlich-Technische Werkstatten GmbH & Co. KG, Munich, Germany). The turbidity was measured in situ by a portable turbidimeter (HACH 2100Q, Loveland, CA, USA). These parameters were measured to assist the DOM transformation analysis. Detailed sample information is shown in Table 1. For simplicity, the abbreviations SW, KW, MW, and LW were used to represent the surface water, karst groundwater, metamorphic rock groundwater, and loose sediment groundwater, respectively, in Table 1. According to the relationship between river recharge, runoff, and discharge area, the Yufuhe River was divided into seven units [37], i.e., upstream KW (S01, S02), middle stream KW (S04, S06, S09), upstream MW (S07), upstream SW (S03), middle stream SW (S05, S08, S10, S11, S12, S13), downstream KW (S15, S17, S20), downstream SW (S16, S18, S21, S22), middle stream LW (S14), and downstream LW (S19).

2.3. Optical Measurement and Analysis

The collected water samples were filtered into glass bottles pre-combusted at 550 °C for 6 h through glass fiber filters (0.22 μm). Absorbance spectra were obtained between 200 and 800 nm at 1-nm intervals (Shimadzu UV-2450PC UV-Vis spectrometer, Shimadzu Corporation, Kyoto, Japan) with 5-cm quartz cells. Milli-Q water was used in the reference cell. Absorbance measurements at each wavelength (k) were baseline corrected by subtracting the absorbance value at 700 nm. Absorption coefficients were obtained using the following equation (Equation (1)):
A D O M ( k ) = ln 10 A ( k ) / r
where ADOM(k) (m−1) is the DOM absorbance coefficient at wavelength k, A(k) is the corrected absorbance at wavelength k, and r is the cell path length (m) [39].
The three-dimensional (3D) excitation (Ex)–emission (Em) matrix spectra of DOM were measured using a Hitachi F-7000 fluorescence spectrometer (Hitachi High-Technologies, Hitachi Limited, Tokyo, Japan) with a 700-PMT voltage of a 150-W Xe lamp and a signal-to-noise ratio (SNR) of more than 110. The scan range was 200–450 nm for Ex and 250–600 nm for Em. Readings were collected at 5-nm intervals for Ex, with a 1-nm Em wavelength using a scanning speed of 2400 nm/min. The bandpass width was 5 nm for both Ex and Em.
The correction of spectra for instrumental response consisted of Ex and Em calibration. First, Ex was calibrated by using Rhodamine B as a standard (quantum counter), with a single-side frosted red filter in the Ex scan mode. Then, Em calibration was conducted with a diffuser in the synchronous scan mode. The Ex and Em spectra obtained over the range 200–600 nm were internally applied by the instrument (FL Solutions 2.1 software, Hitachi Limited, Tokyo, Japan) to correct the subsequent spectra. The absorption spectra were used to correct the inner filter of the fluorescence spectra [40].
Fluorescence intensity was calibrated in quinine sulfate units (QSUs), where 1 QSU is the maximum fluorescence intensity of 0.01 mg/L of quinine (qs) in 1 N H2SO4 at the Ex wavelength (nm)/Em wavelength (nm) = 350/450. Rayleigh scatter effects were removed from the data-set by excluding any Em measurements made at wavelengths 6 Ex, wavelength +5 nm, and at wavelengths P Ex wavelength +300 nm. Zero was added to the 3D EEM in the two triangle regions (Em wavelength 6 Ex wavelength +5 nm and P Ex wavelength +300 nm) of the missing data.
In order to deduce the source of FDOM more accurately, the fluorescence index (FI) was used. It is defined as the intensity ratio of the fluorescence Em spectra at 450 and 500 nm, when the Ex wavelength is 370 nm (f450/f500) [41]. Mcknight et al. [40] pointed out that when f450/f500 is 1.4, the fluorescence component mainly forms land-based substances (exogenous matter); when f450/f500 is 1.9, the fluorescence Em group is derived from biodegradation (endogenous matter).

2.4. The PARAFAC Model

Fluorescence EEMs were modeled by PARAFAC, which uses an alternating least-squares algorithm to minimize the sum of squared residuals across the dataset and to estimate the underlying structure of the EEM. The calibrated and corrected EEM datasets were performed in Matlab 2015a software. The DOMfluor toolbox of the Matlab software package was used for the PARAFAC model’s implementation and validation. The number of independent fluorescent components was determined by methods including split-half and residual analysis [28].
In this study, 22 water samples were measured, and each 3D-EEM was comprised of a 51 × 352 matrix. Therefore, the total samples constituted a 22 × 51 × 352 matrix. A PARAFAC model was adopted to simulate the DOM components through the DOMfluor toolbox of Matlab.
The PARAFAC statistically decomposes the complex mixture of DOM fluorophores into components without any assumptions about their spectral sharp or peak numbers. The data signal is decomposed into a set of three linear terms and a residual array [42] (Equation (2)):
x i j k = f = 1 F a i f b j f c k f + e i j k i = 1 , 2 , ... I ; j = 1 , 2 , ... J ; k = 1 , 2 , ... K
where xijk is the fluorescence intensity for the ith sample at Em wavelength j and Ex wavelength of k and aif is directly proportional to the concentration of the fth analyte in the ith sample. Both bjf and ckf are linearly related to the Em and Ex spectra at Em wavelength j and Ex wavelength k, respectively, for the fth analyte. eijk is the residual noise, a variable value not accounted for in the model.

3. Results

3.1. Component Extraction by PARAFAC

The trilinear decomposition model showed that with an increasing number of components, the sum square of errors (SSE) and the core consistency would diminish. To balance the two factors, a smaller SSE component was determined by analyzing the change trends of the residual curve [43]. The curves from factor Ex and the spectral square error sum are shown in Figure 2 according to the results from PARAFAC. The square error sum in the graph gradually becomes smooth by increasing the factor number from 1 to 4, and the fitting curve becomes much better.
However, the error squared sum showed no significant difference between factor numbers 3 and 4. Based on this analysis, three fluorescent components of FDOM and the corresponding maximum Ex/Em wavelength were identified. A comparison between the three fluorescence peaks and other literature is shown in Table 2. The EEM and the maximum Ex and Em wavelengths of the three fluorescent components are shown in Figure 3.
Component C1 had two maximum Ex wavelengths at 300 and 245 nm, with a maximum Em wavelength at 345 nm (Figure 3A). These peaks are similar to the tyrosine-like fluorescence peak B in a highly excited protein-like substance related to tyrosine and its metabolites [50].
Component C2 had two Ex peaks (<225 and 275 nm) and one Em peak (340 nm) (Figure 3B), corresponding to the high Ex tryptophan-like fluorescence peak T (275 nm/340 nm) of the conventional component, which is a tryptophan-like fluorescent peak in a protein-like substance. The peak position of <225/340 nm corresponds to the traditional low-level tryptophan-like fluorescence peak S (230–235/330–350 nm). The difference is that the Ex shifted to the blue wavelength.
Component C3 had a single Ex peak and Em peak (235/414 nm) (Figure 3C), representing the humic substances with a short-wave ultraviolet response, such as fulvic acid (FA). The peak is in the region of the traditional M peak (290–310/370–420 nm), a terrestrial humic-source DOM [51]. However, compared with the traditional humic peaks, the Ex wave was also blue shifted.
The main factors that affect the blue shift in DOM fluorescence peaks include decreasing aromaticity, reducing in conjugated double bonds, and elimination of functional groups (such as carboxyl, hydroxyl, carbonyl, amine, etc.) [52]. For C2 and C3, the blue shift appeared at the peak <225/340 nm (Ex/Em) and 235/414 nm (Ex/Em), indicating that the aromatic components had decreased and the molecular structure was simplified [53].

3.2. Spatial Distribution of FDOM Fluorescent Components

Table 3 shows the absolute and corresponding relative values for the three main DOM fluorescent components from different water types in the Yufuhe River.
The average content of fluorescent components in KW was C2 > C1 > C3, but they were C2 > C3 > C1 in SW, MW, and LW. Generally, fluorescence intensity correlates with FDOM concentration in the KW [48,53]. According to Table 3, the proportion of tryptophan-like substances in the KW was the largest, followed by tyrosine-like and humic materials. However, the order in SW, MW, and LW was tryptophan-like, humic, and tyrosine-like materials. The spatial distribution of fluorescence intensity in KW shows that the highest value fell on sampling point S09, which is the limestone aquifer in the middle-stream river (Figure 1D). The lowest value appeared at S20, which is the limestone confined aquifer in the downstream (Table 1). Field investigations discovered that S09 had a high population density and serious pollution. Wide utilization of pesticides in the vegetable and crop lands resulted in epikarst water containing a high content of FDOM. Although the contamination was also serious on the surface soil at S20, the deep confined water that had collected was less affected by surface FDOM. Hydrochemical parameters such as EC, TDS, turbidity, and NO3 verified the results that high values reflect intense human activity (Table 1).
Figure 4 displays the spatial distribution of the total fluorescence intensity and the specific fluorescent components at each sampling point. The average fluorescence intensity was 116, 124, 67, and 111 a.u. for KW, SW, MW, and LW, respectively. However, the fluorescence intensity of the tyrosine-like substance in KW was 42 a.u., higher than that of SW (4.54 a.u.), MW (5.14 a.u.), and LW (5.13 a.u.). For humic material, the KW samples had the lowest value (2.99 a.u.), which were 11.35, 7.14, and 6.06 a.u. for SW, MW, and LW, respectively. From upstream to downstream, the fluorescence intensity in KW decreased gradually, while it increased gradually in SW.

4. Discussion

4.1. DOM Source Tracing

Fluorescence spectral information can describe the source and composition of DOM [54,55]. Although it is difficult to attribute a certain fluorescence peak to one kind of FDOM, the EEM can be used to classify and analyze differences in FDOM composition according to the fluorescence peak characteristics. Many studies have reported that different sources of DOM contain different fluorophores, leading to the differences of fluorescence peak position and intensity [56].
The characteristics of fluorescence intensity can reflect the complexity of the molecular structure. An increase in molecular weight or in conjugated double bonds can produce strong and long fluorescence wavelengths. Short-wavelength fluorescence is usually related to low molecular weight and fewer conjugated double bonds [57]. For example, short Ex (200–250 nm) and short Em (280–350 nm) fluorescence peaks are always associated with simple aromatic protein components, such as tyrosine [58]; long Ex (250–280 nm) and short Em (300–380 nm) fluorescence peaks are associated with microbial byproducts, such as tyrosine, tryptophan, protein-like matter, and phenols [59]; long Ex (280–440 nm) and long Em (380–510 nm) fluorescence peaks are associated with humic-like (HA-like) organic matter [60]; and short Ex (<250 nm) and long Em (>350 nm) fluorescence peaks are associated with fulvic-like (FA-like) substances [40].
The generation of tryptophan-like and tyrosine-like fluorescence peaks is affected by the structure of arylamino acids in DOM [61]. It would also be influenced by industrial wastewater and sewage [62]. As seen from Table 4, the FI values in KW are between 1.84 and 2.15 (average of 1.94), indicating that most of the FDOM in KW comes from micro-organism decomposition. The FI values for MW and LW are similar to KW, with a range of 1.86–1.99. This means that FDOM is also produced by microbial action. For SW, the average value is 1.70. This means that the exogenous contaminants were also part of the DOM components in SW.
Karst systems always have large cracks and pipes [63], which are conducive to micro-organism residence and growth. Therefore, FDOM degrades more easily than other hydrogeological systems. Under the effect of surface–ground water exchange, it is easy for FDOM to degrade by organic-carbon-degrading bacteria.
Phytoplankton and microbial species grow enormously in contaminated surface water in surface rivers [64]. Compared with the karst aquifer, the space in metamorphic rocks and loose rock systems is small and the exchange with surface water is slow. This is why FDOM has a certain degree of endogenous contribution, but the microbial metabolism is not as remarkable as for SW and KW.
Pollution had a significant influence on fluorescence intensity in SW. External factors such as soil erosion and human pollution make the FDOM in SW two source features. The FDOM fluorescence intensity was light (except S09) at upstream with low human activity. It was quite similar to KW. In the middle and downstream, the environment was strongly influenced by human activity through vegetable and crop planting, which resulted in high fluorescence intensity. From Table 1, the average values of EC, TDS, turbidity, and NO3- in the upper reaches were 576 μS/cm, 258 mg/L, 0.772 NTU, and 14.25 mg/L, respectively. These parameters were 941 μS/cm, 397 mg/L, 2.70 NTU, and 21.18 mg/L, respectively, in the lower reaches. The DOM components are obviously affected by the factors of human activity. Table 5 shows the relation between these parameters and the three fluorescent components extracted by PARAFAC. The Pearson correlation coefficient of C3 and the hydrochemistry indexes such as pH, EC, TDS, and turbidity showed significant relationships. This expresses the characteristic of human activity. C1, another DOM component, has a significant relationship with temperature, which affected the biochemical reaction. It is interesting that the C1 is high in KW but low in SW, LW, and MW. C2 and C3 show the opposite phenomenon. As stated above, the tyrosine-like substance (C1) comes mainly from the endogenous environment. The tryptophan-like and fulvic acid substances (C2 and C3) come from the microbial metabolism. This rule is consistent with the hydrogeological structure of karst and non-karst aquifer systems.

4.2. Differentiation of FDOM Fluorescence Signal

Traditional physical and chemical indexes, such as the Ca/Na ratio, Mg/Ca ratio, HCO3/SO42−, etc., illuminate the different regional sources of karst water. DOM fluorescence studies reveal more about the differentiation of geochemical/biogeochemical process [50]. For example, the FI of S02, S04, S06, S14, and S20 are all higher than 1.90, which corresponds to its high endogenous contribution. At S03, S05, S13, S21, and S22, where aquatic plants grow well, the FI values are <1.70. The concentration of nitrate shown in Table 1 reflects the human effects on FI. In fact, rain flushing, agricultural production, slope land reclamation, etc., would lead to soil erosion and result in a high humus fluorescence peak in water [65], which cause a high protein-like fluorescence peak for the river [66].
In addition, DOM fluorescence properties can trace the transformation of fluorescent components. For example, a tryptophan-like peak usually indicates a heterogeneous FDOM (exogenous FDOM) such as insecticides, naphthalene, phenanthrene, etc., [67]. The blue shift of the tryptophan-like fluorescence peak (Table 2) indicates that the FDOM was degraded by phytoplankton and aquatic organisms [44]. The occurrence of a blue shift is generally induced by the change of aromatic ring to the aromatic filtrate, the decreasing of long-chain molecule alignment bonds, and the transformation of linear cyclic structures into nonlinear cyclic structures [44]. Ultraviolet fulvic acid (UV-FA) derived from carbonyl and a hydroxyl compound has a low molecular weight and high fluorescence efficiency [61]. In SW, the fluorescence intensity of the protein-like substance decreased and the UV-FA was enhanced (Table 3), illuminating that the protein was gradually transformed to humus. That is, the exogenous FDOM transformed into endogenous FDOM.

4.3. DOM Fluorescent Component Conversion in the Surface and Ground Water

As shown in Table 6, the average fluorescence intensity of the three fluorescent substances in KW is stronger than that of MW. With the changing of KW and MW to SW, tryptophan-like substances increase. From the upper reaches to the middle and lower reaches, the parameters of EC, TDS, and turbidity increase, but the fluorescence intensity of tryptophan-like substances, tyrosine-like substances, and FA in SW decrease. However, their percentage contents are not very different, which means that they experienced the same microbial degradation process.
The FDOM migration in the Yufuhe River Basin was shown in Figure 5. The MW, distributed in the upper reaches, is mainly subjected to precipitation and is less influenced by anthropogenic effects. In such an environment, the concentration of exogenous FDOM and its microbial degradation are low. Microbial respiration was responsible for protein-like consumption. Therefore, the DOM fluorescence intensity in MW is weak but the relative value of FA is high (10.67%).
The KW is influenced by the thin soil layer, serious soil erosion, and intensive agricultural activity in the karst area. Under the different dynamic conditions of karst groundwater and surface water, the DOM transportation in these two environments is also different. Generally, the soil DOM readily enters to surface water in karst areas under the soil erosion. After a long transportation, the DOM enters the karst aquifer gradually, causing a high DOM fluorescence intensity in karst groundwater. In addition, the arbitrary discharge of organic pollutants as stated above also leads to an elevated level of protein-like components [65]. At the lower reaches, the SW moves towards the loose sediment before it arrives at the deep karst system. The Quaternary sediment is a good filter for FDOM transportation, so the KW is less affected by surface pollutants in the deep karst aquifer.
From the upper reaches to the lower reaches, the concentration of FDOM and the proportion of tryptophan-like substances in surface water grew, while the proportion of UV-FA fell. Generally, the FDOM eigenvalues would decline under the decomposition effect of the microorganisms in SW [68]. However, the results here show that the FDOM eigenvalue increases along the surface water flow. This means that there is an exogenous FDOM input and new fluorescent substances are produced along the river. In addition, the blue shift in the FA fluorescence peak during the FDOM transport in SW signifies that the macromolecules were decomposed to small molecules and specific functional groups such as carbonyl, hydrocarbyl, and amine.
The downstream LW is directly derived from SW. The FDOM in LW is similar to that of SW. However, when SW enters the underground, the FDOM would be affected by several microbiological processes that involve DO and nitrate [69,70]. Some organic compounds would then be consumed and the DOM fluorescence intensity would decrease [71]. In fact, the impact of surface pollution, especially the FDOM produced by agricultural activity, has an opposite effect, leading to the increase of the protein-like material and the decrease of FA content.
FDOM is consumed by microbial activity in the aquifer during infiltration. The karst aquifer, a weak reducing environment [72], is conducive to FDOM mineralization and the generation of degradable intermediate products, such as amino acid composition. So, the tryptophan fluorescence intensity in KW is higher than that of SW and the LW. An interesting phenomenon is that both the epikart and deep karst waters have a high tyrosine-like substance concentration. The mechanism will be investigated in future research. However, it can be concluded from the above analysis that FDOM is a qualitative tracer that deducing the hydrogeochemical/biogeochemical processes that happened in karst aquifers.

5. Conclusions

PARAFAC was used to analyze the fluorescent characteristics and composition of FDOM. Based on the results, the surface and ground water conversion in the karst basin was studied, revealing the internal mechanism and biogeochemical behavior of FDOM transformation. Three kinds of FDOM components, i.e., tyrosine-like substances, tryptophan-like substances, and UV-FA were extracted by PARAFAC in the Yufuhe River samples. The tryptophan-like substance in KW has the largest proportion, followed by tyrosine-like substance and UV fulvic acid.
Fluorescence index analysis showed that the FDOM exhibited two end-members: exogenous and endogenous. In the place where human activity was intense, the FDOM originated mainly from a terrestrial input. The transformation of DOM components in the surface water and ground water revealed the dynamics of recharge, runoff, and discharge in the watershed. The metamorphic area in the upper reaches had a lesser anthropogenic effect and a favorable ecological environment. Therefore, the DOM fluorescence intensity was weakest and the relative content of FA was the highest. Meanwhile, the FDOM external physical input would result in the FDOM fluorescence eigenvalue rising. According to the characteristic of FDOM, it can be treated as a tracer indicating the source of organic matters qualitatively.
It should be noted that the sediment pore-water is susceptible to the ground pollution, so the proportion of protein-like fluorescent substances is large. After the Quaternary water has permeated into the karst aquifer, the FDOM concentration and the fluorescence intensity decreases continuously.

Author Contributions

Funding acquisition, W.L.; Writing–original draft, L.Z.; Investigation, P.L.; Methodology, X.Q.; Data curation, X.S.; Software, X.Y.

Funding

This research was funded by the Open Research Fund of the Research Center for Groundwater Resources and Environmental Engineering, Shandong Province (201501007) and the National Natural Science Foundation of China (41671213). It is funded by the China Geological Survey items (DD20160305; DD20160301) and the National Key Research and Development Program of China (2017YFC0406104).

Acknowledgments

The authors would like to thank all the participants for kind assistance during the field cruise and sample collecting. Great thanks also to the anonymous peer-reviewers for the constructive suggestions that improved the manuscript.

Conflicts of Interest

The authors declare no conflict of interest.

References

  1. Yuan, D. Karst in China; Geological Publishing House: Beijing, China, 1993. [Google Scholar]
  2. Wang, R.; Yao, C.; Jiang, Z.; Pei, J. Characteristics, formation, and control of rocky desertification in Liupanshui City, Guizhou province. Carsol. Sin. 2001, 20, 211–216. [Google Scholar]
  3. Goldscheider, N. Karst groundwater vulnerability mapping: Application of a new method in the Swabian Alb, Germany. Hydrogeol. J. 2005, 13, 555–564. [Google Scholar] [CrossRef]
  4. Wang, Y.; Xu, Y.; Qi, S.; Li, X.; Kong, X.; Yuan, D.; Theodore, O.I. Distribution and potential sources of organochlorine pesticides in the karst soils of a tiankeng in southwest China. Environ. Earth Sci. 2013, 70, 2873–2881. [Google Scholar] [CrossRef]
  5. Jiang, Z.; Lian, Y.; Qin, X. Rocky desertification in Southwest China: Impacts, causes, and restoration. Earth-Sci. Rev. 2014, 132, 1–12. [Google Scholar] [CrossRef]
  6. Zhang, R.; Shu, L.; Zhu, J.; Yu, Z.; Jiang, P. Storage and drainage characteristics of a highly heterogeneous karst aquifer in Houzhai Basin. Groundwater 2016, 54, 878–887. [Google Scholar] [CrossRef] [PubMed]
  7. Williams, P.W. The role of the subcutaneous zone in karst hydrology. J. Hydrol. 1983, 61, 45–67. [Google Scholar] [CrossRef]
  8. Yang, P.; Kuang, Y.; Yuan, W.; Jia, P.; He, Q.; Lin, Y. Substance transport in an underground river of typical karst watershed during storm events. Environ. Sci. 2009, 30, 3249–3255. [Google Scholar]
  9. He, S.; Zhu, L.; Dong, Z.; Zhang, Y.; Yu, X. Study on geochemical susceptivity of groundwater system in representative karstic regions. Environ. Sci. 2010, 31, 1176–1182. [Google Scholar]
  10. Butscher, C.; Huggenberger, P. Enhanced vulnerability assessment in karst areas by combining mapping with modeling approaches. Sci. Total Environ. 2009, 407, 1153–1163. [Google Scholar] [CrossRef] [PubMed]
  11. Castro, B.R.P.; Ávila, J.P.; Ming, Y.; Sansores, A.C. Groundwater quality: Analysis of its temporal and spatial variability in a karst aquifer. Groundwater 2018, 56, 62–72. [Google Scholar] [CrossRef] [PubMed]
  12. Jiang, Y. The impact of land use on soil properties in a karst agricultural region of Southwest China: A case study of Xiaojiang watershed, Yunnan. J. Geogr. Sci. 2006, 16, 69–77. [Google Scholar] [CrossRef]
  13. Yuan, D. The situation and tasks for northern karst research of our country. Carsol. Sin. 2010, 29, 219–221. [Google Scholar]
  14. Candler, R.; Zech, W.; Alt, H. Characterization of water-soluble organic substances from a Typic Dystrochrept under spruce using GPC, IR, 1H NMR, and 13C NMR spectroscopy. Soil Sci. 1988, 146, 445–452. [Google Scholar] [CrossRef]
  15. Simon, K.S.; Pipan, T.; Ohno, T.; Culver, D.C. Spatial and temporal patterns in abundance and character of dissolved organic matter in two karst aquifers. Fundam. Appl. Limnol. 2010, 177, 81–92. [Google Scholar] [CrossRef]
  16. He, W.; Bai, Z.; Li, Y.; Kong, X.; Liu, W.; Yang, C.; Yang, B.; Xu, F. Advances in environmental behaviors and effects of dissoved organic matter in aquatic ecosystems. Sci. China Earth Sci. 2016, 46, 341–355. [Google Scholar]
  17. Lechleitner, F.; Lang, S.Q.; Mcintyre, C.; Baldini, J.U.L.; Dittmar, T.; Eglinton, T.I. Source to sink characterization of dissolved organic matter in a tropical karst system. In Proceedings of the EGU General Assembly Conference, Vienna, Austria, 17–22 April 2016. [Google Scholar]
  18. Fooken, U.; Liebezeit, G. Distinction of marine and terrestrial origin of humic acids in North Sea surface sediments by absorption spectroscopy. Mar. Geol. 2000, 164, 173–181. [Google Scholar] [CrossRef]
  19. Kang, K.-H.; Shin, H.S.; Park, H. Characterization of humic substances present in landfill leachates with different landfill ages and its implications. Water Res. 2002, 36, 4023–4032. [Google Scholar] [CrossRef]
  20. Kowalczuk, P.; Durako, M.J.; Young, H.; Kahn, A.E.; Cooper, W.J.; Gonsior, M. Characterization of dissolved organic matter fluorescence in the South Atlantic Bight with use of PARAFAC model: Interannual variability. Mar. Chem. 2009, 113, 182–196. [Google Scholar] [CrossRef]
  21. Coble, P.G.; Green, S.A.; Blough, N.V.; Gagosian, R.B. Characterization of dissolved organic matter in the Black Sea by fluorescence spectroscopy. Nature 1990, 348, 432–435. [Google Scholar] [CrossRef] [Green Version]
  22. Rochelle-Newall, E.J.; Fisher, T.R. Production of chromophoric dissolved organic matter fluorescence in marine and estuarine environments: An investigation into the role of phytoplankton. Mar. Chem. 2002, 77, 7–21. [Google Scholar] [CrossRef]
  23. Bhatnagar, A.; Sillanpää, M. Removal of natural organic matter (NOM) and its constituents from water by adsorption—A review. Chemosphere 2017, 166, 497–510. [Google Scholar] [CrossRef] [PubMed]
  24. Quiers, M.; Batiotguilhe, C.; Seidel, J.; Bicalho, C.C.; Perrette, Y.; Jourde, H. The fluorescence spectroscopy of Dissolved Organic Matter (DOM): A tool to characterize rapid infiltration flows and vulnerability in karst systems. Application to the Lez hydrosystem (Hérault, France). In Proceedings of the AGU Fall Meeting, San Francisco, CA, USA, 5–9 December 2011; pp. 411–414. [Google Scholar]
  25. Blondel, T.; Dudal, Y.; Boyer, D. Punctual and continuous estimation of transit time from dissolved organic matter fluorescence properties in karst aquifers, application to groundwaters of ‘Fontaine de Vaucluse’ experimental basin (SE France). Environ. Earth Sci. 2012, 65, 2299–2309. [Google Scholar] [CrossRef]
  26. Ishii, S.K.L.; Boyer, T.H. Behavior of Reoccurring PARAFAC Components in Fluorescent Dissolved Organic Matter in Natural and Engineered Systems: A Critical Review. Environ. Sci. Technol. 2012, 46, 2006–2017. [Google Scholar] [CrossRef] [PubMed]
  27. Korak, J.A.; Dotson, A.D.; Summers, R.S.; Rosario-Ortiz, F.L. Critical analysis of commonly used fluorescence metrics to characterize dissolved organic matter. Water Res. 2014, 49, 327–338. [Google Scholar] [CrossRef] [PubMed]
  28. Yu, H.; Song, Y.; Du, E.; Yang, N.; Peng, J.; Liu, R. Comparison of PARAFAC components of fluorescent dissolved and particular organic matter from two urbanized rivers. Environ. Sci. Pollut. Res. 2016, 23, 1–12. [Google Scholar] [CrossRef] [PubMed]
  29. Nie, Z.; Wu, X.; Huang, H.; Fang, X.; Xu, C.; Wu, J.; Liang, X.; Shi, J. Tracking fluorescent dissolved organic matter in multistage rivers using EEM-PARAFAC analysis: Implications of the secondary tributary remediation for watershed management. Environ. Sci. Pollut. Res. Int. 2016, 23, 8756–8769. [Google Scholar] [CrossRef] [PubMed]
  30. Qian, J.; Zhan, H.; Wu, Y.; Li, F.; Wang, J. Fractured-karst spring-flow protections: A case study in Jinan, China. Hydrogeol. J. 2006, 14, 1192–1205. [Google Scholar] [CrossRef]
  31. Xing, L.; Huang, L.; Chi, G.; Yang, L.; Li, C.; Hou, X. A dynamic study of a karst spring based on wavelet analysis and the Mann-Kendall Trend Test. Water 2018, 10, 698. [Google Scholar] [CrossRef]
  32. Wang, B. The Characteristics of Landforms and the Expploitation and Utilization of Landscape in the Drainage Basin of Yufu River in Shandong Province. Master’s Thesis, Shandong Normal University, Jinan, China, 2009. [Google Scholar]
  33. Li, B. The Influence of Wohushan Reservoir to Jinan Karst Spring Basin. Master’s Thesis, University of Jinan, Jinan, China, 2011. [Google Scholar]
  34. Zhang, C.; Yu, B. There are obvious differences in China’s Marine rich organic shale. Pet. Equip. 2011, 2, 33. [Google Scholar]
  35. Chi, G.; Xing, L.; Zhu, H.; Hou, X.; Xiang, H.; Xing, X. The study of quantitative relationship between the spring water and the dynamic change of the atmospheric precipitation in Jinan. Groundwater 2017, 39, 8–12. [Google Scholar]
  36. Shi, J.; Lu, G.; Jiang, S.; Liu, X.; Meng, J. Study on present condition and countermeasures of groundwater pollution in Jinan Sprig Areas. Shandong Land Resour. 2012, 28, 21–24. [Google Scholar]
  37. Wan, L.; Xu, H.; Yin, X.; Li, W.; Wang, Q.; Duan, X.; Gao, Z. Formation of hydrochemistry components of karst groundwater in Jinan. Hydrogeol. Eng. Geol. 2008, 35, 61–64. [Google Scholar]
  38. Zhang, L.; Qin, X.; Liu, P.; Huang, Q.; Lan, F.; Ji, H. Estimation of carbon sink fluxes in the Pearl River basin (China) based on a water–rock–gas–organism interaction model. Environ. Earth Sci. 2015, 74, 945–952. [Google Scholar] [CrossRef]
  39. Calloway, D. Beer-lambert law. J. Chem. Educ. 1997, 74, 744. [Google Scholar] [CrossRef]
  40. Mcknight, D.M.; Boyer, E.W.; Westerhoff, P.K.; Doran, P.T.; Kulbe, T.; Andersen, D.T. Spectrofluorometric characterization of dissolved organic matter for indication of precursor organic material and aromaticity. Limnol. Oceanogr. 2001, 46, 38–48. [Google Scholar] [CrossRef] [Green Version]
  41. Wolfe, A.P.; Kaushal, S.S.; Fulton, J.R.; Mcknight, D.M. Spectrofluorescence of sediment humic substances and historical changes of lacustrine organic matter provenance in response to atmospheric nutrient enrichment. Environ. Sci. Technol. 2002, 36, 3217–3223. [Google Scholar] [CrossRef] [PubMed]
  42. Stedmon, C.A.; Markager, S.; Bro, R. Tracing dissolved organic matter in aquatic environments using a new approach to fluorescence spectroscopy. Mar. Chem. 2003, 82, 239–254. [Google Scholar] [CrossRef]
  43. Pan, H.; Lei, H.; Han, Y.; Xi, B.; He, X.; Xu, Q.; Li, D.; Song, C. Analysis of spatial distribution characteristics of dissolved organic matter in trypical greenhouse soil of Northern China using three dimensional fluorescence spectra technique and parallel factor analysis model. Spectrosc. Spectr. Anal. 2014, 34, 1582–1588. [Google Scholar]
  44. Coble, P.G. Characterization of marine and terrestrial DOM in seawater using excitation-emission matrix spectroscopy. Mar. Chem. 1996, 51, 325–346. [Google Scholar] [CrossRef]
  45. He, X.; Xi, B.; Wei, Z.; Li, M.; Su, J.; Geng, C.; Wang, W.; Hu, C. Fluorescence characteristics of dissolved organic matter from dumped waste leachate. China Environ. Sci. 2010, 30, 752–757. [Google Scholar] [CrossRef]
  46. Li, Y.; Wei, Z.; Xi, B.; Liu, J.; Yang, T.; Li, M.; Li, X.; Chen, F.; Tong, Y. Characterization of fluorescence properties of water-soluble organic compounds in multi-stage domestic refuse inoculation compost. J. Agric. Resour. Environ. 2012, 29, 79–85. [Google Scholar]
  47. Xie, L.; Yang, H.; Qu, X.; Zhu, Y.; Zhang, M.; Wu, F. Characerization of water extractable organic matters from the dominant plants in Lake Dianchi by multiple spectroscopy techniques. Res. Environ. Sci. 2013, 26, 72–79. [Google Scholar]
  48. Hao, R.; Cao, K.; Deng, Y. Characterization of dissolved organic pollutants in wastewater by three-dimensional fluorescent spectropscopy. Chin. J. Anal. Lab. 2007, 26, 41–44. [Google Scholar]
  49. Leenheer, J.A.; Croue, J.-P. Characterizing aquatic dissolved organic matter. Environ. Sci. Technol. 2003, 37, 18. [Google Scholar] [CrossRef]
  50. Yao, X.; Zhou, S.; Xia, R.; Xu, D.; Yao, M. Dissolved organic matter (DOM) dynamics in karst aqiufer systems. Environ. Sci. 2014, 35, 1765–1772. [Google Scholar]
  51. Yamashita, Y.; Jaffé, R.; Maie, N.; Tanoue, E. Assessing the dynamics of dissolved organic matter (DOM) in coastal environments by excitation emission matrix fluorescence and parallel factor analysis (EEM-PARAFAC). Limnol. Oceanogr. 2008, 53, 1900–1908. [Google Scholar] [CrossRef] [Green Version]
  52. Senesi, N. Molecular and quantitative aspects of the chemistry of fulvic acid and its interactions with metal ions and organic chemicals: Part II. The fluorescence spectroscopy approach. Anal. Chim. Acta 1990, 232, 77–106. [Google Scholar] [CrossRef]
  53. Huang, S.; Wang, Y.; Cao, L.; Wang, C.; Yu, M.; Pi, K.; Jia, C. Characterization of DOM from soil in unsaturated zone and its implications on arsenic mobilization into groundwater. Earth Sci. 2012, 37, 605–611. [Google Scholar]
  54. Hering, J.G.; Morel, F.M. Humic acid complexation of calcium and copper. Environ. Sci. Technol. 1988, 22, 1234–1237. [Google Scholar] [CrossRef] [PubMed]
  55. Newcombe, G.; Drikas, M.; Hayes, R. Influence of characterised natural organic material on activated carbon adsorption: II. Effect on pore volume distribution and adsorption of 2-methylisoborneol. Water Res. 1997, 31, 1065–1073. [Google Scholar] [CrossRef]
  56. Zhao, X.; Cheng, J. Fluorescence characteristics of dissolved organic matter and interactionn between Cu(II) and DOM in sediments of Baiyangdian Lake, China. J. Agro-Environ. Sci. 2012, 31, 1217–1222. [Google Scholar]
  57. Best, M.D.; Mantai, K.E. Growth of Myriophyllum: Sediment or lake water as the source of nitrogen and phosphorus. Ecology 1978, 59, 1075–1080. [Google Scholar] [CrossRef]
  58. Ahmad, S.R.; Reynolds, D.M. Monitoring of water quality using fluorescence technique: Prospect of on-line process control. Water Res. 1999, 33, 2069–2074. [Google Scholar] [CrossRef]
  59. Ismaili, M.M.; Belin, C.; Lamotte, M.; Texier, H. Distribution and characterisation by fluorescence of the dissolved organic matter within the central Channel waters. Oceanol. Acta 1998, 21, 645–676. [Google Scholar] [CrossRef]
  60. Buckau, G.; Artinger, R.; Geyer, S.; Wolf, M.; Fritz, P.; Kim, J. Groundwater in-situ generation of aquatic humic and fulvic acids and the mineralization of sedimentary organic carbon. Appl. Geochem. 2000, 15, 819–832. [Google Scholar] [CrossRef]
  61. He, X.S.; Xi, B.D.; Wei, Z.M.; Jiang, Y.H.; Yang, Y.; An, D.; Cao, J.L.; Liu, H.L. Fluorescence excitation–emission matrix spectroscopy with regional integration analysis for characterizing composition and transformation of dissolved organic matter in landfill leachates. J. Hazard. Mater. 2011, 190, 293–299. [Google Scholar] [CrossRef] [PubMed]
  62. Cox, L.; Celis, R.; Hermosín, M.C.; Cornejo, J.; Zsolnay, A.; Zeller, K. Effect of organic amendments on herbicide sorption as related to the nature of the dissolved organic matter. Environ. Sci. Technol. 2000, 34, 4600–4605. [Google Scholar] [CrossRef] [Green Version]
  63. Nguyet, V.T.M.; Goldscheider, N. A simplified methodology for mapping groundwater vulnerability and contamination risk, and its first application in a tropical karst area, Vietnam. Hydrogeol. J. 2006, 14, 1666–1675. [Google Scholar] [CrossRef] [Green Version]
  64. Cai, W.; Xu, X.; Du, X.; Zhu, H.; Luo, G. Parallel factor analysis with EEM on dissolved organic matter in Chongqing section of Jialing River. Res. Environ. Sci. 2012, 25, 276–281. [Google Scholar]
  65. Guo, W.; Huang, J.; Hong, H.; Xu, J.; Deng, X. Resolving excitation emission matrix spectroscopy of estuarine CDOM with parallel factor analysis and its application in organic pollution monitoring. Environ. Sci. 2010, 31, 1419–1427. [Google Scholar]
  66. Tzortziou, M.; Neale, P.J.; Osburn, C.L.; Megonigal, J.P.; Maie, N.; Jaffé, R. Tidal marshes as a source of optically and chemically distinctive colored dissolved organic matter in the Chesapeake Bay. Limnol. Oceanogr. 2008, 53, 148–159. [Google Scholar] [CrossRef] [Green Version]
  67. Baker, A.; Curry, M. Fluorescence of leachates from three contrasting landfills. Water Res. 2004, 38, 2605–2613. [Google Scholar] [CrossRef] [PubMed]
  68. Zhang, H.; Tian, J.; Huang, J.; Zhang, Y.; Wang, K.; Quan, G.; Liu, P.; Yan, S. Analysis of dissolved organic matter transformation in wastewater treatment process by three dimentional fluorescence spectra technology. Environ. Pollut. Control 2017, 39, 375–383. [Google Scholar]
  69. Tamamura, S.; Ueno, A.; Aramaki, N.; Matsumoto, H.; Uchida, K.; Igarashi, T.; Kaneko, K. Effects of oxidative weathering on the composition of organic matter in coal and sedimentary rock. Org. Geochem. 2015, 81, 8–19. [Google Scholar] [CrossRef]
  70. Thayalakumaran, T.; Lenahan, M.J.; Bristow, K.L. Dissolved organic carbon in groundwater overlain by irrigated sugarcane. Groundwater 2015, 53, 525–530. [Google Scholar] [CrossRef] [PubMed]
  71. Yang, J. The fluorescence properties of dissolved organic matter in Zhuozishan Mine Groundwater. Saf. Coal Mines 2014, 45, 131–137. [Google Scholar]
  72. Zhang, L.; Yang, H.; Tang, J.; Qin, X.; Yu, A.Y. Attenuation of arsenic in a karst subterranean stream and correlation with geochemical factors: A case study at Lihu, South China. J. Environ. Sci. 2014, 26, 2222–2230. [Google Scholar] [CrossRef] [PubMed]
Figure 1. The map shows the geographic location and the lithology of the Yufuhe River Basin. (A,B) is the location of Jinan Karst Springs (JKS) and the hydrogeological map of JKS according to Qian et al. [30]. (C) is the cross-section map from (A) to (B) which shows the geological–hydrogeological structure of JKS from its recharge area to the discharge area. The sampling points and detailed hydrogeological structure are shown in (D). The letters in brackets represent the type of water point: KW is karst aquifer water; SW is surface water; MW is metamorphic rock groundwater; and LW means loose sediment groundwater. The catchment line in the geology map and cross-section map were modified according to Wan et al. [37].
Water 10 01427 g001aWater 10 01427 g001b
Figure 2. The sum of squared errors was influenced by different factors simulated by the Parallel factor analysis (PARAFAC) model. (AD) represent the fitting curve with 1-, 2-, 3-, and 4-factor models, respectively. The red line is the model line and the blue line is the measured fitting curve. The fitting curve shows a good relationship with the standard curves in 3 and 4 fluorescent factors (C,D).
Water 10 01427 g002
Figure 3. The 3D spectrum of fluorescence components identified by the PARARAC model: (AC) represent component 1 (C1, tyrosine-like substance), component 2 (C2, tryptophan-like substance), and component 3 (C3, ultraviolet fulvic acid substances), respectively. The peak shows the Ex/Em in different components. Peak A is 245/345, peak B is 300/345, peak C is 225/340, peak D is 275/340, and peak E is 235/414.
Water 10 01427 g003
Figure 4. The distributions of the three fluorescent components scores. The average contribution rates of C1, C2, and C3 in SW (surface water), MW (metamorphic rock groundwater), and LW (loose sediment groundwater) are 13.0%, 80.5%, and 6.5%, respectively. In KW (karst aquifer water), the average contributions of C1, C2, and C3 are 27.0%, 69.5%, and 3.5%, respectively. Compared with non-karst water, the content of C1 in KW is higher, while the concentration of C2 and C3 is relatively lower.
Water 10 01427 g004
Figure 5. The sketch shows the surface–ground water conversion and DOM fluorescence composition variations in the Yufuhe River Basin. The gray boxes represent the aquifers of carbonate rock, metamorphic rock, and loose sediment. The yellow boxes represent the surface water from the upper reaches to the lower reaches and the reservoir.
Water 10 01427 g005
Table 1. The detailed information on the water samples.
SampleSampling PointLithologyWater Type *Sample SitepHEC ** (μS/cm)T (°C)DO (mg/L)TDS (mg/L)Turbidity (NTU)NO3 (mg/L)
S01Hongling ILimestone, marl, and limestone intercalated with little shaleKWSpring7.4556615.37.152450.7218.32
S02Hongling IILimestone, marl, and limestone intercalated with little shaleKWSpring8.3054314.29.272721.7237.38
S03XiyingResidual sandy claySWSurface river8.1742220.08.971910.101.20
S04DashuijingLimestone and dolomitic limestoneKWWell 200 m in depth7.4969714.65.753020.6616.52
S05JiuquResidual sandy claySWSurface river7.9065317.28.602800.6620.96
S06DafoLimestone, marl, and limestone intercalated with little shaleKWSpring7.3569315.07.732901.2230.75
S07ShiyaoGneissMWWell 10 m in depth7.5175117.36.303242.4937.06
S08LiubuResidual sandy claySWSurface river8.0950615.110.702210.9316.68
S09Beigao’erLimestone, marl, and limestone intercalated with little shaleKWSpring7.5075515.58.363342.1950.47
S10MenyaResidual sandy claySWSurface river8.0851319.714.632501.7015.86
S11Wohushan IResidual sandy claySWReservoir8.68103518.111.774555.9512.71
S12Wohushan IISurface waterSWReservoir8.52104417.410.274505.6911.96
S13Wohushan IIIResidual sandy claySWReservoir8.29105115.98.774553.8711.43
S14Cuijia IResidual sandy clayLWWell 6 m in depth7.27111015.44.634771.3020.72
S15Cuijia IILimestone, marl, and limestone intercalated with little shaleKWSpring7.9055714.49.902410.4618.66
S16ZhaikePiedmont alluvial plainSWSurface river8.5897119.412.164183.107.69
S17Zhai’ertou ILimestone, marl, and limestone intercalated with little shaleKWWell 262 m in depth7.6467117.28.602881.4832.00
S18Zhai’ertou IIPiedmont alluvial plainSWSurface river8.2099216.310.202562.567.37
S19Eastern KemaPiedmont alluvial plainLWWell 26 m in depth7.81128018.38.955500.829.08
S20XiangjiazhuangLimestone, marl, and limestone intercalated with little shaleKWWell 329 m in depth7.4080115.27.013470.8872.44
S21Western KemaPiedmont alluvial plainSWSurface river9.34164719.110.807014.801.08
S22CuimazhuangPiedmont alluvial plainSWSurface river9.06163519.210.636966.574.17
* SW: surface water; KW: karst groundwater; MW: metamorphic rock groundwater; LW: loose sediment groundwater; ** electrical conductivity.
Table 2. The fluorescence characteristics of the three fluorophores in the Yufuhe River.
ComponentsTypeEx/Em
This StudyReference
C1Tyrosine of protein-like300(245)/345275/310 [44]
275(220)/315 [45]
270–290/300–320 [46,47]
C2Tryptophan of protein-like<225(275)/340275/340 [42,44,48]
270–290/300–350 [46,47]
C3UV-fulvic acid
(FA-like)
235/414240–270/370–440 [47]
235–255/410–450 [46]
235–255/410–450 [49]
230/430 [42]
260/380–460 [42]
Table 3. The distribution of the three main dissolved organic matter (DOM) fluorescent components in the Yufuhe River water.
Water TypeSampling PointAbsolute Value (a.u.)Relative Value (%)
DOM ComponentC1C2C3C1C2C3
Ex (nm)300(245)<225(275)235300(245)<225(275)235
Em (nm)345340414345340414
KWS010.001071.790.0098.41.64
S029.2048.43.1915.179.65.24
S0411740.32.0773.425.31.30
S0672.275.21.1248.650.60.75
S091281054.3253.944.31.82
S150.0094.83.820.0096.13.87
S173.2661.83.994.7289.55.77
S209.4934.63.6819.972.47.71
Avg.42.471.02.9927.069.53.51
SWS030.001299.580.0093.16.91
S058.6253.04.0713.180.76.20
S082.3360.04.503.5089.86.75
S101.791014.191.6794.43.91
S112.399311.72.2386.910.92
S136.1013312.24.0387.98.08
S161.3912313.51.0089.29.79
S180.8612313.30.6389.79.65
S2111.412419.77.3679.912.7
S2210.614620.75.9582.411.7
Avg.4.5410711.43.9587.48.66
MWS075.1454.67.147.6881.710.7
LWS143.811084.993.2792.44.28
S196.45927.146.1187.16.76
Avg.5.131006.064.6989.85.52
Table 4. The FI (fluorescence intensity) value of FDOM (fluorescence of DOM) in Yufuhe River water.
Water TypeSampling PointEx (370 nm)FI
Em (450 nm)Em (500 nm)
KWS0154.129.21.85
S0210247.62.15
S0412060.11.97
S0672.736.22.01
S0910856.91.89
S1511361.41.84
S1711561.61.86
S2012262.21.97
Avg.101 ± 22.952.0 ± 12.11.94 ± 0.1
SWS032451521.61
S0512575.11.66
S0816696.41.72
S1012265.71.85
S112611521.72
S132741641.67
S163502041.72
S183461981.75
S214722861.65
S224532711.67
Avg.281 ± 118.2166 ± 71.71.70 ± 0.1
MWS071971061.86
LWS1414070.21.99
S1916788.51.88
Avg.153 ± 13.579.3 ± 9.21.94 ± 0.1
Table 5. The relationship between the hydrochemistry parameters and the three fluorescent components.
pHECTDOTDSTurbidityNO3C1 ***C2 ***C3 ***
pH1
EC0.568 **1
T0.581 **0.3801
DO0.694 **0.0970.569 **1
TDS0.564 **0.964 **0.3990.0961
Turbidity0.746 **0.735 **0.4200.4090.728 **1
NO3−0.602 **−0.353−0.527 *−0.417−0.301−0.3111
C1−0.406−0.142−0.434 *−0.416−0.114−0.1980.3881
C20.3020.0350.3630.3830.0140.082−0.362−0.987 **1
C30.738 **0.626 **0.579 **0.3720.574 **0.700 **−0.321−0.551 **0.4101
* The correlation was significant at the level of 0.05. ** The correlation was significant at the level of 0.01. *** C1, C2 and C3 represent component 1 (tyrosine-like substance), component 2 (tryptophan-like substance), and component 3 (ultraviolet fulvic acid substances), respectively.
Table 6. The comparison of physicochemical parameters and fluorescence intensity between different water types.
UnitAbsolute Value (a.u.)Relative Value (%)EC (μS/cm)DO (mg/L)TDS (mg/L)Turbidity (NTU)
C1C2C3SumC1C2C3
KW in upstream65.3075.302.50143.0038.2059.702.156517.652890.85
MW in upstream5.1454.607.1467.007.6881.7010.677516.303242.49
SW in upstream3.1985.905.5995.004.5889.505.9452410.702361.30
RW *4.25113.0012.00129.003.1387.409.50104310.304554.91
SW in middle and downstream6.05129.0016.80152.003.7485.3010.96131111.005184.26
LW in middle and downstream5.13100.006.07111.004.6989.805.5211956.795141.06
KW in middle and downstream4.2564.003.8372.008.2086.005.786768.502920.94
* RW means reservoir water.

