Article

The First Comparisons of IMERG and the Downscaled Results Based on IMERG in Hydrological Utility over the Ganjiang River Basin

1
Institute of Remote Sensing and Geographical Information System, School of Earth and Space Sciences, Peking University, Beijing 100871, China
2
State Key Laboratory of Hydroscience and Engineering, Department of Hydraulic Engineering, Tsinghua University, Beijing 100874, China
3
State Key Laboratory of Simulation and Regulation of Water Cycle in River Basin, Research Center on Flood & Drought Disaster Reduction of the Ministry of Water Resources, China Institute of Water Resources and Hydropower Research, Beijing 100038, China
4
College of Big Data and Information Engineering, Guizhou University, Guiyang 550025, China
5
Guizhou Provincial Key Laboratory for Information System of Mountainous Areas and Protection of Ecological Environment, Guizhou Normal University, Guiyang 550001, China
6
School of Civil Engineering and Environmental Science, University of Oklahoma, Norman, OK 73019, USA
*
Authors to whom correspondence should be addressed.
Water 2018, 10(10), 1392; https://doi.org/10.3390/w10101392
Submission received: 1 August 2018 / Revised: 20 September 2018 / Accepted: 22 September 2018 / Published: 7 October 2018
(This article belongs to the Section Hydrology)

Abstract

:
Rainfall information is a prerequisite to and plays a vital role in driving hydrological models. However, limited by the observation methods, the obtained precipitation data, at present, are still too coarse. In this study, a new downscaling method was proposed to obtain high spatial resolution (~1 km/hourly) precipitation estimates based on Integrated Multi-satellitE Retrievals for GPM (IMERG) data at hourly scale. Compared with original IMERG data, the downscaled precipitation results showed the similar spatial patterns with those of original IMERG data, but with finer spatial resolution. In addition, the downscaled precipitation estimates were further analyzed to quantify their improvements using the Coupled Routing and Excess STorage (CREST) model across Ganjiang River basin. Compared with the observed streamflow, the downscaled precipitation results showed satisfying hydrological performance, with Nash-Sutcliffe Coefficient of Efficiency (NSCE), Root Mean Square Error (RMSE), Relative Bias (BIAS), and Correlation Coefficient (CC). The improvement in terms of four statistic metrics in terms of streamflow simulation also indicated great potential of hydrological utility for the downscaled precipitation results.

1. Introduction

The frequency and intensity of extreme rainfall events and severe storms present an increasing trend during recent years, resulting in disastrous floods and landslides, which pose great threats to personal security and the economy [1,2]. Distributed hydrologic models play irreplaceable roles in studying various hydrological variables and important hydrologic process at various scales and thus provide helpful information for water resources management, and disaster prediction (e.g., floods) [3,4]. Precipitation is the most important meteorological input to hydrological models and its quality and tempo-spatial resolutions significantly affect the models’ performances [5,6,7,8].
It has been a great challenge to measure the surface precipitation, due to its significant variability both spatially and temporally [9,10,11]. At present, there are mainly three approaches to obtain the rainfall information: (1) rain gauges, (2) ground-based weather radars, and (3) satellite sensors. Rain gauges provide point-based surface rainfall data, which have been always interpolated into gridded precipitation estimates for hydrological and related studies [8,12]. In this case, the density of the rain gauges significantly affects the quality of the interpolated results, especially over the remote regions with limited rain gauge networks and complex topography [12,13,14,15,16]. Compared with traditional rain gauges, ground-based radars can obtain rainfall observations with near continuous representations of spatial and temporal variability, as well as with well captures of the 3-D distribution of the rainfall, over a relatively larger coverage [4,17], which makes it possible to provide radar quantitative precipitation estimates for hydrological applications at basin scale [8,18,19]. However, due to the beam blockage, radar systems still could not meet the demands in hydrologic applications, especially over the regions with complex topography [20,21]. Compared with ground-based rain gauges and radars, satellite-based remote sensors are born in providing gridded precipitation estimates without being affected by the topography (Joyce et al., 2004). During the last three decades, various satellite-based precipitation estimates have been generated and delivered after a series of launched projects, e.g., the Tropical Rainfall Measuring Mission (TRMM) [22,23], and Global Precipitation Measurement (GPM) [24].
Although these current satellite-based precipitation estimates, Precipitation Estimation from Remotely Sensed Information using Artificial Neural Networks-Cloud Classification System (PERSIANN-CCS) [25], TRMM Multisatellite Precipitation Analysis (TMPA) data [26], Climate Precipitation Center Morphing technique (CMORPH) data [27], IMERG [24], provide relatively much more precipitation information for areas with limited rain gauges, their spatial resolutions (e.g., 0.1–0.25°) are still coarse for driving hydrological and meteorological models at basin scale [6,28]. To meet such requirements, downscaling strategy based on these satellite-based precipitation estimates is an optimal approach to acquire precipitation estimates at finer spatial scales [29,30,31]. As the TMPA provides the “best” precipitation estimates in the TRMM era [32,33], a wide range of research conducted downscaling work on TMPA data. Immerzeel et al. [34] introduced an exponential model to downscale TMPA 3B43 V7 based on the relationship between precipitation and the normalized difference vegetation index (NDVI). Jia et al. [35] applied a multiple linear regression model to downscale TMPA data in the Qaidam Basin, using both the NDVI and the digital elevation model (DEM). To acquire downscaled results with better accuracy, Duan et al. [36] proposed two calibration algorithms (geographical difference analysis: GDA; geographical ratio analysis: GRA) for calibrating TMPA data using rain gauge observations on the downscaled results. While Xu et al. [37] introduced a moving window regression method (geographically weighted regression, GWR) to simulate the spatially varied relationships between precipitation and the NDVI and/or DEM, and then downscaled the TMPA data. Based on the work done by Xu et al. [37], Ma et al. [15,16] introduced a spatial data mining algorithm to obtain downscaled results with the effects of systematic anomalies removed, incorporating various land surface characteristics related to the spatial distribution of precipitation at annual scale.
As mentioned above, most of the current downscaling researches have been explored at climatological scales, such as monthly and annually. While almost no exploration has been investigated to downscale these satellite precipitation estimates at meteorological scales, e.g., at hourly scale, over regions with complex topography. As the successor of TRMM era, GPM provides a new generation of precipitation observations from space at 0.1°/half hour resolution since February 2014, while the resolution of TRMM TMPA data is 0.25°/3 hourly. To obtain hourly downscaled precipitation results, IMERG data is the prior choice, as the quality of the of IMERG data is better than that of the TMPA data, and IMERG can provide hourly precipitation estimates while TMPA not [38]. However, there are still two significant challenges using traditional methods to acquire hourly downscaled precipitation estimates based on IMERG data: (1) limited rainfall-related environmental variables (0.01° × 0.01°, hourly) used to downscale the IMERG data; and (2) far few rainfall pixels used for traditional regressing relationships between precipitation and environmental variables. In this case, most traditional or commonly used regression/empirical models and the state-of-art machine learning algorithms (such as Regression, Machine learning, Decision tree, Bayesian, Artificial neural network, Deep learning, Ensemble, Support vectors) are not suitable.
Motivated by the critical requirement to downscale IMERG data at hourly scale to obtain downscaled precipitation estimates with good quality, this study, specifically, proposed a geographically moving window technique to obtain downscaled precipitation estimates at hourly scale based on the IMERG V4 data, and then, both the original IMERG data, and the downscaled product were used to drive the distributed hydrological model to explore their capability in hydrological modeling.

2. Study Area and Materials
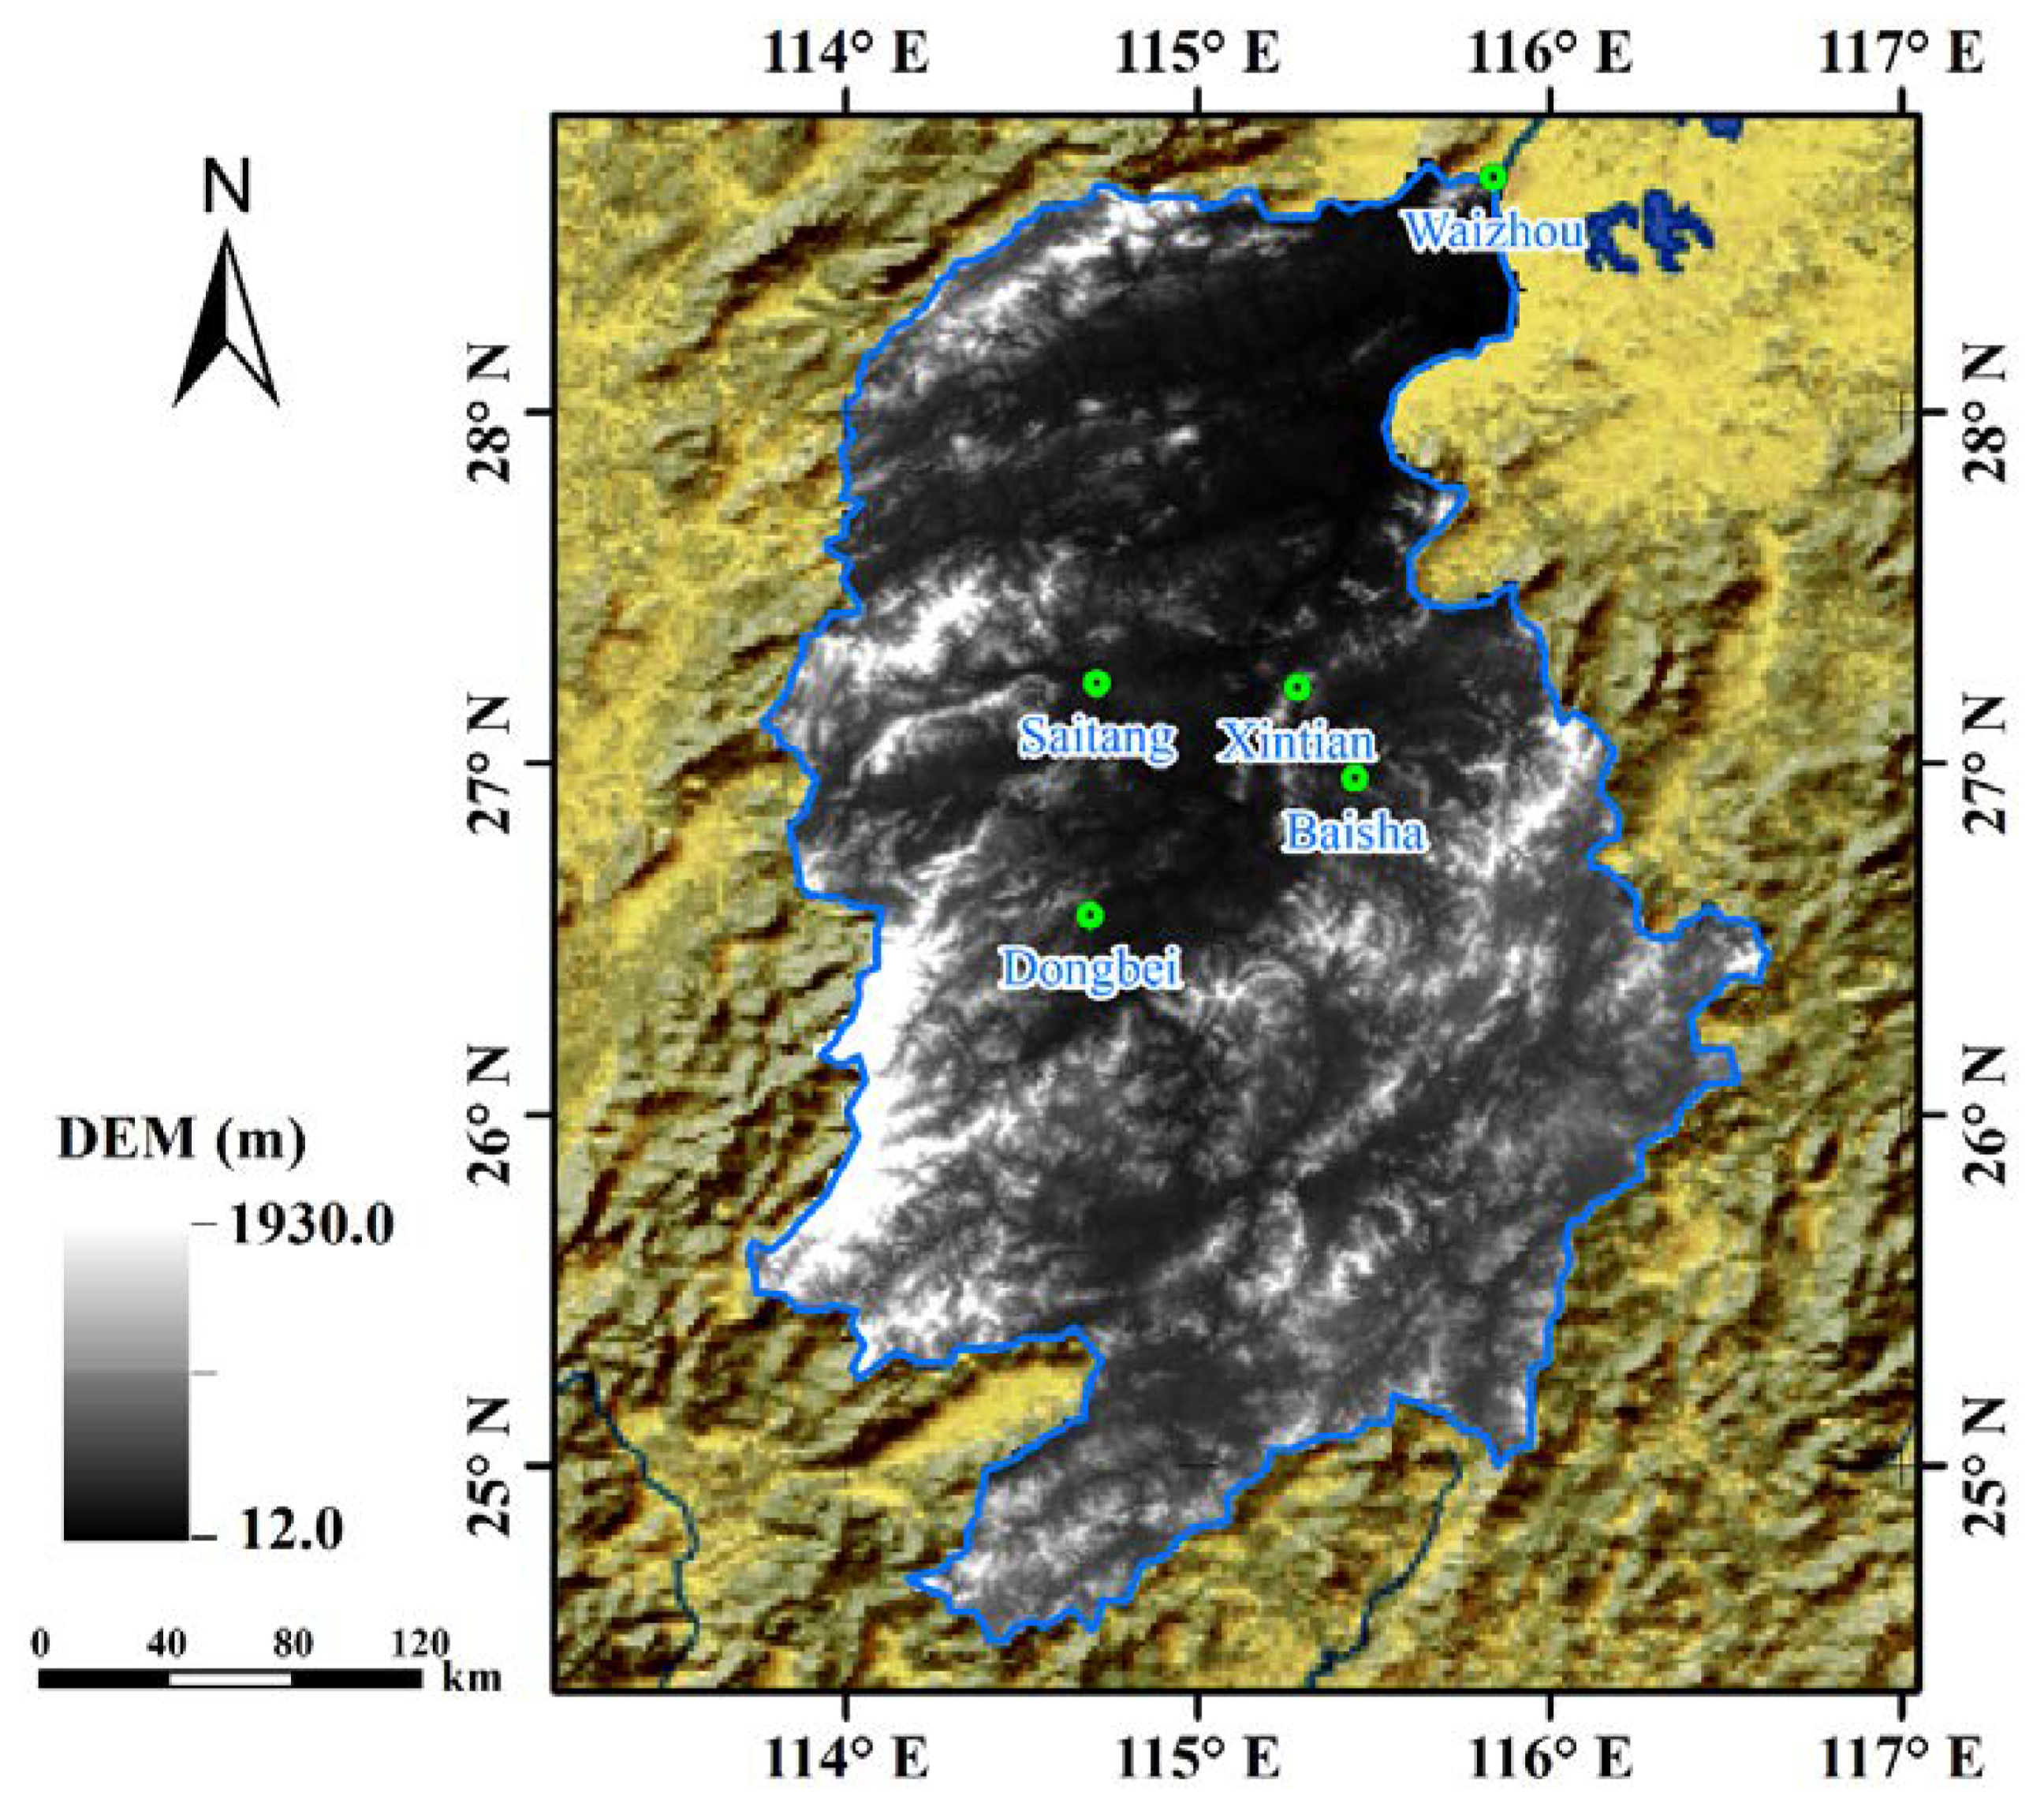
2.1. Study Area

As the seventh largest branch of the Yangtze River, Ganjiang River basin is located within 113°30′–116°40′ E and 24°29′–29°21′ N (Figure 1), Jiangxi province, China. The total drainage area of the Ganjiang River basin is 81,158 km2 above the Waizhou hydrologic station, which is the outlet of the basin. The topography of this basin is complex with elevation varying from 12 to 1930 m. The northwestern and eastern Ganjiang River basin are bordered by Jiuling mountain and Wuyi mountain, respectively.
With moderate climate and sufficient rainfall, the Ganjiang River basin is one of the typical rainstorm regions in China. The average annual rainfall is around 1500 mm. Over 70% of the total rainfall is happening in the plum rain season, from April to June. The maximum precipitation usually happens in the northwest and east of the Ganjiang River basin during the rainy season. Affected by both of the complex terrain and the East Asian Monsoon, this region is a historically flood-prone region and receives frequently flood disasters.

2.2. The Hydrological Stations

As shown in Figure 1, hourly streamflow data are available at five hydrological stations, Waizhou, Baisha, Dongbei, Xintian, and Saitang, during the period from 1 May to 30 September 2014.

2.3. IMERG V4 Data

The GPM mission is an international network of satellites that provide the next-generation global observations of rain and snow, building upon the success of TRMM. The Integrated Multi-satellitE Retrievals for GPM (IMERG) product was created by inter-calibrating, merging and interpolating all satellite microwave precipitation estimates, together with microwave-calibrated infrared (IR) satellite estimates, precipitation gauge analyses, and potentially other precipitation estimators at finer scales from the TRMM and GPM eras over the entire globe. The IMERG system has three products: the “Early” run (4 h after observation), the “Late” run (12 h after observation) multi-satellite products, and the “Final” run (two months after the observation month) satellite-gauge product with best accuracy and quality starting from March 2014 [24]. The IMERG “Final” run product (0.1°/half-hourly) was used in this study, which was then accumulated to hourly resolution.

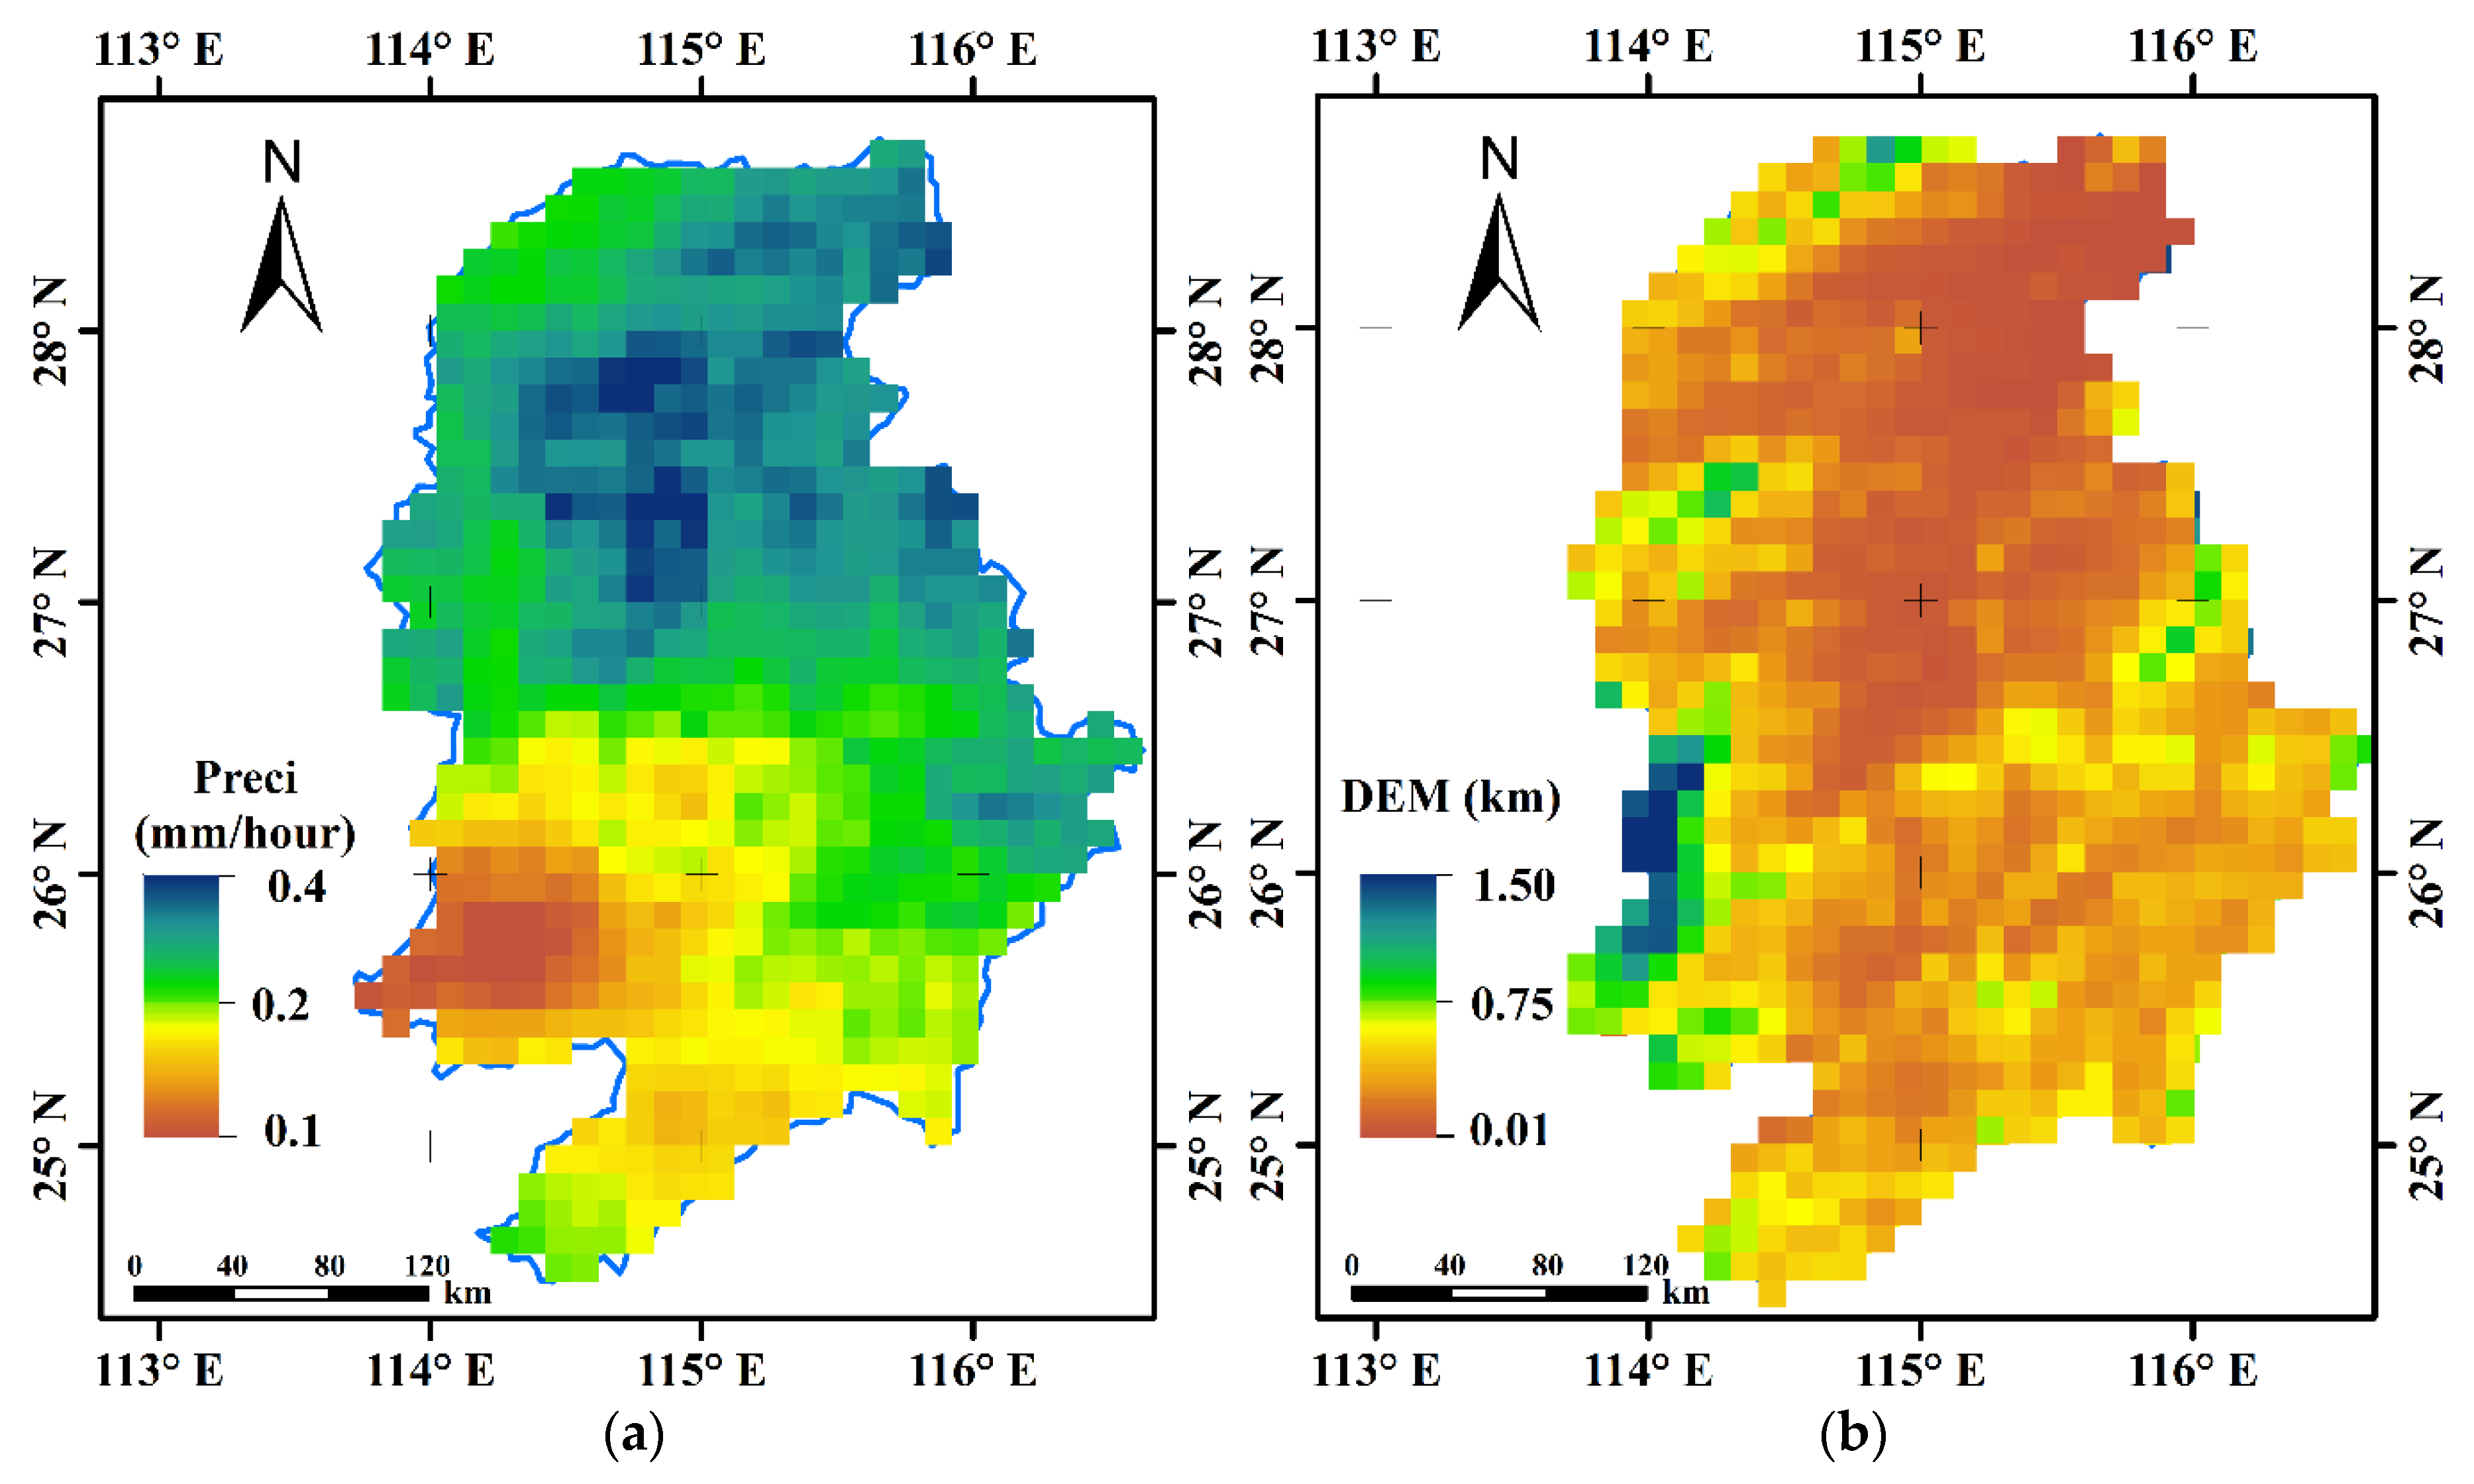
2.4. Topographical Characteristic

We collected DEM data from the Shuttle Radar Topography Mission (SRTM), which is operated by the National Geospatial-Intelligence Agency (NGA) and NASA, and provides high resolution DEMs between 56° S and 60° N globally [39]. DEM data were downloaded over the Ganjiang River basin at an original spatial resolution of 90 m, which was aggregated into results with 1 km.

3. Methods

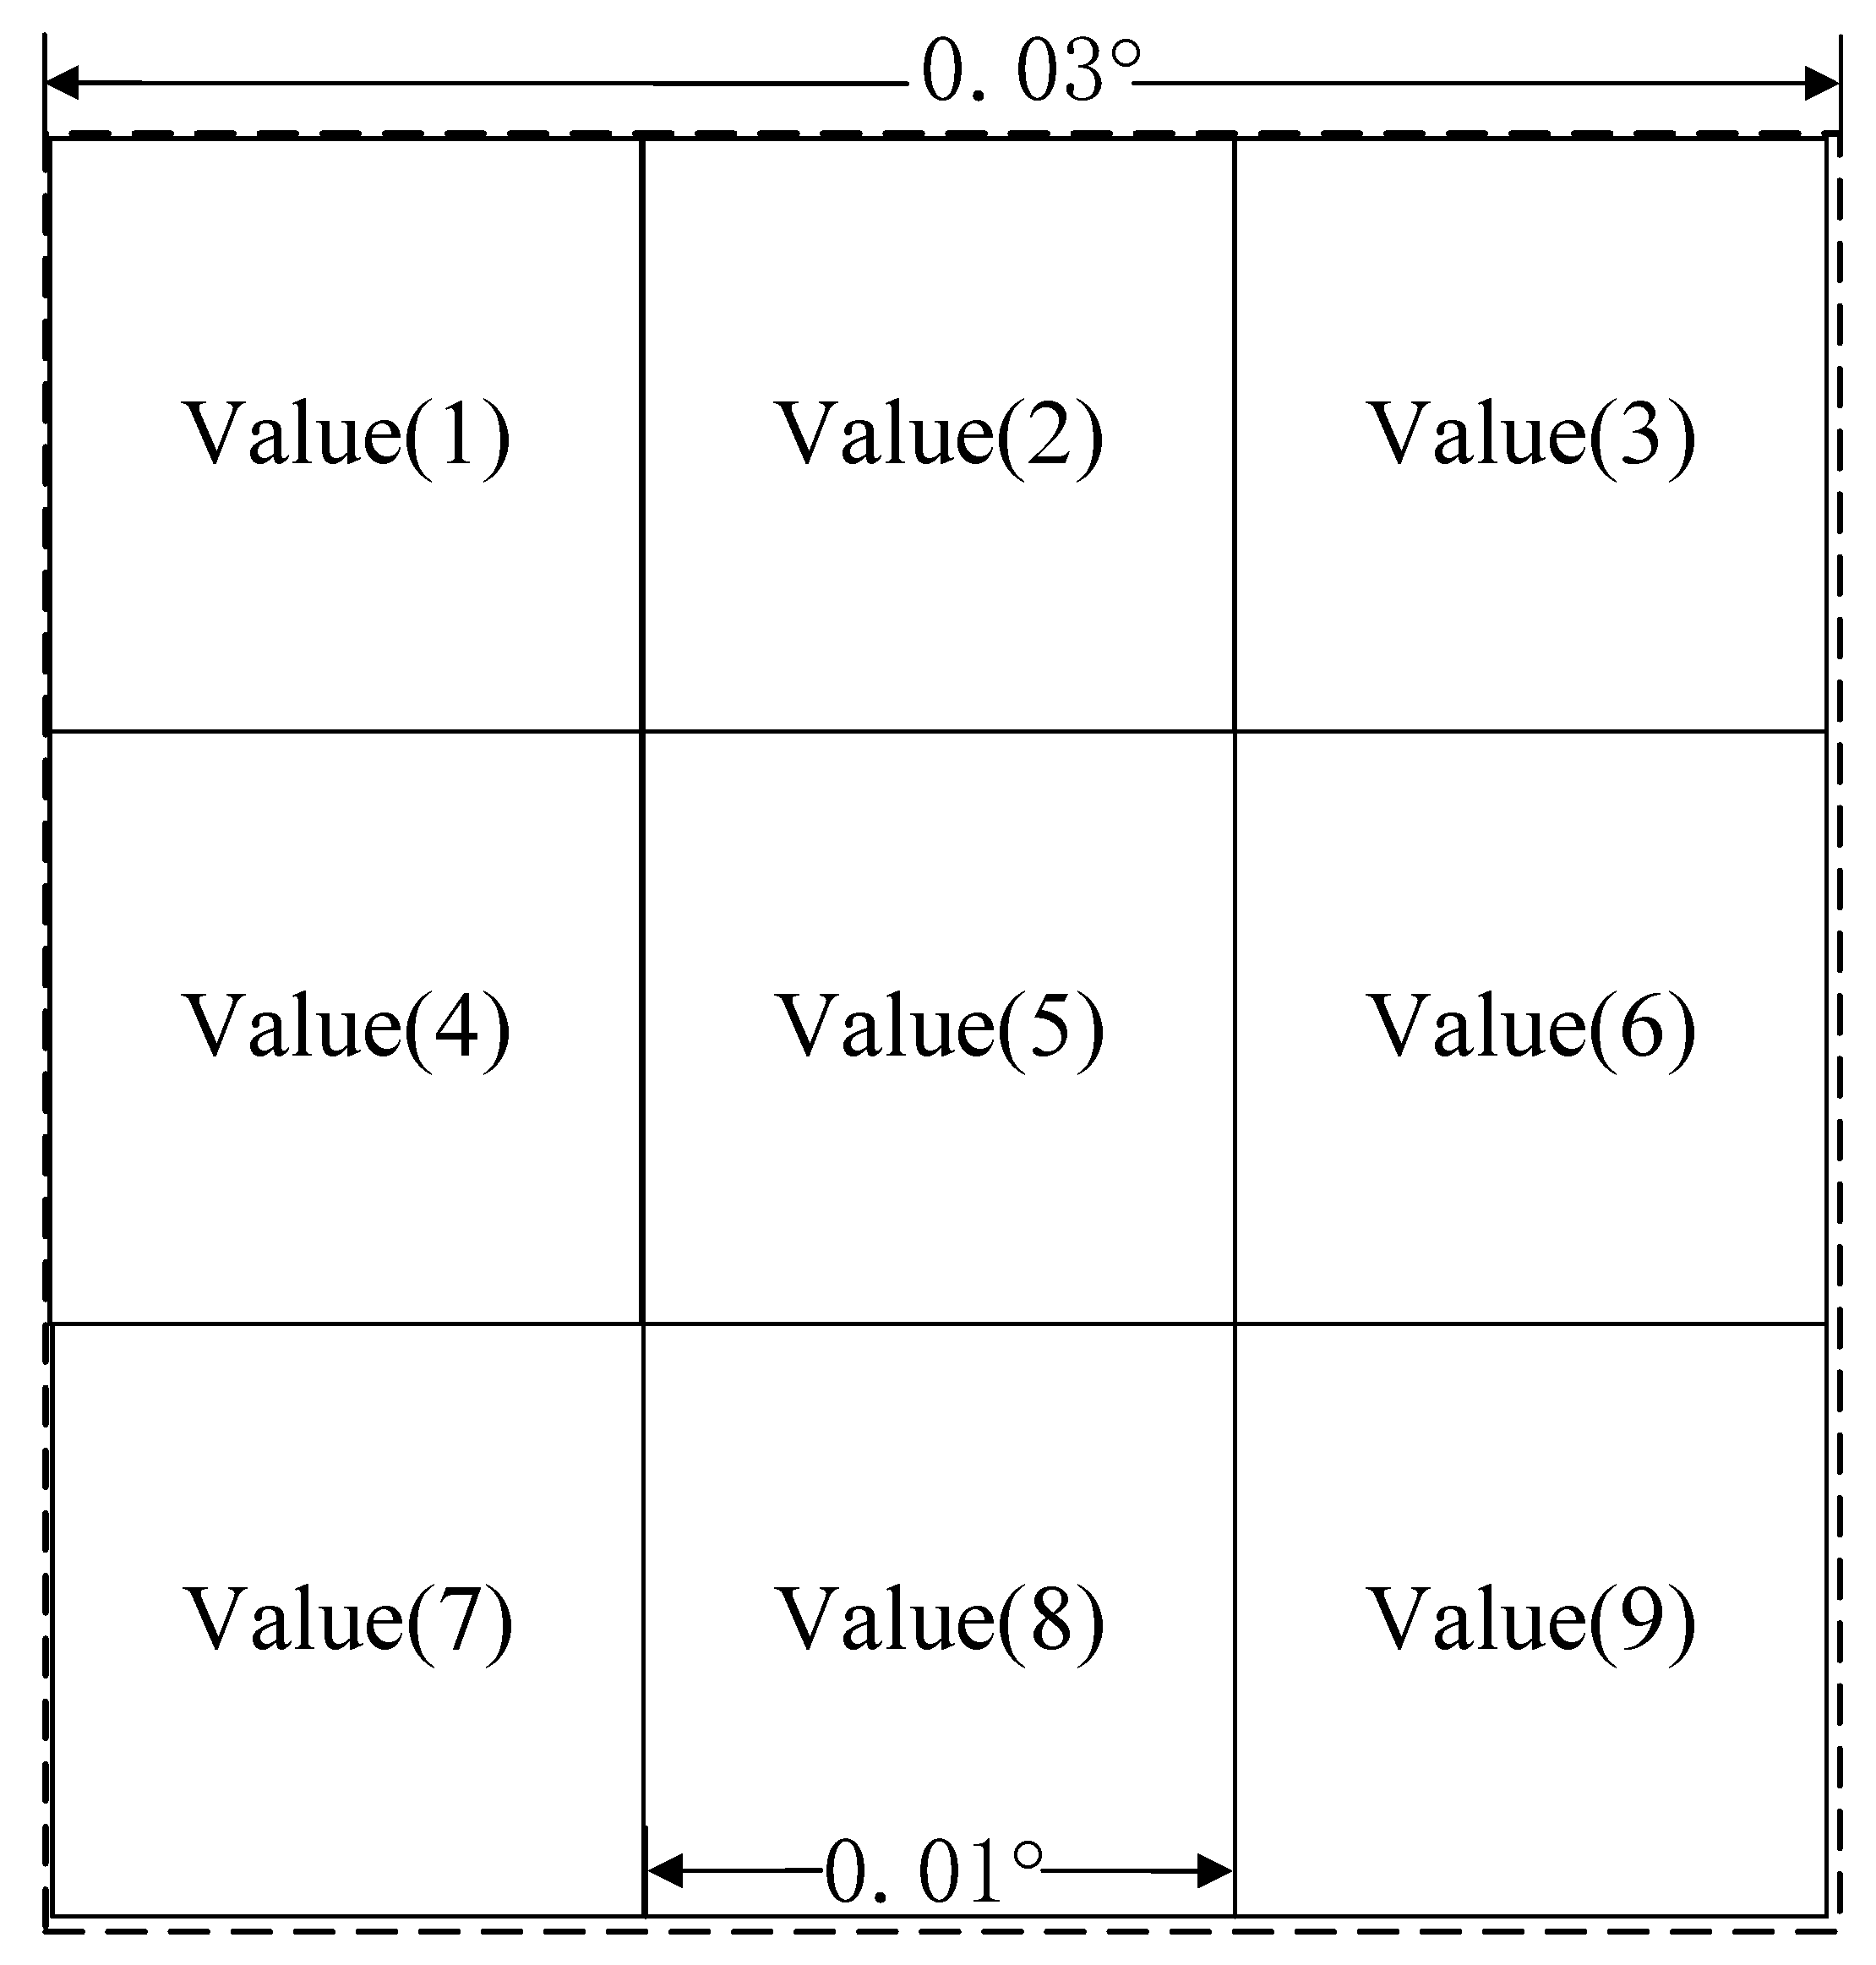
3.1. Geographically Moving Window Weight Disaggregation Analysis

Li et al. [8] pointed out that the maximum rainfall usually occurs over the northwestern (Jiuling mountian) and eastern (Wuyi mountain) Ganjiang River basin, which means topography affects the spatial distribution of rainfall (e.g., orographic rain) over this basin. As well as to cater the two great challenges, aforementioned above, of downscaling IMERG data at hourly scale, we proposed a new algorithm called Geographically Moving Window Weight Disaggregation Analysis (GMWWDA) to obtain the disaggregation weights based on DEM. In addition, the downscaled results would be obtained by disaggregating the IMERG data using the disaggregation weights (1 km).
The steps to obtain disaggregation weights using DEM based on the assumption that the volume of the precipitation is inversely proportional to DEM, which means there is a general trend that as the elevation rising, the volume of rainfall decreases [16,40]. Using the GMWWDA method, the size of the moving window was the first key parameter needed to be determined. In this study, we have tried a series of window sizes, for example, 3 by 3, 4 by 4, 5 by 5 etc. In addition, then the corresponding downscaled results were used to drive the hydrological model, while the downscaled results using other window sizes performed similar or even worse than the window size of 3 by 3. Therefore, the window size of 3 by 3 has been selected in this study, and illustrated in the downscaling procedures.
(i) Firstly, we obtained the weights of all the pixels in the current moving window, 3 by 3, using Equation (1),
W i = V a l u e ( i ) A v e r a g e
(ii) obtained the rank of central pixel according to the weights in the current window from high to low by Equation (1), shown as Equation (2),
Ranki = sort (Wi)
where the function sort () was adopted from the R language (http://www.r-project.org/).
(iii) the disaggregation weight based on DEM at the central pixel of the current window was obtained by Equation (3), according to the general opposite trend between DEM values and the rainfall volumes,
D W _ D E M = W ( N R a n k 5 + 1 )
where R a n k 5 represents the rank of the central pixel shown in Figure 2, while N is the window size, and W is the weight from Equation (1).

3.2. Main Downscaling Steps by Introducing GMWWDA

To downscale the coarse satellite-based precipitation estimates, IMERG, at hourly scale, GMWWDA was introduced as the core algorithm in this study, and the main sequential steps in the downscaling process were shown as below.
(1)
The 0.0083° arc DEM data were obtained and aggregated to 0.01° in raster format.
(2)
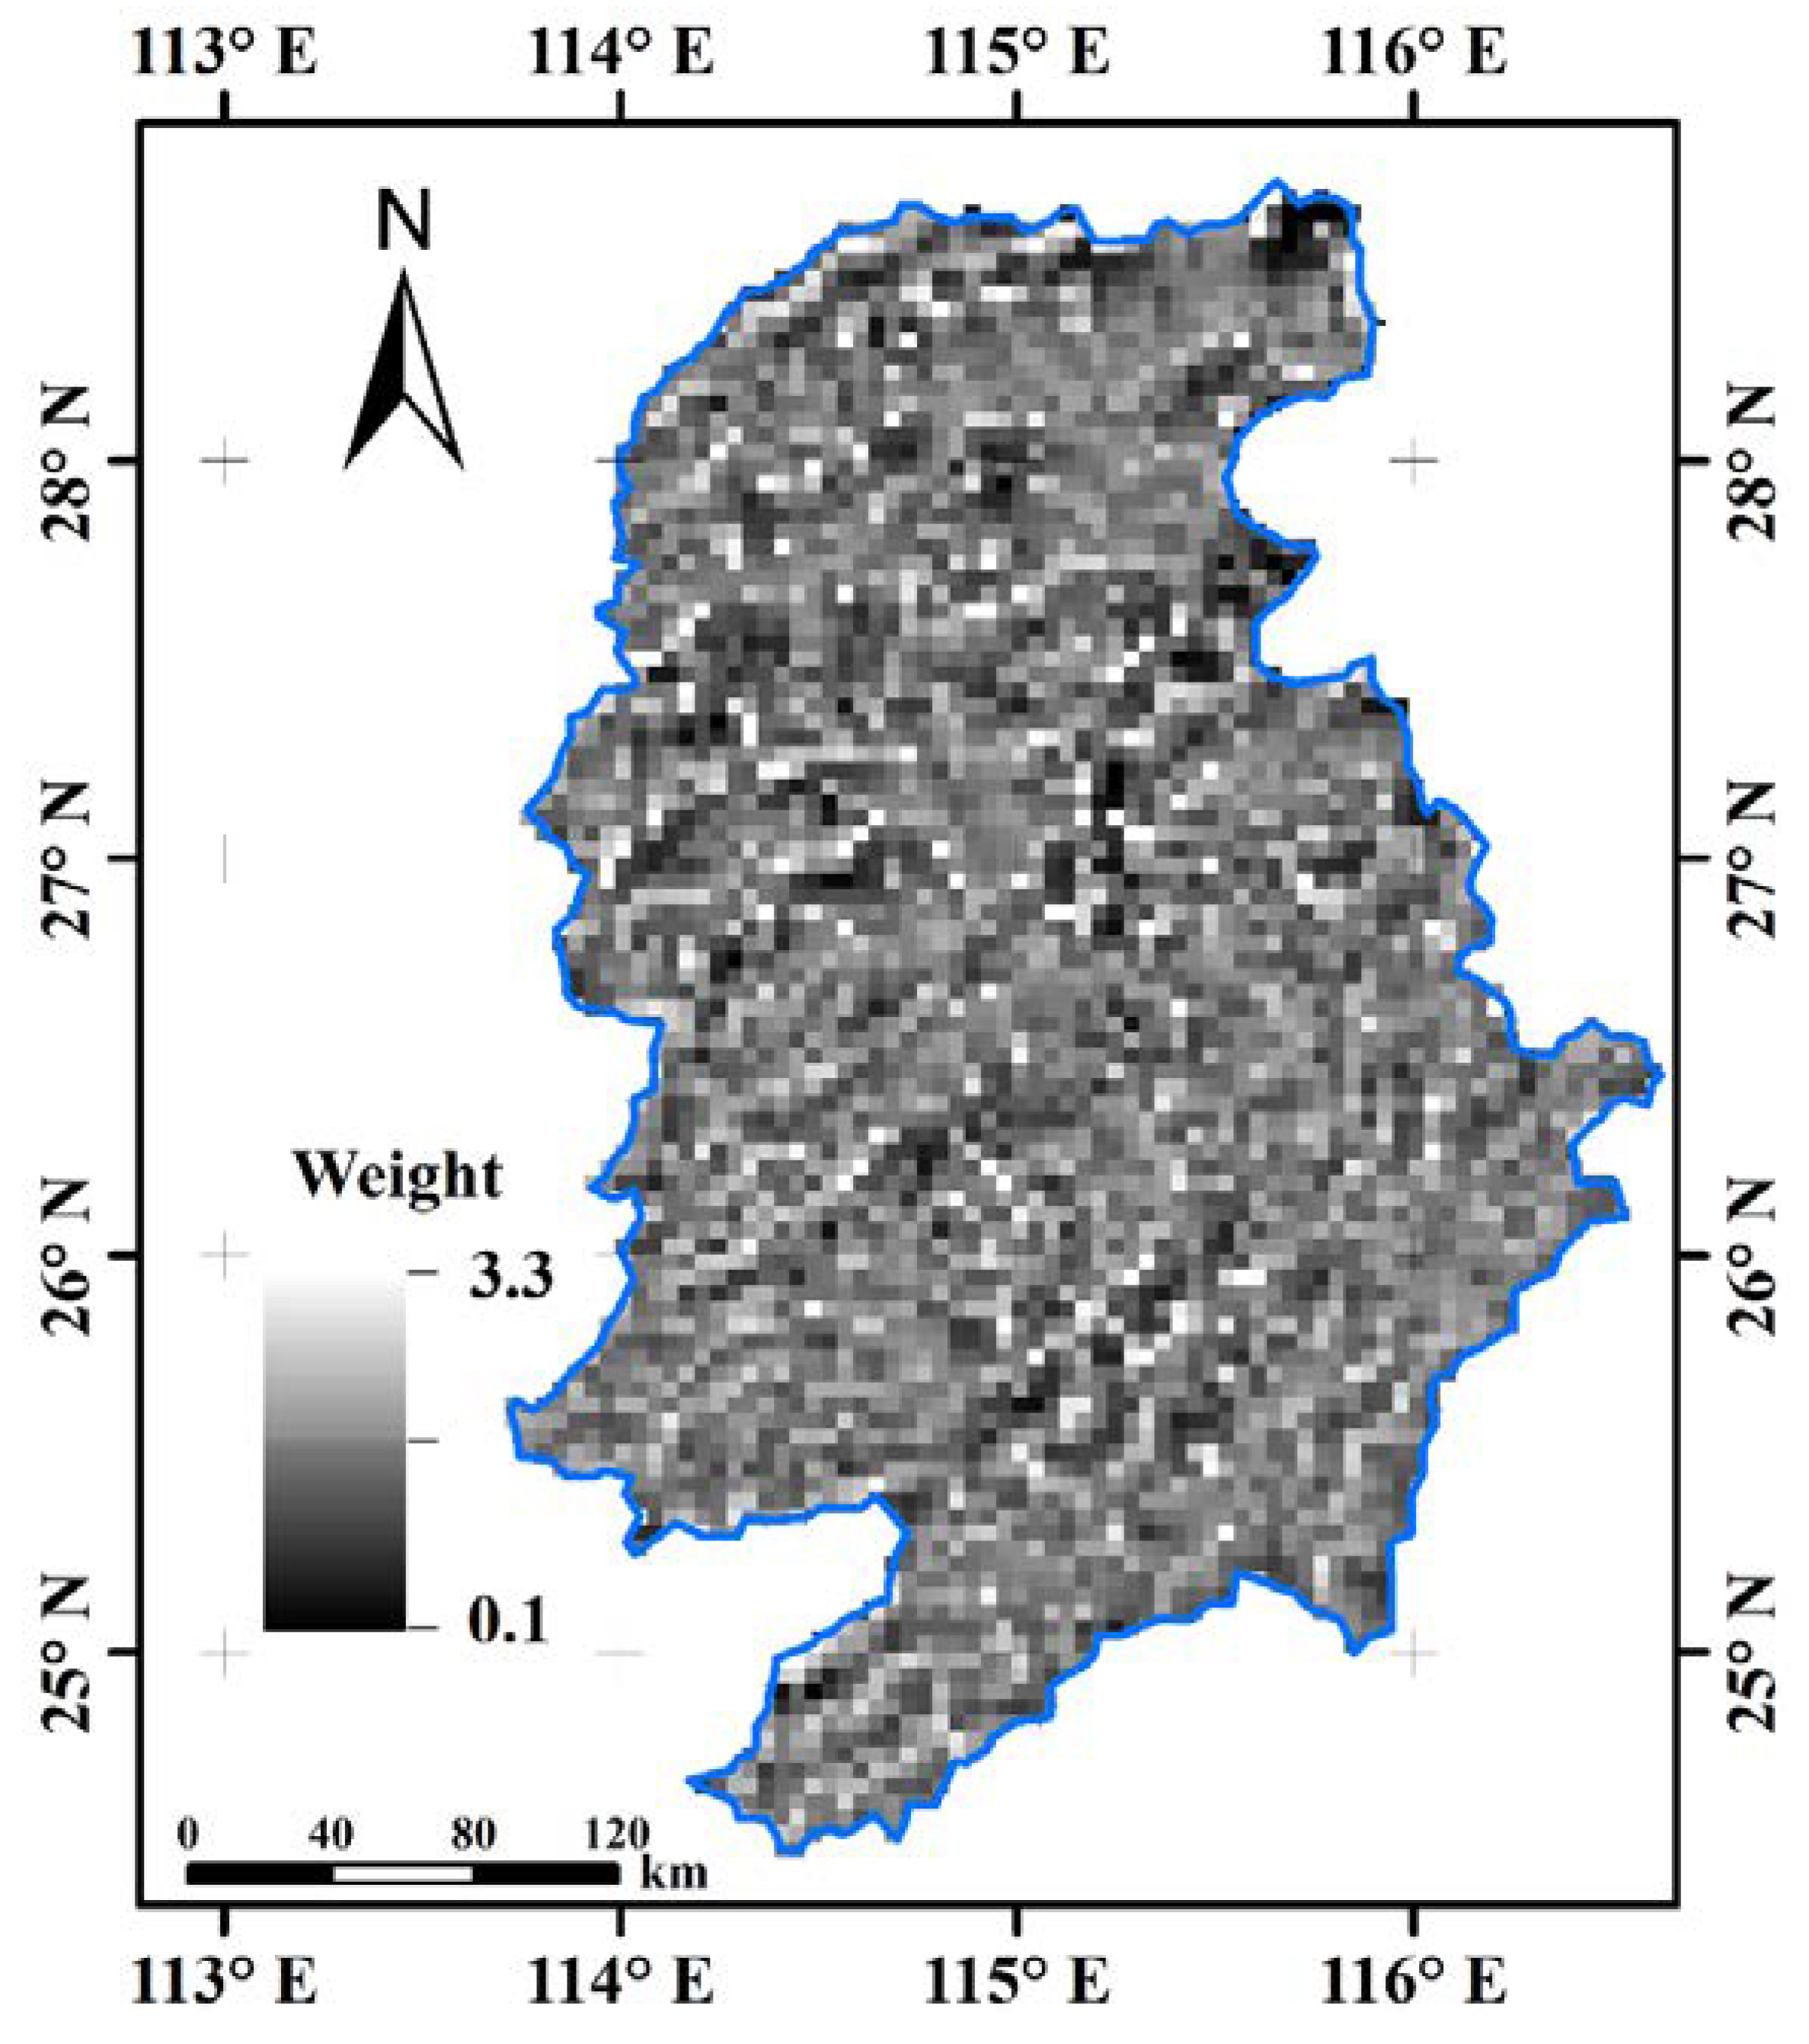
The disaggregation weights based on DEM were calculated according to the algorithms described in Section 3.1 and were constant at the temporal series.
(3)
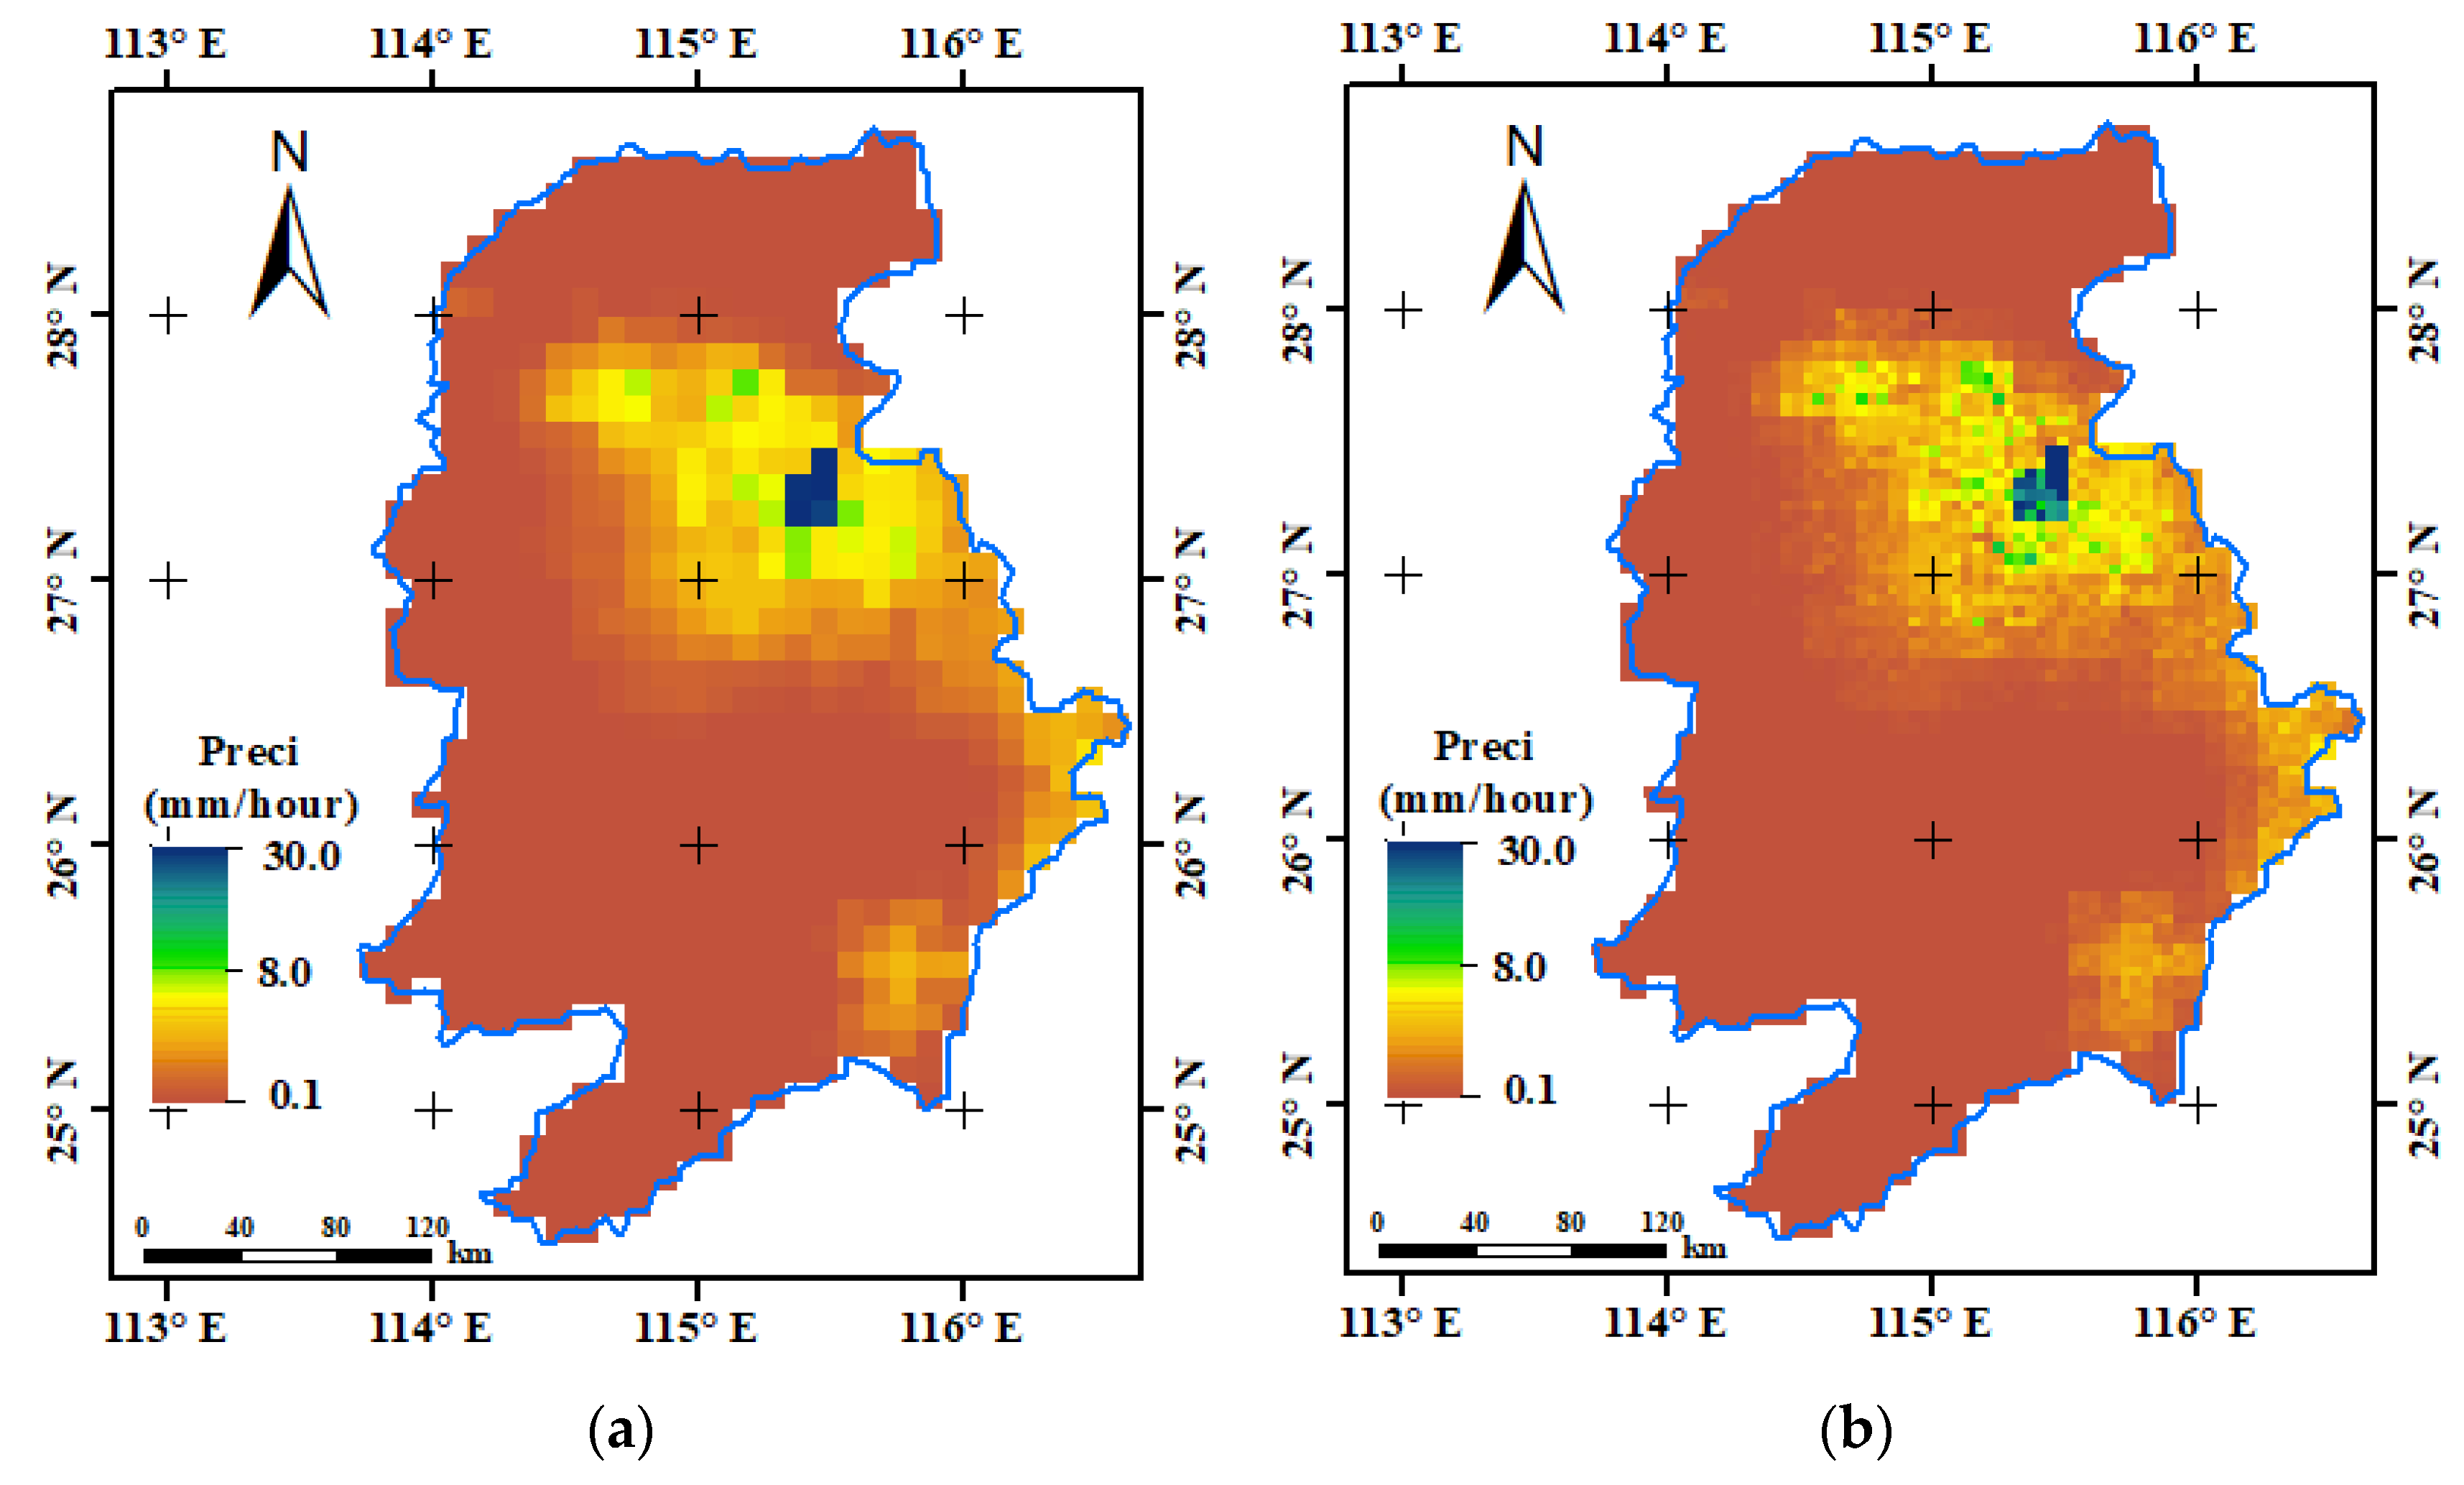
The disaggregation weights based on DEM were transformed from raster format (0.01°) into points, which were then used to extract precipitation information from IMERG data in raster (0.1°). Finally, the downscaled results based on only DEM were obtained by multiplying IMERG value at 0.01° spatial resolution with the corresponding disaggregation weights.

3.3. The CREST Hydrologic Model

The CREST hydrologic model is a hybrid modeling strategy, which was jointly developed by the Oklahoma and the NASA SERVIR Project Team [41]. The CREST model simulates the water cycle on a regular grid which could be defined by the user, and therefore it can be applied at various scales. CREST has been used in the Flooded Locations and Simulated Hydrographs Project (FLASH) and the Near Real-time Global hydrological Simulation and Flood Monitoring Demonstration System to provide online flood predictions and multi-scale basin applications. The CREST model also has many successful applications in many basins [40,42,43]. Kan et al. [28] developed an updated CREST model version 3.0, which mainly differs version 2.0 in following aspects: (1) switching from one soil layer to 3 soil layers, and adding 3-soil-layer tension water soil moisture and evapotranspiration computation; (2) using free water distribution curve to describe the sub-grid variations of free water storage; and (3) switching the flow concentration module into a 4-mechanisim-based cell-to-cell routing scheme, including overland flow, interflow, ground water, and open channel flow. In this study, we used CREST v3.0 to evaluate the hydrological performance of the IMERG products and downscaled results based on the IMERG data. The CREST model simulation was conducted at Ganjiang River basin, and other forcing data is similar with those in the study by Kan et al. [7]. The hourly observed streamflow data at five hydrological stations, namely Waizhou, Baisha, Dongbei, Xintian, and Saitang, during the period from 1 May to 30 September 2014 were used to do hydrological analysis.

3.4. Hydrological Utility of Downscaled Results

Both the original IMERG data (10 km/1 hourly) the downscaled results (1 km/1 hourly) in the period from 1 May to 30 September 2014, were used to force the hydrological model, CREST, to simulate the streamflow at the five hydrological stations. In addition, the four diagnostic statistics were used to assess the performances of the original IMERG data and the downscaled results.

3.5. Diagnostic Statistics

Several popularly used diagnostic statistics, correlation coefficient (CC), root mean square error (RMSE), mean absolute error (MAE), and Nash-Sutcliffe coefficient efficiency (NSCE) [8], were adopted in this study to quantitatively evaluate the quality of the IMERG product and downscaled results based on IMERG, at hourly temporal scale, in simulating the streamflow at five hydrological stations.

4. Results and Discussions

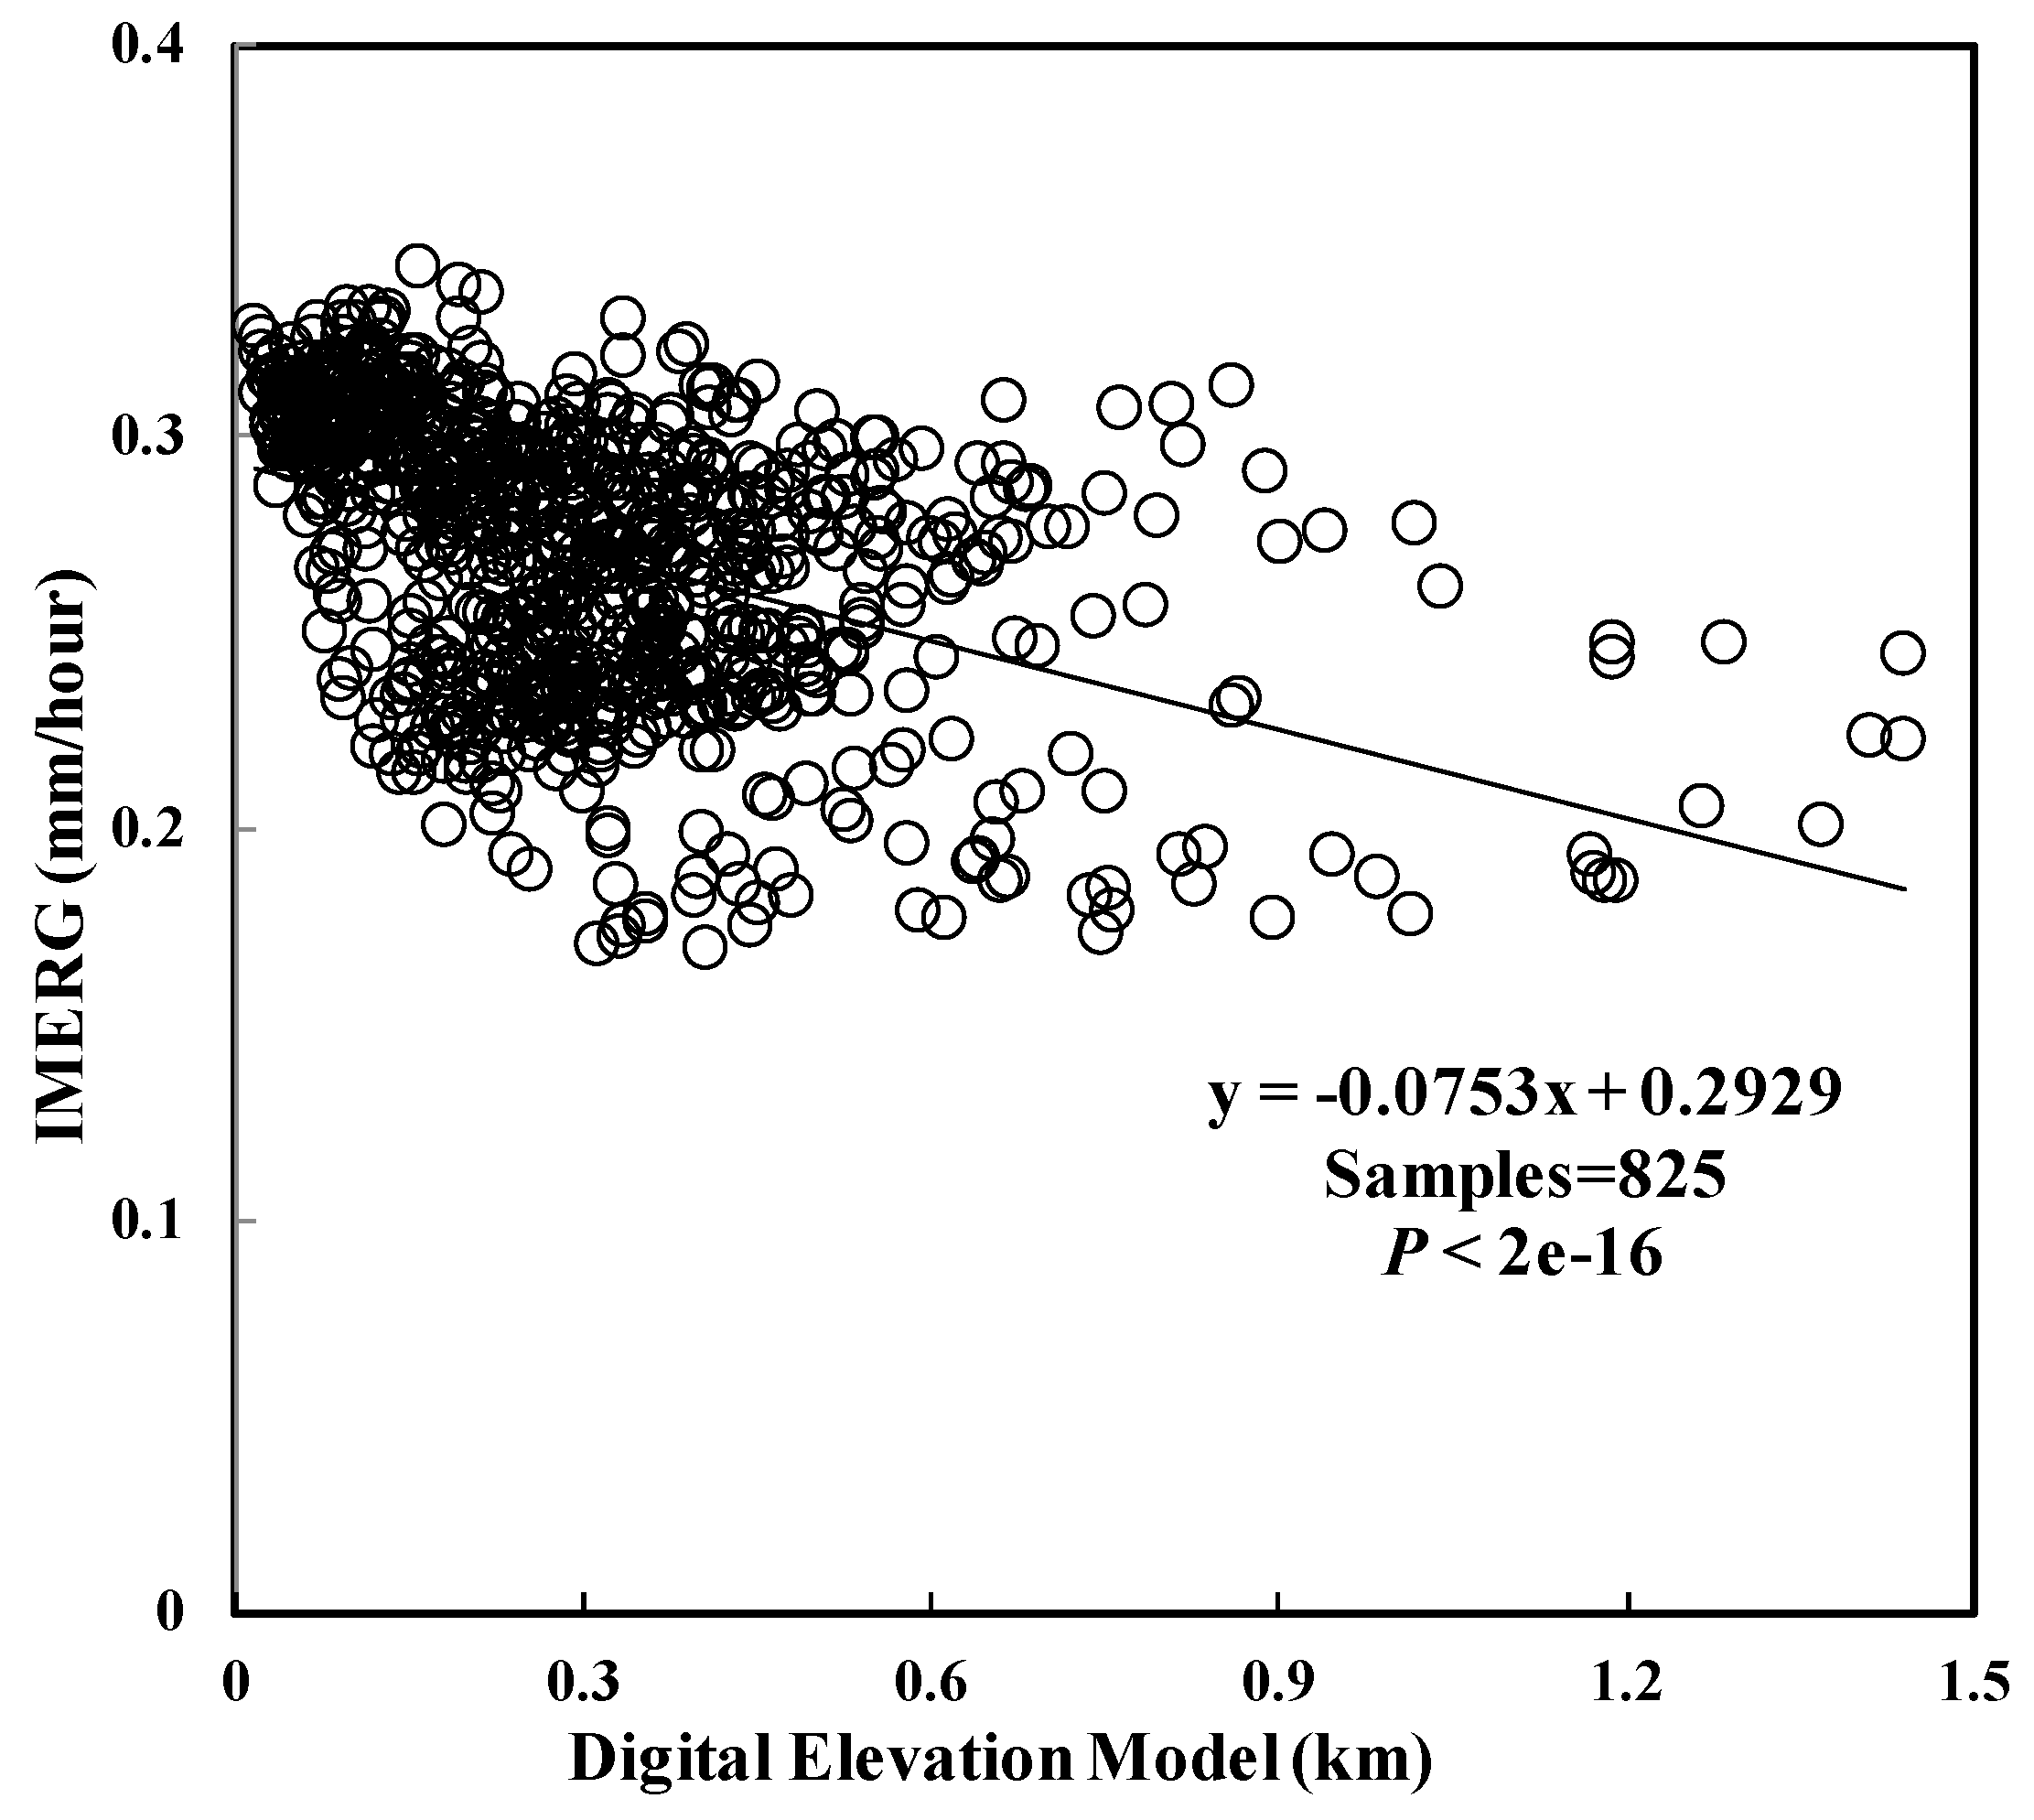
4.1. The Relationship between the IMERG and DEM over Ganjiang

To downscale the IMERG data at basin scale providing precipitation inputs with finer spatial resolution as well as quality, the relationship between precipitation and auxiliary data was critical and needed to be investigated firstly in the specific regions. In this study, the spatial patterns of mean hourly precipitation estimates measured by IMERG and DEM, with the spatial resolution of 0.1°, were shown in Figure 3. From southwest to northeast, there was an increasing trend of mean hourly precipitation estimates captured by IMERG, while the DEM demonstrated a decreasing trend. The spatial patterns of the precipitation and DEM exhibited an intuitively negative relationship.
There were 825 pixels of both IMERG and DEM at the resolution of 0.1°, over the Ganjiang basin. We explored the linear relationship between IMERG and DEM at this spatial scale in Figure 4. Similarly with those findings in Figure 3, the quantitatively relationship between IMERG and DEM was also negative. Over Ganjing basin, as the elevation rose 1 km, the precipitation decreased ~0.075 mm/hour, which also passed the significant test with p value less than 2 × 10⁻¹⁶. The relationship revealed from Figure 3 and Figure 4 explain the reasonability of the downscaling assumption that the volume of the precipitation is inversely proportional to DEM.

4.2. Disaggregation Weights Based on DEM

To obtain the downscaled results, the disaggregation weight is a perquisite. According to the proposed GMWWDA in this study, the disaggregation weights have been obtained, shown in Figure 5. Overall, the spatial patterns demonstrated some heterogeneous characteristics, for example, the values were relatively larger in the central Ganjiang River basin, where the DEM values were relatively smaller. The values of disaggregation weights vary from ~0.13 to ~3.34, with the average value ~0.96 and standard error ~0.27.

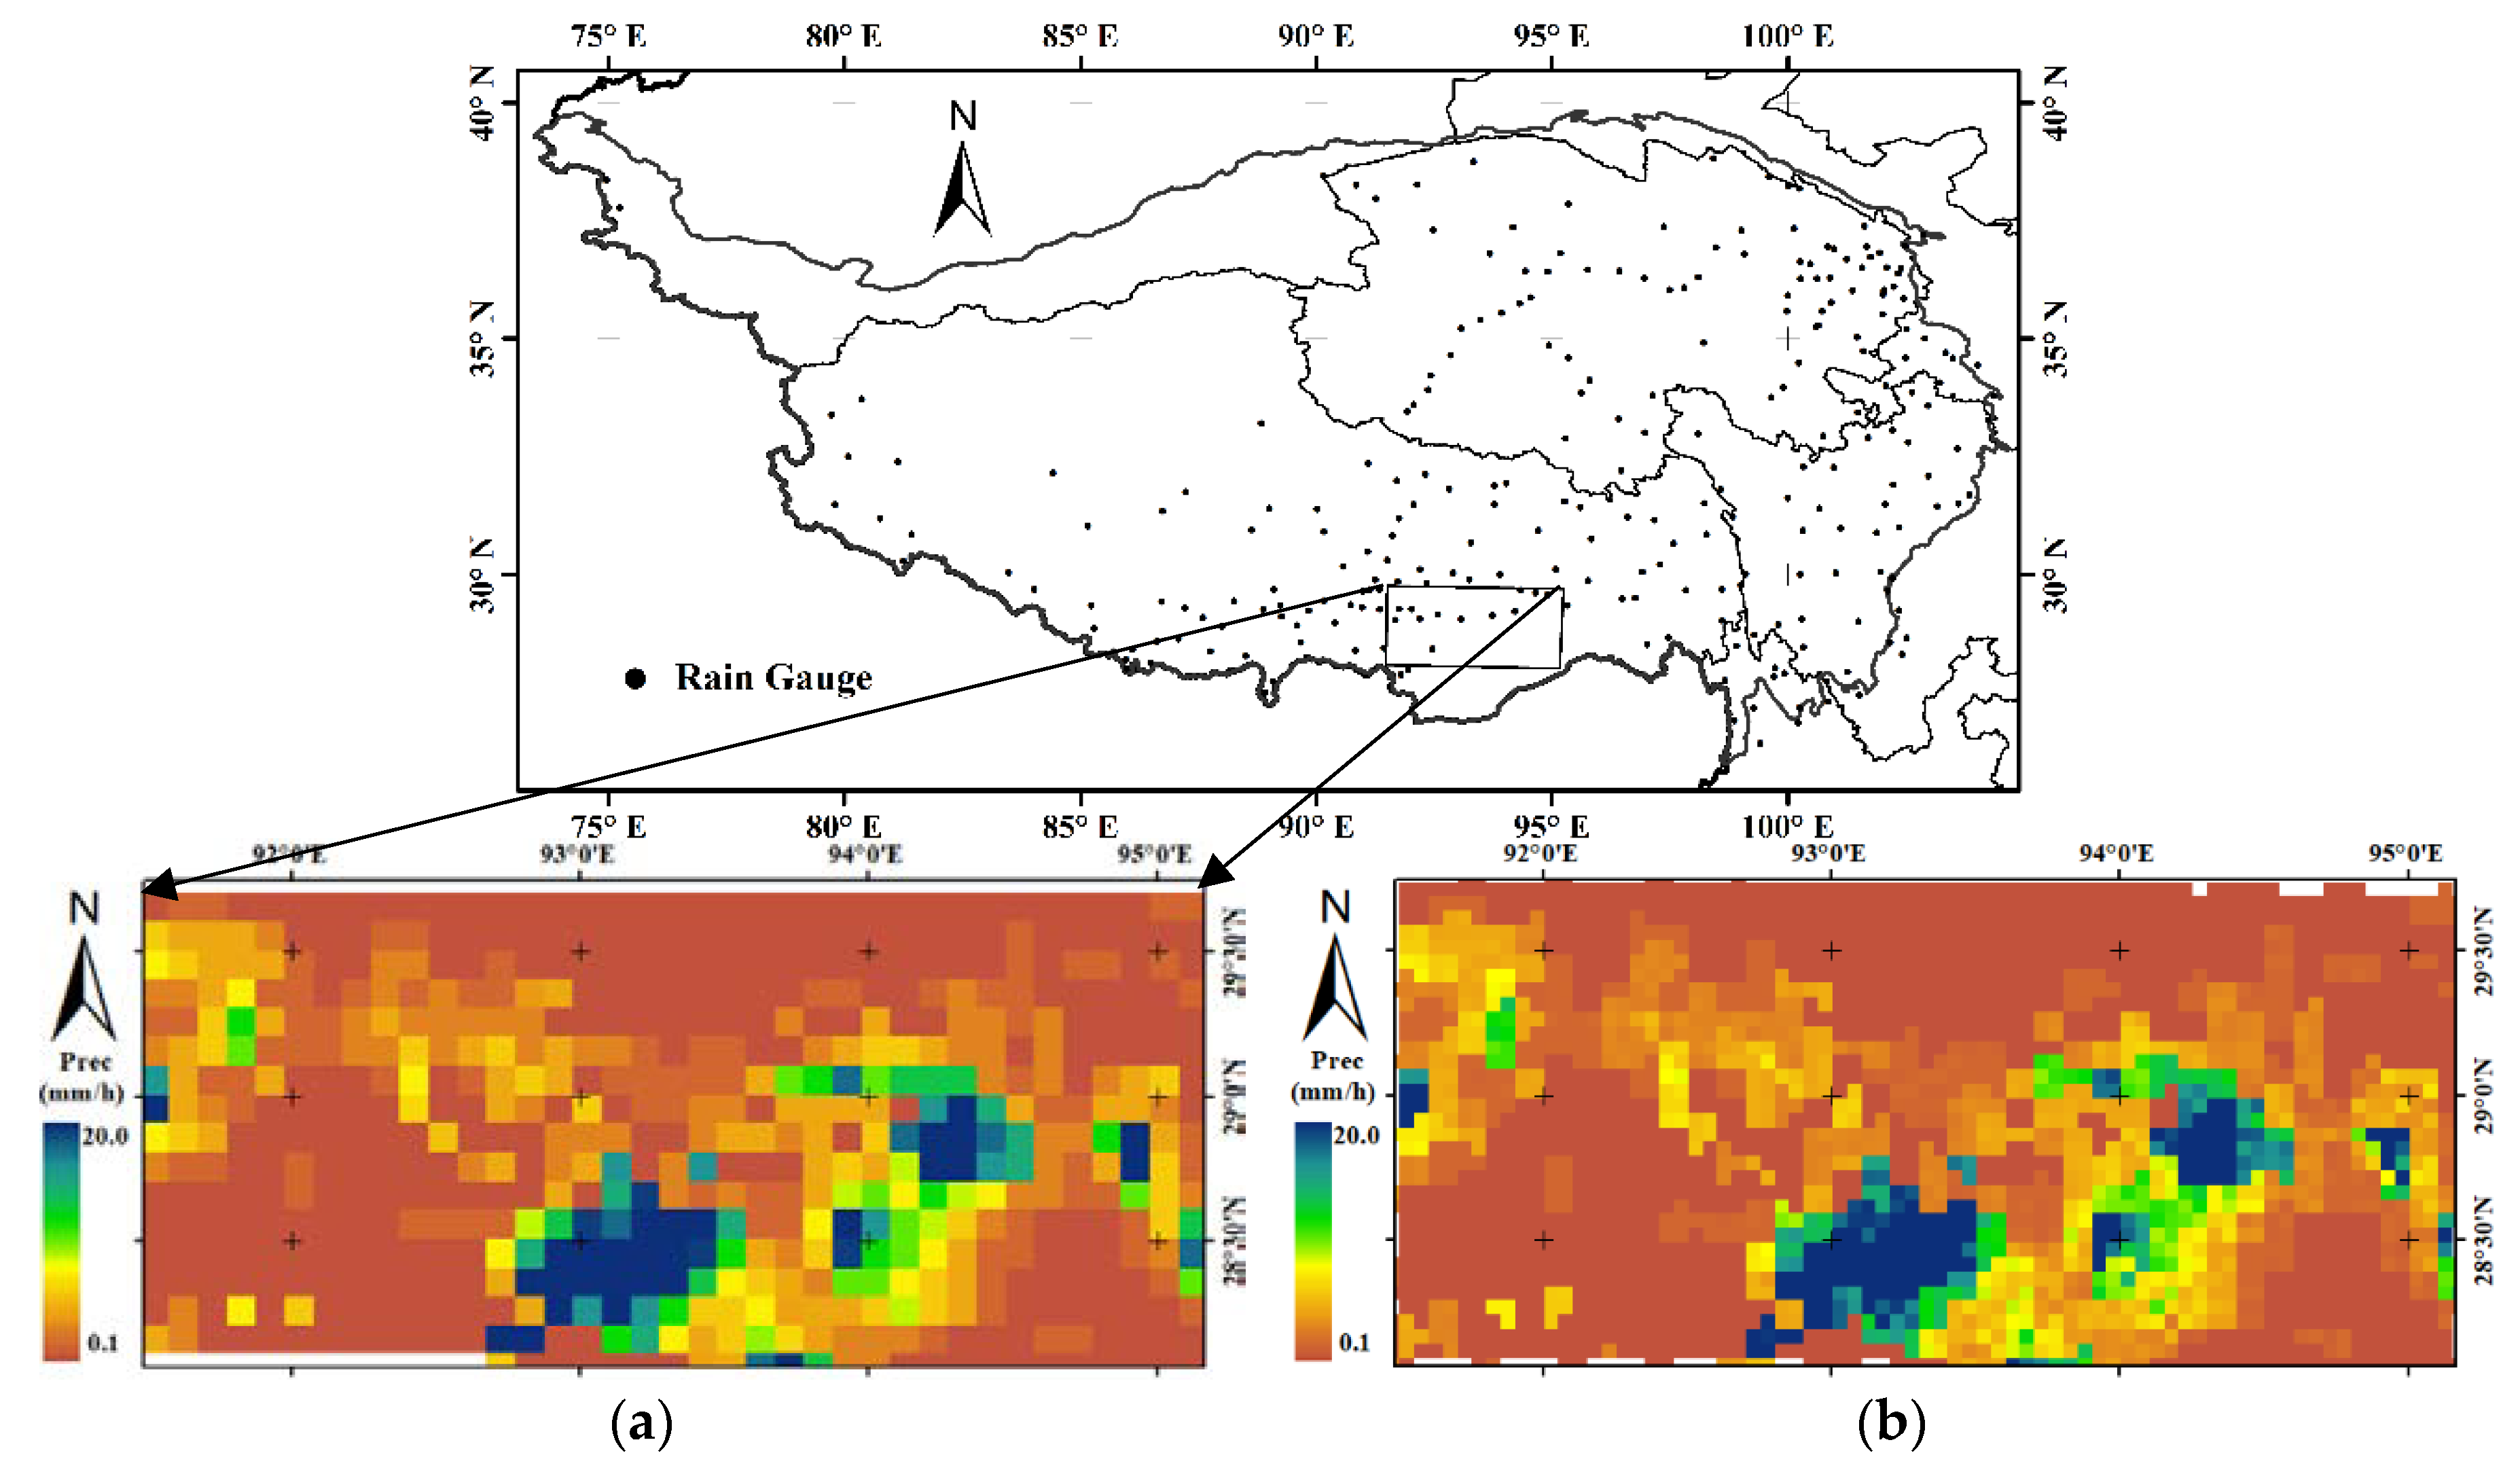
4.3. Downscaled Precipitation Results

After the disaggregation weights being obtained, the downscaled results were generated based on the IMERG, from 1 May to 30 September 2014. In most hours, there were very limited rainfall pixels, or no rainfall. Therefore, a typical hour with relatively large rainfall was selected to demonstrate the downscaled results. The spatial patterns of (a) original IMERG, (b) downscaled results, at 10 a.m. 3 July 2014 over the Ganjiang, were shown in Figure 6. Using the proposed downscaling algorithm by this study, the general spatial pattern of downscaled result was similar to that of the original IMERG data. One of the most important characteristics of the downscaled results was that there was still no rainfall over the region where the IMERG did not capture the rainfall happening. While the traditional regression method could not achieve this. At this typical hour, the value of IMERG ranged from 0 to 20.42 mm/hour, with average value ~1.18 mm/hour, and standard deviation ~2.05 mm/hour; while the value of downscaled IMERG ranged from 0 to 29.66 mm/hour, with average value ~1.14 mm/hour, and standard deviation ~2.03 mm/hour. By comparing the distributions of the values from both IMERG and the downscaled results, the volume magnitude of these original IMERG and the corresponding downscaled results were similar. However, the downscaled results could provide more detailed information with finer spatial resolutions.

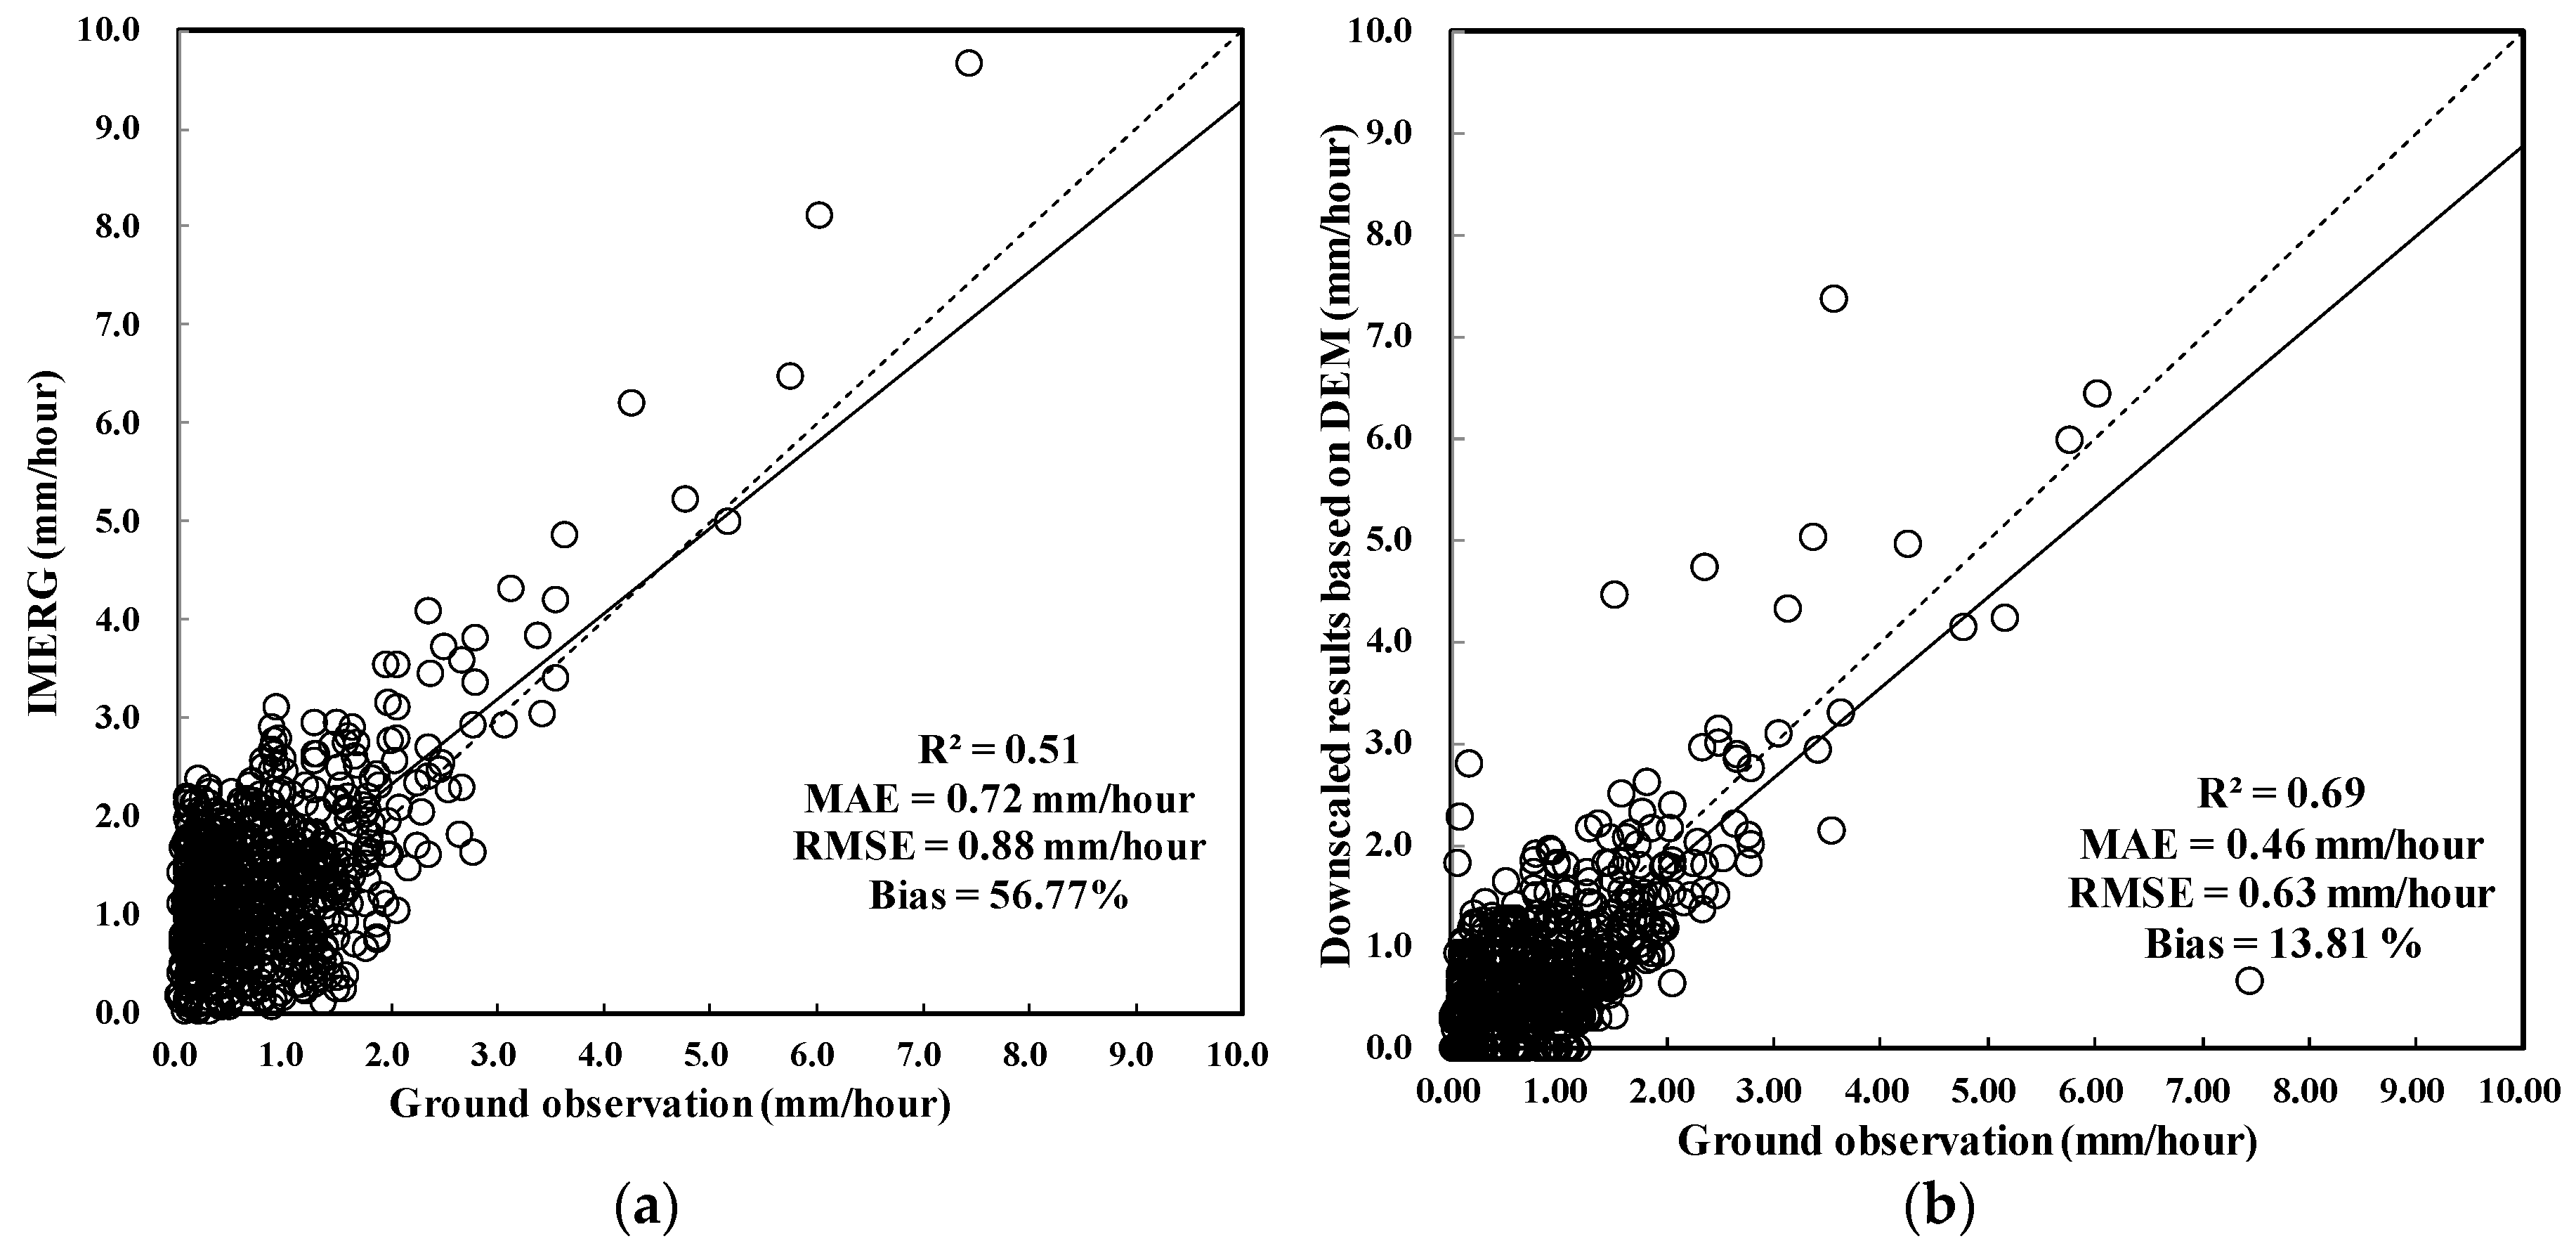
4.4. Validations against Ground Observations over the Tibetan Plateau

To validate the accuracy of downscaled results, this proposed downscaling method was also applied over the Tibetan Plateau (TP) where we have collected 258 hourly rain gauge data at automatic weather stations (AWSs) (shown in Figure 7), which were provided by the Chinese Meteorological Data Sharing Service System, and under quality control [44]. At the typical hour (11 a.m. 2 July 2014) at local scale in southeastern TP, the downscaled result demonstrated similar spatial trends with original IMERG trends, but with finer spatial resolution (~1 km), shown in Figure 7a,b.
Both the hourly IMERG and downscaled results (in the period of July 2014) over the TP were validated against rain gauges, shown in Figure 8. Four commonly used indices were applied to evaluate the performances of IMERG and the corresponding downscaled results [15]. The original IMERG data has reasonable accuracy against ground observations with R2~0.51, MAE~0.72 mm/hour, RMSE~0.88 mm/hour, and Bias ~ 56.77%, while the accuracy of the corresponding downscaled results have been significantly improved, with R2~0.69, MAE~0.46 mm/hour, RMSE~0.63 mm/hour, and Bias~13.81%, especially in terms of the Bias. Therefore, we inferred this downscaling algorithm was also suitable for Ganjiang basin.

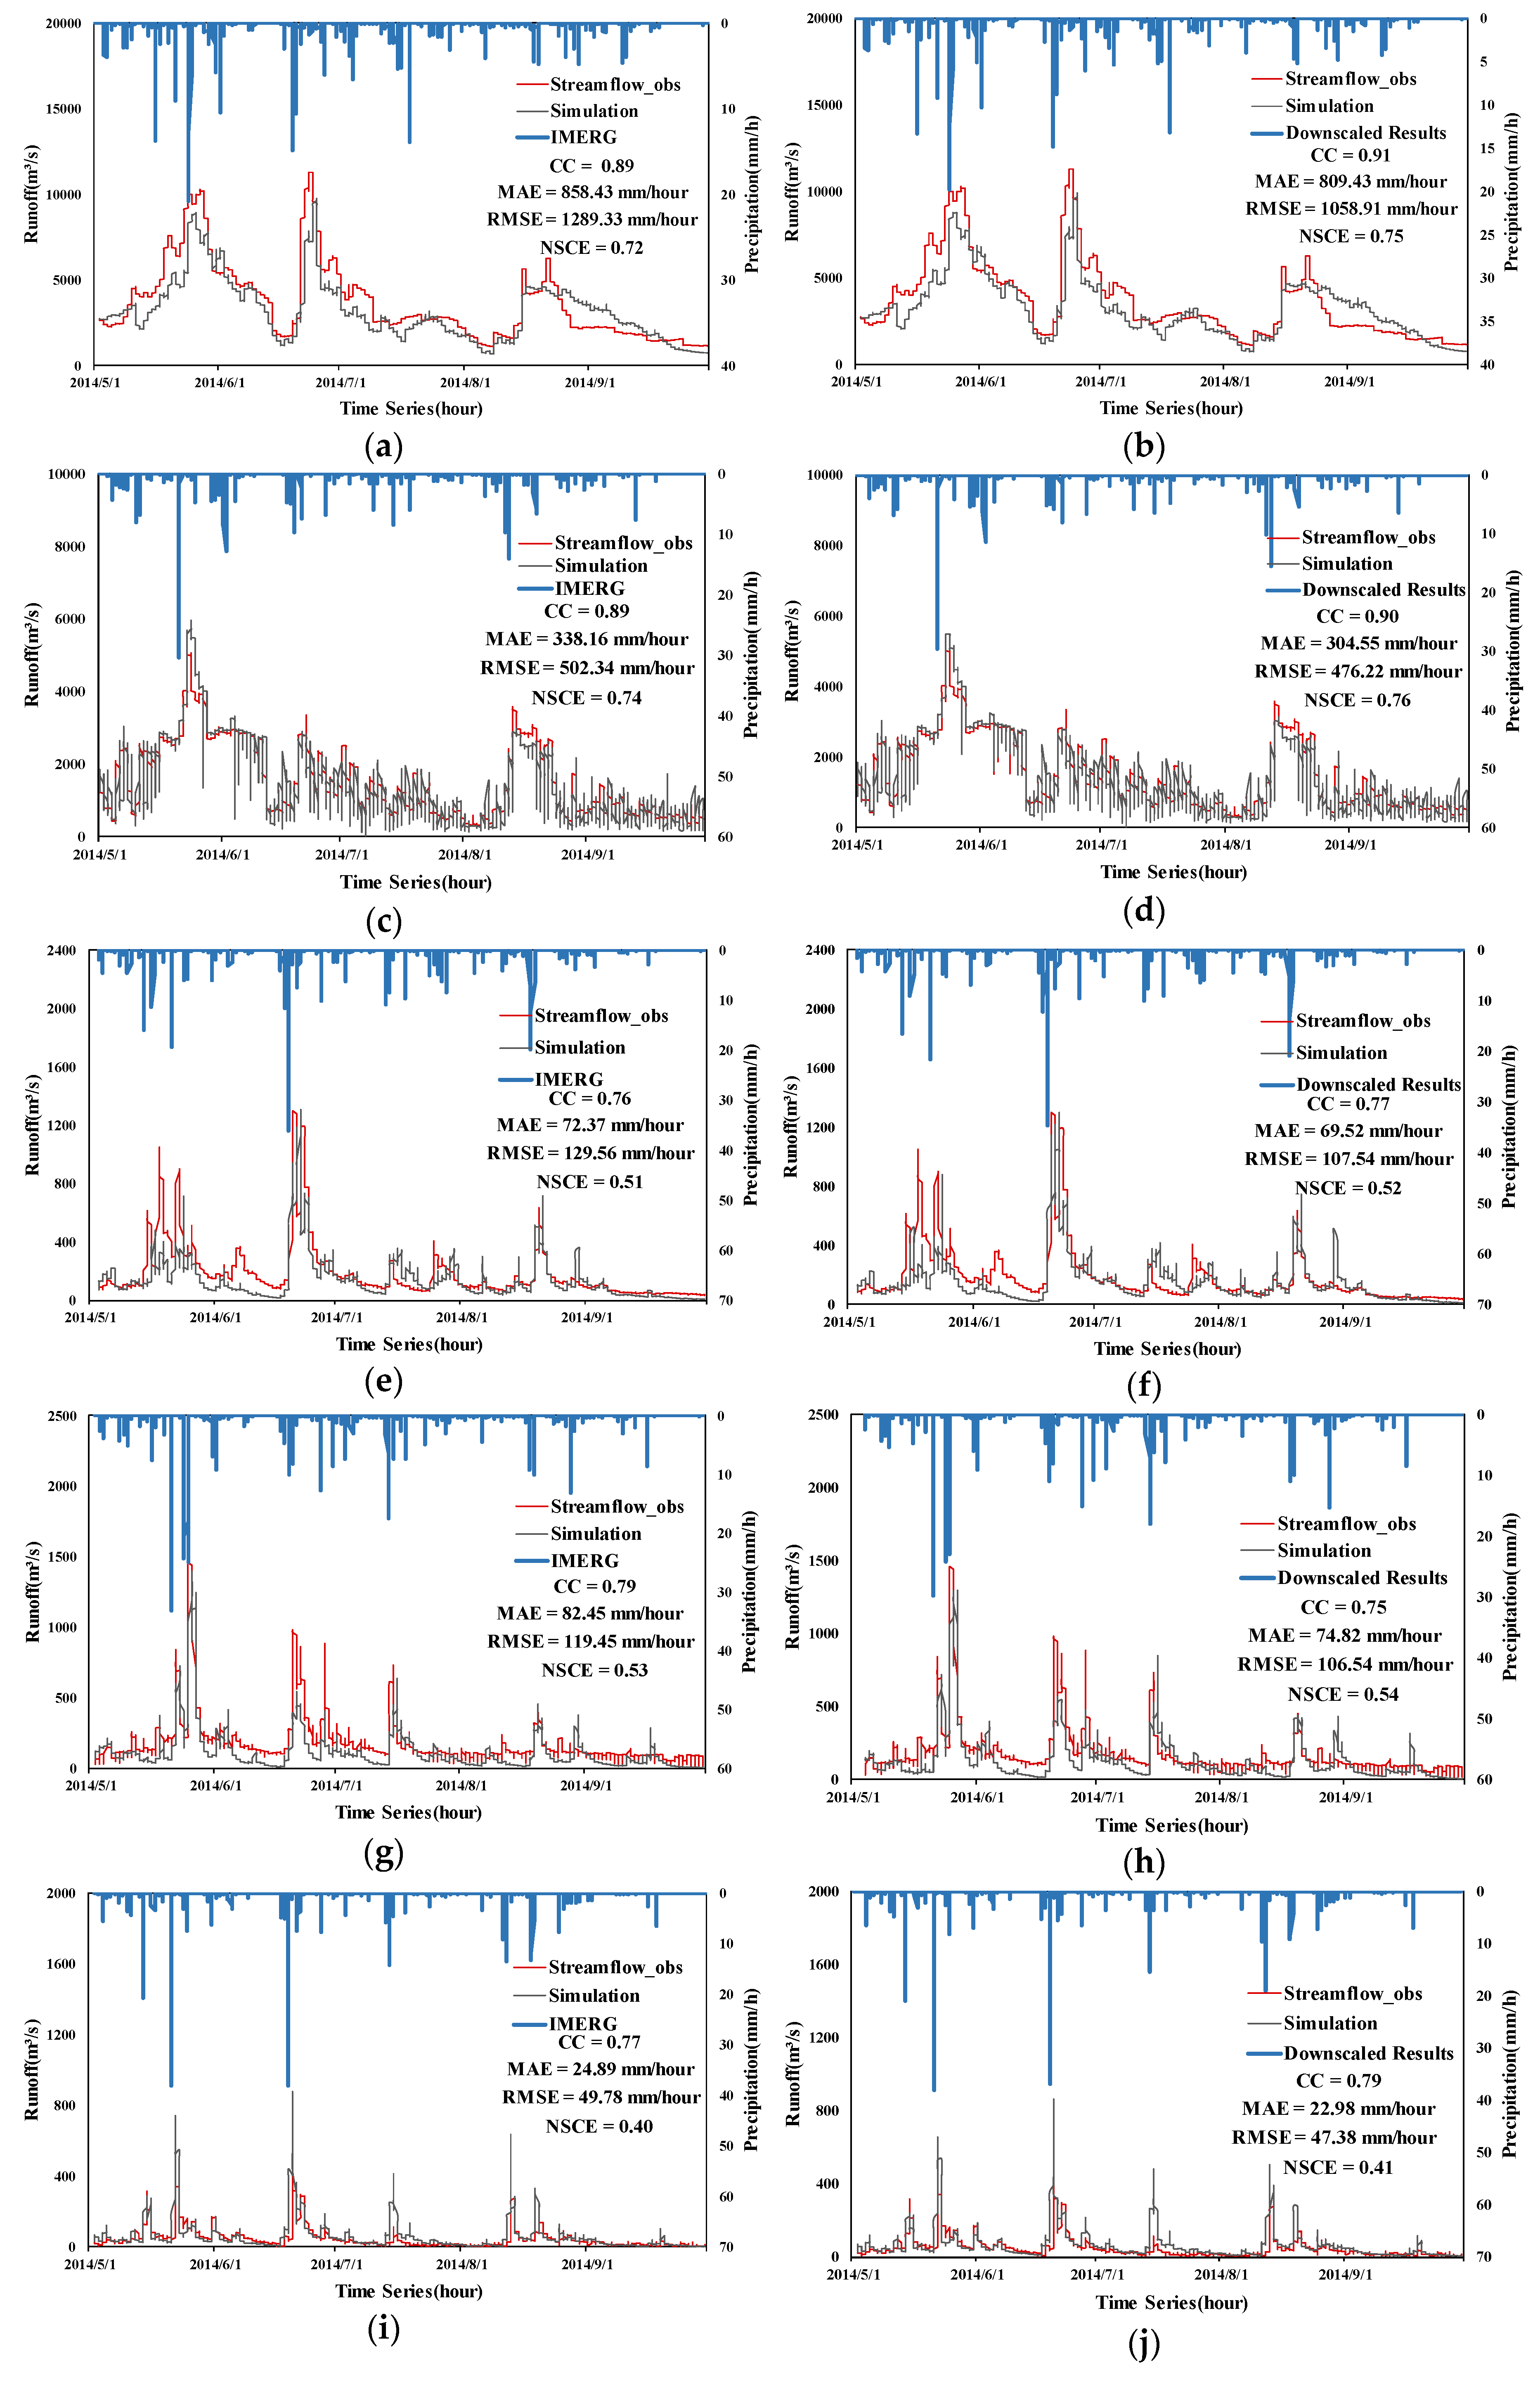
4.5. Comparisons of the Performances of Both IMERG and the Downscaled Results in CREST

Both the original IMERG data and the downscaled results were used to force the hydrological model, CREST, in Ganjiang River basin, from 1 May to 30 September 2014, and four diagnostic statistics have been used to assess the performance, shown in Figure 9. As for CC, the agreement of IMERG at Dongbei and Saitang was better than that of downscaled results, while at the other stations, the downscaled results demonstrated better agreements. Additionally, due to the updated CREST model, the CC of both the IMERG and downscaled in driving CREST to simulate the streamflow at five stations were very large, ranging from 0.7 to 0.90, and the differences were not very significant. In terms of MAE, and RMSE, the values of downscaled results were all smaller than those of original IMERG data in driving CREST to simulate the streamflow at each station. While for NSCE, the values of NSCE of downscaled results were larger than those of the original IMERG in forcing CREST model.
After spatially examining the performances of the both IMERG and downscaled results, we also found that at stations where the streamflow was relatively larger, such as the outlet Waizhou, and Dongbei, the models performed better (e.g., CC ~ 0.90, NSCE ~ 0.75) than those at stations where the streamflow was relatively smaller, such as Xintian, Saitang, and Baisha (e.g., CC ~ 0.77, NSCE ~ 0.50), which might be relevant with the CREST model.

4.6. The Accuracy of the Downscaled Results Still Needs to Be Validated Spatially, Not Only at Limited Hydrological Stations

To meet the two challenges aforementioned above, a new downscaling algorithm proposed for obtaining downscaled results at finer tempo-spatial resolutions, especially over regions with limited ground-based rain gauges or radars. Though the downscaled results overall outperformed the original IMERG data in CREST simulating the streamflow at five hydrological stations, they were still needed to be validated using ground observations [45].

4.7. The Uncertainties and Sensitivities of the Parameters in This CREST Model

As pointed out by Kan et al. [28], there are commonly three approaches adopted to build a distributed hydrological model: the conceptually based models, the partial differential equation-based models, and conceptually physically coupled models. Even though many methods can be used to construct complex hydrological models, definitely precise description of the nature of hydrological processes is still a hard job. This is because the hydrological models inherently have some limitations, such as uncertainty issue, when facing with complex natural scenario simulations. Though there are numerous hydrological models developed and applied worldwide with reasonable accuracies and significantly cost-effective computational efficiency, the uncertainties in these models still exist at some degrees. There are 15 parameters in CREST 3.0 [28], and each of them has its own physical meaning. These model parameters were calibrated by using the SCE-UA (Shuffled Complex Evolution developed in the University of Arizona) optimization method [46], the uncertainty and sensitivity issues of these parameters do have non-ignorable influences in the performance of distributed hydrological model.
Besides the model structure and parameter uncertainty, data uncertainty issue is also a problem. Satellite-based products treated as data sources reflecting hydrological state variables can be adopted to calibrate the CEREST 3.0, such as soil moisture (Soil Moisture Active Passive, SMAP; and Soil Moisture and Ocean Salinity, SMOS), potential and actual evapotranspiration (MODerate-resolution Imaging Spectroradiometer, MODIS; and Advanced Very High Resolution Radiometer, AVHRR), land surface temperature (MODIS), and total water storage (Gravity Recovery and Climate Experiment, GRACE). Though these satellite-based products provided useful information, the uncertainties of these data still exist, which might be one of the error sources influencing the hydrological model performance, when using the downscaled precipitation dataset with finer spatial resolution (~1 km). The uncertainty issue may be amplified especially when the model was forced by satellite-based products, such as precipitation. The above-mentioned scientific issues should be noticed by modelers and users, and is worthy to be furtherly investigated in future studies.

4.8. Future Direction

In this study, only DEM was investigated as the auxiliary variable to downscale the IMERG data. As we know various related environmental variables are related to both spatial patterns and volumes of the happening/occurring rainfall, for example, the cloud information, and brightness temperature [25]. Therefore, these rainfall related variables also should be investigated to downscale the original IMERGE data.

5. Conclusions

Rainfall information is a perquisite for and plays a vital role in driving hydrological models. However, limited by the observation methods, the obtained precipitation data, at present, are still too coarse. In this study, a new method was introduced to downscale IMERG data at hourly scale. The downscaled precipitation product was compared to the original IMERG data in the temporal-spatial pattern and basin-scale hydrological simulation to assess its optimality. The main conclusions are summarized as follows: (a) the new proposed downscaling method at hourly temporal scale could obtain downscaled results with similar spatial patterns with those of original IMERG data, but with finer spatial resolution; and (b) the downscaled results based on IMERG overall outperformed the IMERG data in hydrological simulations.
Overall, the results showed that spatiotemporal characteristics by IMERG were well captured by the downscaled precipitation across the Ganjiang River basin. The work shed light on the newly proposed high-temporal-scale downscaling method. However, more assessments are still needed to provide a more comprehensive analysis on the downscaled products. In the future, more algorithms and data are still needed to be proposed to obtain downscaled results with finer tempo-spatial resolutions, for example, by introducing cloud information as one of the auxiliary data.

Author Contributions

Z.M., Y.C. and Y.H. designed this Manuscript; X.C., X.J., H.L. and J.L. processed and provided the data; G.K. run the hydrological model derived by the satellite-based precipitation data; Z.M. and X.T. wrote this manuscript; and Y.Y. modified and polished this manuscript.

Funding

This study was financially supported by the National Key Research and Development Program of China (No. 2016YFE0102400), the China Postdoctoral Science Foundation (No. 2018M630037), NSFC (No. 91437214, 71461010701 and 41471430), MOST Key-Project (Grant N0. 2013CB036406), the National Natural Science Foundation-Karst Scientific Research Center of Guizhou People’s Government (U1612442), IWHR Research & Development Support Program (JZ0145B022018), and Supported by Beijing Natural Science Foundation (8184094). And the article processing charge (APC) was funded by No. 2016YFE0102400.

Conflicts of Interest

The authors declare no conflict of interest.

References

  1. Alexander, L.V.; Zhang, X.; Peterson, T.C.; Caesar, J.; Gleason, B.; Klein, T.A.; Haylock, M.; Collins, D.; Trewin, B.; Rahimzadeh, F.; et al. Global observed changes in daily climate extremes of temperature and precipitation. J. Geophys. Res. Atmosp. 2006, 111, D05109. [Google Scholar] [CrossRef]
  2. Min, S.-K.; Zhang, X.; Zwiers, F.W.; Hegerl, G.C. Human contribution to more-intense precipitation extremes. Nature 2011, 470, 378–381. [Google Scholar] [CrossRef] [PubMed]
  3. Hong, Y.; Adler, R.F.; Hossain, F.; Curtis, S.; Huffman, G.J. A first approach to global runoff simulation using satellite rainfall estimation. Water Resour. Res. 2007, 43, W08502. [Google Scholar]
  4. Kidd, C.; Huffman, G. Global precipitation measurement. Meteorol. Appl. 2011, 18, 334–353. [Google Scholar] [CrossRef] [Green Version]
  5. Ali, A.; Lebel, T.; Amani, A. Rainfall estimation in the Sahel. Part I: Error function. J. Appl. Meteorol. 2005, 44, 1691–1706. [Google Scholar] [CrossRef]
  6. Kan, G.Y.; Zhang, M.J.; Liang, K.; Wang, H.; Jiang, Y.Z.; Li, J.R.; Ding, L.Q.; He, X.Y.; Hong, Y.; Zuo, D.P.; et al. Improving water quantity simulation & forecasting to solve the energy-water-food nexus issue by using heterogeneous computing accelerated global optimization method. Appl. Energy 2016, 15, 420–433. [Google Scholar]
  7. Kan, G.Y.; He, X.Y.; Li, J.R.; Ding, L.Q.; Hong, Y.; Zhang, H.; Liang, K.; Zhang, M. Computer aided numerical methods for hydrological model calibration: An overview and recent development. Arch. Comput. Methods Eng. 2017, 7, 1–25. [Google Scholar] [CrossRef]
  8. Li, N.; Tang, G.Q.; Zhao, P.; Hong, Y.; Gou, Y.B.; Yang, K. Statistical assessment and hydrological utility of the latest mult-satellite precipitation analysis IMERG in Ganjiang River basin. Atmosp. Res. 2017, 183, 212–223. [Google Scholar] [CrossRef]
  9. Bohnenstengel, S.I.; Schlunzen, K.H.; Beyrich, F. Representativity of in situ precipitation measurements—A case study for the LITFASS area in North-Eastern Germany. J. Hydrol. 2011, 400, 387–395. [Google Scholar] [CrossRef]
  10. Marzano, F.S.; Cimini, D.; Montopoli, M. Investigating precipitation micro-physics using ground-based microwave remote sensors and disdrometer data. Atmosp. Res. 2010, 97, 583–600. [Google Scholar] [CrossRef]
  11. Ma, Z.Q.; Xu, Y.P.; Peng, J.; Chen, Q.X.; Wan, D.; He, K.; Shi, Z.; Li, H.Y. Spatial and temporal precipitation patterns characterized by TRMM TMPA over the Qinghai-Tibetan plateau and surroundings. Int. J. Remote Sens. 2018, 39, 3891–3907. [Google Scholar] [CrossRef]
  12. Ma, Z.Q.; Zhou, L.Q.; Yu, W.; Yang, Y.Y.; Teng, H.F.; Shi, Z. Improving TMPA 3B43 V7 Data Sets Using Land-Surface Characteristics and Ground Observations on the Qinghai–Tibet Plateau. IEEE Geosci. Remote Sens. Lett. 2018, 99. [Google Scholar] [CrossRef]
  13. McVicar, T.R.; Niel, T.G.V.; Li, L.T.; Hutchinson, M.F.; Mu, X.M.; Liu, Z.H. Spatilly distributing monthly reference evapotranspiration and pan evaporation considering topographic influences. J. Hydrol. 2007, 388, 196–220. [Google Scholar] [CrossRef]
  14. Liu, Q.; McVicar, T.R.; Yang, Z.F.; Donohue, R.J.; Liang, L.Q.; Yang, Y.T. The hydrological effects of varying vegetation characteristics in a temperate water-limited basin: Development of the dynamic Budyko-Choudhury-Porporato (DBCP) model. J. Hydrol. 2016, 543, 595–611. [Google Scholar] [CrossRef]
  15. Ma, Z.Q.; Shi, Z.; Zhou, Y.; Xu, J.F.; Yu, W.; Yang, Y.Y. A Spatial Data Mining Algorithm for Downscaling TMPA 3B43 V7 Data over the Qinghai-Tibet Plateau with the Effect of Systematic Anomalies Removed. Remote Sens. Environ. 2017, 200, 378–395. [Google Scholar] [CrossRef]
  16. Ma, Z.Q.; Zhou, Y.; Hu, B.F.; Liang, Z.Z.; Shi, Z. Downscaling Annual Precipitation with TMPA and Land Surface Characteristics in China. Int. J. Climatol. 2017, 37, 5017–5119. [Google Scholar] [CrossRef]
  17. Jameson, A.R. Radar observations of rainfall variability using non-Rayleigh signal fluctuations. J. Appl. Meteorol. Climatol. 2008, 47, 607–619. [Google Scholar] [CrossRef]
  18. Borga, M.; Degli Esposti, S.; Norbiato, D. Influence of errors in radar rainfall estimates on hydrological modelling prediction uncertainty. Water Resour. Res. 2016, 42, W08409. [Google Scholar]
  19. Kitzmiller, D.; Miller, D.; Fulton, R.; Ding, F. Radar and multisensory precipitation estimation techniques in National Weather Service Hydrologic Operations. J. Hydrol. Eng. 2013, 18, 133–142. [Google Scholar] [CrossRef]
  20. Chokngamwong, R.; Chiu, L.S. Thailand daily rainfall and comparison with TRMM products. J. Hydrometeorol. 2008, 9, 256–266. [Google Scholar] [CrossRef]
  21. Hossain, F.; Anagnostou, E.N.; Dinku, T.; Borga, M. Hydrological model sensitivity to parameter and radar rainfall estimation uncertainty. Hydrol. Process. 2004, 18, 3277–3291. [Google Scholar] [CrossRef]
  22. Kummerow, C.; Simpson, J.; Thiele, O.; Barnes, W.; Chang, A.T.C.; Stocker, E.; Adlera, R.F.; Houa, A.; Kakarb, R.; Wentz, F.; et al. The status of the Tropical Rainfall Measuring Mission (TRMM) after two years in orbit. J. Appl. Meteorol. 2000, 39, 1965–1982. [Google Scholar] [CrossRef]
  23. Huffman, G.J.; Adler, R.F.; Bolvin, D.T.; Gu, G.; Nelkin, E.J.; Bowman, K.P.; Hong, Y.; Stocker, E.F.; Wolff, D.B. The TRMM Multi-satellite Precipitation analysis (TMPA): Quasi-global, multiyear, combined-sensor precipitation estimates at fine scale. J. Hydrometeorol. 2007, 8, 38–55. [Google Scholar] [CrossRef]
  24. Huffman, G.J.; Bolvin, D.T.; Nelkin, E.J. Integrated Multi-Satellite Retrievals for GPM (IMERG) Technical Documentation. 2015. Available online: https://pmm.nasa.gov/sites/default/files/document_files/IMERG_doc.pdf (accessed on 18 May 2018).
  25. Hong, Y.; Hsu, K.; Sorooshian, S.; Gao, X. Precipitation estimation from remotely sensed imagery using an artificial neural network cloud classification system. J. Appl. Meteorol. 2004, 43, 1834–1852. [Google Scholar] [CrossRef]
  26. Huffman, G.J.; Adler, R.F.; Bolvin, D.T.; Nelkin, E.J. The TRMM Multi-Satellite Precipitation Analysis (TMPA). In Satellite Rainfall Applications for Surface Hydrology; Springer: Dordrecht, The Netherlands, 2010; pp. 3–22. [Google Scholar]
  27. Joyce, R.J.; Janowiak, J.E.; Arkin, P.A.; Xie, P.P. CMORPH: A method that produces global precipitation estimates from passive microwave and infrared data at high spatial and temporal resolution. J. Hydrometeorol. 2004, 5, 487–503. [Google Scholar] [CrossRef]
  28. Kan, G.Y.; Tang, G.Q.; Yang, Y.; Hong, Y.; Li, J.; Ding, L.; He, X.; Liang, K.; He, L.; Li, Z.; et al. An Improved Coupled Routing and Excess Storage (CREST) Distributed Hydrological Model and Its Verification in Ganjiang River Basin. Water 2017, 9, 904. [Google Scholar] [CrossRef]
  29. Kustas, W.P.; Norman, J.M.; Anderson, M.C.; French, A.N. Estimating sub-pixel surface temperatures and energy fluxes from the vegetation index-radiometric temperature relationship. Remote Sens. Environ. 2003, 85, 429–440. [Google Scholar] [CrossRef]
  30. Agam, N.; Kustas, W.P.; Anderson, M.C.; Li, F.; Neale, C.M.U. A vegetation index based technique for spatial sharpening of thermal imagery. Remote Sens. Environ. 2007, 107, 545–558. [Google Scholar] [CrossRef]
  31. Merlin, O.; Duchemin, B.; Hagolle, O.; Jacob, F.; Coudert, B.; Chebouni, G.; Dedieu, G.; Garatuza, J.; Kerr, Y. Disaggregation of MODIS surface temperature over an agriculture area using a time series of Formosat-2 images. Remote Sens. Environ. 2010, 114, 2500–2512. [Google Scholar] [CrossRef] [Green Version]
  32. Gao, Y.C.; Liu, M.F. Evaluation of high-resolution satellite precipitation products using rain gauge observations over the Tibetan Plateau. Hydrol. Earth Syst. Sci. 2013, 17, 837–849. [Google Scholar] [CrossRef] [Green Version]
  33. Yang, Y.; Tang, G.Q.; Lei, X.H.; Hong, Y.; Yang, N. Can Satellite Precipitation Products Estimate Probable Maximum Precipitation: A Comparative Investigation with Gauge Data in the Dadu River Basin. Remote Sens. 2017, 10, 41. [Google Scholar] [CrossRef]
  34. Immerzeel, W.W.; Rutten, M.M.; Droogers, P. Spatial downscaling of TRMM precipitation using vegetative response on the Iberian Peninsula. Remote Sens. Environ. 2009, 113, 362–370. [Google Scholar] [CrossRef]
  35. Jia, S.; Zhu, W.; Lu, A.; Droogers, P. Spatial downscaling of algorithm of TRMM precipitation based on NDVI and DEM in the Qaidam Basin of China. Remote Sens. Environ. 2011, 115, 3069–3079. [Google Scholar] [CrossRef]
  36. Duan, Z.; Bastiaanssen, W.G.M. First results from Version 7 TRMM 3B43 precipitation product in combination with a new downscaling-calibration procedure. Remote Sens. Environ. 2013, 131, 1–13. [Google Scholar] [CrossRef]
  37. Xu, S.G.; Wu, C.Y.; Wang, L.; Gonsamo, A.; Shen, Y.; Niu, Z. A new satellite-based monthly precipitation downscaling algorithm with non-stationary relationship between precipitation and land surface characteristics. Remote Sens. Environ. 2015, 162, 119–140. [Google Scholar] [CrossRef]
  38. Tang, G.; Zeng, Z.; Long, D.; Guo, X.; Yong, B.; Zhang, W.; Hong, Y. Statistical and hydrological comparisons between TRMM and GPM level-3 products over a Midlatitude Basin: Is day-1 IMERG a good successor for TMPA 3B42V7? J. Hydrometeorol. 2016, 17, 121–137. [Google Scholar] [CrossRef]
  39. Rodriguez, E.; Morris, C.S.; Belz, J.E. A global assessment of the SRTM performance. Photogram. Eng. Remote Sens. 2006, 72, 249–260. [Google Scholar] [CrossRef]
  40. Tang, G.Q.; Long, D.; Hong, Y.; Gao, J.Y.; Wan, W. Documentation of multifactorial relationships between precipitation and topography of the Tibetan Plateau using spaceborne precipitation radars. Remote Sens. Environ. 2018, 208, 82–96. [Google Scholar] [CrossRef]
  41. Wang, J.; Hong, Y.; Li, L.; Gourley, J.J.; Khan, S.I.; Yilmaz, K.K.; Adler, R.F.; Policelli, F.S.; Habib, S.; Irwn, D.; et al. The coupled routing and excess storage (CREST) distributed hydrological model. Int. Assoc. Sci. Hydrol. Bull. 2011, 56, 84–98. [Google Scholar] [CrossRef] [Green Version]
  42. Wu, H.; Adler, R.F.; Hong, Y.; Tian, Y.; Policelli, F. Evaluation of global flood detection using satellite-based rainfall and a hydrologic model. J. Hydrometeorol. 2012, 13, 1268–1284. [Google Scholar] [CrossRef]
  43. Xue, X.; Hong, Y.; Limaye, A.S.; Gourley, J.J.; Huffman, G.J.; Khan, S.I.; Dorji, C.; Chen, S. Statistical and hydrological evaluation of TRMM-based multi-satellite precipitation analysis over the Wangchu Basin of Bhutan: Are the latest satellite precipitation products 3B42V7 ready for use in ungauged basins? J. Hydrol. 2013, 499, 91–99. [Google Scholar] [CrossRef]
  44. Ren, Z.H.; Zhao, P.; Zhang, Q. Qaulity control procedures for hourly precipitation data from automatic weather stations in China (In Chinese). Meteorol. Mon. 2010, 36, 123–132. [Google Scholar]
  45. Ahmadalipour, A.; Moradkhani, H. Analyzing the uncertainty of ensemble-based gridded observations in land surface simulations and drought assessment. J. Hydrol. 2017, 555, 557–568. [Google Scholar] [CrossRef]
  46. Duan, Q.; Sorooshian, Z.S.; Gupta, V. Effective and efficient global optimization for conceptual rainfall-runoff models. Water Resour. Res. 1992, 28, 1015–1031. [Google Scholar] [CrossRef]
Figure 1. The location and elevation ranges of the Ganjiang River basin, China.
Water 10 01392 g001
Figure 2. Moving window and pixels in and overlapping it, at hourly temporal scale.
Water 10 01392 g002
Figure 3. The spatial patterns of (a) mean hourly precipitation measured by IMERG from 1 May to 30 September 2014, and (b) DEM both with the spatial resolution of 0.1°, over Ganjiang basin.
Water 10 01392 g003
Figure 4. The relationship between mean hourly precipitation estimates by IMERG from 1 May to 30 September 2014, and DEM at the spatial resolution of 0.1°, over Ganjiang basin.
Water 10 01392 g004
Figure 5. The disaggregation weights using GMWWDA algorithm based on DEM.
Water 10 01392 g005
Figure 6. The spatial patterns of (a) original IMERG, (b) downscaled results-based GMWWDA algorithm, respectively, at a typical hour (10 a.m. 3 July 2014) over the Ganjiang.
Water 10 01392 g006
Figure 7. The spatial patterns of (a) original IMERG, (b) downscaled results-based GMWWDA algorithm, respectively, at a typical hour (11 a.m. 2 July 2014) at local scale in southeastern TP.
Water 10 01392 g007
Figure 8. The validation of rain gauges against (a) original IMERG data (0.1°/hourly), and (b) downscaled results (~1 km/hourly) using DEM, respectively, in July 2014, over the Tibetan Plateau.
Water 10 01392 g008
Figure 9. Performances of the original IMERG in CREST simulating streamflow at (a) Waizhou, (c) Dongbei, (e) Xintian, (g) Saitang, and (i) Baisha stations, and the corresponding downscaled results in CREST simulating streamflow at (b) Waizhou, (d) Dongbei, (f) Xintian, (h) Saitang, and (j) Baisha stations, respectively, in the Ganjiang River basin from 30 April to 30 September 2014.
Water 10 01392 g009

