Article

The Value of Hydrologic Information in Reservoir Outflow Decision-Making

1
State Key Laboratory of Water Resources and Hydropower Engineering Science, Wuhan University, Wuhan 430072, China
2
China Yangtze Power Co., Ltd., Yichang 443133, China
3
Middle Changjiang River Bureau of Hydrology and Water Resources Survey, Wuhan 430012, China
*
Author to whom correspondence should be addressed.
Water 2018, 10(10), 1372; https://doi.org/10.3390/w10101372
Submission received: 22 August 2018 / Revised: 23 September 2018 / Accepted: 26 September 2018 / Published: 1 October 2018
(This article belongs to the Section Water Resources Management, Policy and Governance)

Abstract

:
The controlled outflows from a reservoir are highly dependent on the decisions made by the reservoir operators who mainly rely on available hydrologic information, such as past outflows, reservoir water level and forecasted inflows. In this study, Random Forests (RF) algorithm is used to build reservoir outflow simulation model to evaluate the value of hydrologic information. The Three Gorges Reservoir (TGR) in China is selected as a case study. As input variables of the model, the classic hydrologic information is divided into past, current and future information. Several different simulation models are established based on the combinations of these three groups of information. The influences and value of hydrologic information on reservoir outflow decision-making are evaluated from two different perspectives, the one is the simulation result of different models and the other is the importance ranking of the input variables in RF algorithm. Simulation results demonstrate that the proposed model is able to reasonably simulate outflow decisions of TGR. It is shown that past outflow is the most important information and the forecasted inflows are more important in the flood season than in the non-flood season for reservoir operation decision-making.

1. Introduction

With the impact of population growth, urbanization and industrialization, reservoirs play a vital role in regulating water resources by altering the spatial and temporal distribution of natural runoff. The management of reservoirs is often performed by human decision-makers, who are able to combine various hydrologic information, such as past outflows, reservoir water level and forecasted inflows with predefined rules. For reservoir operation decision-makers, it is difficult to evaluate which of hydrologic information is the most important. To rank hydrologic information and judge their value, we try to understand how outflow decisions are made by analyzing historic reservoir operation data based on an outflow simulation model.
To extract knowledge from data, the attempts of using data-mining techniques for better reservoir operation have gained much popularity in recent years. Bessler et al. [1] extracted the operating rules for a reservoir in U.K. using the decision tree algorithm, linear regression and evolutionary algorithm. They found that decision tree algorithm for its visible interpretation was more understandable to reservoir operators and easier to practice in real-world. Hejazi et al. [2] used information theory to understand operators’ release decisions by investigating reservoir historical release data in the U.S and revealed strong ties between release decisions and hydrologic information—especially with current inflows and previous release. Corani et al. [3] used a Lazy Learning algorithm to reproduce human decisions in regulating Lake Lugano and achieved high accuracy.
Random Forests (RF), a tree-based algorithm, employs an ensemble prediction of decision trees and usually outperforms single tree. In retaining visible interpretation of the decision tree, the RF can be exploited to rank the importance of the input variables in explaining the selected output behavior [4]. Caruana and Niculescu-Mizil [5] conducted a large-scale empirical comparison and showed that the RF algorithm achieved excellent performances compared to various data-mining algorithms. In the field of water resources management, Li et al. [6] built a RF model for the prediction of lake water level and concluded that RF could provide information or simulation scenarios for water management and decision-making. Albers et al. [7] evaluated the relative importance of contributing discharges for significant flood events in Canada by RF and proved the function of RF as an exciting new method of analysis to evaluate hydrology. Yang et al. [8] used the Classification and Regression Tree algorithm and RF algorithm to simulate the controlled outflows from nine major reservoirs in California, and concluded that the reservoir storage volume, seasonality and downstream river stage were extremely important variables for operating the reservoirs in California. Sultana et al. [9] used the RF model to assess the business interruption in Germany due to floods and found that the water level was the most important variable for influencing business interruption. Tillman et al. [10] used RF classification analysis to investigate the relationship between suspended sediment and salinity in upper Colorado River basin and concluded that no simple source could explain the relationship between them.
Referring to the pioneer study of Reference [2], hydrologic information in reservoir operation can be divided into three different kinds, namely past, current and future information. The study used past inflow, past storages, past releases, current inflows and forecasted inflows as variables, and established dependence of reservoir release decisions on each of the five variables individually. Inspired by the work of Reference [8], in which all three kinds of hydrologic information are used to simulate California reservoir outflow operation, we use different combinations of hydrologic information to build outflow simulation models by RF algorithm in this study. We rank hydrologic information and judge their value from two different perspectives that one is a simulation result of different models and the other is the importance ranking of the input variables in RF algorithm. Further, we try to compare the results of the two perspectives and verify each other.
The objectives of this study are to build reservoir outflow simulation models based on RF algorithm with different combinations of hydrologic information, and to evaluate the influences and value of hydrologic information on outflow decision-making. The rest of the paper is organized in the following order: The case study and selected hydrologic information are described firstly; then the methodology to build simulation models is introduced; the results and discuss are presented in the following sections, and finally the conclusion is given.

2. Case Study and Selected Data

The Three Gorges Reservoir (TGR) is an essential, backbone project in the developing and harnessing of the Yangtze River in China and the world’s largest power station in terms of installed capacity (22,500 MW). The TGR has been operated for more than a decade since 2003 and accumulates a large amount of reservoir operation data [11]. Ma et al. [12] investigated hourly operation of TGR in non-flood season by data mining to improve the hydropower generation. Until now, no effort has been undertaken to analyze TGR daily operation for different time periods, such as in the flood season and non-flood season.
In order to build reservoir outflow simulation models, the TGR operation data are categorized into model inputs (decision variables) and output (target variable). After discussed with the decision-maker of TGR, the current model inputs include most of the important hydrologic information in the real-world operation. Similar to Reference [2], we view hydrologic information in reservoir operation as three different kinds, namely past, current and future information. The types of model inputs and output are summarized as follows:
(1) Past information
It is clear that past outflow is a classic indicator of reservoir operation. Since reservoir operators may refer to distant information beyond the past 1-day, we determine to consider outflow information from the past 1–3 days, i.e., Qt−1, Qt−2, Qt−3.
(2) Current information
The current information also contains three variables, i.e., month of a year (M), which concerns the influence of seasonality on reservoir operation; and reservoir water level (RWL) and water level at the downstream flood control point (DWL), which are widely used as indicators for guiding reservoir outflow decision-making.
(3) Future information
The forecasted 1-day, 2-day and 3-day inflows, i.e., It+1, It+2, It+3, are the actual predicted values, which are renewed every day in the real-world operation. According to the operational inflow forecasting scheme of TGR, the upstream and tributary flows are routed to the reservoir by Muskingum method [13], and the precipitation records in the interval basin are transformed into runoff with different hydrologic models, such as unit hydrograph [14] and Xinanjiang model [15], etc. The summation of these flow components is the forecasted inflow of TGR.
(4) The model output is the average outflow in tomorrow, Qt+1.
A summary of the input variables and the output variable is listed in Table 1. A schematic map illustrating the past, current and future hydrologic information is shown in Figure 1. In practice, reservoir operators may rely on all of three kinds of information or a combination of some of them under certain circumstances and time periods [2]. Considering the actual operation situation of TGR, the current information, especially the reservoir water level, is indispensable. Since TGR is typically operated to serve different purposes for different periods, we split the data into two parts to further investigate variations in reservoir operations between flood season (from 1 June to 30 September) and non-flood season. The case where all year data are used is also retained as a benchmark. As shown in Table 2, row represents different combinations of information, and column indicates time periods in which the data set will be used. Therefore, we have nine scenarios for analyzing and building outflow simulation models, in which scenarios 1–6 have six input variables while scenarios 7–9 have nine input variables.
The data set of TGR covers 9 years from 1 June 2008 to 31 May 2017. We use the data from 1 June 2008 to 31 May 2015 for training and cross-validation, and the rest is used for test period. These data are downloaded from the Database of TGR.

3. Methodology

3.1. Random Forests Algorithm

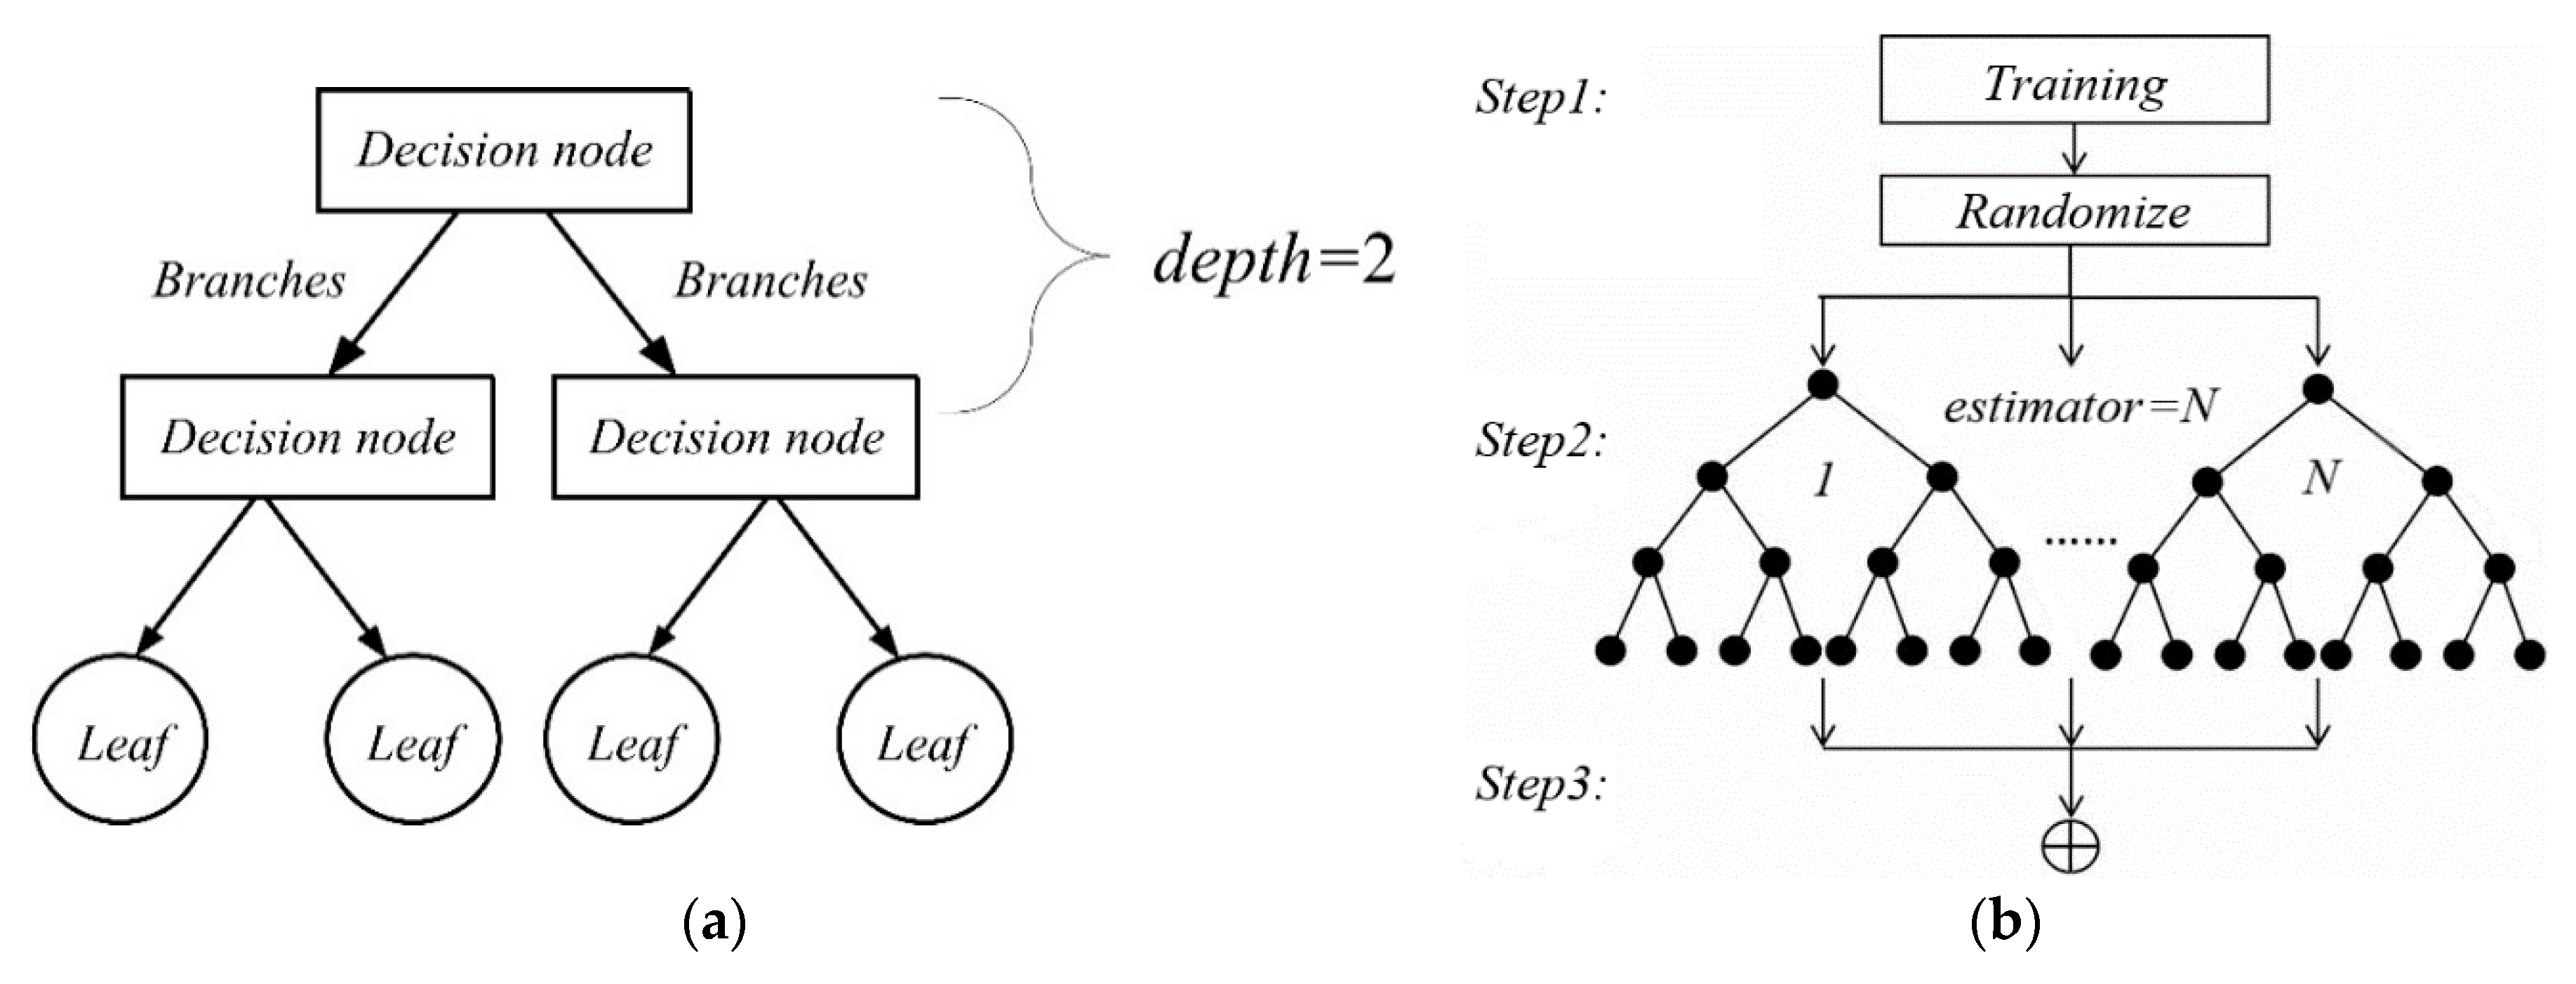
In order to establish the reservoir outflow simulation model, namely, the regression model between the above hydrologic input and output variables, we used Random Forests (RF) algorithm, which can build classification or regression models between input and output variables. As a white-box and nonparametric tree-based data-mining technique, RF is an ensemble of multiple decision trees. As shown in Figure 2a, the tree-like structures are composed of decision nodes, branches, and leaves, which form a cascade of rules leading to classes or numerical values. The tree is obtained by partitioning at the decision node with a proper splitting criterion.
The decision trees in classification RF will eventually divide the whole training data set space into multiple classes. Each class consists of a set of rules that splits the decision variable spaces. The decision trees in regression RF take the average of the target variable values (numerical values) in each class and store the corresponding splitting rules. For regression, the common splitting criterion is to minimize the summation of relative errors in Equation (1) [16].
arg min ( R E ( d ) ) = arg min [ l = 1 L ( y l y L ) 2 + r = 1 R ( y r y R ) 2 ]
where yl and yr are the left and right branches of decision node with L and R numbers of target variables, yL and yR are the mean of resulting target variables, and d is the splitting rule of decision node.
The building procedure of the RF from decision trees is shown in Figure 2b and is described briefly below [6].
Step 1: For each decision tree in the RF, a random subset of the training data set is used. By this way, the training set for each tree is not the same.
Step 2: When constructing decision nodes, the splitting of each decision tree is picked from a random subset of all input variables. Step 1 and Step 2 bring randomness. The two steps make the RF algorithm not easy to fall into over-fitting and have good anti-noise ability.
Step 3: The final output of RF is obtained from the averaged results of each decision tree.
The main parameters to adjust when using RF for regression are estimator and depth. The former is the number of trees in the forest. The larger, the better, but also the longer it will take to compute. In addition, it is noted that results will stop getting significantly better beyond a critical number of trees. The depth of a decision tree is the length of the longest path from a root to a leaf. The Large values of depth will lead to fully grown trees, which has a more complicated structure and may over-fit the data. In order to evaluate the regression model and then determine the parameters, we use the explained variance regression score (2).
E x p l a i n e d   v a r i a n c e ( y t a r , y o u t ) = 1 V a r { y t a r y o u t } V a r { y t a r }
where ytar is the corresponding target output, yout is the output of RF, and Var is Variance. The best possible score is 1.0, lower values are worse.
As mentioned above, the RF algorithm has two main advantages which could be suitable for analyzing reservoir operation data and favored by decision-makers. RF is a nonparametric algorithm, and each path from the top decision node to a leaf can be interpreted as an if-then-else rule, which can provide visible physical interpretation. This visible interpretation stands contrary to other data mining methods, such as neural networks, which act as a black box and it cannot be derived how the prediction is achieved there. For reservoir operators, they can judge the quality of the outflow simulation model by analyzing these if-then-else rules. Furthermore, RF provides a measure of the relative importance of input variables, which can help reservoir operators to rank hydrologic information and judge their value quantitatively.

3.2. Statistical Measurements of Model Performance

In order to mathematically quantify and compare the performance of the outflow simulation models, we select three statistical measurements [8], namely, root mean square error (RMSE), Nash-Sutcliffe model efficiency (NSE), and Normalized Peak Flow Difference (△Qp). The formulas of these statistical measurements are as follows [17,18]:
R M S E = 1 N i = 1 N ( Q o b s , i Q s i m , i ) 2
N S E = 1 i = 1 N ( Q o b s , i Q s i m , i ) 2 i = 1 N ( Q o b s , i Q ¯ o b s ) 2
Q p = Q o b s , m Q s i m , m Q o b s , m × 100 % m = arg max ( Q o b s , i ) , i 1 , 2 , , N
where Qobs and Qsim are the observed and simulated outflow, respectively; Q ¯ o b s is the mean of the observed outflow during the test period; m is the time period when maximum outflow happens during the test period; and N is the total number of days during the test period.

4. Results

4.1. Candidate Model Parameters and Importance of Input Variables

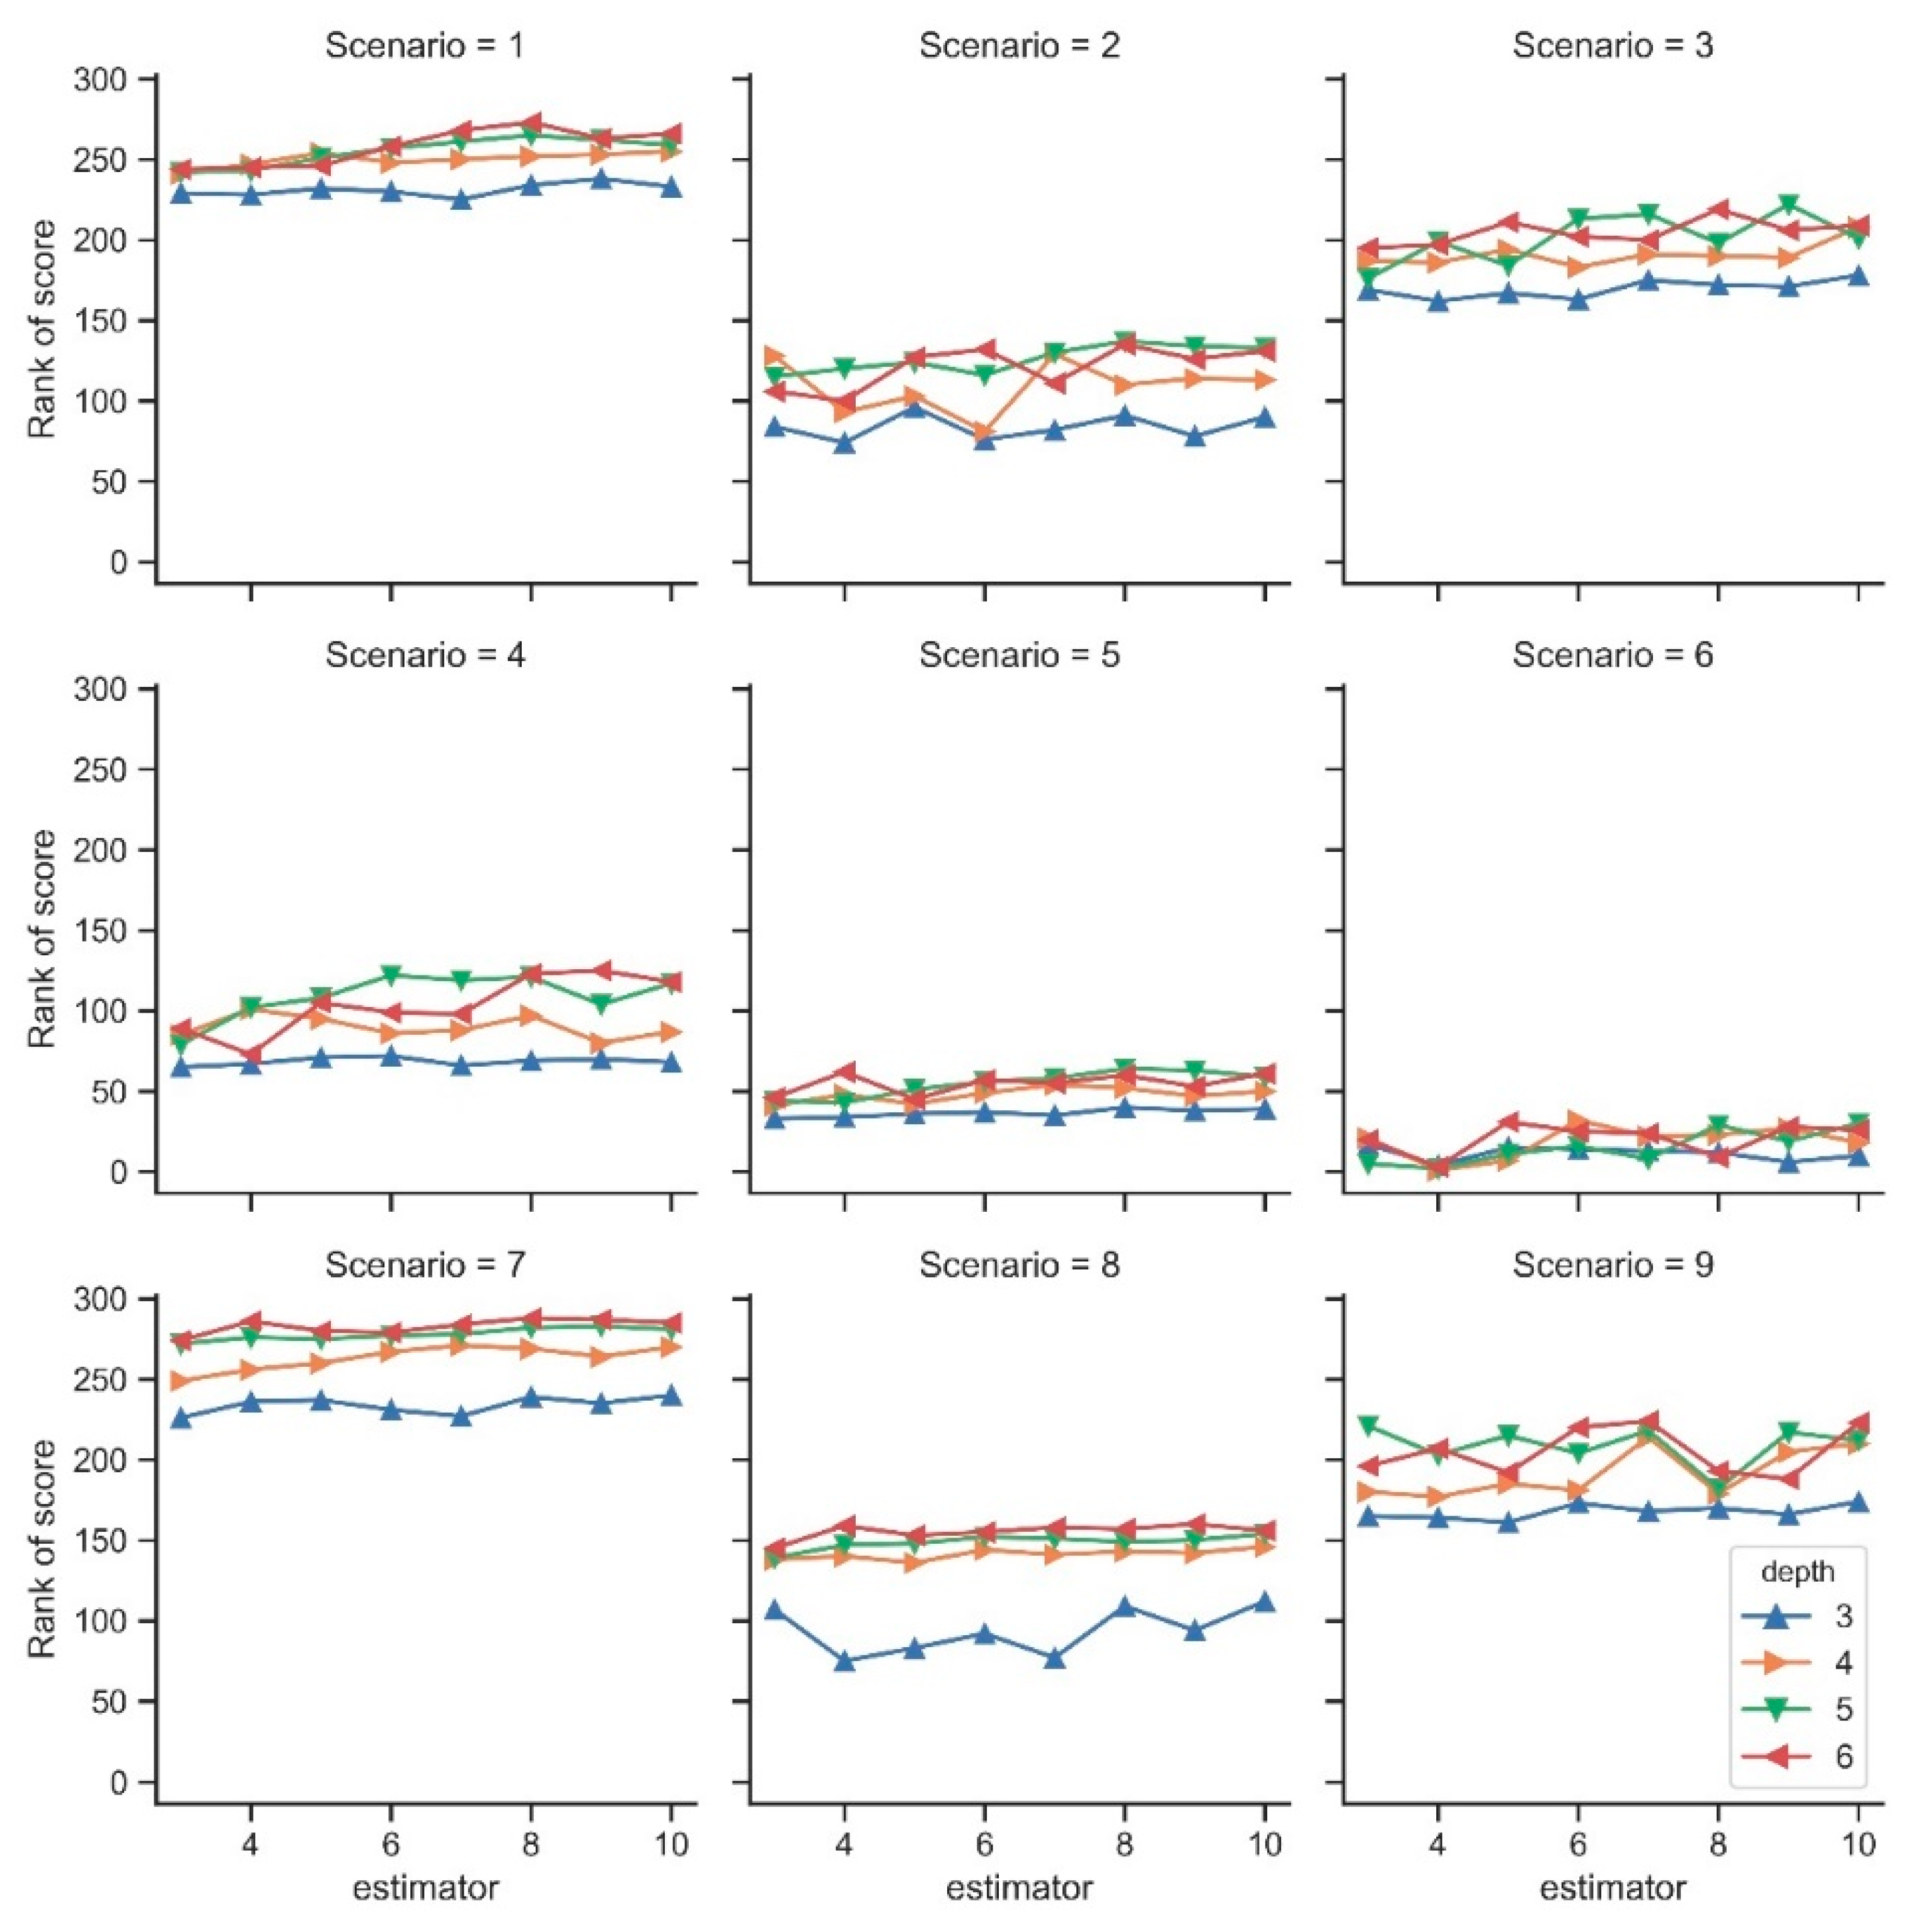
In this study, to build a simple RF structure for avoiding over-fitting, the estimator is chosen from 3, 4, …, 9, 10, and the depth is chosen from 3, 4, 5, 6, respectively. For tuning these two parameters, we adopt a grid search approach, which considers all candidate 32 (8 estimators × 4 depths) parameter combinations, and K-fold cross-validation method (K = 5) for judging the score (explained variance regression score) of each combination. The higher the score, the better the candidate parameter combinations are. From these 32 RF regression models with different parameter combinations, we try to choose a suitable one as selected reservoir outflow simulation model.
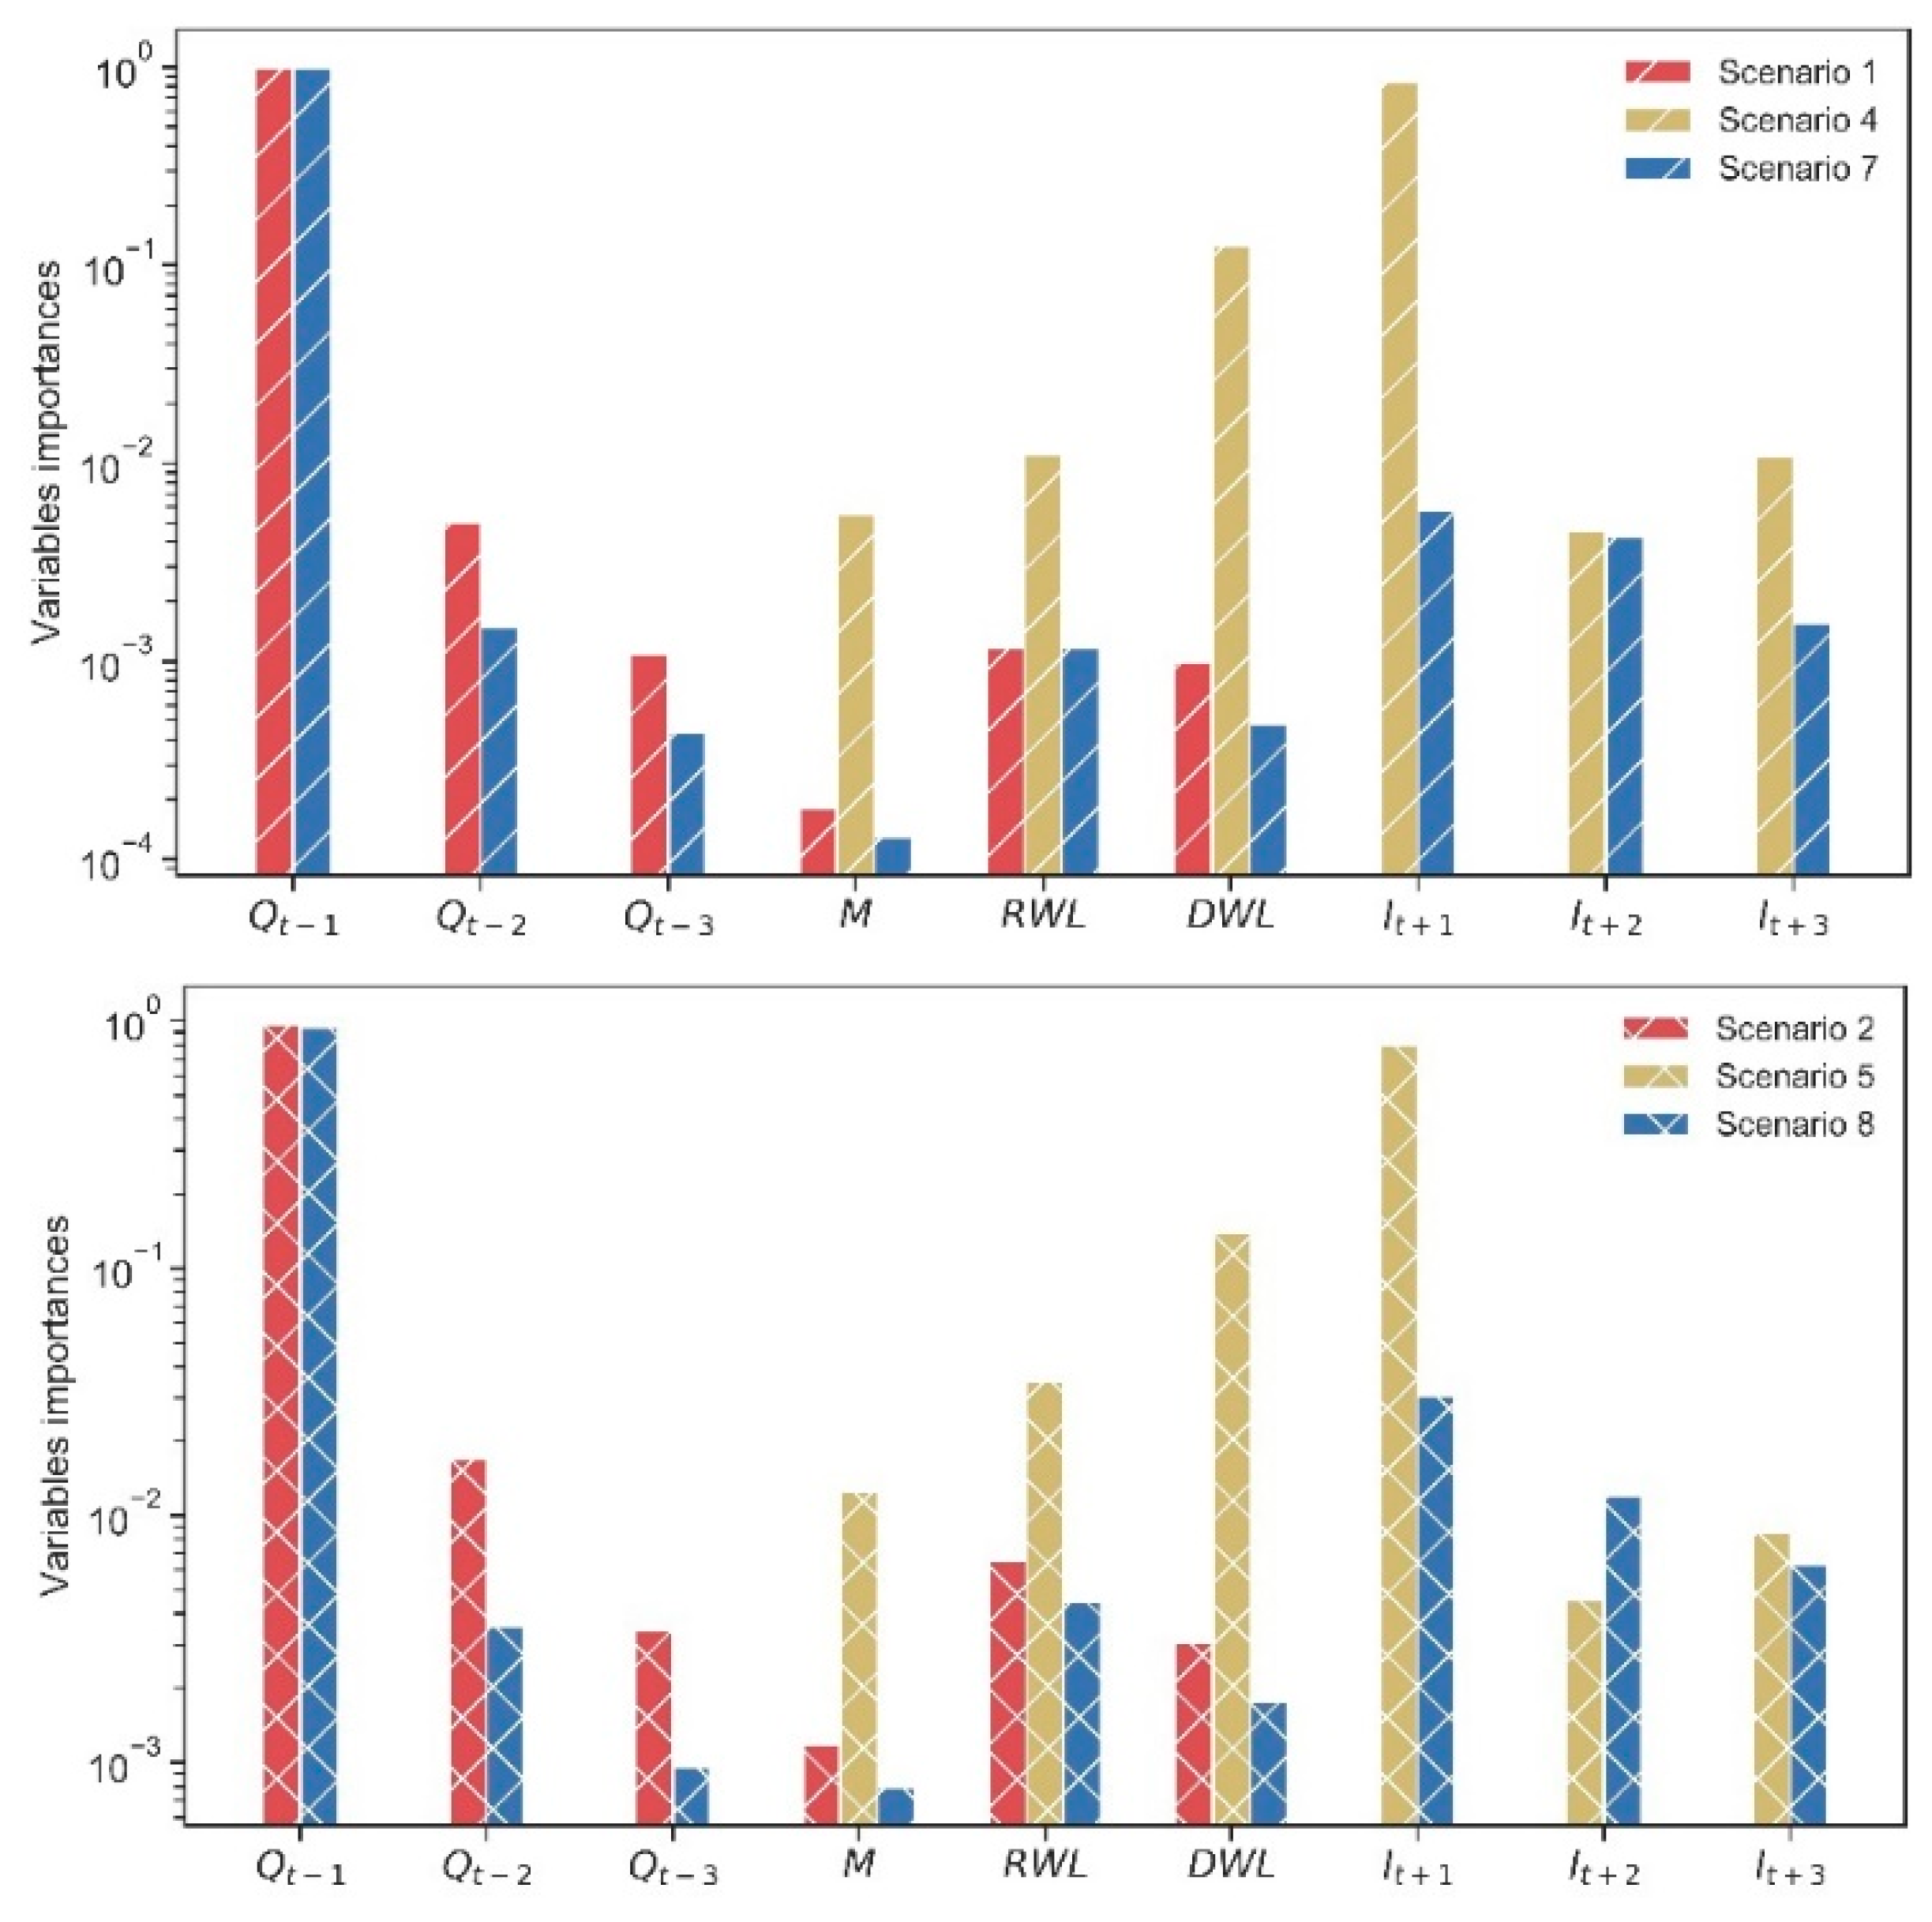
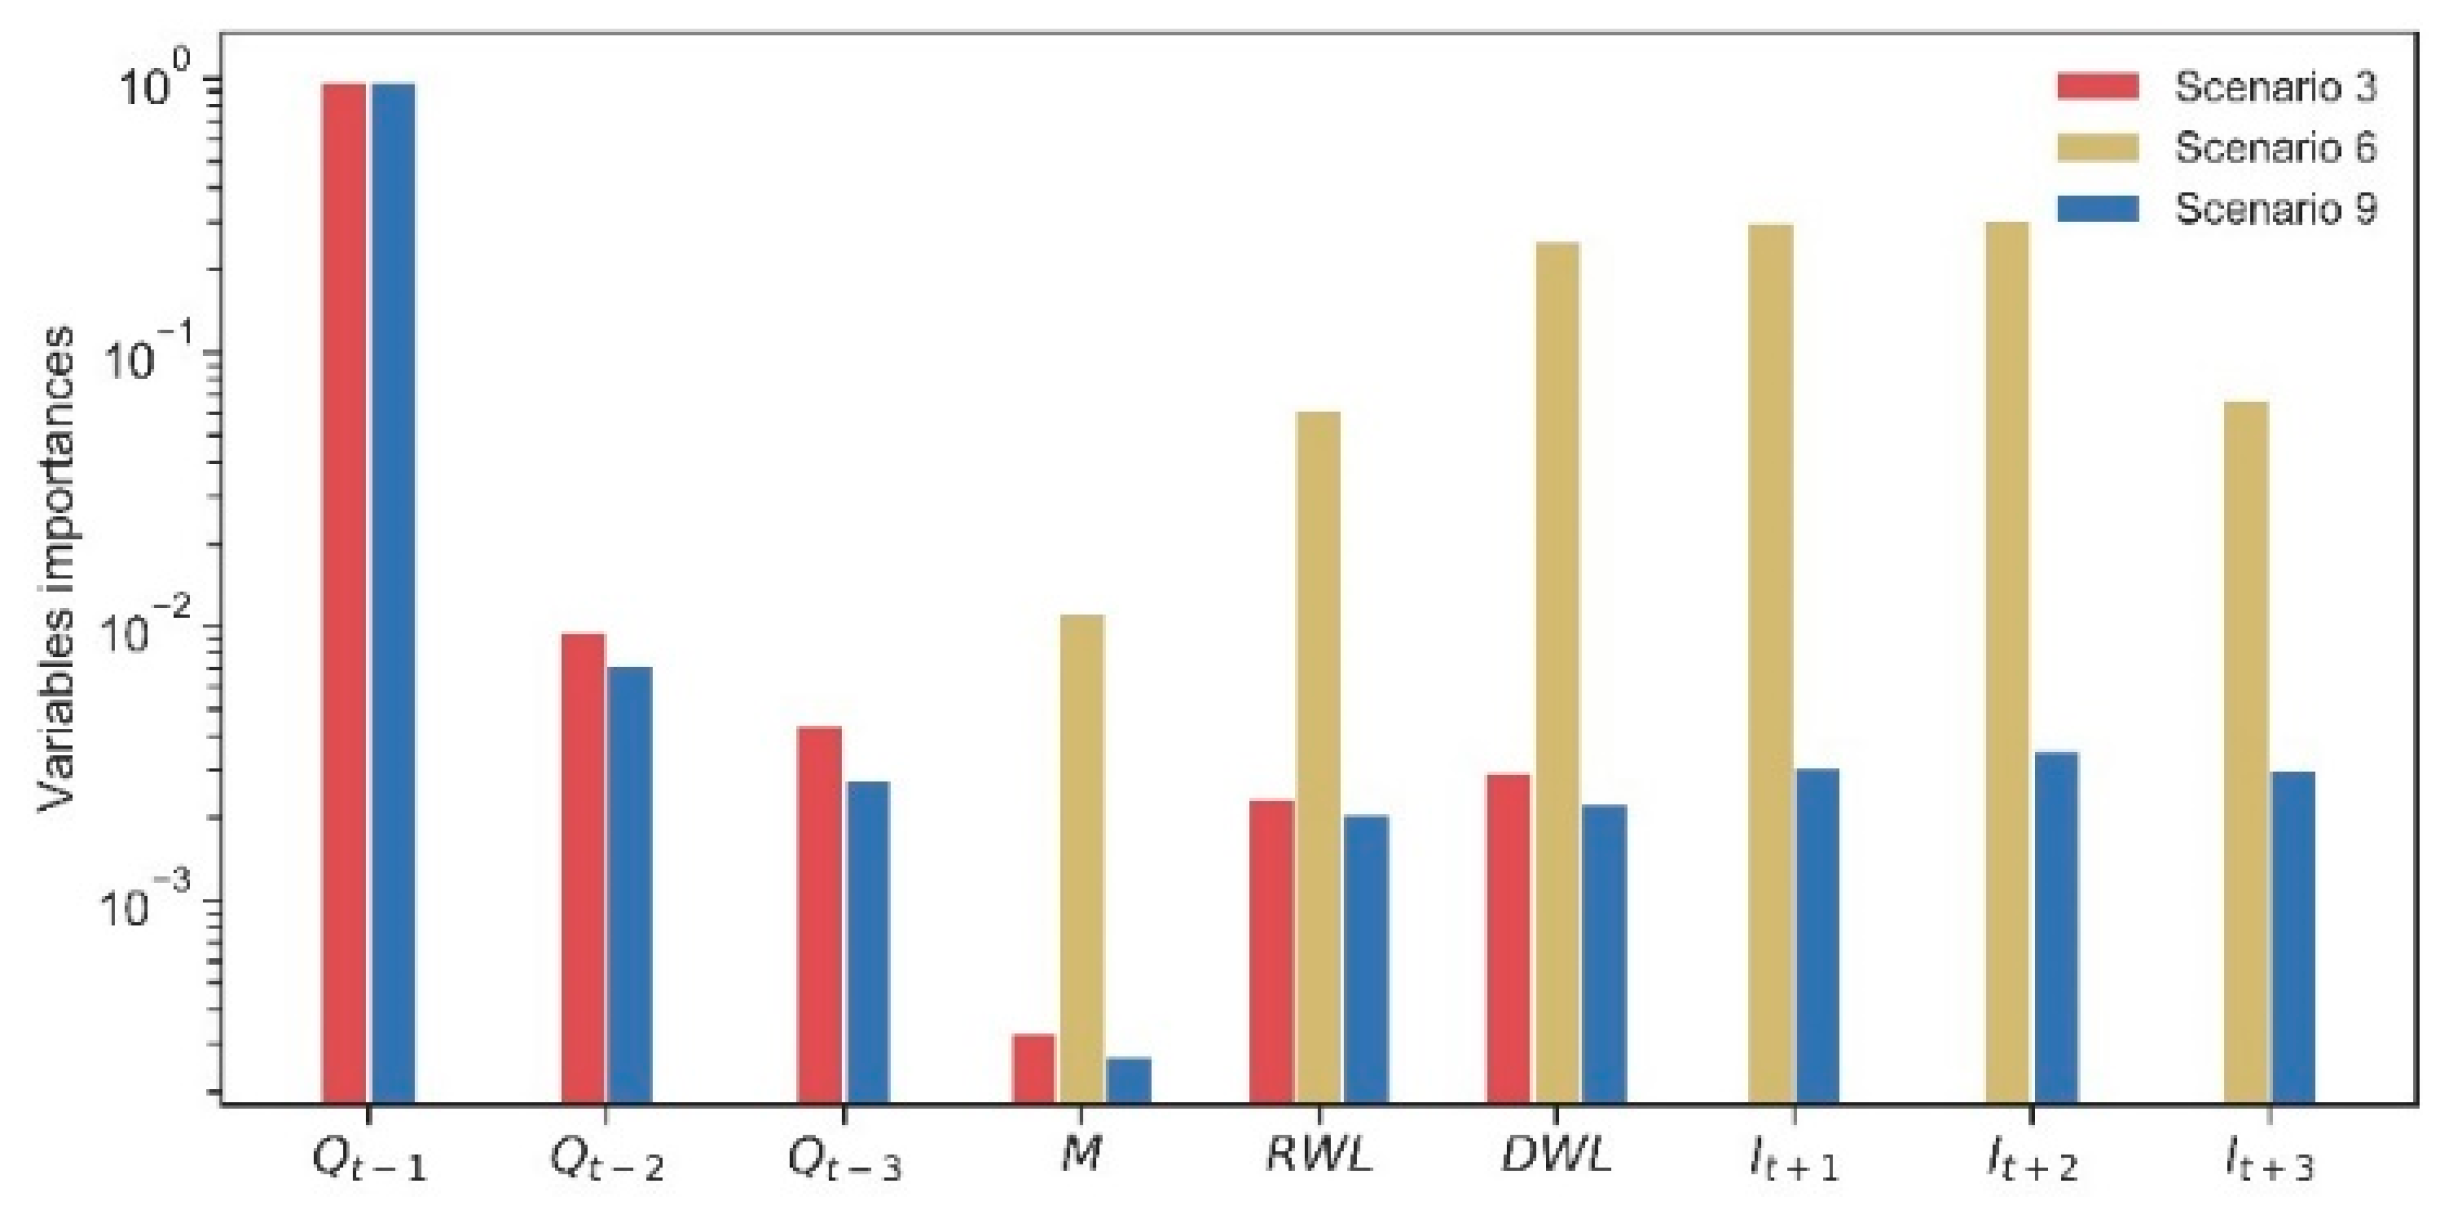
We use the shuffled training data (2008–2015) for cross-validation and calculate the nine scenarios separately. During the cross-validation process, for each of nine the scenarios, we record the importance score of input variables from RF algorithm. The variable importance scores are shown in Figure 3, on which the ordinates are logarithms. Comparing these scenarios, we find that Qt−1 is the most important variable, and the importance of It+1 will be increased significantly when past information is not used. Moreover, comparing the influences of future information between scenarios 8 and 9, there are some interesting findings. During flood season (scenario 8), It+1, It+2 and It+3 are more important, and their importance is reduced as the increase of forecasting period. However, the It+1, It+2 and It+3 are nearly of the same importance during non-flood season (scenario 9). From the above importance score of input variables, we can find that Qt−1 (past information) is the most important variable, It+1 (future information) will be the most important variable without past information, and the forecasted inflow is more important for TGR decision-making during flood season.

4.2. Selected Parameters and Simulation Results

Figure 4 plots the rank of cross-validation scores. The higher rank means higher score, namely, the better candidate parameter combinations. It is observed that the satisfying results are obtained when the depth is four. Moreover, considering more depth will lead to a complex tree structure, which may over-fit the training data. Therefore, the depth of four is an appropriate value. As for estimator, there is no obvious difference for different parameters and no unified best choices for nine scenarios. The estimator between 7 and 10 can get good results. So, for reducing calculation time and a better comparison of hydrologic information from different scenarios, we choose estimator = 7 instead of different parameter values of each scenario.
We regard the RF regression model, which has fixed parameters (four and seven), as the selected reservoir outflow simulation model. To examine the impact of different hydrologic information on model’s predictive performance and reflect the value of information, we test the predictive capability of the reservoir outflow simulation model on the hold-out dataset (2015–2017). Since hold-out data have never been used in any training process and cross-validation, they are considered here as an independent test period, which can fairly evaluate the performance of the models. For scenarios 1, 4 and 7, the test period is from 1 June 2015 to 31 May 2017. For other scenarios, only part of the data series (either flood season or non-flood season) is used. The computed statistics are summarized in Table 3. According to Reference [19], model simulation can be judged as satisfactory if NSE is greater than 0.50. The statistical performances of the simulated outflows are satisfactory for all nine scenarios since the values of NSE in Table 3 ranges from 0.572 to 0.965. After comparison of these nine scenarios, there are two findings:
(1)
Splitting the data into two parts has no improvement on the model’s performance. Compared with scenario 1, scenarios 2 and 3 do not obviously improve the performance of RMSE, NSE and △Qp in three different time periods. For scenarios 4 to 9, the result is also the same.
(2)
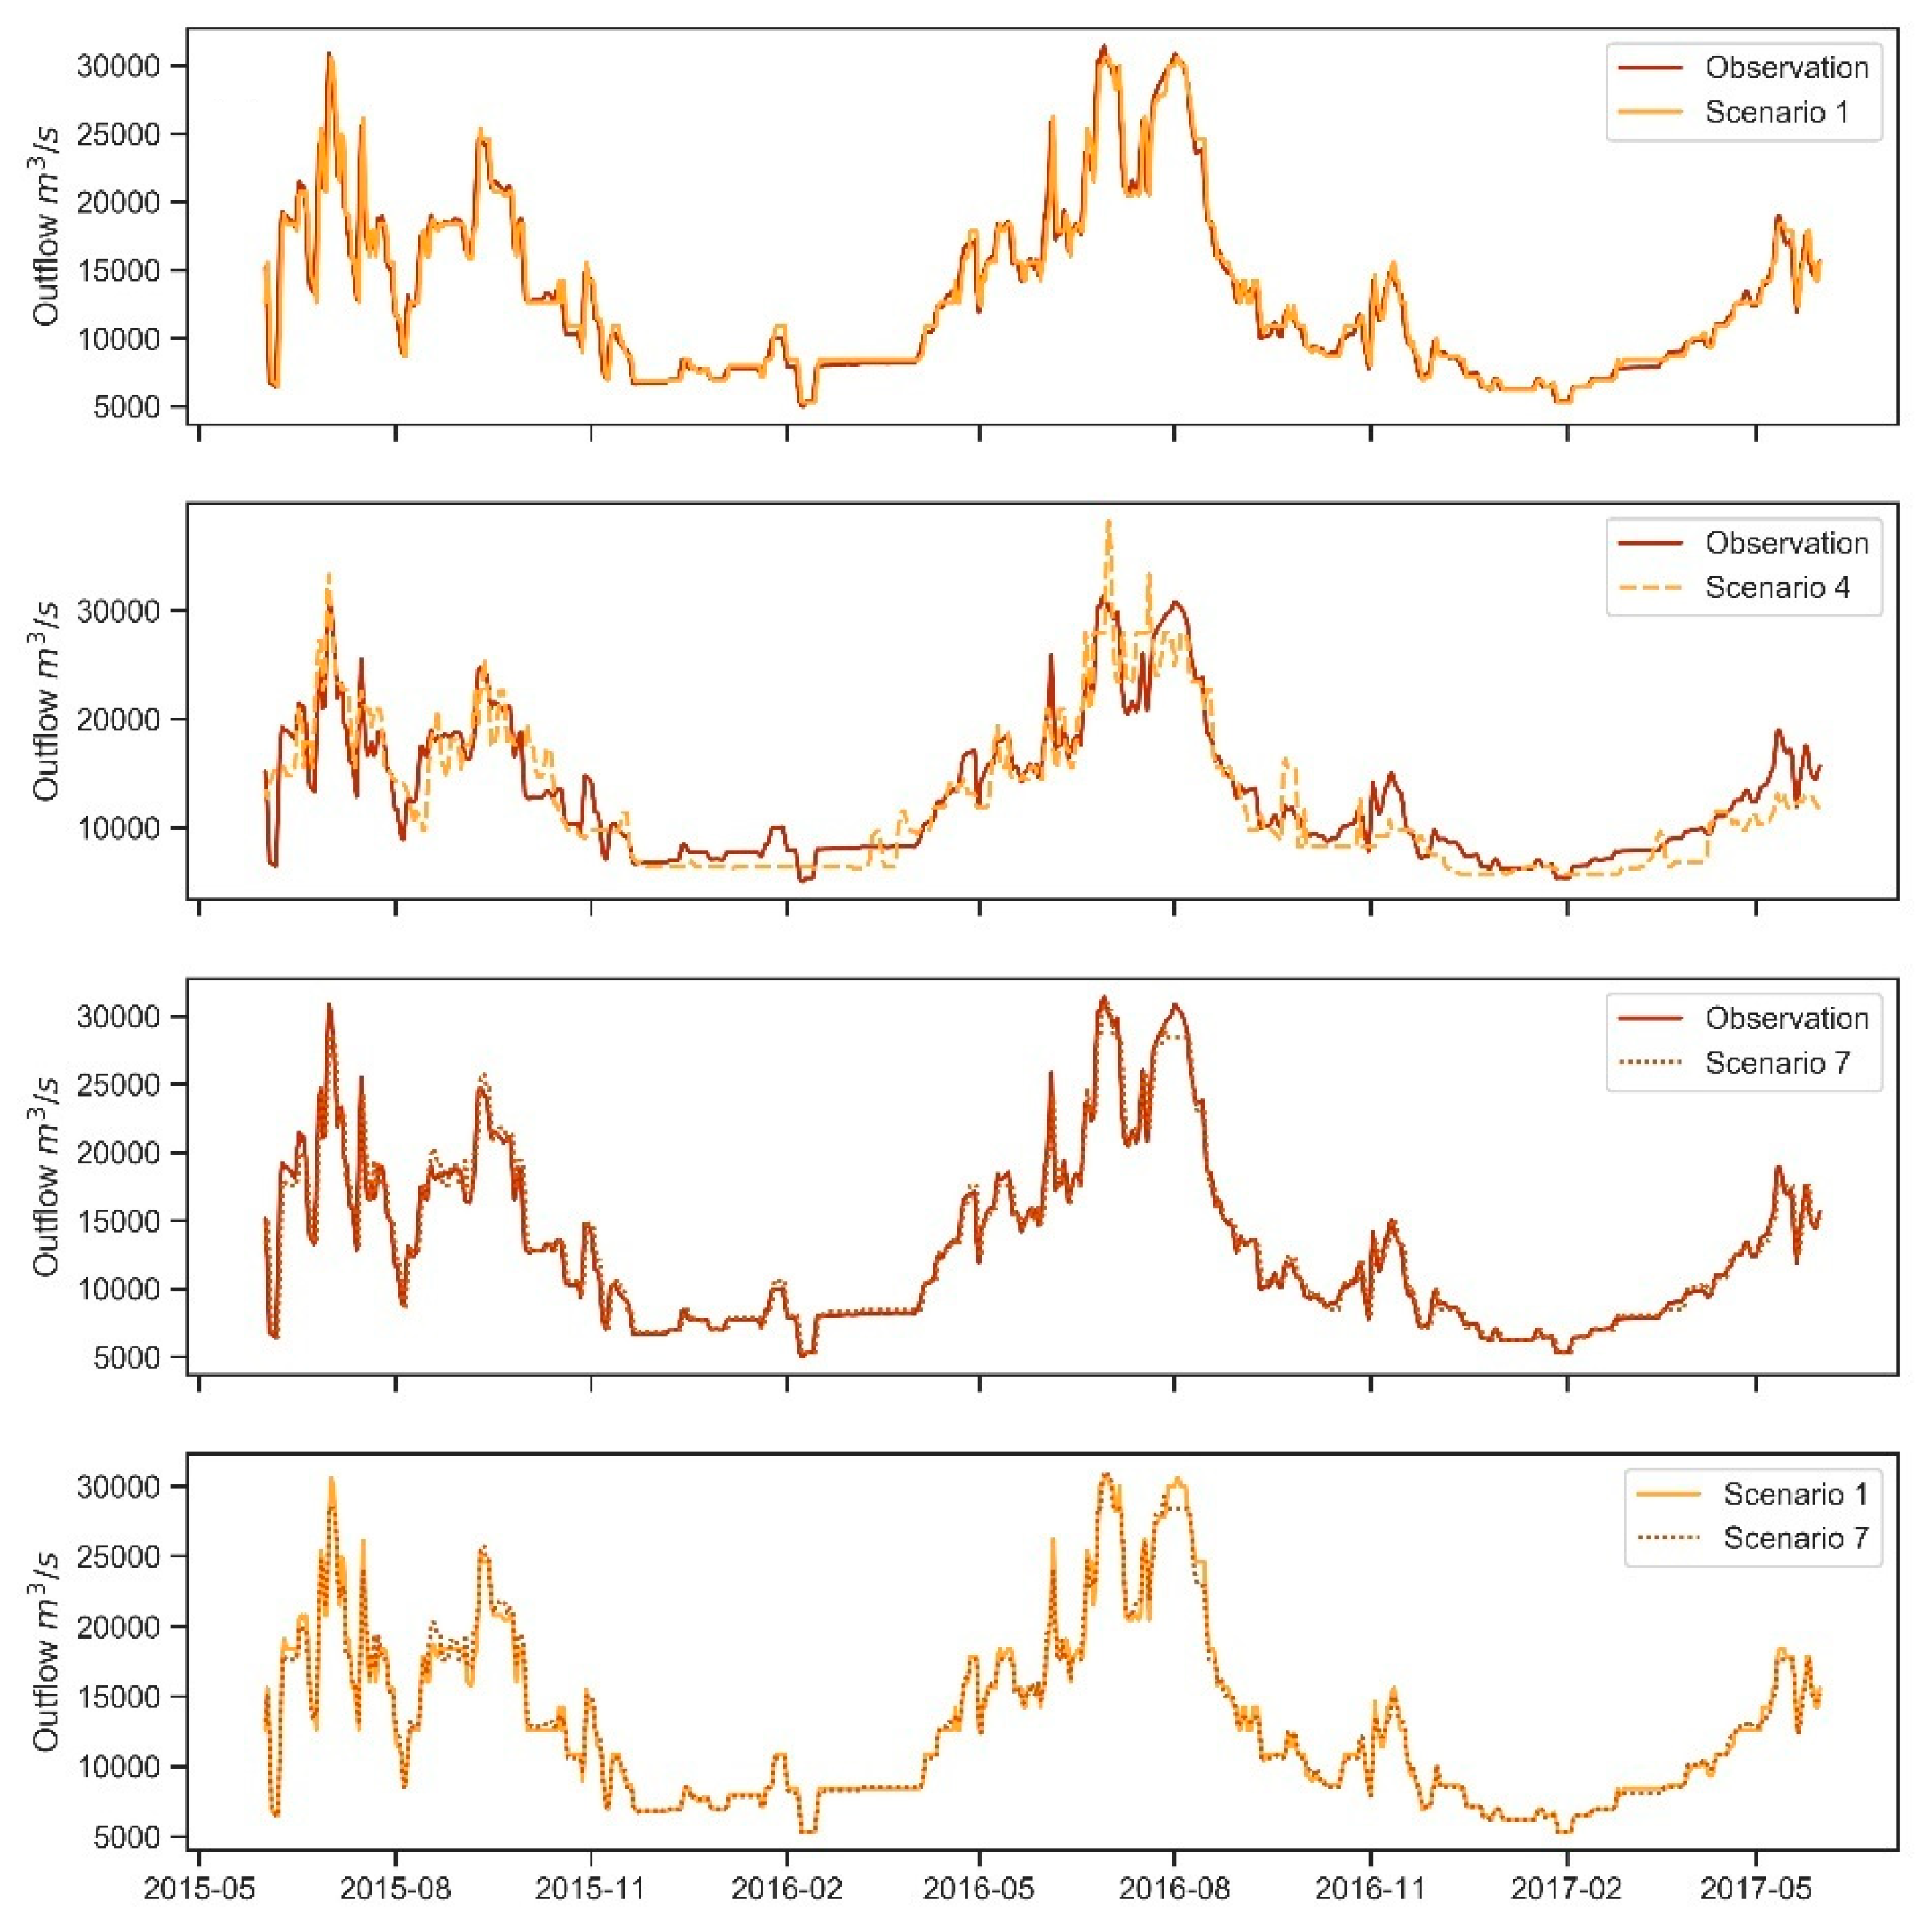
The future information is effective in a particular scenario and time period. The observed and simulated reservoir outflows of scenarios 1, 4 and 7 are shown in Figure 5. From Table 3 and Figure 5, we can observe that scenario 1 (without future information) performs slightly poorer than the best scenario 7 (with all information). Both of them are far better than scenario 4 (without past information). Comparing statistical performances of scenarios 1 and 7, scenario 7 has obviously increasing more during flood season than non-flood season. There is no significant difference between these two during non-flood season. Further, based on the values of NSE, the scenarios 1 and 7 perform better during non-flood season, while scenario 4 performs much better during flood season.
From these three facts, we can see that there are identical results with the importance of input variables. Namely, past outflow is the most important information, and future information will play a more prominent role during flood season, especially in scenario 4 (without past information).

5. Discussion

5.1. The Impact of Splitting Data Set by Prior Knowledge

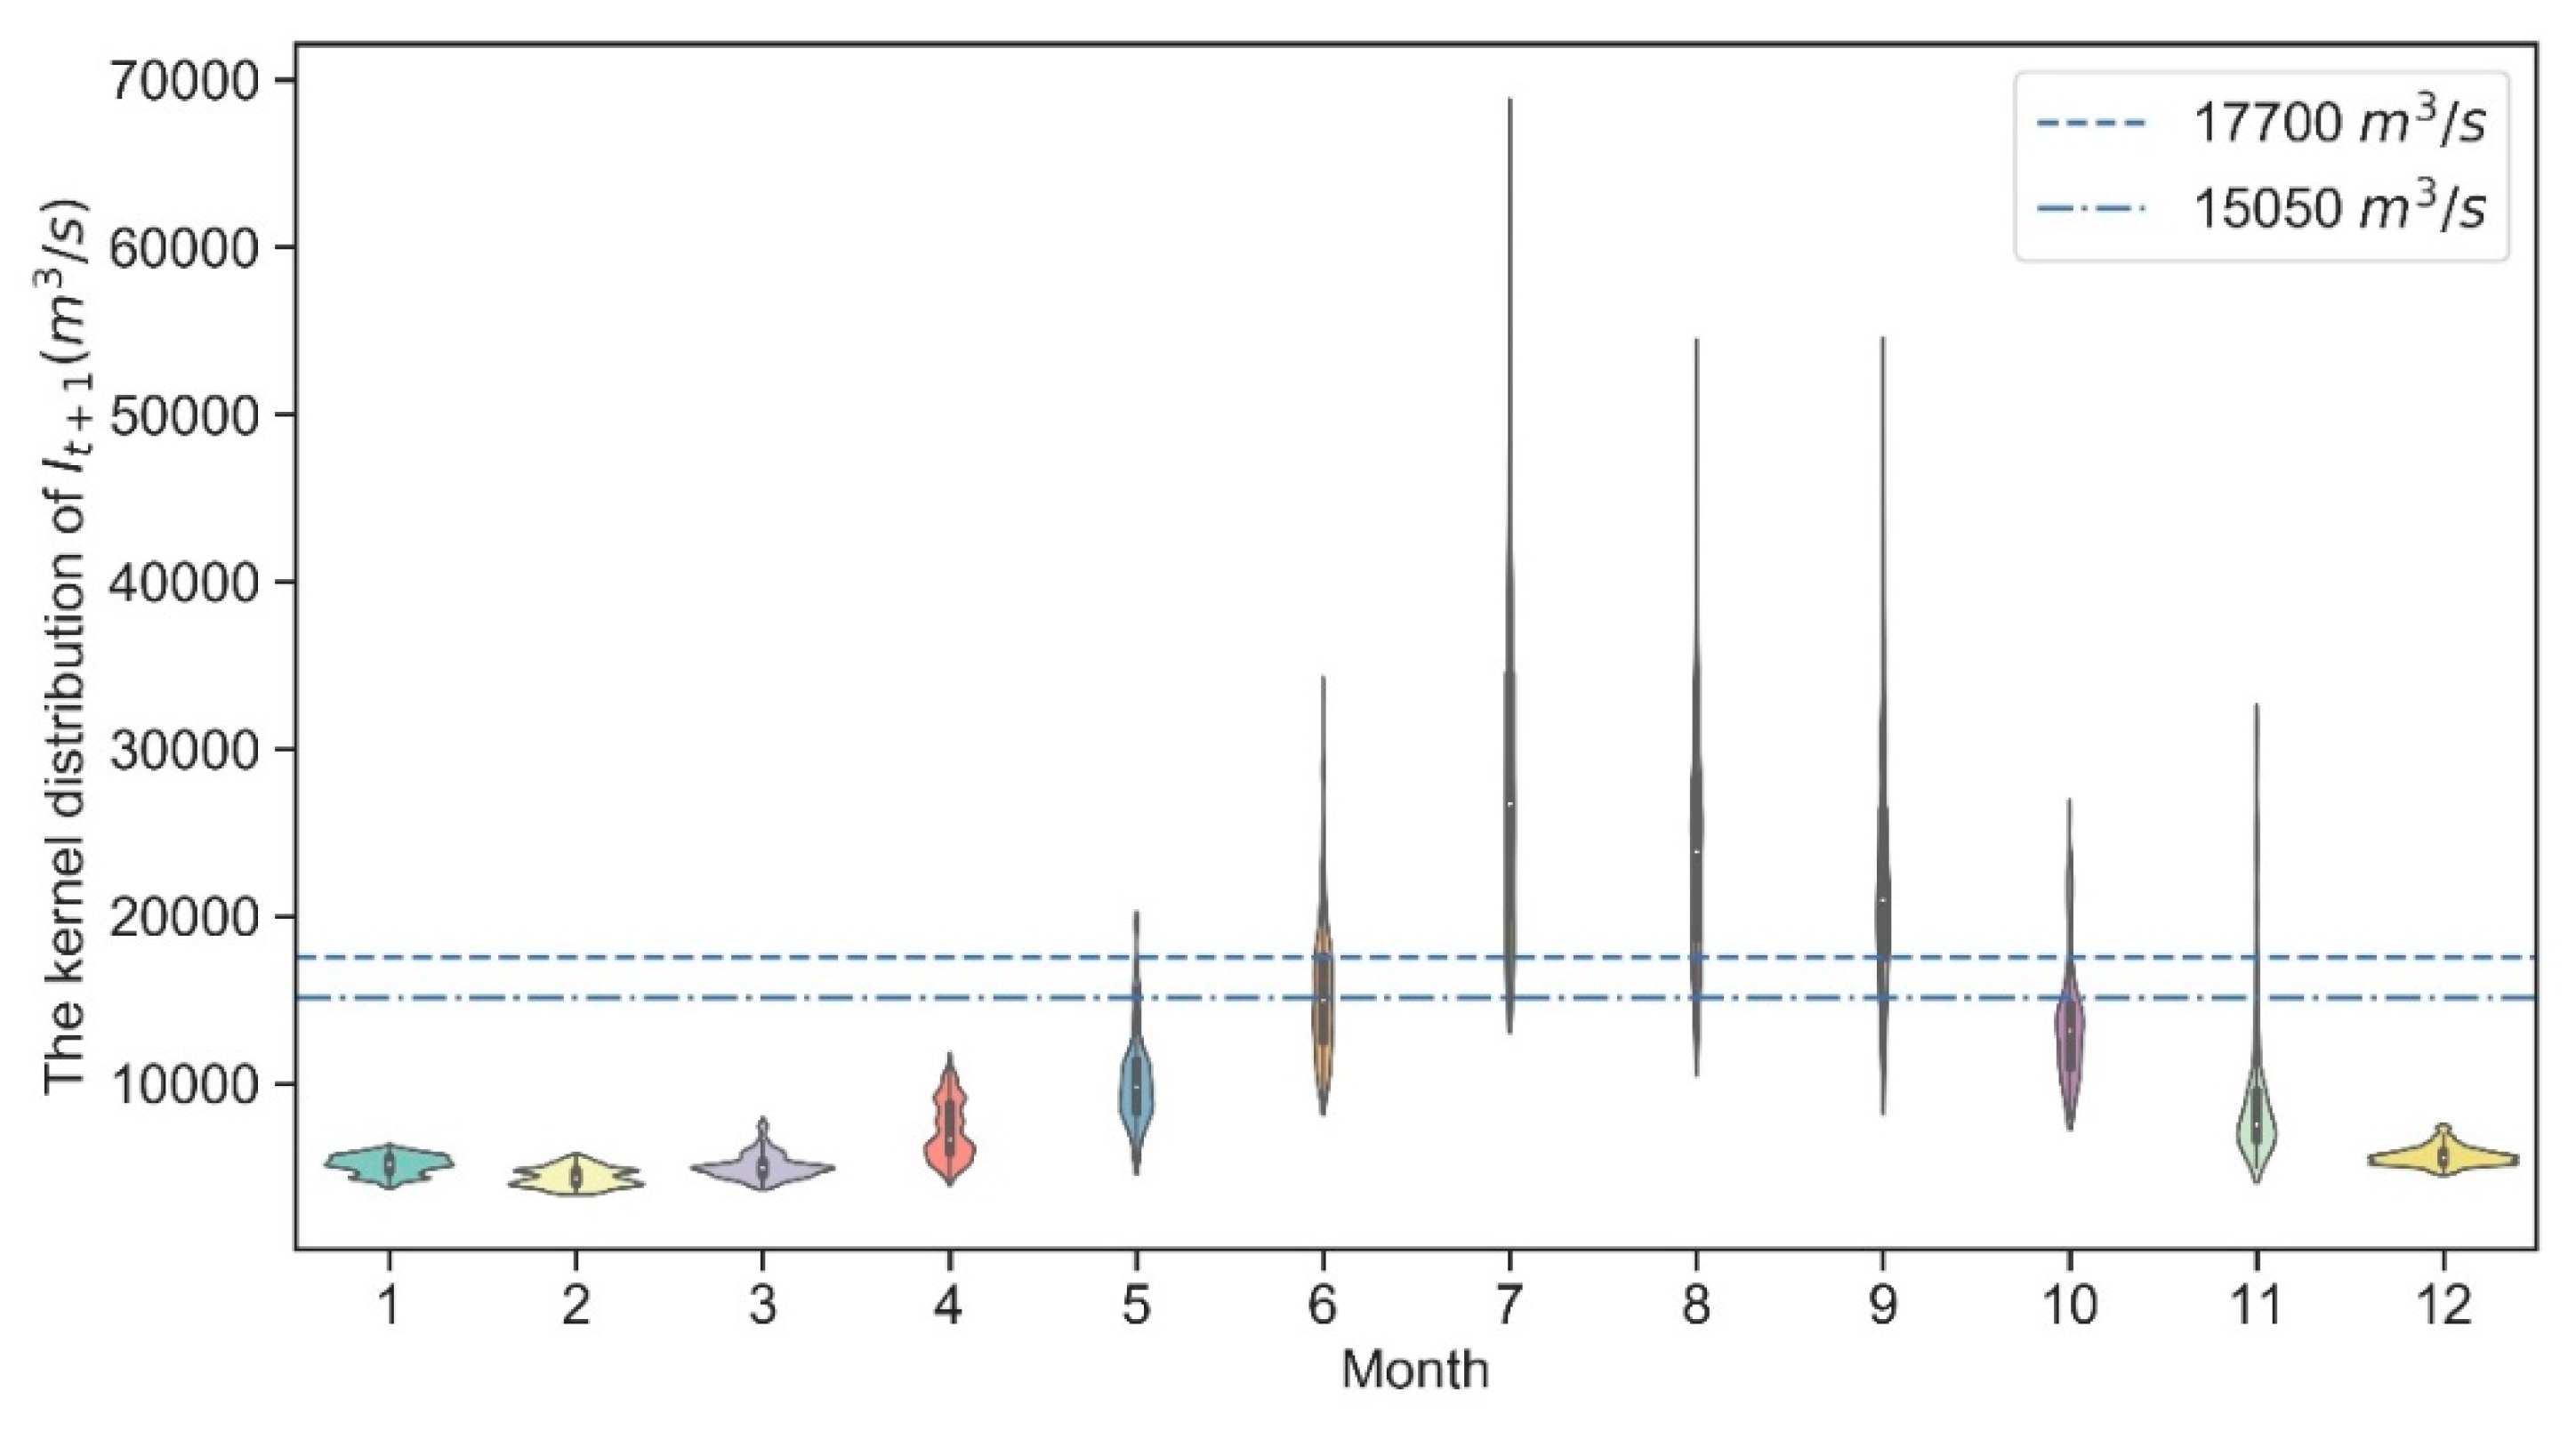
Affected by the monsoon climate and precipitation, 60–80% inflow of TGR in a year concentrates in the flood season (June to September) [20]. During the flood season, flood control is dominant among several utilization functions. Figure 6 shows the kernel distribution of It+1 in training period (2008–2015) by Violin plot, which reveals a huge difference in inflows between flood season and non-flood season.
It is natural that the performance of models will be improved by dividing yearly data sets into seasonal data sets. However, Table 3 shows that splitting the data into two parts has no significant improvement on model performance. To explain this, we decided to explore the structure of the outflow simulation models. From visible physical interpretation of tree-based algorithm, we could easily understand how the outflow simulation model makes the outflow decision.
Taking scenario 4 as an example, which has the poorest performance among scenarios 1, 4 and 7, Figure 7 shows the top of seven decision trees in the outflow simulation model, which reveals the first rule to make outflow decision. All of the seven regression trees use the values of It+1. The values to be compared are between 15,050 and 17,700 m3/s. As shown in Figure 6, when data is split by 15,050 or 17,700 m3/s, the corresponding months are mainly split into flood season (from June to September) and non-flood season (other months) of the TGR. The result proves that the RF algorithm can extract human experience effectively from history reservoir operation data. Based on the above discussion, we emphasize the importance of current time (flood season or non-flood season) for TGR decision-making.

5.2. Past Information Is the Most Important Information

We try to explain why past information is the most important. One explanation is that the past information is known and accurate while future information is forecasted with uncertainty [21]. Compared with past information, current information cannot determine the outflow alone. We can imagine that outflows will be quite different under different inflow situations although M, RWL and DWL are the same. However, if there is no flood process, keeping the past outflow would not be a bad choice.
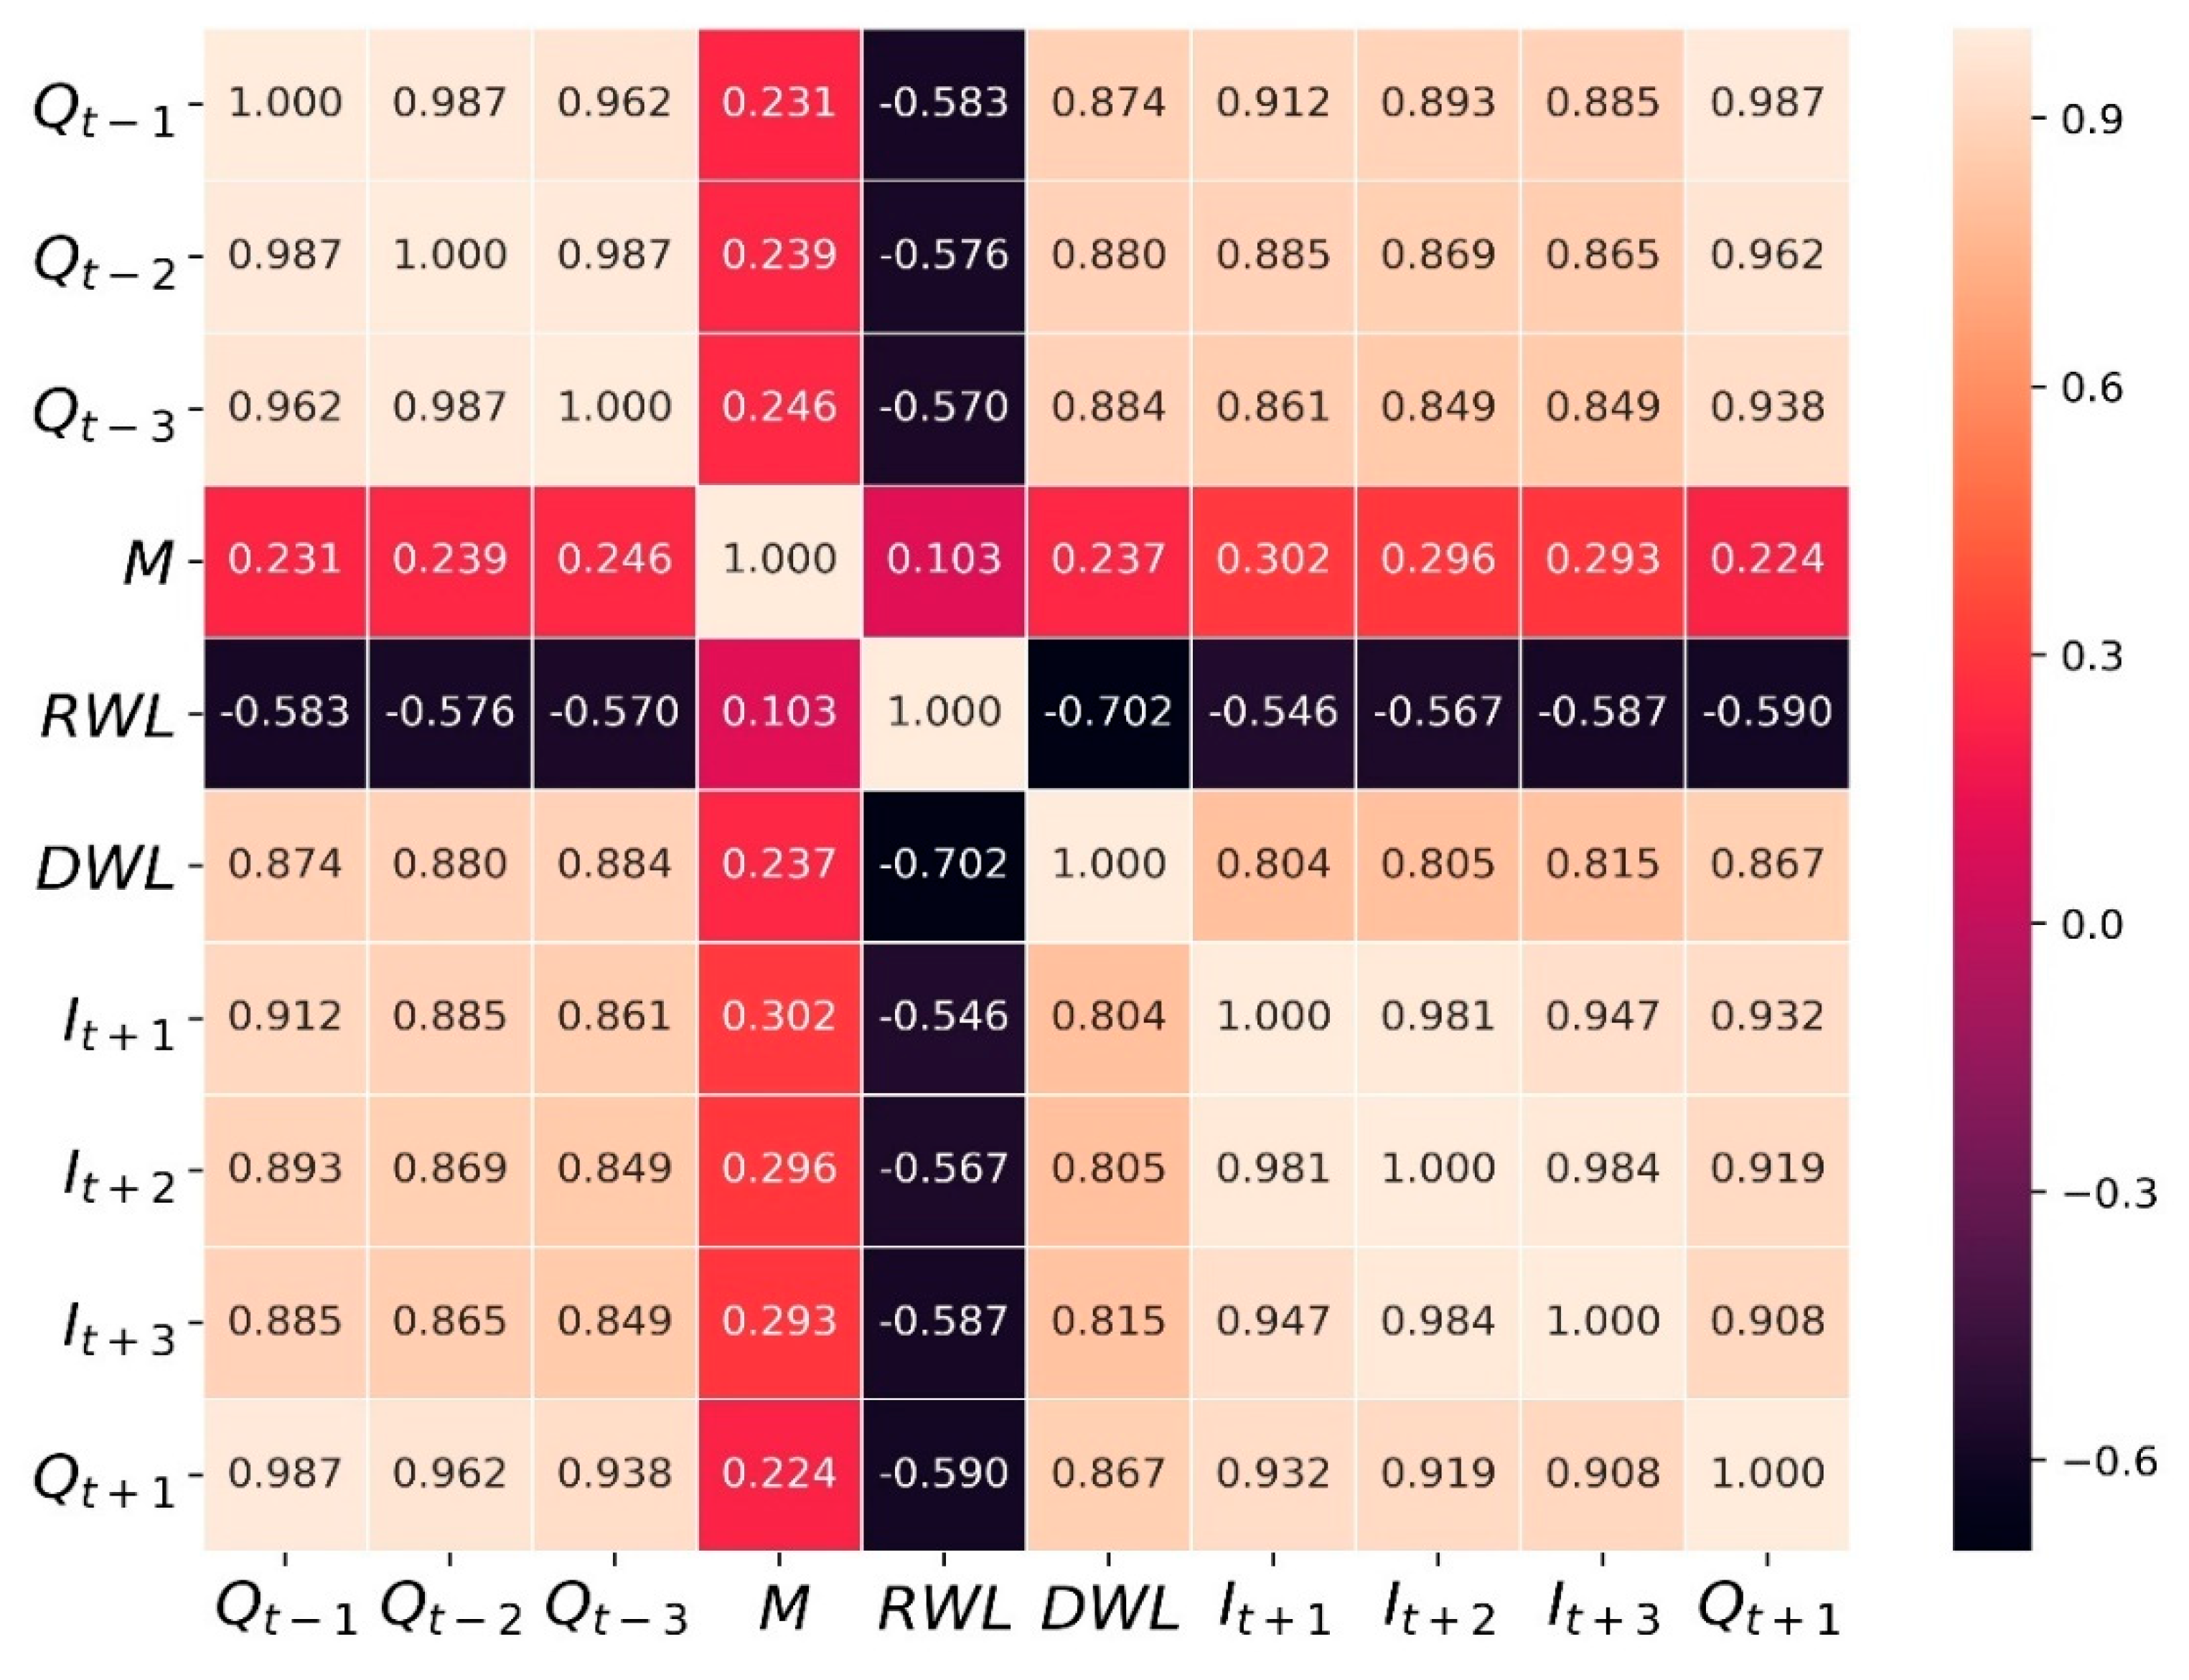
Another explanation is interestingly that past outflow information not only contains past information. Let us imagine how the operator of TGR made the outflow decision yesterday. In fact, yesterday, they already had future forecasting. So, naturally, the operator took forecasting and the state of the reservoir into consideration and made the outflow decision yesterday. It shows that past outflow information contains much more information than its surface meaning. By the above analysis, we have speculated the reason why past information is the most important. To prove our speculation quantificationally, Figure 8 shows the correlation between all variables by heat map. The first three variables that describe past outflow information have the closest correlation with the output, reservoir outflow. The variables ranking from fourth to sixth are the future information.

5.3. Future Information in Particular Scenario and Time Period

Let us think about why future information will play a more prominent role during the flood season. Forecasted inflow is of great importance to reservoir release decisions under high hydrologic uncertainty, and this is a general conclusion given by Reference [2]. Figure 6 shows that the inflow of TGR has high uncertainty during flood season, especially from July to September, when the kernel distribution is nearly a line. So, future information plays a most important role in scenario 4 during flood season can easily understand. For lacking forecasted inflow brought from past outflow information (Qt−1, Qt−2 and Qt−3), future information will have a great impact on improving outflow simulation model performance.
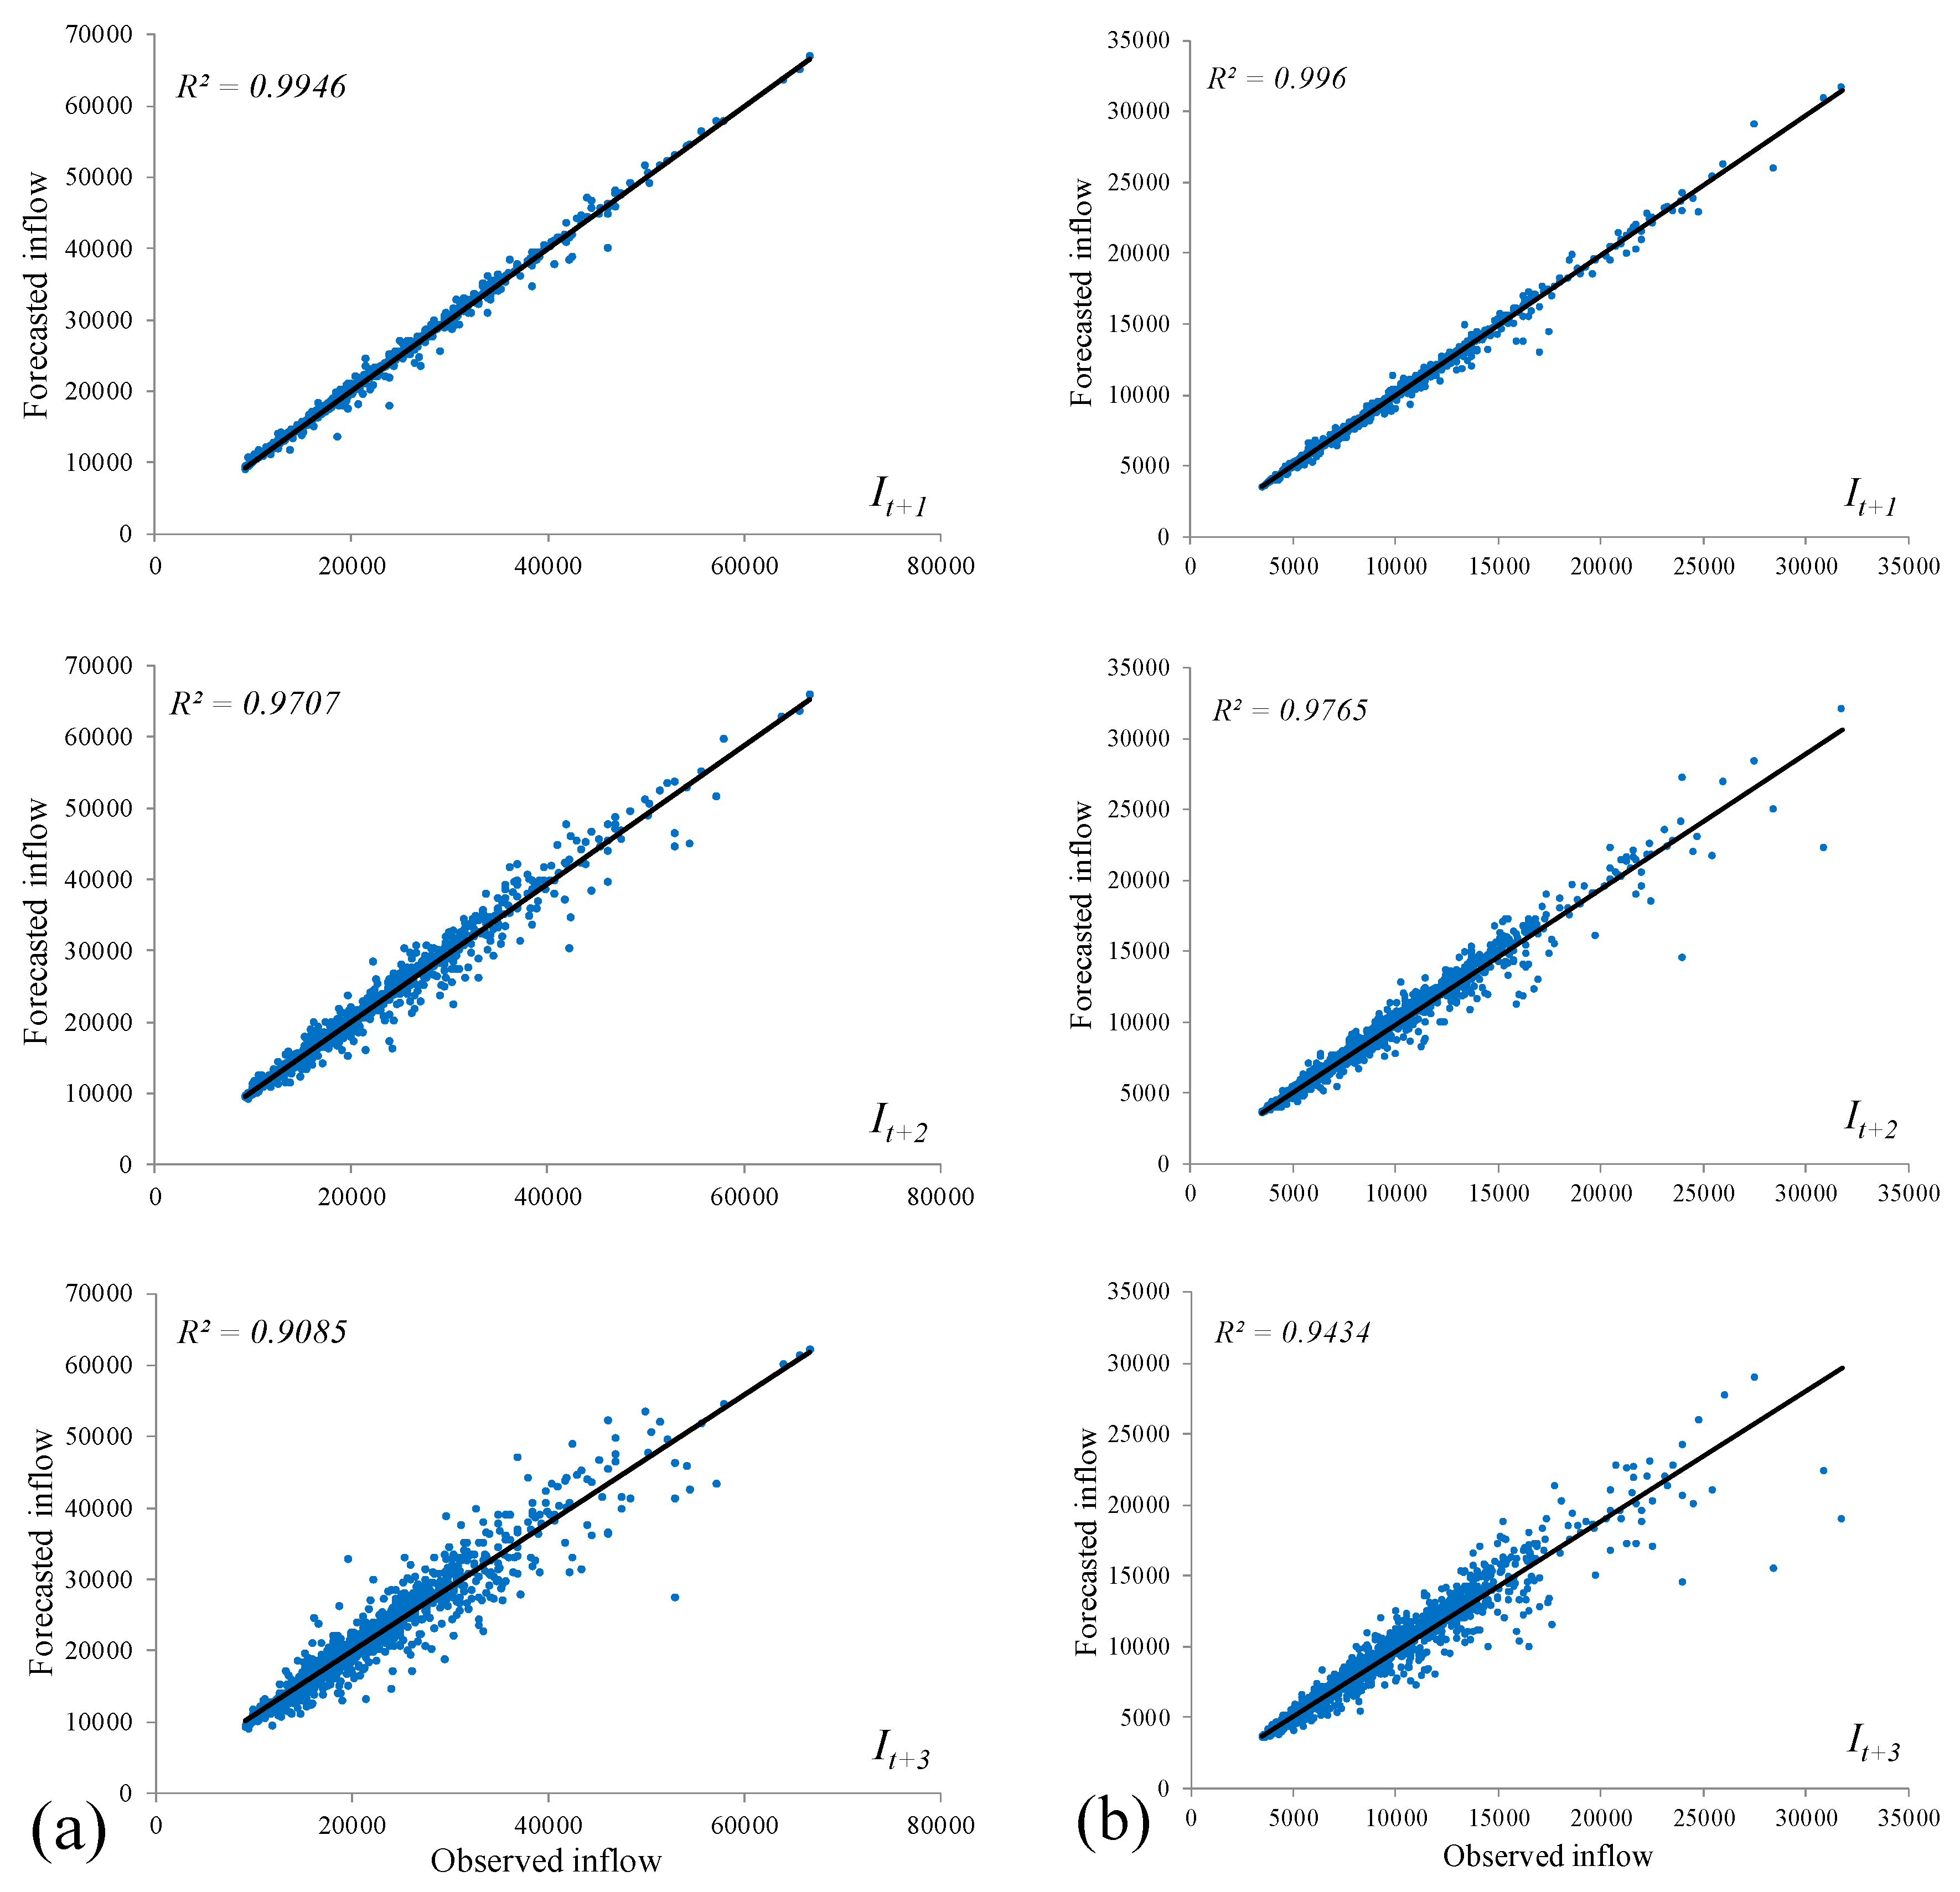
From the change in forecasting accuracy, we can prove the result of the importance of input variables. The importance of It+1, It+2, and It+3 will decrease significantly over time in the flood season. Figure 9 shows that the coefficient of determination (R2) between observed and forecasted inflows is reduced more obviously in the flood season. The values of R2 in non-flood season are higher than those in flood season. From this point of view, to make full use of future information, we suggest the operators of TGR improve forecasting accuracy, especially in flood season.

5.4. The Practical Application of This Study

From the reservoir downstream water users’ point of view, the controlled outflows from an upstream reservoir are highly dependent on the decisions made by the reservoir operators, instead of a natural inflow process. To establish proper and useful water management plans, downstream water users need to understand the operation pattern of the upstream reservoir, and even more, build some models to estimate the outflows from upstream reservoir. Our reservoir outflow simulation model meets water users’ needs, and its visible physical interpretation can further help water users understand the operation pattern of the upstream reservoir easily.
From the reservoir operators’ point of view, the simulation model contains their experience, and they can make corrections based on the model output. The corrected value can be used as daily outflow decisions in real-world reservoir operation. The simulation model will be a useful tool for reservoir operators. In addition to the simulation model, evaluating hydrologic information can help them too. Reservoir operators need some hydrologic information to make outflow decisions. By the statistical measurements of outflow simulation models and input variables importance analysis, we infer the relationship between different groups of hydrologic information and observed outflow. For reservoir operators of TGR, we suggest that they should pay close attention to the value of future information, especially in the flood season. Besides, the importance of forecasted inflow is evidently reduced with the increasing of the forecast period during flood season. For ensuring the value of future information, improved forecasting accuracy and rolling forecasting should be provided to reservoir operators.
From the researchers’ point of view, we need to close the gap between theoretical optimal and the real-world reservoir operation. Many theoretical optimal operations for TGR are based on operating rules, which contain different hydrologic information variables [22,23,24,25,26]. Usually, these variables are selected by researchers’ experience. However, which variables should be recommended and selected? In this study, we first prove that TGR is operated differently over the flood season and non-flood season, thus, more realistic seasonal operating rules should be established. Second, we suggest that operating rules should contain the previous outflow, which has the strongest ties with outflow decisions. Last, we prove that forecasted inflow is of great importance to reservoir outflow decisions in the flood season, so forecasted inflow is highly recommended to be included in flood control operating rules.

6. Conclusions

In this study, the RF algorithm was proposed to build a reservoir outflow simulation model for TGR in China. Different simulation models were established based on the combinations of three groups of hydrologic information. The influences and value of hydrologic information for reservoir outflow decision-making were evaluated. The following findings can be drawn:
(1)
The statistical performances of simulation results demonstrate that the RF algorithm can reasonably simulate outflow decisions. The RF with visible physical interpretation and variables importance measure is suitable and helpful for evaluating the value of hydrologic information.
(2)
The past outflow is the most important information for reservoir operator decision-making. The forecasted inflow is more important during flood season than non-flood season in outflow decision-making.
(3)
The proposed reservoir outflow simulation model is useful for downstream water users and operators of TGR. The value analysis of hydrologic information will help reservoir operators and theoretical optimization researchers of TGR make better use of hydrological information in practice and study.

Author Contributions

Conceptualization and software. K.C. and S.G.; Data Curation, T.X. and S.S.; Formal Analysis, S.H. and Y.Z.; Writing-Original Draft Preparation, K.C.; Writing-Review & Editing, S.G.

Funding

This paper was funded by the National Key R&D Plan of China (Grant No. 2016YFC0402206) and the National Natural Science Foundation of China (Grant No. 51539009; 51879192).

Acknowledgments

The authors are very grateful to the China Yangtze Power Co., Ltd. and Middle Changjiang River Bureau of Hydrology and Water Resources Survey for providing valuable data.

Conflicts of Interest

The authors declare no conflict of interest.

References

  1. Bessler, F.T.; Savic, D.A.; Walters, G.A. Water reservoir control with data mining. J. Water Res. Plan. Manag. 2003, 129, 26–34. [Google Scholar] [CrossRef]
  2. Hejazi, M.I.; Cai, X.; Ruddell, B.L. The role of hydrologic information in reservoir operation—Learning from historical releases. Adv. Water Resour. 2008, 31, 1636–1650. [Google Scholar] [CrossRef]
  3. Corani, G.; Rizzoli, A.E.; Salvetti, A.; Zaffalon, M. Reproducing human decisions in reservoir management: The case of lake Lugano. In Information Technologies in Environmental Engineering; Springer: Berlin, Germany, 2009; pp. 252–263. [Google Scholar] [CrossRef]
  4. Breiman, L. Random forests. Mach. Learn. 2001, 45, 5–32. [Google Scholar] [CrossRef]
  5. Caruana, R.; Niculescu-Mizil, A. An empirical comparison of supervised learning algorithms. In Proceedings of the 23rd International Conference on Machine Learning, Pittsburgh, PA, USA, 25–29 June 2006; ACM: Pittsburgh, PA, USA, 2006; pp. 161–168. [Google Scholar] [CrossRef] [Green Version]
  6. Li, B.; Yang, G.S.; Wan, R.R.; Dai, X.; Zhang, Y.H. Comparison of Random Forests and other statistical methods for the prediction of lake water level: A case study of the Poyang lake in China. Hydrol. Res. 2016, 47, 69–83. [Google Scholar] [CrossRef]
  7. Albers, S.J.; Dery, S.J.; Petticrew, E.L. Flooding in the Nechako river basin of Canada: A Random Forest modeling approach to flood analysis in a regulated reservoir system. Can. Water Resour. J. 2016, 41, 250–260. [Google Scholar] [CrossRef]
  8. Yang, T.; Gao, X.; Sorooshian, S.; Li, X. Simulating California reservoir operation using the classification and regression-tree algorithm combined with a shuffled cross-validation scheme. Water Resour. Res. 2016, 52, 1626–1651. [Google Scholar] [CrossRef]
  9. Sultana, Z.; Sieg, T.; Kellermann, P.; Müller, M.; Kreibich, H. Assessment of business interruption of flood-affected companies using Random Forests. Water 2018, 10, 1049. [Google Scholar] [CrossRef]
  10. Tillman, F.D.; Anning, D.W.; Heilman, J.A.; Buto, S.G.; Miller, M.P. Managing salinity in upper Colorado river basin streams: Selecting catchments for sediment control efforts using watershed characteristics and Random Forests models. Water 2018, 10, 676. [Google Scholar] [CrossRef]
  11. Zhang, J.; Feng, L.; Chen, L.; Wang, D.; Dai, M.; Xu, W.; Yan, T. Water compensation and its implication of the Three Gorges Reservoir for the river-lake system in the middle Yangtze river, china. Water 2018, 10, 1011. [Google Scholar] [CrossRef]
  12. Ma, C.; Lian, J.J.; Wang, J.N. Short-term optimal operation of Three-gorge and Gezhouba cascade hydropower stations in non-flood season with operation rules from data mining. Energy Convers. Manag. 2013, 65, 616–627. [Google Scholar] [CrossRef]
  13. Cunge, J.A. On the subject of a flood propagation computation method (musklngum method). J. Hydraul. Res. 1969, 7, 205–230. [Google Scholar] [CrossRef]
  14. Nash, J. The form of the instantaneous unit hydrograph. Int. Assoc. Sci. Hydrol. Publ. 1957, 3, 114–121. [Google Scholar]
  15. Ren-Jun, Z. The xinanjiang model applied in china. J. Hydrol. 1992, 135, 371–381. [Google Scholar] [CrossRef]
  16. Hancock, T.; Put, R.; Coomans, D.; Vander Heyden, Y.; Everingham, Y. A performance comparison of modem statistical techniques for molecular descriptor selection and retention prediction in chromatographic qsrr studies. Chemom. Intell. Lab. Syst. 2005, 76, 185–196. [Google Scholar] [CrossRef]
  17. Yin, J.B.; Guo, S.L.; He, S.K.; Guo, J.L.; Hong, X.J.; Liu, Z.J. A copula-based analysis of projected climate changes to bivariate flood quantiles. J. Hydrol. 2018, 566, 23–42. [Google Scholar] [CrossRef]
  18. Yin, J.B.; Guo, S.L.; Liu, Z.J.; Yang, G.; Zhong, Y.X.; Liu, D.D. Uncertainty analysis of bivariate design flood estimation and its impacts on reservoir routing. Water Resour Manag 2018, 32, 1795–1809. [Google Scholar] [CrossRef]
  19. Moriasi, D.N.; Arnold, J.G.; Van Liew, M.W.; Bingner, R.L.; Harmel, R.D.; Veith, T.L. Model evaluation guidelines for systematic quantification of accuracy in watershed simulations. Trans. ASABE 2007, 50, 885–900. [Google Scholar] [CrossRef]
  20. Wu, X.S.; Guo, S.L.; Yin, J.B.; Yang, G.; Zhong, Y.X.; Liu, D.D. On the event-based extreme precipitation across China: Time distribution patterns, trends, and return levels. J. Hydrol. 2018, 562, 305–317. [Google Scholar] [CrossRef]
  21. Wu, X.S.; Wang, Z.L.; Guo, S.L.; Liao, W.L.; Zeng, Z.Y.; Chen, X.H. Scenario-based projections of future urban inundation within a coupled hydrodynamic model framework: A case study in Dongguan city, China. J. Hydrol. 2017, 547, 428–442. [Google Scholar] [CrossRef]
  22. Liu, X.Y.; Guo, S.L.; Liu, P.; Chen, L.; Li, X.A. Deriving optimal refill rules for multi-purpose reservoir operation. Water Resour. Manag. 2011, 25, 431–448. [Google Scholar] [CrossRef]
  23. Guo, S.L.; Chen, J.H.; Li, Y.; Liu, P.; Li, T.Y. Joint operation of the multi-reservoir system of the Three Gorges and the Qingjiang cascade reservoirs. Energies 2011, 4, 1036–1050. [Google Scholar] [CrossRef]
  24. Li, Y.; Guo, S.L.; Quo, J.L.; Wang, Y.; Li, T.Y.; Chen, J.H. Deriving the optimal refill rule for multi-purpose reservoir considering flood control risk. J. Hydrol.-Environ. Res. 2014, 8, 248–259. [Google Scholar] [CrossRef]
  25. Mu, J.; Ma, C.; Zhao, J.Q.; Lian, J.J. Optimal operation rules of Three-Gorge and Gezhouba cascade hydropower stations in flood season. Energy Convers. Manag. 2015, 96, 159–174. [Google Scholar] [CrossRef]
  26. Zhou, Y.L.; Guo, S.L.; Xu, C.Y.; Liu, P.; Qin, H. Deriving joint optimal refill rules for cascade reservoirs with multi-objective evaluation. J. Hydrol. 2015, 524, 166–181. [Google Scholar] [CrossRef]
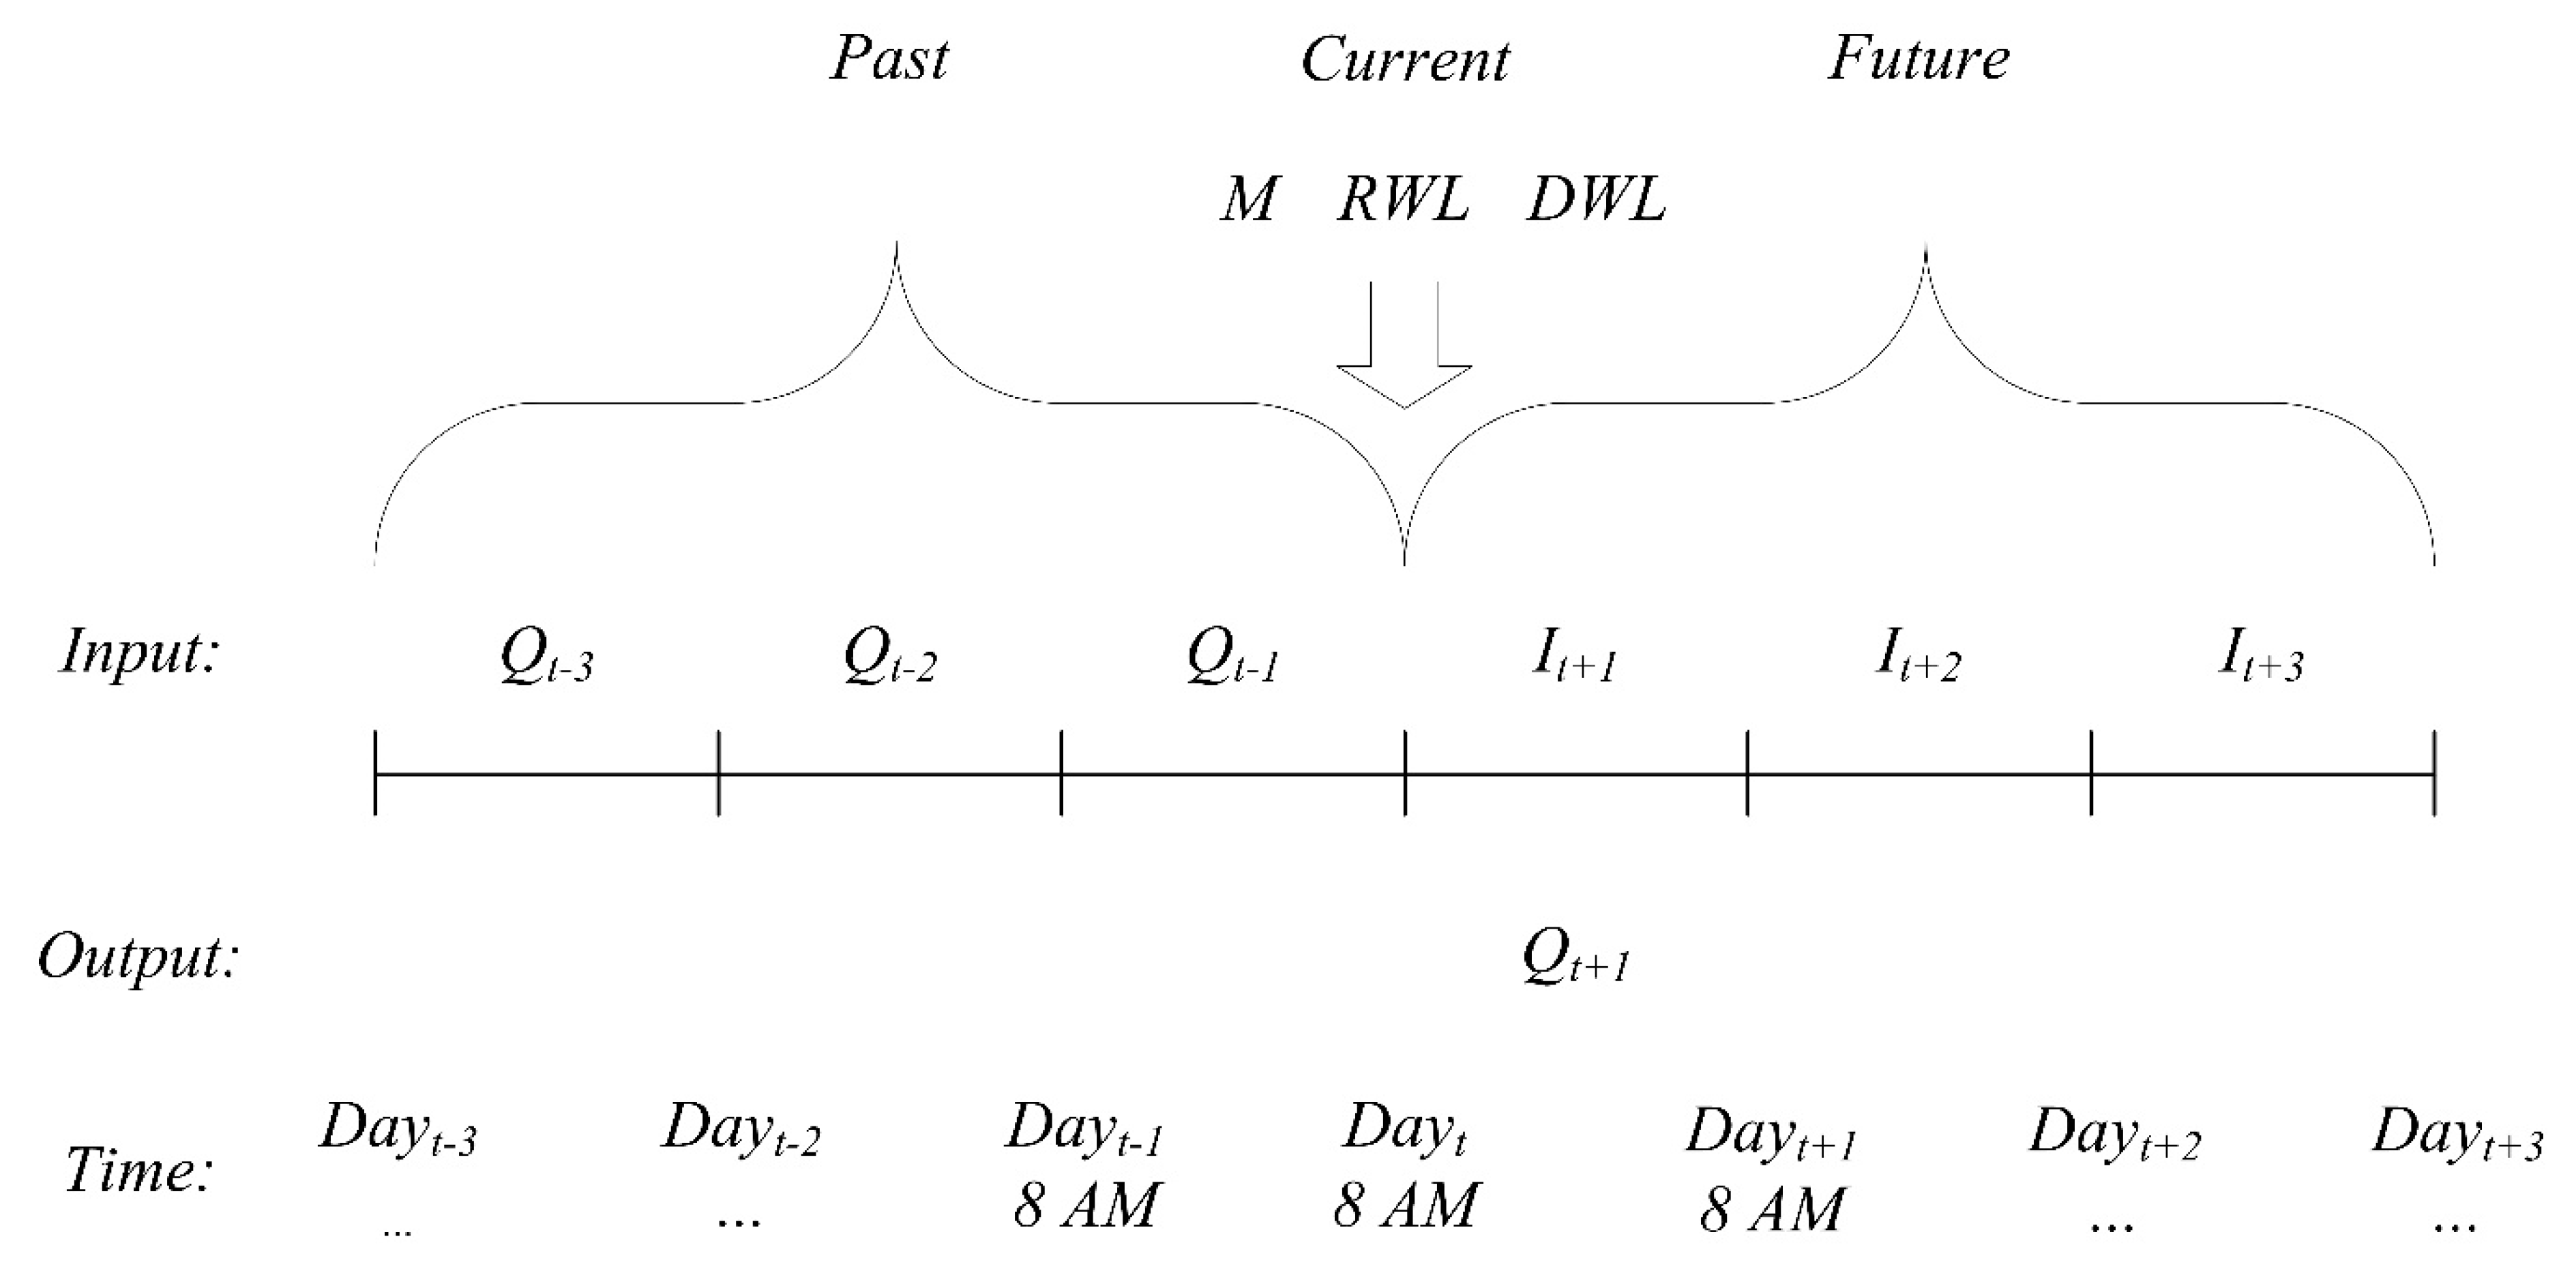
Figure 1. Schematic map illustrating the past, current and future hydrologic information.
Water 10 01372 g001
Figure 2. Demonstration of (a) decision tree structure and (b) RF algorithm.
Water 10 01372 g002
Figure 3. Variable importance scores in different scenarios.
Water 10 01372 g003aWater 10 01372 g003b
Figure 4. The rank of cross-validation scores for candidate parameter combinations.
Water 10 01372 g004
Figure 5. Comparison of observed and simulated reservoir outflows.
Water 10 01372 g005
Figure 6. The kernel distribution of forecasted 1-day inflow in different months.
Water 10 01372 g006
Figure 7. The top of seven decision trees in the outflow simulation model of scenario 4.
Water 10 01372 g007
Figure 8. Correlation matrix between all input variables and outflow.
Water 10 01372 g008
Figure 9. Scatter-plots of observed and forecasted inflows (a) flood season (b) non-flood season.
Water 10 01372 g009
Table 1. Detailed information of model input and output variables.
InformationInput/Output Variable NamesAbbr.UnitResolution
Pastpast 1-day outflowQt−1m3/sDaily
past 2-day outflowQt−2m3/sDaily
past 3-day outflowQt−3m3/sDaily
CurrentmonthM Monthly
reservoir water levelRWLmDaily
downstream water levelDWLmDaily
Futureforecasted 1-day inflowIt+1m3/sDaily
forecasted 2-day inflowIt+2m3/sDaily
forecasted 3-day inflowIt+3m3/sDaily
tomorrow average outflowQt+1m3/sDaily
Table 2. Designed nine scenarios for building outflow simulation models.
Combination of InformationAll YearFlood SeasonNon-Flood Season
Past + Current123
Current + Future456
Past + Current + Future789
Table 3. Statistical measurements between the observed and simulated outflows.
ScenariosAll YearFlood SeasonNon-Flood Season
RMSE (m3/s)NSEQpRMSE (m3/s)NSEQpRMSE (m3/s)NSEQp
112250.9591.918640.8991.97170.9502.2
2 and 311810.9622.517640.9092.57320.9486.5
425250.8297.732390.6967.720770.58725.9
5 and 625060.8325.031430.7145.021160.57228.8
711410.9650.917180.9150.96900.9545.4
8 and 911950.9612.417940.9062.47290.9494.9