Article

Flood Mitigation through Optimal Operation of a Multi-Reservoir System by Using Model Predictive Control: A Case Study in Myanmar

1
Department of Water Management, Delft University of Technology, Stevinweg 1, 2628 CN, Delft, The Netherlands
2
Hoofddocent Water Management, Hogeschool Rotterdam, G.J. de Jonghweg 4-6, 3015 GG, Rotterdam, The Netherlands
*
Author to whom correspondence should be addressed.
Water 2018, 10(10), 1371; https://doi.org/10.3390/w10101371
Submission received: 1 September 2018 / Revised: 26 September 2018 / Accepted: 29 September 2018 / Published: 1 October 2018
(This article belongs to the Section Water Resources Management, Policy and Governance)

Abstract

:
Managing a multi-reservoir system is complicated, due to conflicting interests among various objectives. This study proposes an optimization-based approach for the operations of a multi-reservoir system. An advanced real-time control technique, Model Predictive Control (MPC), is adopted to control a multi-reservoir system with two control objectives, i.e., flood mitigation and water conservation. The case study area is the Sittaung River basin in Myanmar, where the current reservoir operating rule needs to be improved for a more effective operation. A comparison between an MPC-based operation and the current operation is presented by using performance indicators. The result shows a reduction of the system’s vulnerability by 0.9 percent using MPC. Due to the physical constraint of the reservoirs, it is impossible to completely eliminate the flood risk at Taungoo City during high inflow events. However, the results indicate that the potential flood risk can be mitigated by improving the current operating rule.

Graphical Abstract

1. Introduction

Nowadays, the number of reservoirs in the world is growing. This is in order to meet water and energy demands [1]. Reservoirs are constructed for various purposes, such as irrigation, hydropower generation, water supply, flood control, recreation and navigation. Managing a multipurpose reservoir is complicated, due to conflicting interests among these various objectives [2]. Moreover, a river basin with more than one reservoir, in series or in parallel, requires a more advanced operational method to coordinate multiple reservoirs and multiple objectives [3]. An optimization-based approach is typically required for the optimal operation of a reservoir system, in order to obtain the optimal solutions to support the decision-making process [4]. The developments in real-time control of a reservoir system have been extensively explored in past literature, and generally focus on optimal operation [5,6,7] and flood control, based on pre-defined operation rules and offline approaches [8,9,10]. Recently, a proactive and online control strategy, the so-called Model Predictive Control (MPC) approach [11,12,13], has been widely applied in water resources management to control various water systems, such as irrigation systems [14,15,16] and drainage systems [17,18]. MPC is also used in the operational management of a reservoir system for flood mitigation [19,20,21,22,23].
MPC has been applied in the industrial process control since the 1970s [24]. It is a model-based control method which consists of an internal model and the optimization of control objectives. An internal model is used to predict the system states over a prediction horizon, and control actions are determined by solving the optimization problem subject to given constraints. MPC is a predictive control method using the receding horizon principle, in which a control problem is optimized over a prediction horizon. The first control action is implemented in every control loop, followed by an update of the system states with the new measurements. Consequently, this control problem is resolved for the next control step. As a result, future states are considered in every control step. MPC can result in a higher performance than traditional control approaches, such as feed-back control and feed-forward control [14].
Reservoirs can be used to temporarily store the flood volume during heavy rainfall for flood mitigation at the downstream areas. Releases from reservoirs need to be controlled for an efficient use of reservoir storages in order to minimize peak flows at the downstream river reaches. Breckpot et al. [19] presented a method to use the buffer capacity of a reservoir for flood mitigation. Reservoir releases were considered as control variables in the optimization processes. This was to avoid the non-linearity in the structure equation. We apply this approach in our study. In recent MPC applications, the water flows along the river reaches are usually simulated by applying either the De Saint-Venant equations [25,26] or integrator delay models [9,20]. However, the integrator delay model works for only one point, with a given delay time and a cross-section area of a river reach. It is therefore unsuitable to use for a flood control problem. In this study, the dynamics of a water system are described by using the De Saint-Venant equations.
Delgoda et al. [20] proposed a method to handle uncertain inflows in an MPC formulation for real-time flood control of two reservoirs. Ficchì et al. [21] also used the deterministic and ensemble weather forecasts in the application of MPC to improve the management of a four-reservoir system for flood control in the Seine River basin, France. In these studies, MPC is used to control a reservoir system to reduce the flood risk at the downstream river reach. As mentioned previously, a reservoir may be used for multiple purposes, which also need to be included in the control approach. Our study aims to apply MPC to a multi-reservoir system with two control objectives: flood mitigation and water conservation. A simulation-optimization framework is developed for the real-time operation of a reservoir system. Our case study is based on the Sittaung River Basin in Myanmar, where the current reservoir system needs to be equipped with a more effective operation. This study proposes a real-time optimization-based approach for reservoir operations with two management objectives. Tested on our study area, the Sittuang River basin, our proposed approach outperforms the current operating rule, in terms of vulnerability and resilience. The approach is a generic one, which can also be applied to other multi-reservoir systems.
The paper is organized as follows. Section 2 describes the details of the study area, materials, and methods. Simulation settings and operation scenarios are described in Section 3. In Section 4, the results based on different operation scenarios are presented. The limitations of the method are discussed in Section 5. Finally, in the conclusion section, suggestions for future research are presented.

2. Materials and Methods

2.1. Study Area

The Sittaung River is one of the four major rivers in Myanmar. This river flows from north to south through the south central plain of Myanmar and enters into the Andaman Sea. The study area covers the city of Taungoo and its upstream catchment, incorporating 31 sub-catchments and 11 reservoirs (Figure 1). The total catchment area is about 19,244 km2. Given that Taungoo and its surrounding areas frequently suffer flood-induced inundation, a master plan for multipurpose utilization of the integrated water management of the Sittaung River basin has been developed. This plan has been developed since 1964 by the Myanmar government, with technical assistance from experts of the United Nations [27]. Based on this plan, a series of reservoirs has been constructed along several tributaries of the Sittaung River for the sake of flood control, irrigation and hydropower generation. However, fluvial floods still occur every few years. For instance, an extreme fluvial flood occurred near the Taungoo City in 2013, resulting in more than 2000 km2 of flooded agricultural land. Therefore, making optimal use of existing water infrastructures to mitigate floods is still one of the main concerns of the local authority.
In this study, we consider 11 main reservoirs, each one corresponding to an individual sub-catchment. Their storage capacities and operational purposes, as well as the corresponding catchment areas, are given in Table 1.
According to their storage capacities, six reservoirs have a buffering storage larger than 100 Mm3 to reduce the peak of the flow. Note that each reservoir has two outlet structures, a spillway and a conduit. The spillway is a non-operational free-flowing structure, while the conduit is a controllable structure with a vertical gate. The types and characteristics of the spillways are described in Supplementary Materials. The current reservoir operation in the Sittaung River basin is mainly based on water conservation and hydropower generation. In the dry season, the reservoirs are locally operated to meet water demand. During the wet season, the releases are controlled, based on hydropower demand and the desired storage of a water supply for irrigation in the dry season. The reservoir operators make release decisions based on the current water levels and the desired water levels, without considering the downstream flood risk at Taungoo. Therefore, in addition to the conservation of water, an optimal control system is required to reduce potential flood risk in downstream areas.

2.2. Hydrological and Morphological Data
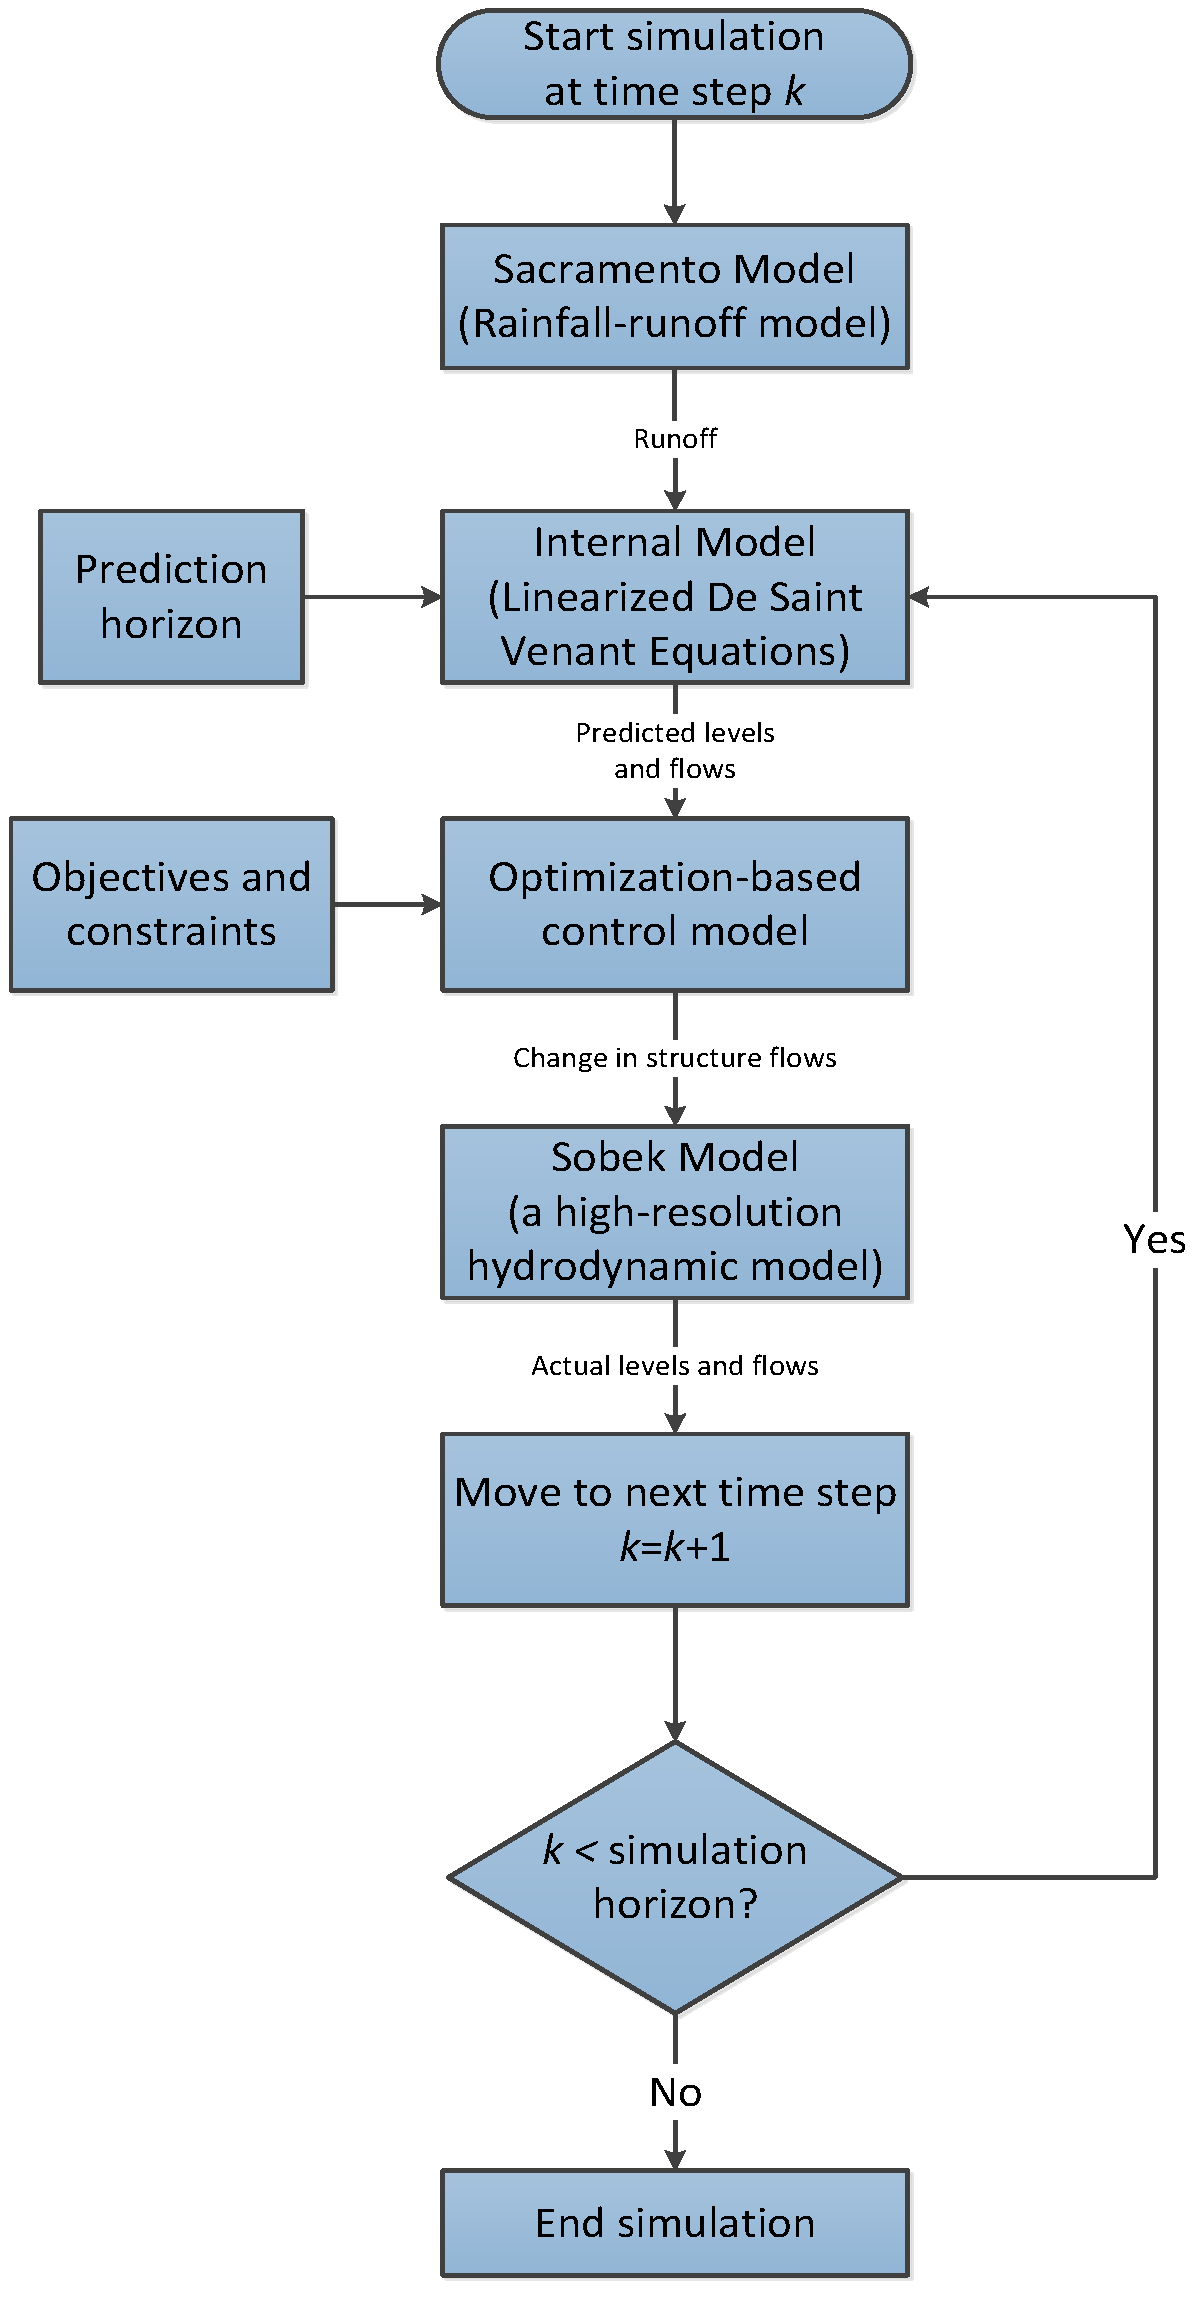
The hydrological data used in this study, such as rainfall, potential evaporation, water levels and discharges, were collected from the Department of Meteorology and Hydrology (DMH), Myanmar. The hydrological data are limited and only available on a daily resolution. The available rainfall data do not cover the temporal and spatial variation of rainfall across the study area, especially for higher elevation areas. Therefore, the three hourly TRMM (Tropical Rainfall Measurement Mission) rainfall data (3B42) [28] were used for rainfall-runoff modelling in this study. The TRMM rainfall data were retrieved from the National Aeronautics and Space Administration (https://mirador.gsfc.nasa.gov). Advantages of TRMM data over other data sets are a better coverage in space and time, and available for near real-time. The information on catchment areas and the river system of the Sittaung River basin was derived from the Shuttle Radar Topography Mission (SRTM) 3 arc-second Digital Elevation Model (DEM), which were obtained from the United States Geological Survey (https://lta.cr.usgs.gov/get_data). The key cross-sections (CSs) of the Sittaung River were surveyed for hydrodynamic modelling in 2015 (see Figure 1). The CSs of tributaries were generated by using the DEM, channel bed slopes and Google Earth images.

2.3. Methods

A simulation-optimization framework was developed by using MPC strategy for real-time control of a multi-reservoir system. This framework consists of three main parts: inflow prediction with rainfall-runoff model, real-time control with MPC and the SOBEK hydrodynamic model. The flow chart of the proposed method is shown in Figure 2.

2.3.1. Modelling Rainfall-Runoff Process

Rainfall-runoff models are required to estimate outflows of catchments for the optimal operation of a reservoir system. Some well-known rainfall-runoff models include the Hydrologiska Byråns Vattenbalansavdelning model (HBV) [29], the SACramento Soil Moisture Accounting model (SAC-SMA) [30], the Australian Water Balance Model (AWBM) [31] and the Nedbor Afstromnings Model (NAM) [32]. In this study, we chose the SAC-SMA model due to its satisfactory performance in modelling runoff. Another reason was due to its flexibility to be integrated with real-time controllers, which we introduce in the subsequent subsection. It is a conceptual hydrological model to estimate the runoff for small to medium-scale catchments. The advantages of using the conceptual model over the physically based model are its simplicity and its ability to save computational time. The key parameters of the SAC-SMA model are a unit hydrograph and soil parameters [33]. The application of the SAC-SMA model in SOBEK was based on a distributed approach. A catchment was divided into a number of sub-catchments, and estimated runoffs of sub-catchments were linked with the main river system. The areas of sub-catchments were ranging from 100 km2 to 300 km2. The SAC-SMA model parameters were manually calibrated with observed data. The Nash-Sutcliffe Efficiency (NSE) [34] was used to evaluate the model performance. Details of the modelling process are described in Supplementary Materials.

2.3.2. Simplified Internal Model

In this study, we adopted the MPC approach for real-time control of a multi-reservoir system. MPC incorporates an internal model, an objective function and the constraints. A simplified internal model with a large grid size and large time step were used in this study to achieve computational efficiency. Our simplified model is composed of 82 river reaches and 11 reservoirs (see Figure 3).
In this study, the changes of storage in reservoir i was modelled by using the following mass balance equation:
V i ( k + 1 ) = V i ( k ) + [ Q i , d ( k ) Q i , s ( k ) ( Q i , g ( k 1 ) + Δ Q i , g ( k ) ) ] Δ t  
Δ Q i , g ( k ) = Q i , g ( k ) Q i , g ( k 1 )  
where V i = storage volume of reservoir i (m3), Q i , d = inflow to reservoir i (m3/s), Q i , s = outflow from the spillway i (m3/s), Q i , g = outflow from the conduit i (m3/s), k = time step index, and Δ t = time interval between time step k and k + 1 . The losses from a reservoir (e.g., evaporation and seepage) and the precipitation over a reservoir surface area were neglected for simplification in Equation (1). In general, the flow from a spillway or a sluice gate can be a free flow or a submerged flow, according to the downstream water level conditions [35]. In the Sittaung River basin, spillways and conduits for all reservoirs were designed for free flow conditions. Following [14], the structure flow can be calculated by using the following linearized structure equations. Free over flow from spillway i with fixed crest is determined by [14]:
Q i , s ( k + 1 ) = Q i , s ( k ) + C i , g W i , g 2 3 g ( h i , u p ( k ) h i , c r ) Δ h i , u p ( k )  
As well, free flow from conduit i is calculated by [14]:
Q i , g ( k + 1 ) = Q i , g ( k ) + g C i , g W i , g μ i , g ( h i , g ( k ) h i , c r ) 2 g ( h i , u p ( k ) ( h i , c r + μ i , g ( h i , g ( k ) h i , c r ) ) ) Δ h i , u p ( k ) + ( C i , g W i , g μ i , g 2 g ( h i , u p ( k ) ( h i , c r + μ i , g ( h i , g ( k ) h i , c r ) ) ) g C i , g W i , g ( h i , g ( k ) h i , c r ) 2 g ( h i , u p ( k ) ( h i , c r + μ i , g ( h i , g ( k ) h i , c r ) ) ) ) Δ h i , g ( k )  
where Q = flow through structure (m3/s), C g = calibration coefficient, W g = width of the structure (m), μ g = contraction coefficient, h u p = upstream water level (m), h c r = crest level of structure (m), and h g = gate height (m). Then, the water level at a reservoir is given by [14]:
h i R ( k + 1 ) = h i R ( k ) + Δ t A i R ( k ) [ Q i , d ( k ) Q i , s ( k ) ( Q i , g ( k 1 ) + Δ Q i , g ( k ) ) ]  
where h i R = water level at reservoir i (m) and, A i R = surface area of reservoir i (m2). The desired water level at reservoir i is denoted as h i , r e f R , then the deviation between reservoir water level and set point, e i R ( k + 1 ) can be expressed by:
e i R ( k + 1 ) = h i R ( k + 1 ) h i , r e f R  
As mentioned above, the water levels and the water flows of the river reaches were simulated by using the one-dimensional De Saint-Venant equations [35], i.e., mass balance and momentum balance equations. Several methods are available to discretize these equations in time and space [25,36,37]. In this study, the staggered grids and implicit integration scheme given by Xu [38] was adapted to discretize the De Saint-Venant equations. This resulted the discretized solutions of water levels and flows of river reaches. Then, the deviation between water level and set point at a river reach can be determined by:
e P ( k + 1 ) = h P ( k + 1 ) h r e f P  
where e P = water level deviation at river reach P (m), h P = water level at river reach P (m), and h r e f P = flood limit water level at river reach P (m). A linear state space model was used in this study. The conduit outflow was chosen as a controlled variable in the optimization process to avoid the model complexity because of the non-linearity in the structure equation. As one of the operational objectives is to minimize the downstream flood risk, the water levels and structure outflows were taken as the states of the system. The general state space representation of the system was given by [14]:
Z ( k + 1 ) = A z ( k ) Z ( k ) + B u ( k ) U ( k ) + B d ( k ) D ( k )  
where the state Z ( k ) is composed of the water level h ( k ) , the conduit outflow Q g ( k ) and the water level deviation e ( k ) , i.e., Z ( k ) = [ h ( k ) , Q g ( k ) , e ( k ) ] T . U ( k ) is composed of the control variable, i.e., U ( k ) = [ Δ Q g ( k ) ] . The disturbance D ( k ) is composed of the inflow disturbance Q d ( k ) and the spillway outflow Q s ( k ) , i.e., D ( k ) = [ Q d ( k ) , Q s ( k ) ] T . A z ( k ) , B u ( k ) and B d ( k ) are the system input matrixes for state, control and disturbance respectively. The elements of these matrixes can be found in Xu [38].

2.3.3. Objective Function and Constraints

In this study, an objective function is defined to minimize the deviations of the water level from the set point and the changes of release from the conduit. The constraints are the storage capacities of reservoirs, the water demand for hydropower generation and the release capacities of the conduits and spillways. A general form of an objective function used in this study is given by:
min   J = Z T W Z + U T R U  
subject to
Z min Z ( k ) Z max  
U min U ( k ) U max  
where W and R are weighted matrices which can be defined as the relative importance of sub-objectives in the optimization process. In this study, the Maximum Allowed Value Estimate (MAVE) was used to define the relative penalties to the variables (see more details in [14]). If the objective function is quadratic, and the constraints are linear, then this type of an optimization problem can be solved by using quadratic programming. In this study, the interior-point method was used to solve the optimization problem. The details of objective function and constraints will be described in Section 3.

2.3.4. Modelling the Sittaung River System

Several software packages are available for the hydrodynamic modelling of a river system, such as SOBEK [23], TUFLOW [39], HEC-RAS [40] and MIKE 11 [41]. Among the available tools, SOBEK was selected for modelling the Sittaung River system. This was because of its ability to integrate the rainfall-runoff module, hydrodynamic module, and user-defined routines. SOBEK is a hydrodynamic software package for one dimensional (1D) and two dimensional (2D) flow simulation [42]. The Sittaung River system was modelled with the SOBEK software package, coupled with SAC-SMA rainfall runoff modules. The key parameter considered in this study was the roughness coefficient which was determined through the model calibration. In this study, SOBEK was considered as a real water system and the hydraulic parameters of a simplified internal model were calibrated by SOBEK. This model was also used to update the system states of the simplified internal model. The modelling process is described in Supplementary Materials.

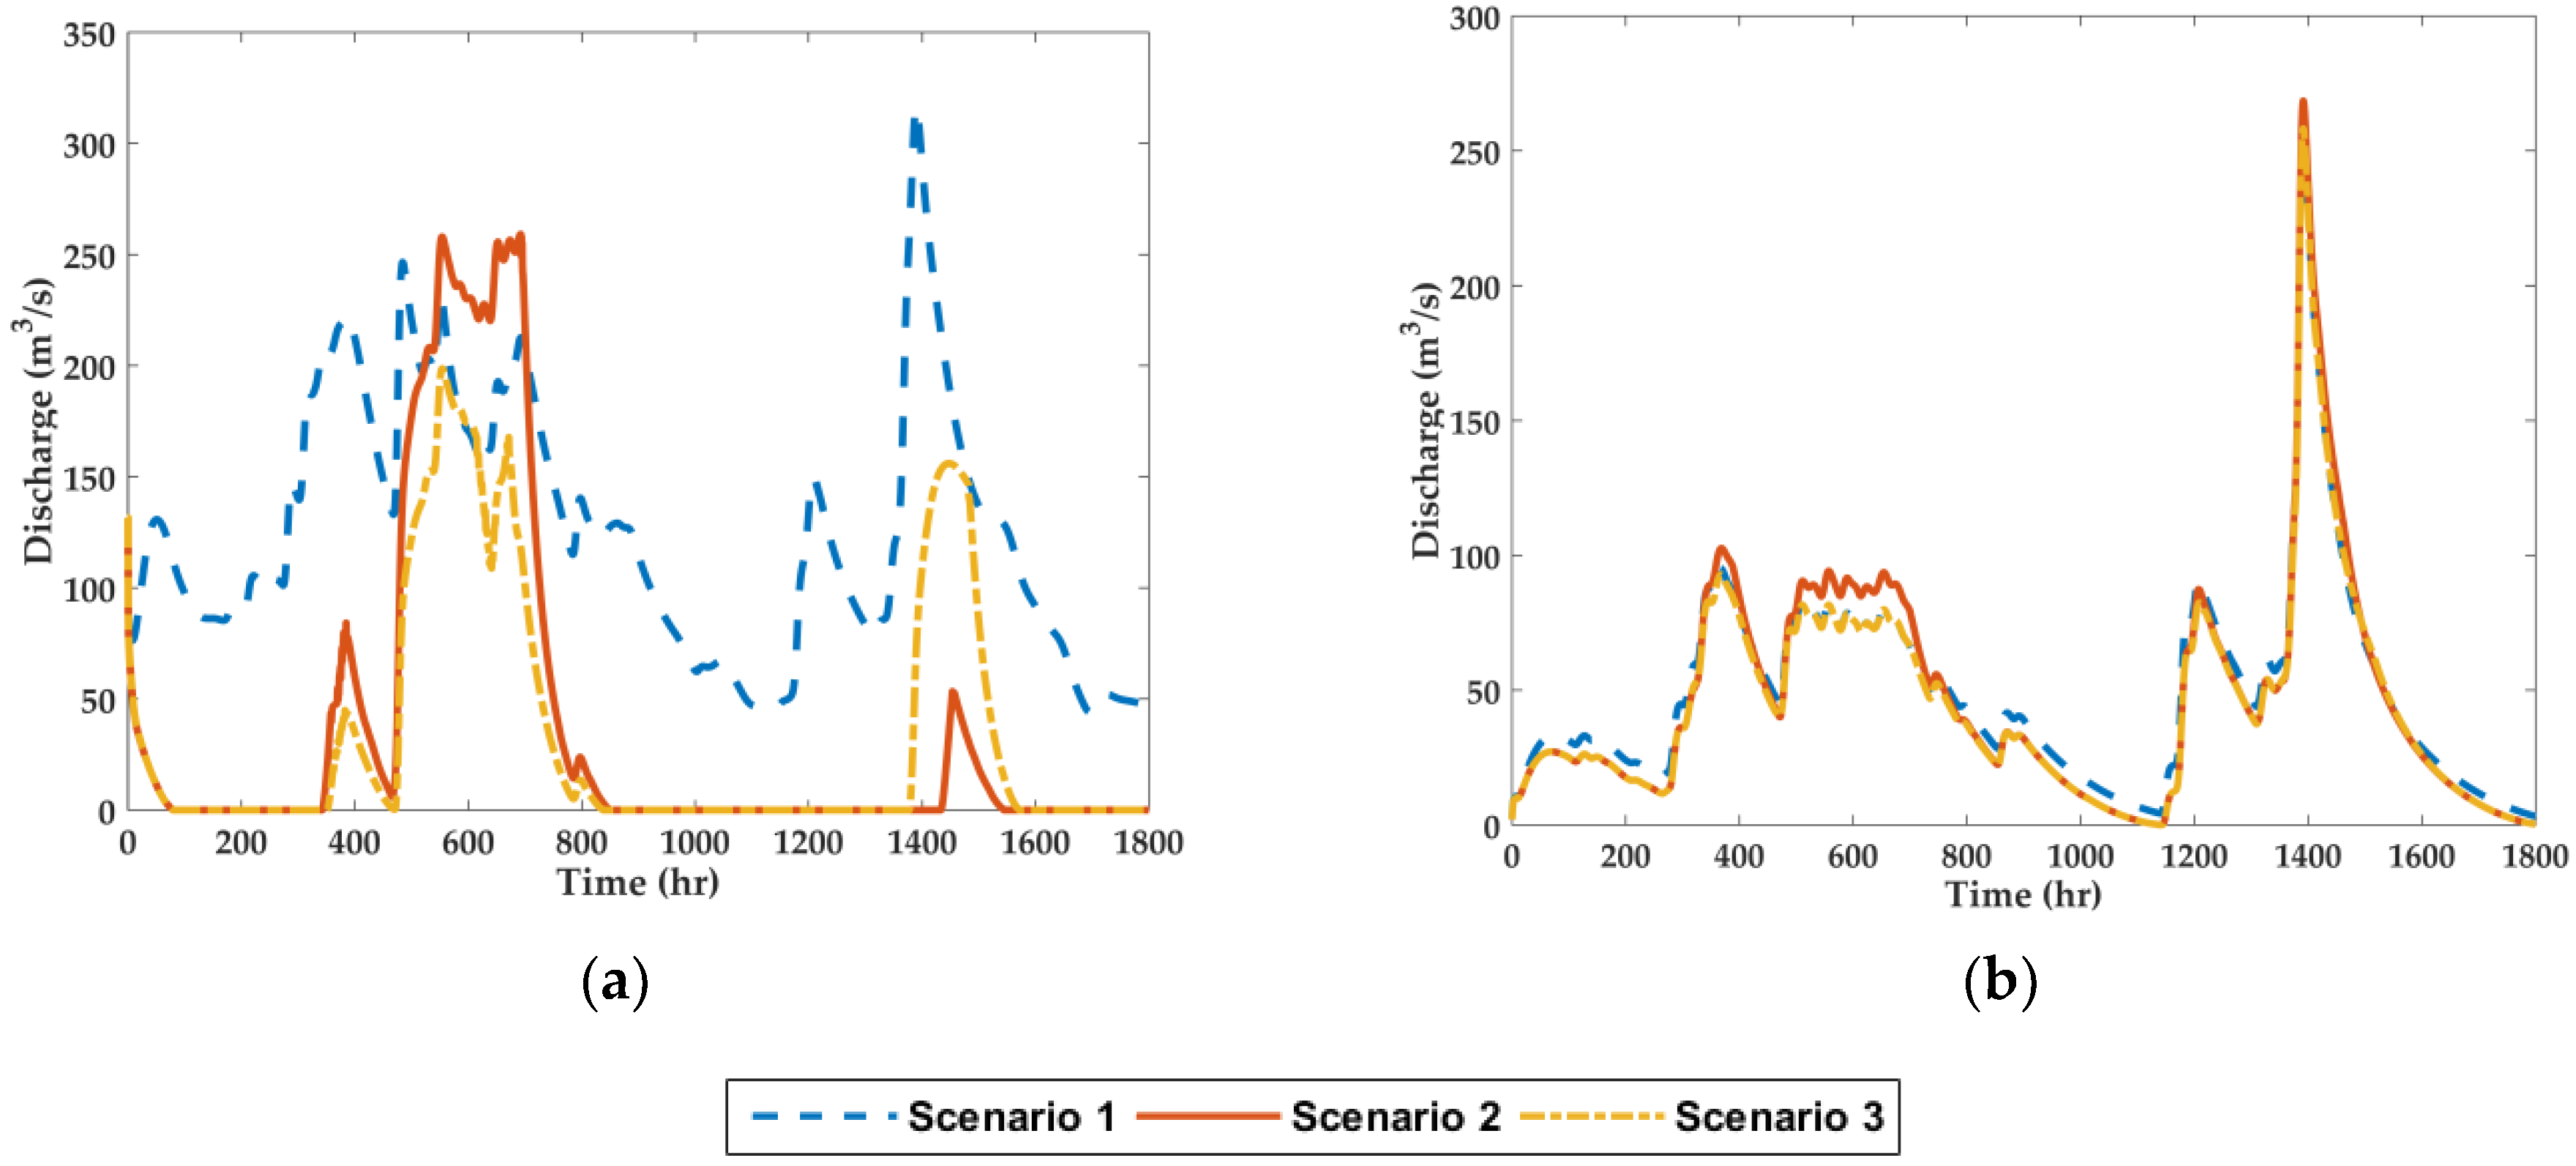
3. Simulation Settings and Operation Scenarios

During high flow periods, the presence of the available storage capacity can be used for the flood mitigation. The developed control system was tested with three operation scenarios using the most severe flood event in 2013. The return period of this flood is 50 years. The danger water level of the control point (i.e., Taungoo in Figure 1) defined by DMH is 43 m. In this study, the safety level was set to 42 m to use the buffer capacities of the reservoirs for flood mitigation. The model was simulated with discrete time steps of 30 min each. The control time step was 3 h with a prediction horizon of two days. Firstly, the initial water levels of the reservoirs were set up using the observed data. Several reservoirs (i.e., Lower Paunglaung, Swa and Pathi) were already full in the initial stage. The following operation scenarios were considered in this study.
Scenario 1 (Current operation): Regulation is based on the current operating rule in the study area. The SOBEK hydrodynamic model was simulated by using the observed outflow data of the reservoirs.
Scenario 2 (Flood control): Regulation is based on the use of the available storage of reservoirs during high inflow events. Releases from reservoirs are controlled with an MPC controller, based on the safety level at a downstream control point. The reservoirs release water to create the buffering storages for incoming flow when the water level at a control point is lower than the safety level. The conduit gates are closed by the controller when a flood is occurring at the downstream areas. Soft constraints are used to avoid the non-feasibility problem in optimization processes. The deviations of the virtual state outside of the allowed range is denoted as e P * . The virtual signal, μ * , is used as a soft constraint to make the virtual state either zero or a value near the allowed range [14].
e P * ( k ) = h P ( k ) μ * ( k )
For this operation scenario, Equation (9) can be written as follows:
min   J = j = 1 N P [ e P ( k + j | k ) T W P e P ( k + j | k ) ] + j = 1 N P [ e P * ( k + j | k ) T W P * e P * ( k + j | k ) ] + j = 1 N P [ μ * ( k + j | k ) T R μ μ * ( k + j | k ) ] + j = 1 N P 1 i = 1 L [ Δ Q i , g ( k + j | k ) T R Q i , g Δ Q i , g ( k + j | k ) ]
subject to
Q i , g ( k ) = { 0 i f   h i R ( k ) h i R , D 0 Q i , g ( k ) Q i , g max i f   h i R ( k ) h i R , D  
0 Q i , s ( k ) Q i , s max  
μ * ( k ) = { h P ( k ) i f   h P ( k ) h S L P h S L P i f   h P ( k ) > h S L P  
V i D V i ( k ) V i max  
where h i R , D = dead storage level at reservoir i (m), Q i , g max = maximum conduit outflow at conduit i (m3/s), Q i , s max = maximum spillway outflow at spillway i (m3/s), h P = water level at river reach P (m), h S L P = safety level at river reach P (m), V i D = dead storage capacity at reservoir i (m3), V i max = maximum storage capacity at reservoir i (m3), and N P = prediction horizon (hour).
Scenario 3 (Conservation and flood control): MPC is used to control the desired storage capacity of reservoirs for the dry season, and flood mitigation at the downstream river reaches. An objective function is set up to control the water levels of reservoirs under given constraints. The minimum releases from reservoirs are used as the hard constraints for hydropower demand and a soft constraint on safety level is used for flood mitigation at a downstream control point. For operation scenario 3, Equation (9) can be written as follows:
min   J = j = 1 N P i = 1 L [ e i R ( k + j | k ) T W i R e i R ( k + j | k ) ] + j = 1 N P [ e P * ( k + j | k ) T W P * e P * ( k + j | k ) ] + j = 1 N P [ μ * ( k + j | k ) T R μ μ * ( k + j | k ) ] + j = 1 N P 1 i = 1 L [ Δ Q i , g ( k + j | k ) T R Q i , g Δ Q i , g ( k + j | k ) ]
subject to
Q i , g ( k ) = { 0 i f   h i R ( k ) h i R , D Q i , g min Q i , g ( k ) Q i , g max i f   h i R ( k ) h i R , D  
0 Q i , s ( k ) Q i , s max  
μ * ( k ) = { h P ( k ) i f   h P ( k ) h S L P h S L P i f   h P ( k ) > h S L P  
V i D V i ( k ) V i max  
where L = number of reservoirs.

3.1. Performance Indicators

One of the control objectives is to refill the storage of reservoirs during the wet season to assure water demands are met for the dry season. Wei and Hsu [43] introduced criteria for a reservoir target storage meeting rate as follows:
S = i = 1 L [ S i e n d S i t a r g e t ]  
where S = reservoir storage capacity meeting rate (%), S e n d = reservoir storage capacity at end of simulation (m3), and S t a r g e t = targeted reservoir storage capacity (m3). Flood damages depend on the inundation depth, duration and land use of the flooded area. A higher water level endangers the local population. In this study, the system vulnerability was defined with the water depth above the danger water level.
F = { h max h d l h d l h max h d l 0   h max < h d l  
where F = vulnerability (%), h max = maximum water level occurring at a control point (m), h d l = danger water level at a control point (m). One of the important factors for flood risk management is the flood duration as a measure of the system resilience. McMahon et al. [44] defined system resilience based on the failure duration as follows:
R = N j = 1 N ( D j )  
where R = system resilience (%), D j = flood duration of event in which the water levels reach above danger level (hour), N = number of continuous flood events.

4. Results

The NSE value of the daily mean water levels at the Taungoo gauge station is 0.76 and the model is able to estimate the water levels and flows of the Sittaung River system. The model output was compared for the different operation scenarios. Figure 4 shows the outflows and water levels of the selected reservoirs for the different operation scenarios. The control flows from the Sinthe reservoir are shown in Figure 4a. For scenario 1, the releases were based on the current operation rule. In scenario 2, the controller released more water to create a storage space for flood regulation at Taungoo; the conduit gate was closed when the water level reached above the safety level. In scenario 3, the reservoir released the minimum demand for water conservation and stored the water for irrigation in the dry season. The water level changes of the Sinthe reservoir are shown in Figure 4b.
The Lower Paunglaung reservoir was used for multiple purposes. This reservoir was full and released water at the initial stage of the simulation. The reservoir released water for hydropower demand in scenario 1 (Figure 4c). The current reservoir operation was based on the local condition (i.e., water demand for hydropower and desired storage for the dry season) without considering the risk of a downstream flood. For scenario 2, the conduit gate was fully opened, creating a storage space for high inflow and the controller closed the gate to maintain the desired water level (safety level) at the control point. In scenario 3, the controlled water level was set to 189 m to store water for the dry season and the minimum outflow was used as a hard constraint for hydropower demand. A high penalty was used for violations of the soft constraint in the flood control objective and therefore the reservoir released the minimum outflow during floods.
The Ngalaik reservoir is mainly used for irrigation and recreation during the dry season. Therefore, the main operation objective is that the reservoir water level needs to reach its full tank level at the end of wet season. It was full at the end of the simulation when the operation was based on scenario 1 and 3 (Figure 4f). For scenario 1, there was no outflow from the reservoir to store the water for conservation purposes in the dry season (Figure 4e). For scenario 3, the reservoir release was controlled to keep the water level at its full tank level (i.e., 163 m). The final storage capacity was reduced to 45% when we considered the regulation based on flood priority in scenario 2.
The Swa reservoir showed a similar performance when compared to the other reservoirs (Figure 4g,h). At the initial stage, the reservoir water level exceeded its full tank level and the uncontrolled releases occurred through the reservoir spillway. For the flood regulation in scenario 2, the controller opened or closed the conduit gate based on the desired water level at the control point. Even though maximum releases were made during the operations, the reservoir water level could not be reached under a full tank level. Due to the limitation on the outlet capacity, the conduit gate was not able to release a large quantity of water in advance to get the desired water level in the reservoir. The significant releases from two spillways are shown in Figure 5. The spillway releases also contributed to the increase in water depth at Taungoo City by releasing 25% of peak discharge during this flood event.
In this study, a centralized control system was developed for flood control at a downstream river reach. The simulation results at Taungoo (i.e., flood control point) are shown in Figure 6. Under the operation scenario 1, the water level exceeded 1.09 m above its danger level at Taungoo. In scenario 2, the reservoirs’ releases were controlled by MPC to maintain a water level lower than the danger level at a control point. Even though, MPC worked well to control the reservoir releases, violations could not be avoided during high inflow due to the outflows from the uncontrolled catchments and the limitations of the reservoir storages and conduit gate capacities. However, under this operation the peak water level was reduced to 40 cm. The operation based on flood priority is not always optimal when reservoirs are used for multiple purposes. Therefore, we considered the optimal operation in scenario 3. Consequently, an objective function was set up with a desired storage capacity and a minimum release for each reservoir and a soft constraint on water level violation was used for the flood control at a downstream river reach. The peak water level at the control point was reduced to 30 cm under operation of scenario 3. It was obvious that the flooding was not only caused by the releases from the reservoirs, but also by the outflows from the uncontrolled catchments.
The overall performance of the three operation scenarios is shown in Table 2, in terms of storage volume, system vulnerability and resilience, described in Section 3.1. The highest system vulnerability (2.4%) existed under operation scenario 1, which was based on the current operation setting. In operation scenario 2, MPC was used to optimize reservoir releases to control the water level at Taungoo for flood prevention and the system vulnerability was reduced to 1.5%. The MPC controller used the buffer capacities of reservoirs to maintain the water level around the safety level. However, the potential of the flooding was unavoidable due to high inflow from the uncontrolled catchments (i.e., 45% of total catchment). Additionally, the releases from uncontrolled spillways also increased the water level at the control point. In operation scenario 3, we considered the desired storage capacities, water demand and flood prevention in the optimization problem. A risk of water shortage in scenario 2 operation was recovered (from 67% to 87%) under operation scenario 3. However, flood risk was increased under this operation compared to scenario 2. The simulation result indicates that system vulnerability could be reduced from 2.4% to 1.5% by creating the storage spaces under the MPC operation. Among 11 reservoirs in the system, Upper Paunglaung, Lower Paunglaung, Swa and Kabaung are important reservoirs for the flood control operation as these reservoirs have significant storage and outlet capacities.

5. Discussion

This study focused on the implementation of MPC in a large-scale water system and on flood risk mitigation in the Sittaung River basin, Myanmar. The optimization formulation in MPC was based on a deterministic disturbance to examine the flood mitigation capacities of the existing reservoirs for a severe flood event. The satellite rainfall data were used to estimate the outflows from the sub-catchments. Regarding the rainfall-runoff model, the buffer capacities of existing reservoirs are overestimated if inflow into the system is underestimated. On the other hand, the buffer capacities of existing reservoirs are underestimated if inflow into the system is overestimated. For this reason, it is required to communicate uncertainty associated with inflow prediction. This issue could be overcome by using MPC with the ensemble forecast [45,46]. In addition, we assumed that SOBEK represented an actual water system and the water levels of a simplified model were updated with the water levels from SOBEK. Therefore, the effect of measurement noises should also be considered in a real-world operation.
In the MPC formulation, it is important to use a proper prediction horizon (Np). The computational time increases when using a longer prediction horizon. Although Np increases, it does not guarantee a better model performance, because it is also dependent on capacities of the system [47]. On the other hand, especially for a water system with delays, Np should not be smaller than the delay time. Otherwise, several control inputs might not affect any of the system outputs. At present, only a three-day weather forecast with a chance of rain is available for the cities in the study area at the DMH website (https://www.moezala.gov.mm). In addition, the travel time of outflow from the furthest reservoir (i.e., Sinthe reservoir) is around 41 h for the mean flow. Based on these facts, the length of the prediction horizon was chosen as two days which could capture the dynamics of the Sittaung River system. If the reservoirs have full storage capacities before a flood occurs, most of the reservoirs require more than 90 days to completely empty their water storages. In fact, the constraints on the conduit capacities play an important role in reducing the flood risk in the Sittaung River basin.
In this study, we applied a weighted approach and a constrained approach to operate a multi-reservoir system. In operation scenario 2, we considered two control objectives, minimization of water level deviations from set point and changes in reservoir releases. The weights were defined by using MAVE and the optimized solution depended on given weights. In operation scenario 3, we optimized the storage capacities of the reservoirs and the constraints were used to satisfy two other control objectives, i.e., flood control and hydropower generation. Improving the decision-making process, a pareto optimal approach is preferred for trade-off between two or more conflicting objectives (i.e., desired storage capacity, hydropower generation and flood prevention). Recently, the Multi-Objective Evolutionary Algorithm (MOEA) is widely applied for the multi-objective optimization of water systems [48,49,50]. However, it is still required to explore the application of MOEA in an MPC scheme because of its computational efficiency. Therefore, it would be interesting to adapt this method to analyze the trade-off between conflicting objectives in a real-time reservoir operation under MPC strategy.
As mentioned above, one of the limitations of this study is that the rainfall-runoff model is case specific. To apply the proposed approach to other study areas, the real-time control approach needs to be coupled with new rainfall-runoff models. However, the control approach is generic. Besides, the methodology is not suitable for problems with predictions longer than one week. In fact, the computational complexity increased in a cubic order of the problem size and the accuracy of predictions also decreases as the prediction time becomes longer. But this issue is acceptable at this time of the research, as most real-time control problems currently adopt two days as the length of the prediction.

6. Conclusions

This paper demonstrates the performance of MPC on the flood control of a complex river system which is composed of multipurpose reservoirs and uncontrolled sub-catchments. A centralized control system was developed and tested with three operation scenarios. A comparison between MPC operation and the current operation was presented, resulting in a reduction of the system vulnerability by 0.9% under the operation scenario 2 compared to the operation scenario 1. However, the total storage volume was reduced from 87% to 67% and water shortage would occur in the dry season. Thus, a third scenario was developed in which water levels of the reservoirs (i.e., desired storage volume) were set up as the main control objective to maintain the desired storage volume. This considered minimum demands as hard constraints and safety water level at a flood control point as a soft constraint. For scenario 3, the results indicate an improvement in the operation of multiple objectives compared to the other two scenarios. In this study, the minimum releases were used as the hard constraints for hydropower production. Therefore, it is suggested that the maximization of energy production needs to be addressed in future studies to make a trade-off between multiple objectives. In facts, it is impossible to completely eliminate the flood risk at Taungoo City due to limitations on the capacities of the structures. However, the results indicate that the potential flood risk can be reduced by improving the current reservoir operating rule.

Supplementary Materials

The following are available online at https://www.mdpi.com/2073-4441/10/10/1371/s1, Rainfall Runoff Modelling and 1D Hydrodynamic Modelling of the Sittaung River System.

Author Contributions

Conceptualization and methodology, N.M.L. and M.R.; software, X.T. and N.M.L.; formal analysis, investigation and original draft preparation, N.M.L.; review and editing, M.R. and X.T.; supervision, M.R. and X.T.

Funding

This research was funded by Shell International Exploration and Production B.V and the contract number is UI43981.

Acknowledgments

The authors gratefully acknowledge the Irrigation and Water Utilization Management Department, Myanmar for providing data. The authors also would like to thank three anonymous reviewers and editors for providing constructive comments and suggestions and Ms. Mariette van Tilburg for language editing.

Conflicts of Interest

The authors declare no conflict of interest.

References

  1. Leithwood, K.A. The Role of Dams in Development. Int. J. Water Resour. Dev. 2002, 18, 9–24. [Google Scholar] [CrossRef]
  2. Castelletti, A.; Pianosi, F.; Soncini-Sessa, R. Water reservoir control under economic, social and environmental constraints. Automatica 2008, 44, 1595–1607. [Google Scholar] [CrossRef]
  3. Seibert, S.P.; Skublics, D.; Ehret, U. The potential of coordinated reservoir operation for flood mitigation in large basins—A case study on the Bavarian Danube using coupled hydrological–hydrodynamic models. J. Hydrol. 2014, 517, 1128–1144. [Google Scholar] [CrossRef]
  4. Lin, N.M.; Rutten, M. Optimal Operation of a Network of Multi-purpose Reservoir: A Review. Procedia Eng. 2016, 154, 1376–1384. [Google Scholar] [CrossRef]
  5. Che, D.; Mays, L.W. Application of an Optimization/Simulation Model for Real-Time Flood-Control Operation of River-Reservoirs Systems. Water Resour. Manag. 2017, 31, 2285–2297. [Google Scholar] [CrossRef]
  6. Galelli, S.; Goedbloed, A.; Schwanenberg, D.; van Overloop, P.-J. Optimal Real-Time Operation of Multipurpose Urban Reservoirs: Case Study in Singapore. J. Water Resour. Plan. Manag. 2014, 140, 511–523. [Google Scholar] [CrossRef]
  7. Labadie, J.W. Optimal Operation of Multireservoir Systems: State-of-the-Art Review. J. Water Resour. Plan. Manag. 2004, 130, 93–111. [Google Scholar] [CrossRef]
  8. Mohammadi, B.; Mariño, M.A. Multipurpose reservoir operation. 2. Daily operation of a multiple reservoir system. J. Hydrol. 1984, 69, 15–28. [Google Scholar] [CrossRef]
  9. Niewiadomska-Szynkiewicz, E.; Malinowski, K.; Karbowski, A. Predictive methods for real-time control of flood operation of a multireservoir system: Methodology and comparative study. Water Resour. Res. 1996, 32, 2885–2895. [Google Scholar] [CrossRef]
  10. Wei, C.C.; Hsu, N.S. Multireservoir real-time operations for flood control using balanced water level index method. J. Environ. Manag. 2008, 88, 1624–1639. [Google Scholar] [CrossRef] [PubMed]
  11. Camacho, E.F.; Bordons, C. Model Predictive control. In Advanced Textbooks in Control and Signal Processing; Springer: London, UK, 2007; ISBN 978-1-85233-694-3. [Google Scholar]
  12. Tian, X. Model Predictive Control for Operational Water Management: A Case Study of the Dutch Water System. Ph.D. Thesis, Delft University of Technology, Delft, The Netherlands, 2015. [Google Scholar]
  13. Maciejowski, J.M. Predictive Control with Constraints; Pearson Education: London, UK, 2000; ISBN 0 201398230PPR. [Google Scholar]
  14. Van Overloop, P.-J. Model Predictive Control on Open Water Systems. Ph.D. Thesis, Delft University of Technology, Delft, The Netherlands, 2006. [Google Scholar]
  15. Negenborn, R.; van Overloop, P.-J.; Keviczky, T.; Schutter, B. Distributed model predictive control of irrigation canals. Netw. Heterog. Media 2009, 4, 359–380. [Google Scholar] [CrossRef] [Green Version]
  16. Zafra-Cabeza, A.; Maestre, J.M.; Ridao, M.A.; Camacho, E.F.; Sánchez, L. A hierarchical distributed model predictive control approach to irrigation canals: A risk mitigation perspective. J. Process Control 2011, 21, 787–799. [Google Scholar] [CrossRef]
  17. Van Overloop, P.-J. Drainage control in water management of polders in the Netherlands. Irrig. Drain. Syst. 2006, 20, 99–109. [Google Scholar] [CrossRef]
  18. Van Overloop, P.-J.; Weijs, S.; Dijkstra, S. Multiple Model Predictive Control on a drainage canal system. Control Eng. Pract. 2008, 16, 531–540. [Google Scholar] [CrossRef] [Green Version]
  19. Breckpot, M.; Agudelo, O.; Moor, B. De Flood Control with Model Predictive Control for River Systems with Water Reservoirs. J. Irrig. Drain. Eng. 2013, 139, 532–541. [Google Scholar] [CrossRef]
  20. Delgoda, D.K.; Saleem, S.K.; Halgamuge, M.N.; Malano, H. Multiple Model Predictive Flood Control in Regulated River Systems with Uncertain Inflows. Water Resour. Manag. 2013, 27, 765–790. [Google Scholar] [CrossRef]
  21. Ficchì, A.; Raso, L.; Dorchies, D.; Pianosi, F.; Malaterre, P.; van Overloop, P.-J. Optimal Operation of the Multireservoir System in the Seine River Basin Using Deterministic and Ensemble Forecasts. J. Water Resour. Plan. Manag. 2016, 7, 1–12. [Google Scholar] [CrossRef]
  22. Schwanenberg, D.; Fan, F.M.; Naumann, S.; Kuwajima, J.I.; Montero, R.A.; Assis dos Reis, A. Short-Term Reservoir Optimization for Flood Mitigation under Meteorological and Hydrological Forecast Uncertainty: Application to the Três Marias Reservoir in Brazil. Water Resour. Manag. 2015, 29, 1635–1651. [Google Scholar] [CrossRef]
  23. Tian, X.; van Overloop, P.-J.; Negenborn, R.R.; van de Giesen, N.C. Operational flood control of a low-lying delta system using large time step Model Predictive Control. Adv. Water Resour. 2015, 75, 1–13. [Google Scholar] [CrossRef]
  24. García, C.E.; Prett, D.M.; Morari, M. Model predictive control: Theory and practice-A survey. Automatica 1989, 25, 335–348. [Google Scholar] [CrossRef]
  25. Montero, R.A.; Schwanenberg, D.; Hatz, M.; Brinkmann, M. Simplified hydraulic modelling in model predictive control of flood mitigation measures along rivers. J. Appl. Water Eng. Res. 2013, 1, 17–27. [Google Scholar] [CrossRef] [Green Version]
  26. Xu, M.; Negenborn, R.R.; van Overloop, P.-J.; van de Giesen, N.C. De Saint-Venant equations-based model assessment in model predictive control of open channel flow. Adv. Water Resour. 2012, 49, 37–45. [Google Scholar] [CrossRef]
  27. United Nations. Report on Sittaung Valley Water Resources Development (Technical Report); United Nations: Rangoon, Burma, 1964; (retrieved from the Irrigation Department, Myanmar on 20 May 2015). [Google Scholar]
  28. Tropical Rainfall Measuring Mission (TRMM) (2011). TRMM (TMPA) Rainfall Estimate L3 3 hour 0.25 degree x 0.25 degree V7, Greenbelt, MD, Goddard Earth Sciences Data and Information Services Center (GES DISC). Available online: 10.5067/TRMM/TMPA/3H/7 (accessed on 31 October 2016).
  29. Lindström, G.; Johansson, B.; Persson, M.; Gardelin, M.; Bergström, S. Development and test of the distributed HBV-96 hydrological model. J. Hydrol. 1997, 201, 272–288. [Google Scholar] [CrossRef]
  30. Boyle, D.P.; Gupta, H.V.; Sorooshian, S.; Koren, V.; Zhang, Z.; Smith, M. Toward improved streamflow forecasts: Value of semidistributed modeling. Water Resour. Res. 2001, 37, 2749–2759. [Google Scholar] [CrossRef]
  31. Boughton, W. The Australian water balance model. Environ. Model. Softw. 2004, 19, 943–956. [Google Scholar] [CrossRef]
  32. Nielsen, S.A.; Hansen, E. Numerical simulation of the rainfall-runoff process on a daily basis. Nord. Hydrol. 1973. [Google Scholar] [CrossRef]
  33. Vrugt, J.A.; Gupta, H.V.; Dekker, S.C.; Sorooshian, S.; Wagener, T.; Bouten, W. Application of stochastic parameter optimization to the Sacramento Soil Moisture Accounting model. J. Hydrol. 2006, 325, 288–307. [Google Scholar] [CrossRef]
  34. Nash, J.E.; Sutcliffe, J.V. River Flow Forecasting Through Conceptual Models Part I-A Discussion of Principles*. J. Hydrol. 1970, 10, 282–290. [Google Scholar] [CrossRef]
  35. Chow, V. Te Open-Channel Hydraulics; McGraw-Hill Book Company, Inc.: New York, NY, USA, 1959; ISBN 0070107769. [Google Scholar]
  36. Stelling, G.S.; Duinmeijer, S.P.A. A staggered conservative scheme for every Froude number in rapidly varied shallow water flows. Int. J. Numer. Method Fluids 2003, 1354, 1329–1354. [Google Scholar] [CrossRef]
  37. Moukalled, F.; Mangani, L.; Darwish, M. The Finite Volume Method in Computational Fluid Dynamics; Fluid Mechanics and Its Applications; Springer International Publishing: Cham, Switzerland, 2016; Volume 113, ISBN 978-3-319-16873-9. [Google Scholar]
  38. Xu, M. Real-Time Control of Combined Water Quantity & Quality in Open Channels. Ph.D. Thesis, Delft University of Technology, Delft, The Netherlands, 2013. [Google Scholar]
  39. Banks, J.C.; Camp, J.V.; Abkowitz, M.D. Adaptation planning for floods: A review of available tools. Nat. Hazards 2014, 70, 1327–1337. [Google Scholar] [CrossRef]
  40. Horritt, M.S.; Bates, P.D. Evaluation of 1D and 2D numerical models for predicting river flood inundation. J. Hydrol. 2002, 268, 87–99. [Google Scholar] [CrossRef]
  41. Ngo, L.L.; Madsen, H.; Rosbjerg, D. Simulation and optimisation modelling approach for operation of the Hoa Binh reservoir, Vietnam. J. Hydrol. 2007, 336, 269–281. [Google Scholar] [CrossRef]
  42. SOBEK 2.15 User Manual; Deltares: Delft, The Netherland, 2016.
  43. Wei, C.C.; Hsu, N.S. Optimal tree-based release rules for real-time flood control operations on a multipurpose multireservoir system. J. Hydrol. 2009, 365, 213–224. [Google Scholar] [CrossRef]
  44. McMahon, T.A.; Adeloye, A.J.; Zhou, S.-L. Understanding performance measures of reservoirs. J. Hydrol. 2006, 324, 359–382. [Google Scholar] [CrossRef]
  45. Raso, L. Optimal Control of Water Systems under Forecast Uncertainty. Ph.D. Thesis, Delft University of Technology, Delft, The Netherlands, 2013. [Google Scholar]
  46. Uysal, G.; Alvarado-Montero, R.; Schwanenberg, D.; Şensoy, A. Real-Time Flood Control by Tree-Based Model Predictive Control Including Forecast Uncertainty: A Case Study Reservoir in Turkey. Water 2018, 10, 340. [Google Scholar] [CrossRef]
  47. Tian, X.; Negenborn, R.R.; van Overloop, P.-J.; María Maestre, J.; Sadowska, A.; van de Giesen, N. Efficient multi-scenario Model Predictive Control for water resources management with ensemble streamflow forecasts. Adv. Water Resour. 2017, 109, 58–68. [Google Scholar] [CrossRef]
  48. Chiang, P.-K.; Willems, P. Combine Evolutionary Optimization with Model Predictive Control in Real-time Flood Control of a River System. Water Resour. Manag. 2015, 29, 2527–2542. [Google Scholar] [CrossRef]
  49. Chang, L.C.; Chang, F.J. Multi-objective evolutionary algorithm for operating parallel reservoir system. J. Hydrol. 2009, 377, 12–20. [Google Scholar] [CrossRef]
  50. Reddy, M.J.; Kumar, D.N. Optimal reservoir operation using multi-objective evolutionary algorithm. Water Resour. Manag. 2006, 20, 861–878. [Google Scholar] [CrossRef]
Figure 1. Study area—the Sittaung River basin with 11 reservoirs (salient features of reservoirs are given in Table 1. CS points are the locations where cross-sections were surveyed for this study).
Water 10 01371 g001
Figure 2. Simulation-optimization framework.
Water 10 01371 g002
Figure 3. A schematic diagram of the simplified internal model.
Water 10 01371 g003
Figure 4. Control flows and water levels with respect to three operation scenarios based on four selected reservoirs: (a,b) Sinthe reservoir; (c,d) Lower Paunglaung reservoir; (e,f) Ngalaik reservoir; and (g,h) Swa reservoir.
Water 10 01371 g004aWater 10 01371 g004b
Figure 5. Significant releases from the uncontrolled spillways: (a) Lower Paunglaung reservoir and (b) Swa reservoir.
Water 10 01371 g005
Figure 6. Simulation results at Taungoo with respect to three operation scenarios: (a) Discharge and (b) water levels.
Water 10 01371 g006
Table 1. Reservoirs considered in this study. (purposes of reservoirs: I = Irrigation, F = Flood control, H = Hydropower).
No.ReservoirCatchmentStorage Max. Capacity (m3/s)Purposes
Area (km2)(106 m3)ConduitSpillwayIFH
1Sinthe78917615523
2Yezin91901023
3Upper Paung Laung316813001004000
4Lower Paung Laung15516782003123
5Ngalaik3289210400
6Chaungmange265113774
7Madam9645894
8Myohla28124.2551
9Swa1053267251487
10Pathi60383.5156
11Kabaung1199108440694
Sum86283895--1084
(Source: Irrigation and Water Utilization Management Department, Myanmar).
Table 2. Overall performance of the three operation scenarios.
IndicatorsOperation Scenarios
123
(Current Operation)(MPC-Flood Priority)(MPC-Conservation Priority)
Storage volume (%)876786
Vulnerability (%)2.41.51.8
Resilience (%)1.92.82.4

