1. Introduction
In rural areas of Poland, in the decade 2007–2016, 39,000 km of sanitary sewers were built, and the percentage of the rural population using sewerage systems increased from 12% to 41% [
1]. Although the progress has been enormous, the choice of sewerage systems was not always rational. The designers’ experience, gained from urban sewerage systems, resulted in their being copied in rural areas. Mostly, classic gravity sewerage systems with numerous pumping stations were built, while alternative sewerage systems, including pressure and vacuum systems, were constructed only as exceptions. Rural areas are characterized by low population density in villages. Furthermore, the distances between the villages and towns are often 5–6 or more kilometers. In the case of sewerage systems with a central wastewater treatment plant for the whole commune, the length of force mains may exceed the length of the gravity sewerage system. This standard of sewerage system based on gravity sewers, numerous pumping stations, and long pressurized force mains to a central wastewater treatment plant has become almost obligatory in Poland since 2007. As a consequence, the unit capital costs of numerous sewerage systems related to one resident have been excessively high. Within the European Funding in the years 2007–2013 (structural funds), the mean unit capital costs of sanitary systems build in Poland were about 1000 EUR cap
−1, but in some cases they reached even 4000 EUR cap
−1 [
2]. To avoid excessively high capital costs, a minimum population density factor equal to 120 inhab. km
−1 of sewer length is required in Poland. This was a prerequisite for granting subsidies for the sanitary sewerage systems. At the average unit capital cost 120 EUR m
−1 it gives 1000 EUR cap
−1, which corresponds to about three times the average monthly income in Poland [
3].
In the light of the experience from the years 2007–2013 it is important to revise the selection criteria for sewerage systems. There is a need caused by limited funds to apply solutions better suited to rural areas. Without financial support from the EU, it will not be possible to sustain the same pace of development of sewerage systems in rural areas. Similar problems exist in many developing countries all over the world [
4]. There is a need for cheap sewerage systems, with low capital and operational costs. In fact, simplified sewerage systems may be cheaper compared to conventional sewerage systems by up to 50% while providing similar effects [
5,
6,
7,
8]. Unfortunately, the majority of designers have no tools and experience in the hydraulic calculation of such systems. For this reason, the presentation of an exemplary system of this type and a tool to simulate its operation may increase its popularity among investors and designers.
The operation of new and existing sewerage systems is also hindered by reduced wastewater flows caused by a decrease in water consumption mainly due to the increase in water prices and the improvement of public environmental awareness, as well as the increasing efficiency of household appliances (e.g., washing machines, dishwashers, toilets). In Poland and other EU countries, a steady decline in household water consumption has been observed [
1,
9]. In some villages, the daily consumption of drinking water is as low as 30 dm
3 per capita [
10,
11,
12,
13,
14]. Classical gravity sewerage systems are very sensitive to sediments in wastewater. The sediments, settled in the channels, require flushing—even several times a year. This is an important problem in gravity sewers with small slopes and without self-cleaning velocities [
15]. In addition, many pumping stations cannot cope with coarse solids [
16]. Among other reasons, in non-urban areas it may be rational to use alternative systems that are insensitive to reduced wastewater flows. Such alternatives are pressure, vacuum and small diameter gravity sewerage systems [
17]. If the population density is very low and the capital costs of such systems are very high, then the on-site method of wastewater treatment can be applied (e.g., a small wastewater treatment plant) [
18].
Important components of the small diameter gravity sewerage (SDGS) system are septic tanks (STs) to which wastewater flows from households. In STs, preliminary treatment takes place to reduce the concentration of suspended solids and organic matter [
19,
20,
21]. Additionally, STs remove problematic solids from wastewater such as fibers, hairs, flushable wipes, rags, cotton sticks, bags, etc. In terms of hydraulic properties, they have properties similar to water [
22]. From the ST, the wastewater flows into the wastewater treatment plant through a network of small diameter (from 25 to 100 mm), made of plastic (polyethylene—PE or polyvinyl chloride—PVC). Small diameter gravity sewerage pipes can be laid in parallel to the terrain with a possible negative slope (only the difference in levels between the inlet and outlet from the mains must be greater than the pressure loss) [
23]. The ST effluent is typically carried out by gravity. Some households located lower in relation to the sewer main are equipped with small wastewater pumping stations to make the profile of the conduit more shallow [
17]. In this system, in contrast to the traditional gravity sewerage system, instead of manholes, system access points at critical intersections and at least every 500 m are installed [
19]. The SDGS system is used in unfavorable field conditions, such as flat or hilly terrain, a high level of groundwater, or a low population density [
17].
This system has the following advantages:
reduced water volume needed for the transport of suspended solids, compared with pressure and gravity [
17],
lower excavation costs than in a conventional gravity sewerage system [
17,
24],
possibility of using trenchless methods of laying conduits, thanks to the use of small pipe diameters [
17,
19],
lower capital costs and operating costs than those generated by a traditional sewerage system at the same level of service [
20,
25,
26],
ease of expanding the system or building a new network as opposed to traditional gravity sewerage, which is often oversized by design for 30 years (due to very high capital costs and land reconstruction costs) [
20,
26],
minimizing the risk of failure, which generally affects only one household at a given time; during the failure periods, septic tanks provide reserve volume [
27].
The disadvantages of such a system are as follows:
necessity of periodic inspection, cleaning of outlet filter, emptying STs and sludge management [
17,
24],
odor problems and corrosive aggressiveness of sewage and gases [
17,
24],
poor knowledge of the system specificity and the lack of extensive experience in its operation [
17,
24],
no possibility of cooperating with other alternative systems as a wastewater receiver [
17].
The SDGS system, as part of a conventional gravitational system, was created in 1960 in Zambia [
20]. In 1962, in Australia, an independent SDGS system was erected. It replaced a malfunctioning soil absorption system. In 2001, over 110,000 residents were serviced by such systems [
28]. In Poland, this system is not widespread. It is mainly implemented by the company Biotop from Zamosc and the Department of Hydraulic and Sanitary Engineering of the Poznan University of Life Sciences. The oldest system in the village of Nieledew was built over 22 years ago [
5] and has been working so far with a small number of failures, resulting mainly from improper operation and management. The low popularity of this system in Poland is probably due to the designers’ convictions regarding the superiority of traditional gravity sewerage and the lack of professional knowledge about the operation of such a system.
Because STs lengthen the hydraulic retention time of wastewater to several days and sludge and scum are deposited over several months, the effluent is putrefied. It releases, among other gases, hydrogen sulfide, which is corrosive, toxic and generates odors. These problems can be resolved by increasing the oxygen supply [
29] into the transported wastewater and/or by installing odor control biofilters [
29,
30,
31]. Robust treatment technologies in wastewater treatment plants should be applied (e.g., trickling filters, rotating biological contactors or constructed wetlands) rather than those vulnerable to toxic hydrogen sulfide (e.g., activated sludge) [
31].
Designing an SDGS system raises many problems, which are connected with the lack of understanding of hydraulic conditions in the networks. The main problem is the determination of the design flow. Most often, this is calculated using empirical equations. Unfortunately, these equations are suitable for specific conditions characterizing the studied area. For example, Crites and Tchobanoglous [
32] recommend the design flow calculated by the following equation (valid for
N > 50):
where
Qmax is maximum instantaneous design peak flow occurring once or twice per day (dm
3 min
−1), and
N is the number of contributing equivalent dwelling units (EDU).
Recently, Vincent [
4] recommended the following equation:
where
Qmax is the maximum instantaneous design peak flow (dm
3 s
−1);
k1 is the daily peak factor (for SDGS 1.2 ≤
k1 ≥ 1.5);
k2 is the hourly peak factor (for SDGS 1.5 ≤
k2 ≥ 2.2);
n is the number of contributing inhabitants; and
q is the unit water use (dm
3·cap
−1·d
−1).
A design peak flow, taking into account the probability of its occurrence, based on different averaging time intervals and the number of serviced EDUs can be calculated as in [
33]:
where
Qmax is the maximum design peak flow (dm
3 min
−1);
Qdav is the average daily flow (dm
3 min
−1);
N is the number of contributing equivalent dwelling units (EDU);
tPr is the radius of confidence (e.g.,
tPr = 1.17 for exceedance
Pr = 10%);
Cvm is the variation coefficient of maximum flows for a single EDU (
Cvm = 0.3–0.5); and
τav is the number of minutes in the averaging interval (e.g., 1, 15 or 60).
There are many other formulas for calculating the design peak flow [
17,
20,
21,
23,
34,
35,
36,
37,
38]. Unfortunately, they differ from each other, reflecting local conditions, e.g., unit water consumption per capita. In Poland, the average unit water consumption per capita (90 dm
3·cap
−1·d
−1 [
39]) is lower than in the USA (170–190 dm
3·cap
−1·d
−1 [
36]) and the EU (128 dm
3·cap
−1·d
−1 [
39]), and in rural areas these values are even twice as low as the average equal to 73 dm
3·cap
−1·d
−1 [
14,
40]).
The aim of the study was to analyze in detail and present an unconventional sewerage system applied in a sparsely populated rural area with undulating terrain with a high groundwater level and low water use by inhabitants. The second objective was to examine the feasibility of applying the Storm Water Management Model (SWMM) to simulate operation of the SDGS system. In our previous works [
22,
41], the feasibility of applying the SWMM to simulate the emptying of a simple SDGS (four tanks without an effluent filter) system was checked in semi-technical and laboratory studies. As far we know, the SWMM has not been applied before for the simulation of such a system, and therefore its validation in a real case study seemed to be attractive. The working hypothesis was that the use of septic tanks positively influences the selection of pumps and their energy consumption.
4. Discussion
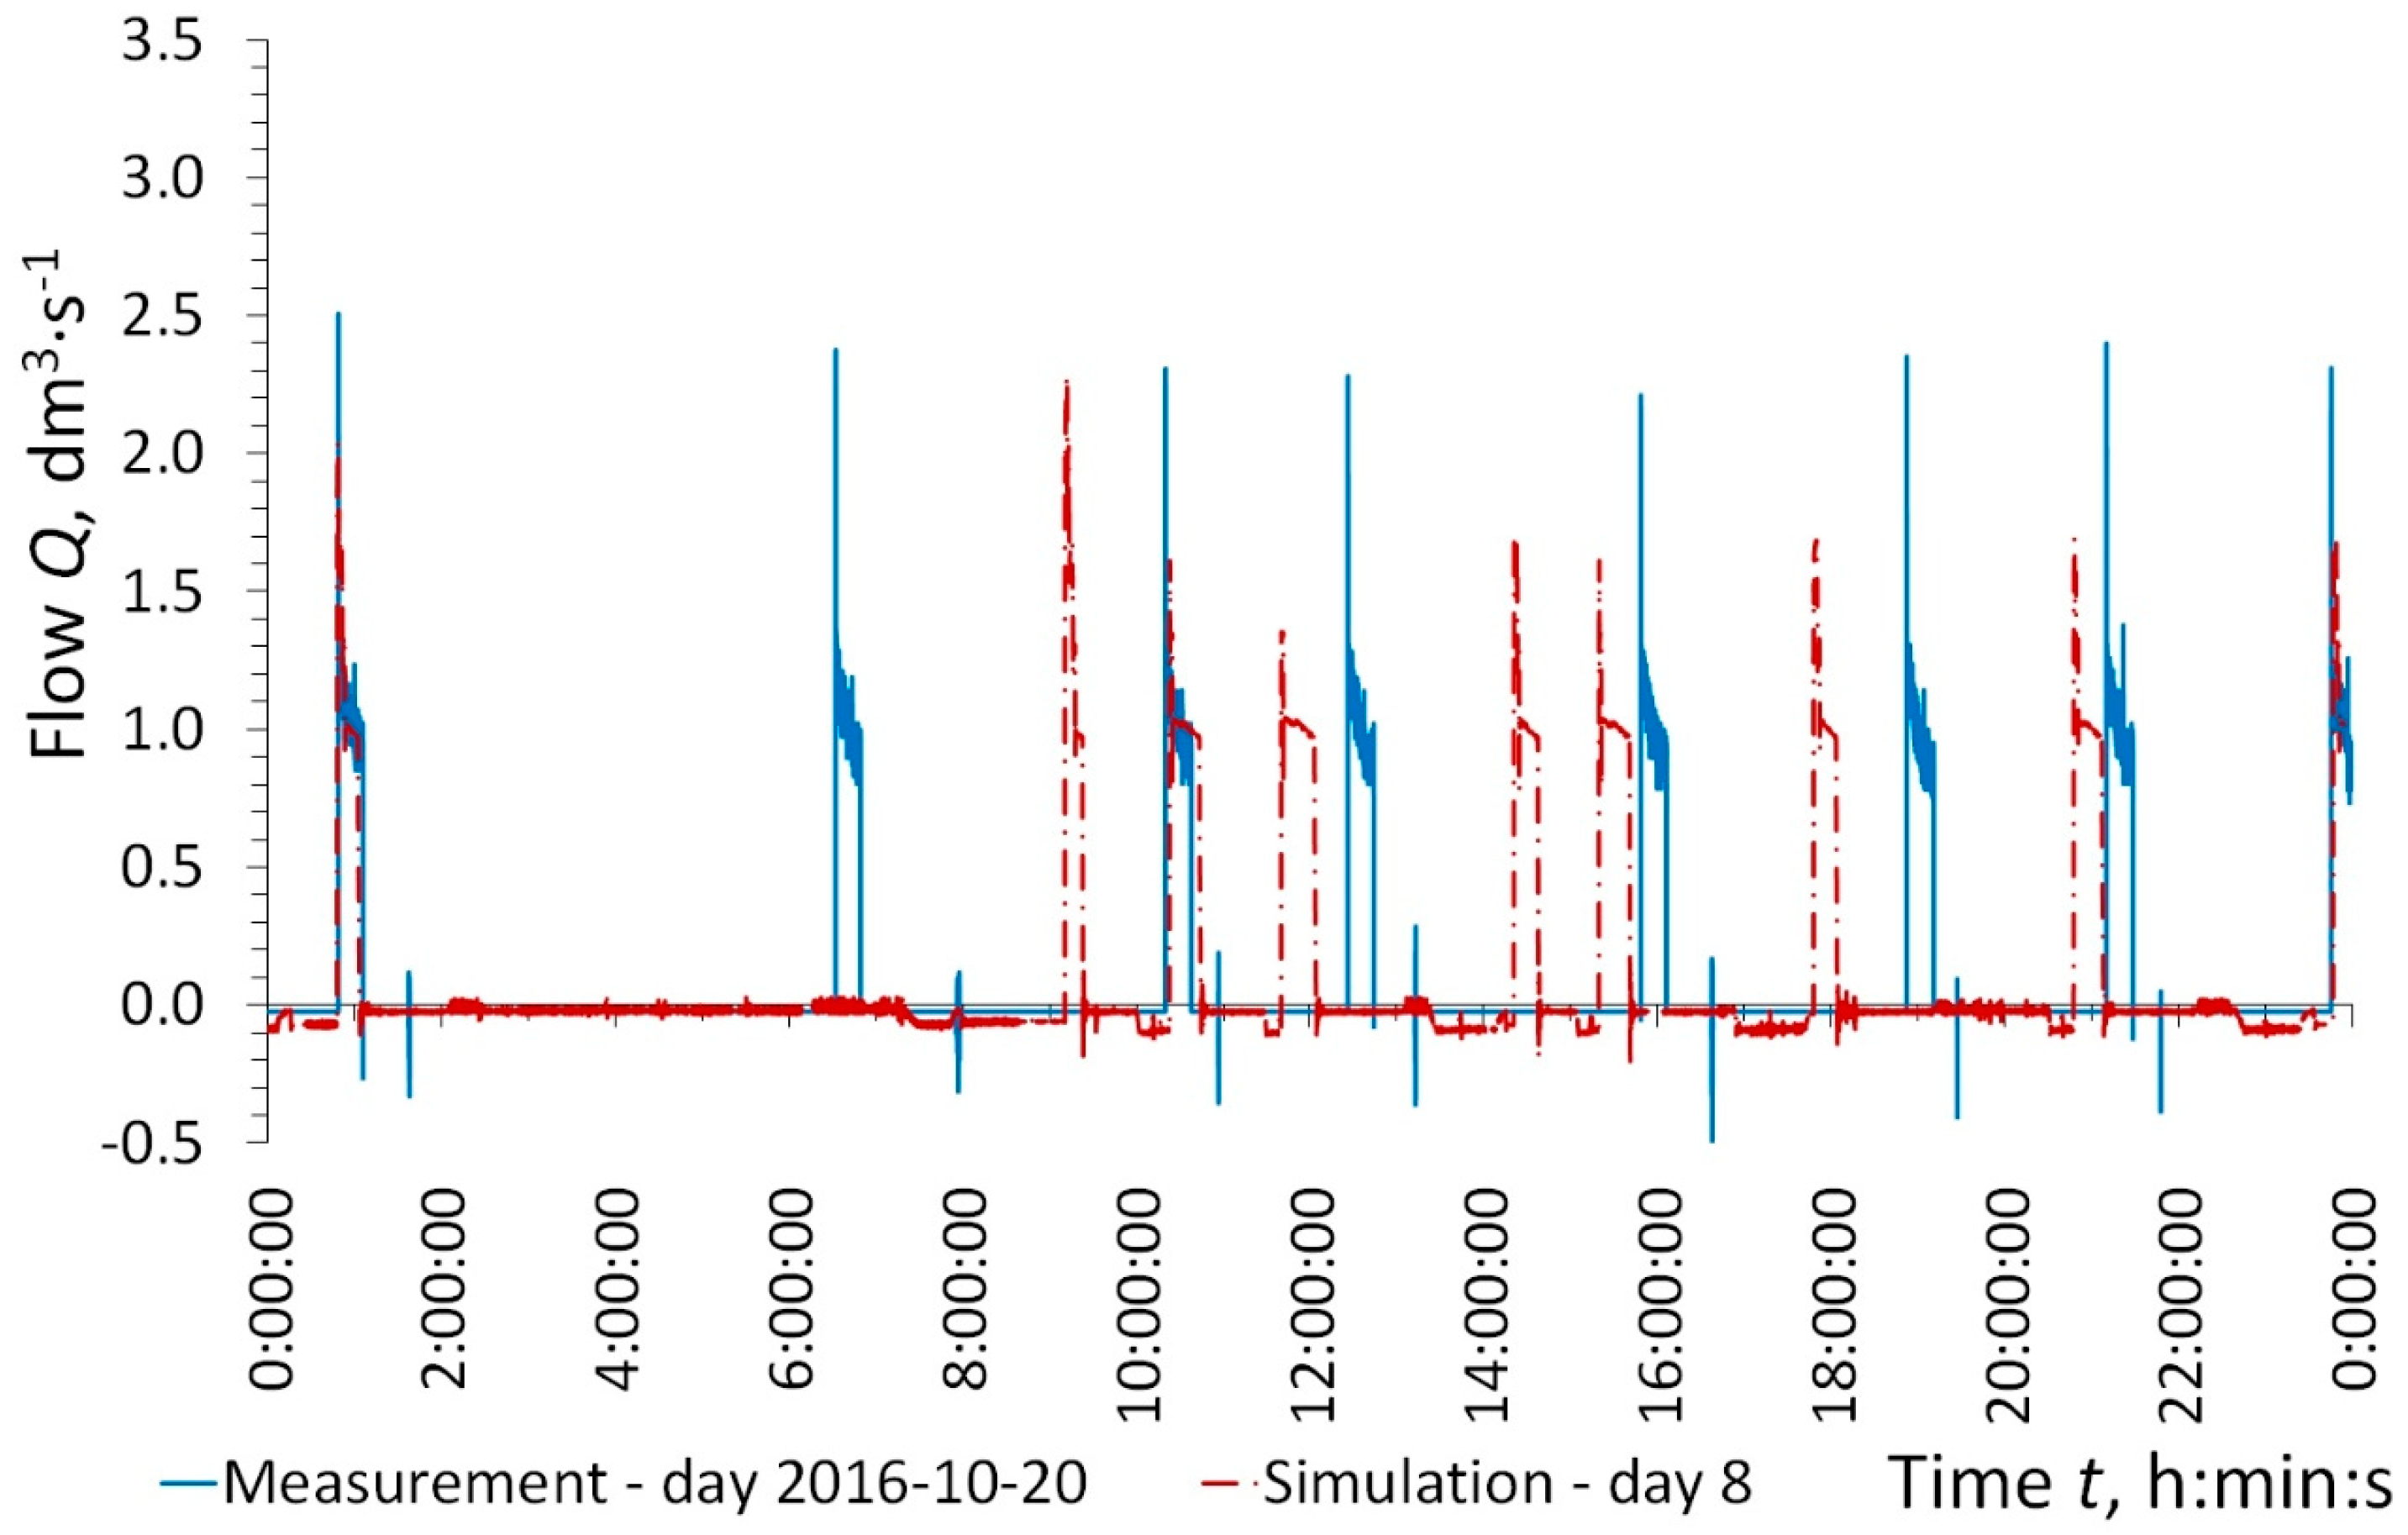
The most important parameters for design purposes are different peak flows: instantaneous, 1-min average and 1-h average maxima. The 1-min and hourly average maximum wastewater inflows to pumping station PS_2 from 59 buildings are given in
Table 6. The design flow treated as 1-min average maximum flow obtained from Equation (1) was estimated as 3.14 dm
3·s
−1. The value obtained by Equation (1) turns out to be much larger than the value obtained from the simulation. This discrepancy may result from the fact that it was an empirical equation and in the case of Equation (1) significantly higher average daily wastewater flows per capita were assumed. In the simulation the average daily flow value of 46.5 dm
3·cap
−1·d
−1 was assumed. The American conditions often adopt a value of average daily flow in the range of 170 to 190 dm
3·cap
−1·d
−1 [
36], which is a value almost four times higher. When this factor was taken into account, the value obtained from Equation (1) could be equal to 0.81 dm
3·s
−1. It is a value still larger than the value obtained from the simulation, and therefore it probably should be treated as instantaneous, but not the 1-min average peak flow. The 1-min average peak flows calculated using Equation (3) were slightly lower than or equal to that obtained from the computer simulation. Similarly good agreement was achieved for maximum hourly flows, but unfortunately they were 58–84% higher than the measured one. To validate this discrepancy a longer analysis seems to be necessary. The best results were obtained from Equation (2).
Various authors recommend various self-cleaning velocities of pipelines in the SDGS system: 0.5 m∙s
−1 [
20]; 0.3–0.45 m∙s
−1 [
36]; 0.2 m∙s
−1 [
17]; 0.15 m∙s
−1 [
15]; 0 m∙s
−1—no need for a self-cleaning velocity at a low concentration of suspended solids (wastewater pretreatment in ST) [
24]. Most of the above-mentioned velocities were determined based on the operational experience of an existing SDGS system. A few researchers have determined these velocities based on the size of the suspended solid particles that constitute the effluent from STs [
15]. The maximum velocities in all conduits under investigation were compared with the values of self-cleaning velocity given by various authors (
Table 7).
A self-cleaning velocity of 0.15 m·s−1, which should occur at least once per day, was not reached in only 16 conduits out of 290, which is only 6% of all connections, but if it is taken to be 0.5 m·s−1, the percentage rises to 46%. The reaches that did not meet this requirement were lateral connections and a conduit (sewer) network just below the septic tank lateral connection, where the maximum instantaneous velocity reached 0.14 m·s−1.
An even more important factor than self-cleaning velocity is the critical bed shear stress. According to [
15], the critical value of shear bed stress is 0.15 N·m
−2. In
Table 8, a comparison of the calculated bed shear stress values with different critical values is presented. The critical shear bed stress of 0.15 N·m
−2, which should occur at least once per day, was not reached in only 28 conduits out of 290, which is only 10% of all connections. This value is larger in the case of the self-cleaning velocity, but in this case many more lateral connections did not reach the critical bed shear stress. The reaches that did not meet this requirement were mainly lateral connections and a conduit (sewer) network just below the septic tank lateral connection.
Thanks to SWMM 5.1, one can check the correctness of the design assumptions and solutions, such as the magnitude of the retention volume in pumping stations and STs, conduit diameters, and the occurrence of self-cleaning velocity or hydraulic overloads. The SDGS system simulation in the SWMM 5.1 program allows for the simulation of various network operation variants—under unsteady state conditions as opposed to traditional design, in which steady state conditions are assumed. It is also easy to simulate STs as wastewater reservoirs.
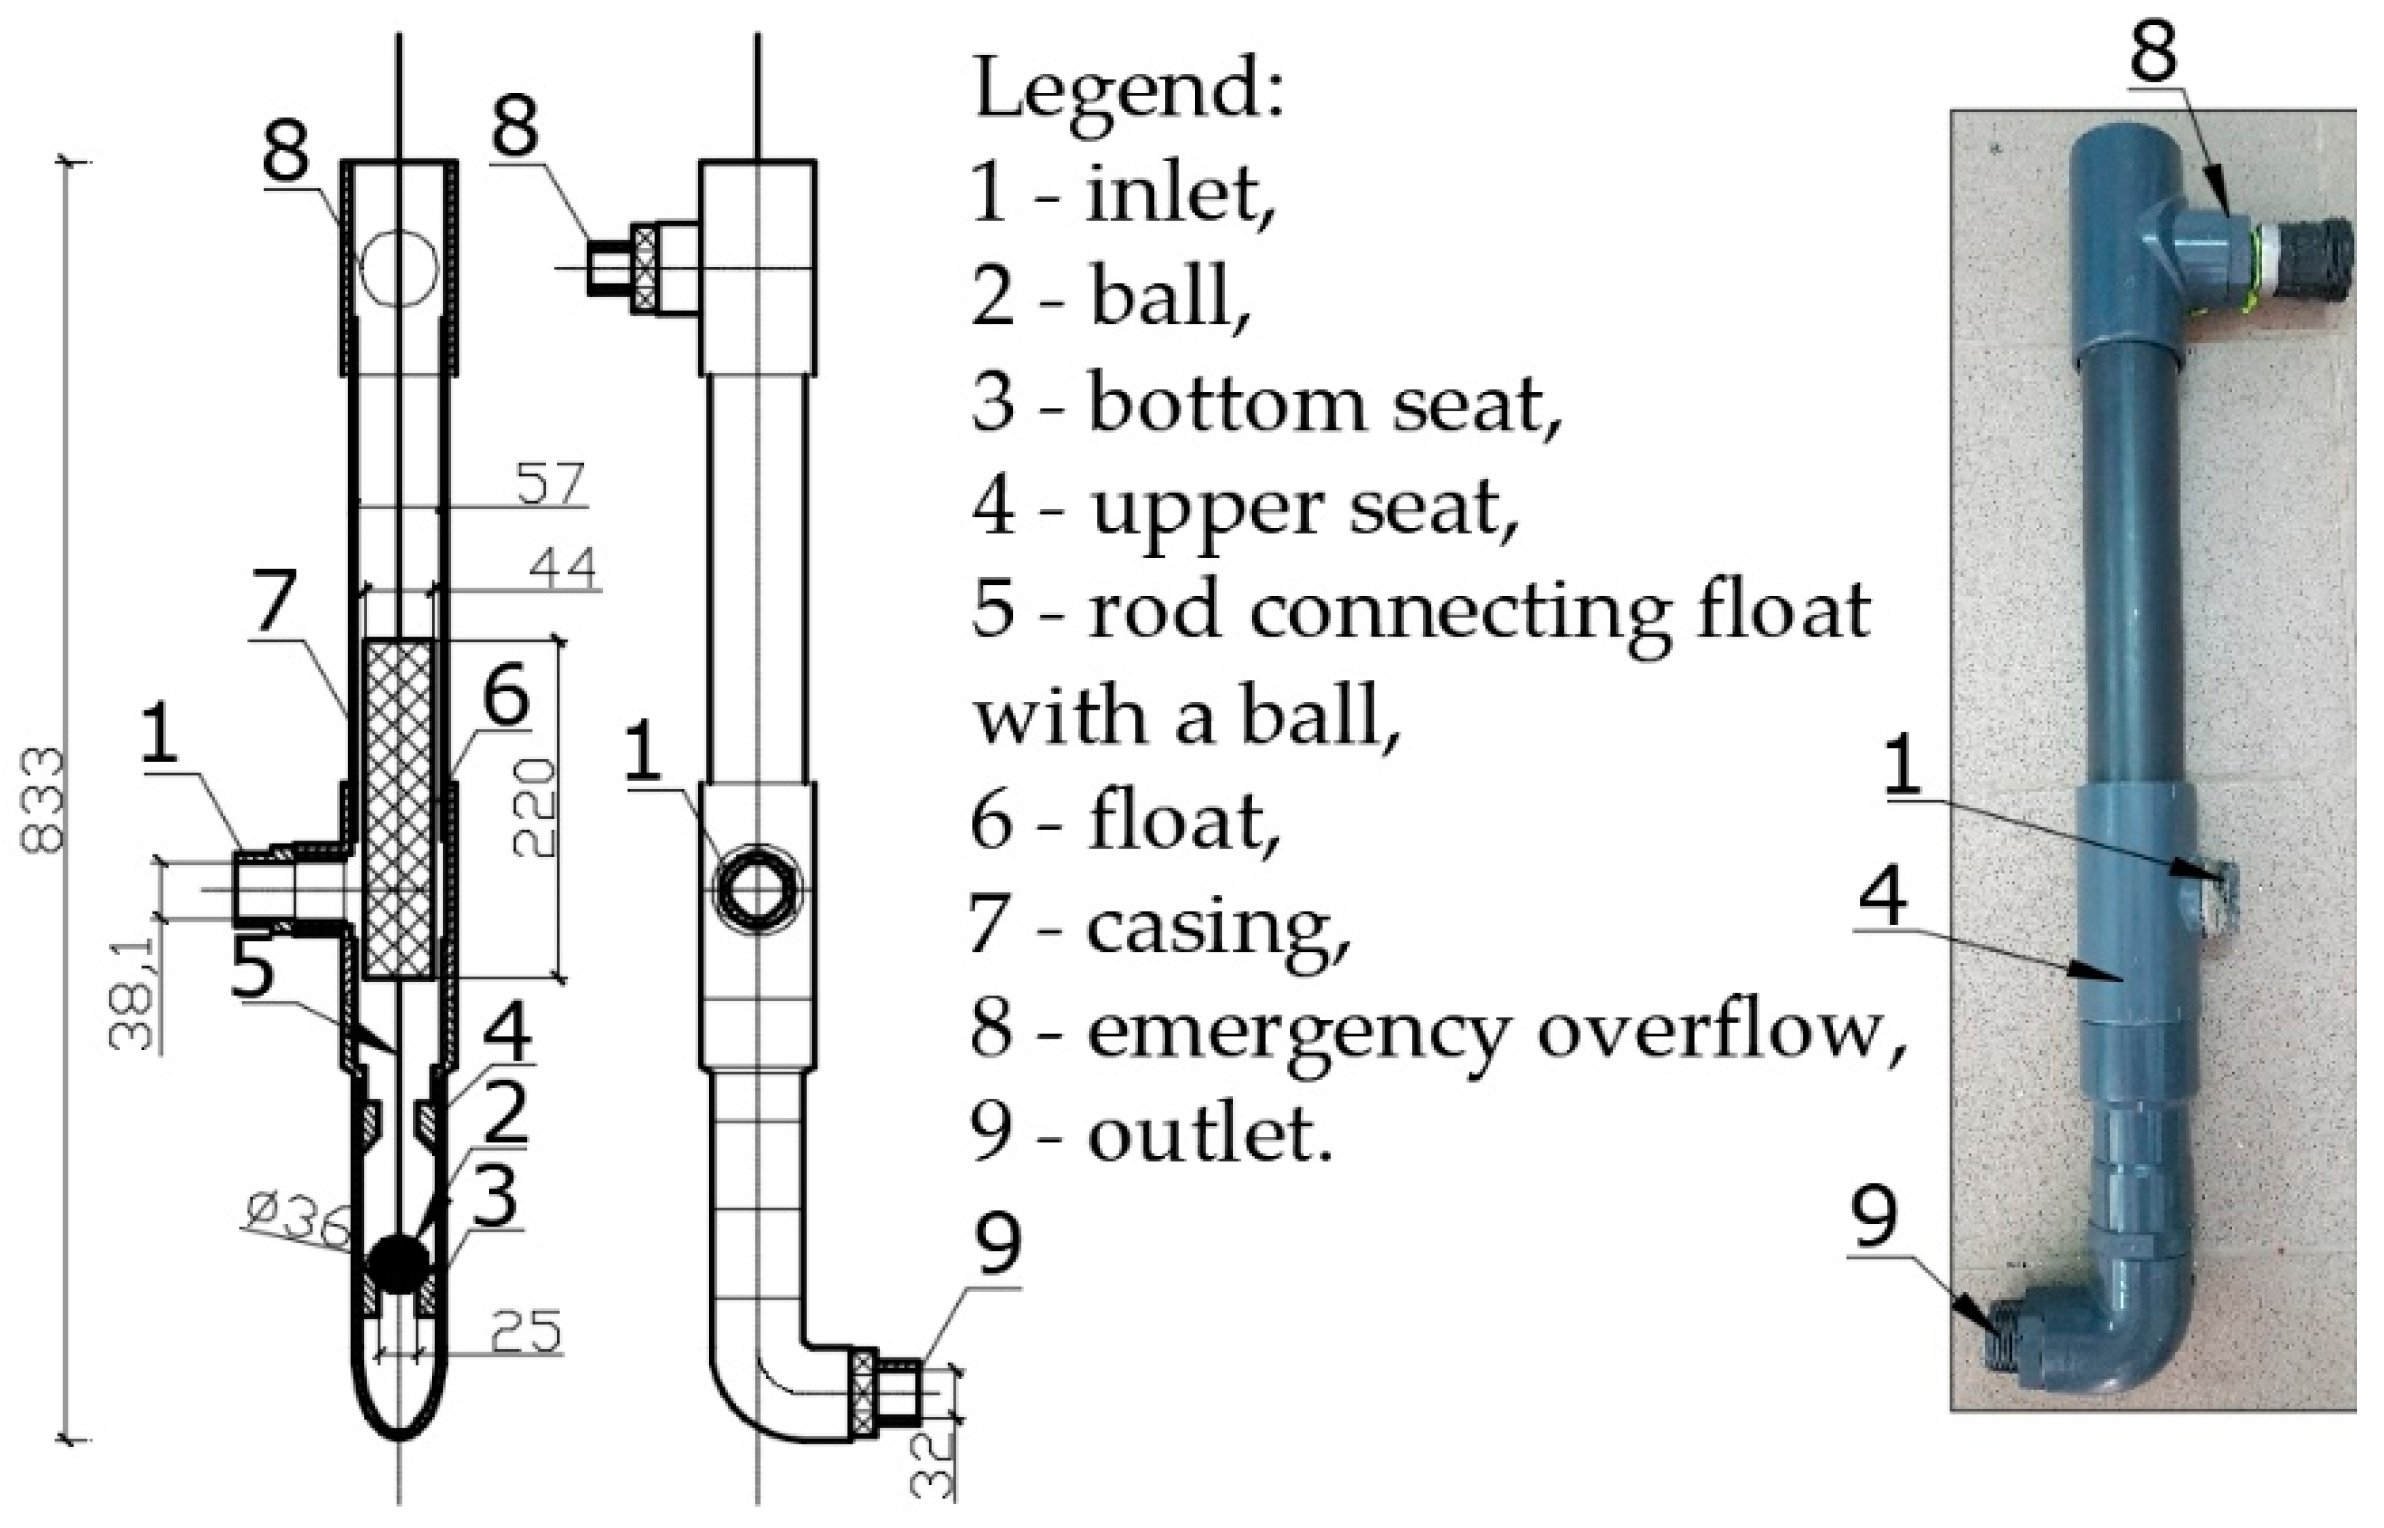
Using traditional methods of system design, it is also not possible to determine a suitable emitter flow rate. The emitter allows for the possibility of emptying septic tanks connected to the force main (between PS_1 and Sr1), by emptying the force main during pump idle time. The suitable emitter flow rate should be the smallest that allows the emptying of the connected STs.
Comparing the capital costs of different SDGS systems with conventional gravity sewers, the former have been up to 65% cheaper than the latter [
15,
17,
20,
24,
36], and the 49% lower capital costs are not an exception.
The O&M of the gravity sewerage system depends on many factors including population density, the number of the residents served and the number of used pumping stations. In rural areas in Poland, the O&M costs often lie in the range of 2–3% of capital costs (without depreciation) [
47,
60]. The O&M costs of SDGS systems, estimated by the US EPA for a hypothetical rural commune, were from 4 to 5.5 times lower than those generated by traditional gravity sewerage systems [
61]. In our case study, the forecast O&M costs of the gravity sewerage system would reach approximately 65 EUR cap
−1 y-r
−1, i.e., four to five times those of the constructed SDGS system.
Further investigations concerning the flow variability and reliability of the system are ongoing. More realistic patterns of wastewater outflow distribution can be provided using short-interval (10, 30 or 60 s) measurements of water usage [
13,
62] in individual dwellings. There is also a need for the further monitoring of sludge and scum in STs. To date, one-third of all STs have been emptied after approximately two years of operation. Although no complaints about odors were recorded during the operation of the investigated system, further work is needed to estimate the risk connected with hydrogen sulphide generation and exposure. Measurement of the H2S concentrations in critical parts the SDGS system (STs, pumping stations and release manholes) is also planned. Additional research is needed to assess the energy consumption and feasibility of use of renewable energy sources.


