Article

Quantitative Detection of Clogging in Horizontal Subsurface Flow Constructed Wetland Using the Resistivity Method

1
Shandong Key Laboratory of Water Pollution Control and Resource Reuse, School of Environmental Science & Engineering, Shandong University, Jinan 250100, China
2
River Management Office of Qinhuagndao City, Qinhuagndao City 066000, China
3
State Key Laboratory of Microbial Technology, Shandong University, Jinan 250100, China
4
Geotechnical and Structural Engineering Research Center, Shandong University, Jinan 250061, China
5
Environmental Simulation and Pollution Control State Key Joint Laboratory, School of Environment, Tsinghua University, Beijing 100084, China
6
Key Laboratory of Ocean Environment and Ecology, Ministry of Education, College of Environmental Science and Engineering, Ocean University of China, Qingdao 266100, China
*
Author to whom correspondence should be addressed.
Water 2018, 10(10), 1334; https://doi.org/10.3390/w10101334
Submission received: 9 August 2018 / Revised: 11 September 2018 / Accepted: 19 September 2018 / Published: 26 September 2018
(This article belongs to the Section Water Quality and Contamination)

Abstract

:
Substrate clogging seriously affects the lifetime and treatment performance of subsurface flow constructed wetlands (SSF CWs), and the quantitative detection of clogging is the key challenge in the management of substrate clogging. This paper explores the feasibility of the resistivity method to detect the clogging degree of an SSF CW. The clogged substrate was found to have a high water-holding capacity, which led to low apparent resistivity in the draining phase. On the basis of the resistivity characteristics, clogging quantification was performed with a standard laboratory procedure, i.e., the Wenner method used in a Miller Soil Box. The apparent resistivity to sediment fraction (v/v) (ARSF) model was established to evaluate the degree of clogging from the apparent resistivity. The results showed that the ARSF model fit well with the actual values (linear slope = 0.986; R-squared = 0.98). The methods for in situ resistivity detection were applied in a lab-scale horizontal subsurface flow constructed wetland (HSSF CW). Combined with the ARSF model, the two-probe method demonstrated high accuracy for clogging quantification (relative error less than 9%). These results suggest that the resistivity method is a reliable and feasible technique for in situ detection of clogging in SSF CWs.

Graphical Abstract

1. Introduction

Subsurface flow constructed wetlands (SSF CWs) are widely applied worldwide as a passive ecological wastewater treatment system because of their advantages of high efficiency, low cost, and landscape value [1]. In SSF CWs, wastewater flows through the void space within the substrate. With the operation of the system, the void space is prone to clogging by the gradual accumulation of suspended solid (SS), biological film, plant residue, etc. [2,3]. Substrate clogging, in whole or in part, could lead to uneven flow and reduced purification ability. Moreover, surface sludge accumulation and crossflow may bring about the health risks of foul gas release and mosquito breeding [4,5]. The sustainable operation of SSF CWs is seriously hindered by the existence of substrate clogging.
So far, current substrate clogging management practices can be divided into two groups. One group contains preventative measures, such as intermittent operation and reduced hydraulic loading, which aim to delay the clogging process [6]. The other group contains restorative measures, such as cleaning and changing the clogged substrate, which are implemented on the systems that exhibit clog-induced hydraulic problems [7]. Nevertheless, these measures can only be effective if information on clogging location and degree of clogging are available. Therefore, a clogging detection method with the properties of high accuracy, non-destructiveness, and simple realization is urgently needed.
The available clogging detection methods include hydraulic conductivity measurement, tracer testing, and clogging matter characterization [5]. Hydraulic conductivity can directly reflect the clogging degree, and the constant head permeameter specifically applied in SSF CWs has been well designed [8]. However, the limited internal sampling points usually bring about low accuracy. In addition, the operation of the constant head permeameter for in situ detection of the substrate permeability is complex, which limits its full-scale application. The tracer-testing method of measuring the hydraulic performance of wetland systems has also been well developed. Clog-induced preferential flow pathways can be inferred by effluent and internal tracer studies [9]. However, this method has the disadvantages of being time-consuming, having low accuracy, and causing secondary pollution. Some exotic techniques for in situ detection of clogging matter, such as ground-penetrating radar, nuclear magnetic resonance, and microbial fuel cell, have been presented to quantify the accumulated solid [10,11,12]. However, as they are susceptible to environmental factors, their accuracy and practicability should be further discussed. In addition, these detection methods are usually complex and expensive. It is counter-productive to add the complexity of SSF CWs. There is still a long way to go before achieving a full-scale application of these techniques.
It has been reported that the apparent resistivity of gravel or sand is about two orders of magnitude larger than that of silt or clay [13]. As clogging matter generally consists mostly of silt and clay, the clogged substrate, which is filled with clogging matter, is inferred to have a lower apparent resistivity than the unclogged substrate in the draining phase [14,15]. The clogging is dominated by biological solids when treating wastewater with high organic loading. The biological solids could facilitate the formation of low-density gelatinous clogging matter with high water-holding capacity [4]. The accumulation of biological solids could also decrease the apparent resistivity of the substrate. The identification of cumulative solid by its apparent resistivity characteristics is valid in all of these situations. As SSF CWs usually have a well-developed drainage system, the draining process is easy to implement. The resistivity method, which has the advantages of being non-destructive, low-cost, and time-saving, is a potential technique to detect the apparent resistivity distributions of wetland beds [16,17]. Therefore, it is meaningful to characterize the substrate clogging in SSF CWs using the resistivity method.
The main objectives of the present work were to: (1) characterize the quantitative relationship between degree of clogging and apparent resistivity with a mathematical model and validate the use of the model in clogging detection; (2) study the feasibility of the resistivity detection method for in situ quantification of clogging in SSF CWs.

2. Materials and Methods

2.1. Measurement of Apparent Resistivity

To explore the relationship between the degree of clogging and apparent resistivity, a standard laboratory procedure for measuring soil electrical resistivity was applied, based on the use of the Wenner method in a Miller Soil Box [18]. As shown in Figure 1, the self-made Miller Soil Box was 60 cm in length, 30 cm in width, and 20 cm in height. Both sides of the box were stainless steel plates, and the rest of the parts were made from polyethylene material. A water outlet was installed at the bottom of the box. The two stainless steel plates were connected with an ampere meter (UT 200A) and a 25 V external alternating power supply. The box was filled with clogged substrate, and the substrate was soaked in tap water for more than one day before testing. Two stainless steel electrodes were inserted in the substrate at an insertion depth of 15 cm, at the 1/3 and 2/3 positions in the length direction, respectively, and in the center of the box widthwise. The two electrodes were connected to a voltage meter (UT 890D). The temperature was 26 ± 1 °C, and the air humidity was 50 ± 5 RH. The detection was performed in both the filling and draining phases, and the apparent resistivity was calculated according to Equation (1)
ρ = S L U I
where ρ is the apparent resistivity (Ω·m); S is the area of stainless steel plate (0.06 m2); L is the distance of stainless steel bars in the Miller Soil Box (0.2 m); U is the voltage between two potential electrodes (V); I is the current of the closed circuit (A).
For in situ resistivity detection in SSF CWs, the four-probe method and two-probe method were applied [19]. These two methods are commonly used to detect soil resistivity. Distinctively, the four-probe method is more accurate for resistivity detection of soil on a large scale, and the two-probe method is more convenient for resistivity detection of soil on a small scale. The apparent resistivity is dependent on the distance and depth of the electrodes, and its calculation is based on Equation (2). In practice, the electrode distance is recommended to be 10 times more than its depth when the electrode is a bare rod. Given this condition, the electrode can be regarded as a point, and the characteristic function F(a) is simplified as in Equation (3), with the acceptable error of less than 3%. However, in this study, the gravel substrate had high resistance and a small depth, which required deep depth and short distance of the electrodes. The empirical formula in Equation (4) can be applied to any distance of the bare rod electrodes and was put forward by Faleiro et al. [20]. To monitor the apparent resistivity distribution of the SSF CW, the electrodes were vertically inserted into the substrate at a depth of 15 cm. The positions of all electrodes were uniformly distributed at a distance of 20 cm. The uniform electrode settings led to a constant F(a) value of 1.62 m for the four-probe method and 0.24 m for the two-probe method, which were deduced from the experimental results. Hence, the fitting parameters of the formula are not discussed here.
ρ = F ( a ) U I
F ( a ) = 2 π a
F ( a ) = p 1 a 2 + p 2 a + p 3 a + p 4
where ρ is the apparent resistivity (Ω·m); U is the voltage between two potential electrodes (V); I is the current of the closed circuit (A); F(a) is a function of electrode distance; a is the distance of electrodes in the SSF CW (0.2 m); px are empirical coefficients.

2.2. Experimental Setup

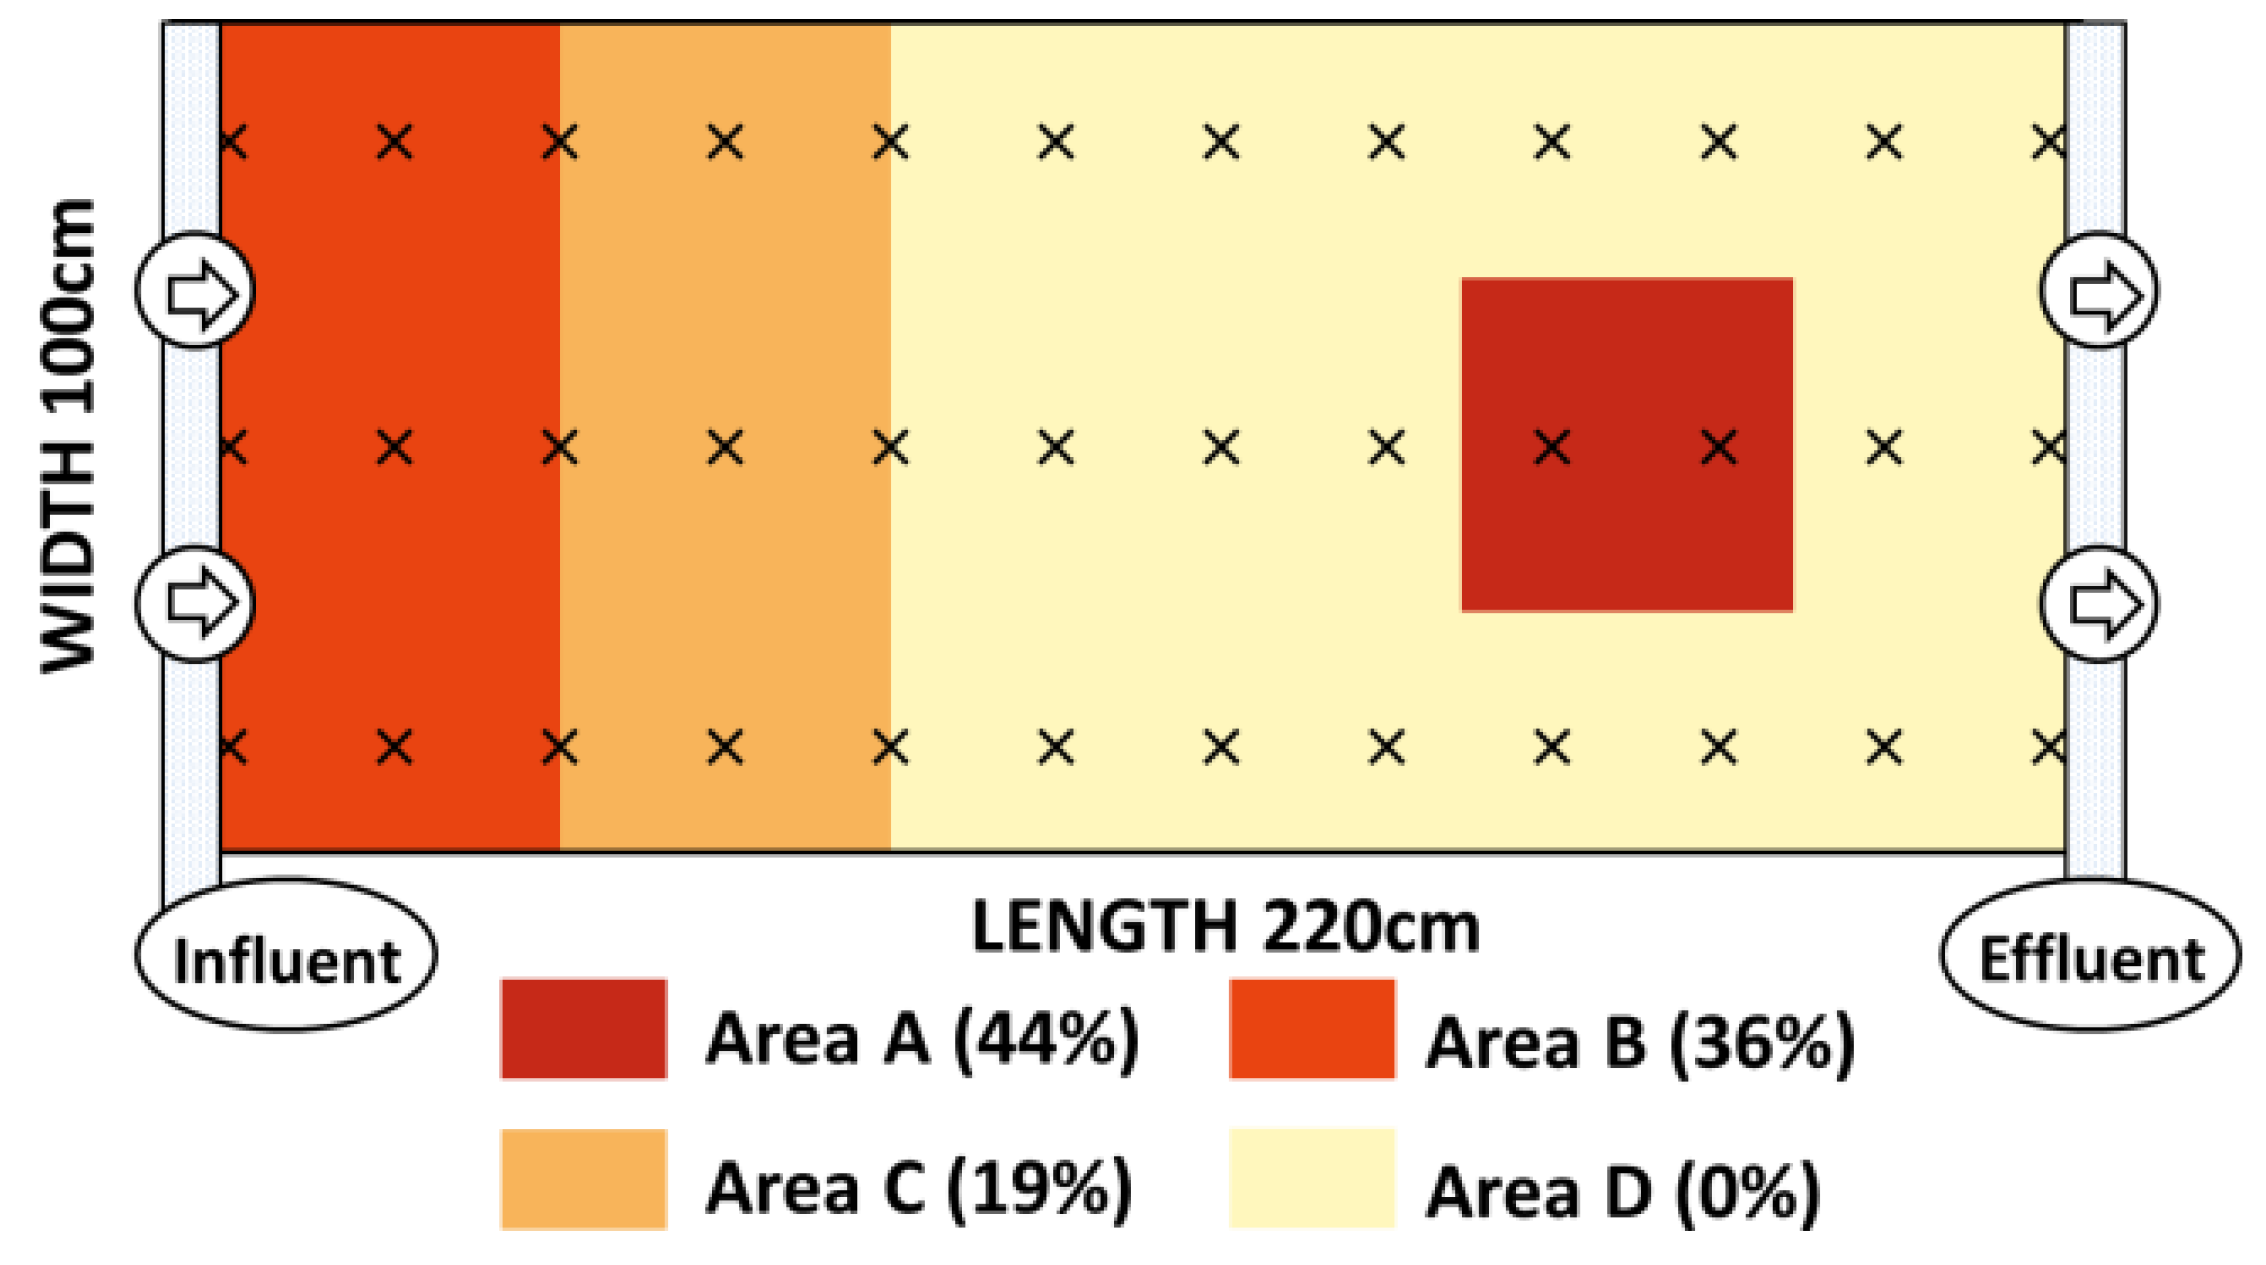
The lab scale horizontal subsurface flow constructed wetland (HSSF CW) was 220 cm in length, 100 cm in width, and 50 cm in depth, and the surface of the HSSF CW was at the same horizontal level as the ground surface (Figure 2). The mixtures of gravel and known volumes of wetland sediment were applied to simulate clogged substrates with different degrees of clogging. The sediment was retrieved from Baiyunhu Wetland in Zhangqiu, North China. The organic matter content of the sediment was 7.4%, and the median particle diameter was 6.8 μm. The sediment simulated clogging matter that contains both inorganic components (silt, clay) and organic components (humic acid, humin, fulvic acid) [4]. Though the proportion of organic solid was small, its effect on hydraulic resistance could not be neglected. The retrieved sediment was fully homogenized in the pretreatment process. The clean gravel, 2–4 cm in diameter, was soaked in tap water for one hour before the mixture process. The sediment fraction (v/v) was defined as the indicator of the amount of added sediment and was calculated according to Equation (5):
φ Sed . = V Sed . V Spa . × 100 %
where φ Sed . is the sediment fraction (v/v) of the clogged substrate; VSed. is the volume of added sediment, (L); VSpa. is the void space of clean gravel substrate (L).
As shown in Figure 2, the sediment fractions (v/v) of the clog areas A, B, and C were 44%, 36%, and 19%, respectively. Areas B and C simulated inlet zone and clarification zone clogging, and area A simulated inner zone clogging. Area D represented an unclogged area, and the sediment fraction (v/v) in area D was designed to be zero. As shown in Table 1, the HSSF CW was continuously fed with domestic wastewater as described by Wang et al. [21]. The hydraulic retention time (HRT) was designed to be 3 days. For a better simulation of the actual morphology of clogged substrate, clogging detection was carried out after three months of operation.

2.3. Measurement of Void Space, Water Content, and Hydraulic Conductivity

The void space of the clogged substrate was measured by draining the Miller Soil Box and collecting the water volume [22]. To detect the water content of the clogged substrate in the filling or draining phase, three soil moisture sensors (SMS-T1-485, Qifeng Co., Ltd, Dalian, China) were pre-buried in different positions within the system, and the average value was adopted. The hydraulic conductivity of substrates with different degrees of clogging was measured by the constant head method in a transparent cylinder, which was calculated by Equation (6):
k = Q A L Δ h
where k is the permeability coefficient (m/s); Q is the flow rate of the effluent (m3/s); A is the cross-sectional area of the cylinder (m2); L is the height of the substrate (m); ∆h is the hydraulic gradient (m).

2.4. Statistical Analysis

All the experiments were performed in triplicate. A one-way analysis of variance (ANOVA) was used to analyze the significance of differences between actual/preset and detected values (SPSS 18.0, SPSS, Chicago, IL, USA). Apparent resistivity profiles describing the sediment fraction (v/v) of wetland substrate as a function of detection time were fitted to the first-order model (Origin 8.0, Origin Lab, Northampton, MA). Linear regression analyses were carried out to test the relationships between relevant parameters (Microsoft Excel 2010, Microsoft Corporation, Washington, USA). The average results for the detected degrees of clogging in the lab scale HSSF CW were displayed in the form of a contour map (Surfer 10, Golden Software, Golden, USA). In all cases, the correlations were considered statistically significant when p < 0.05.

3. Results and Discussion

3.1. Apparent Resistivity of Wetland Mediums

The apparent resistivities of gravel substrate, separated sediment, and their mixture (clogged substrate) were detected in the filling phase and draining phase. As shown in Table 2, sediment (67 Ω·m) showed higher apparent resistivity than gravel (30 Ω·m) in the filling phase. This phenomenon could be explained by the conductivity difference between the water types. The water in wetland substrate can be categorized as bound water, capillary water, or bulk water [23]. A large proportion of ions in capillary water and bound water can be adsorbed on the surface of micropores, leading to the smaller electrical conductivity of capillary water and bound water compared to bulk water [24]. In this situation, a high proportion of capillary water or bound water would lead to a decline in the electrical conductivity, or increase of the apparent resistivity, of the medium. Therefore, the clean gravel substrate, which had negligible capillary water or bound water content, exhibited relatively lower apparent resistivity than the sediment. Nevertheless, the difference in apparent resistivity in the filling phase was not remarkable compared with the fluctuations brought about by water quality, gravel size, sediment composition, environmental condition, etc. [13].
Because of water loss, the three wetland mediums reduced their electrical conductivities in the draining phase (Table 2). The obtained apparent resistivity values for gravel, sediment, and their mixture were 3175, 87, and 132 Ω·m, respectively. These results were within the typical ranges summarized by Samouëlian et al. [13]. In the gravel substrate, bulk water was the main component, and bulk water can be easily discharged by gravity. Since the electric conductivity of earth materials mainly depends upon their water content and water quality, the apparent resistivity of the gravel substrate achieved a sharp increase in the draining phase. Compared with the gravel substrate, the accumulated sediment showed higher water-holding capacity on account of its high clay content and developed capillary porosity [25]. As a result, the resistivity value of the sediment only showed a small-scale increase during the draining phase. The electric conductivities of the bound water, capillary water, and bulk water were assumed to remain essentially constant and to have a neglible effect compared to the huge variation brought about by water content. The mixture of gravel and sediment showed a moderate increase in apparent resistivity compared with the gravel medium alone. It can be inferred that the resistivity values were inversely related to the proportion of sediment in the draining phase. It is worth mentioning that, in theory, this rule also equally applies to the situation of bioclogging. In general, the apparent resistivity was a potential indicator of clogging in SSF CWs.

3.2. Effect of the Degree of Clogging on Apparent Resistivity

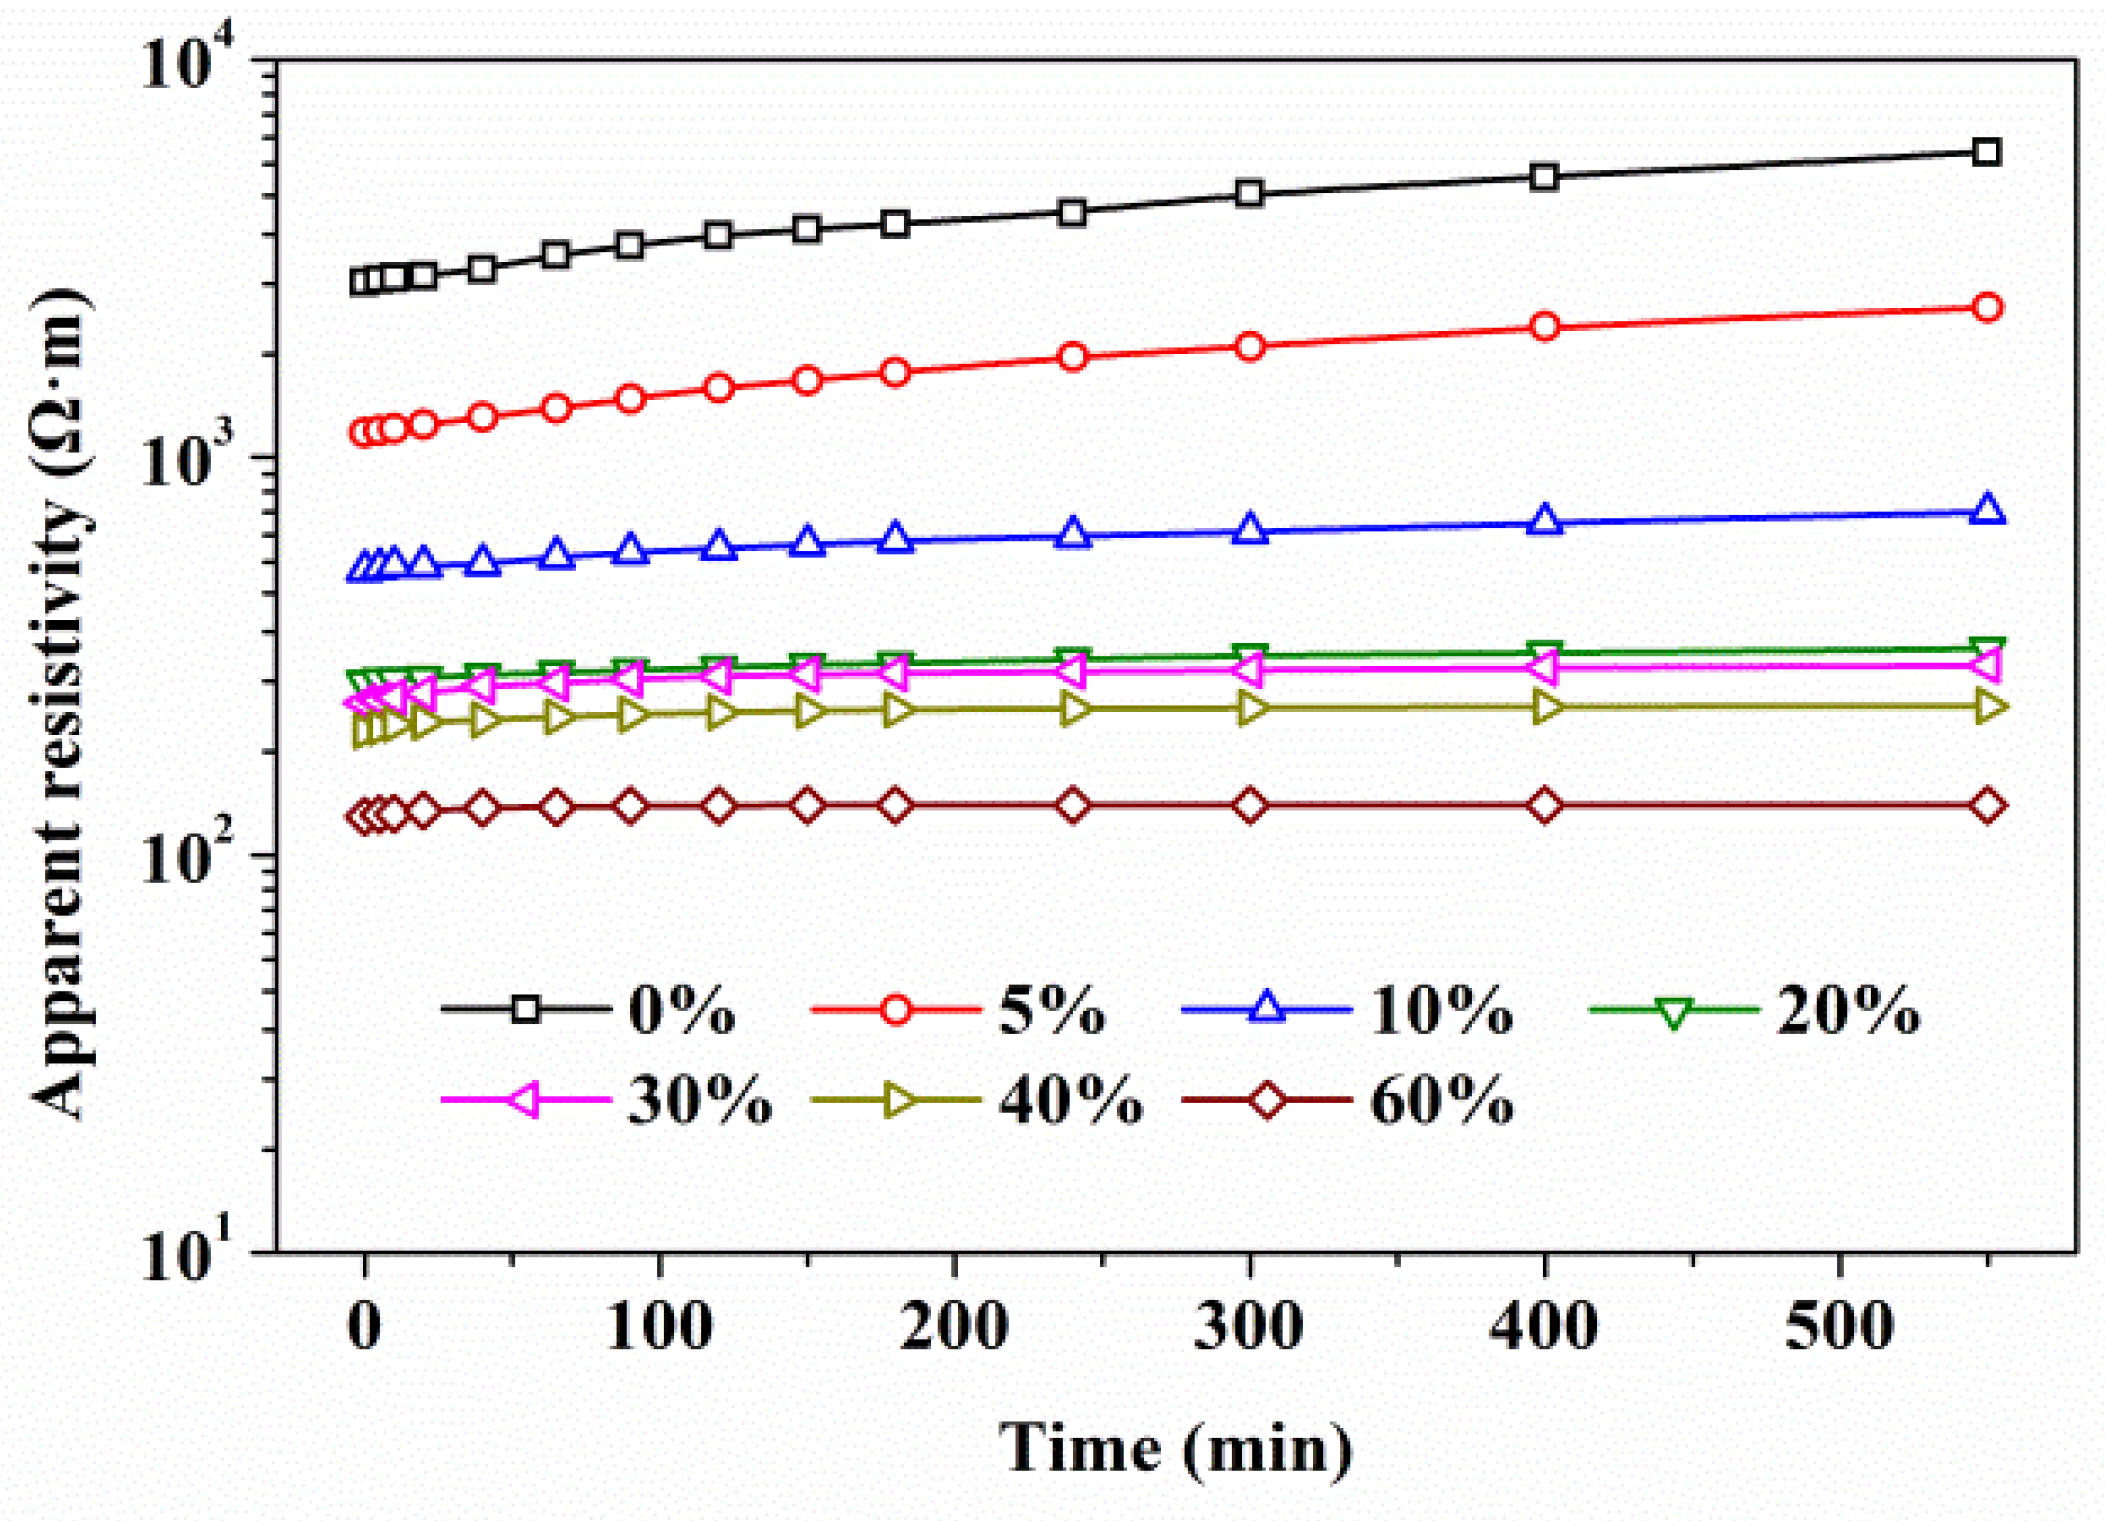
The apparent resistivities of wetland substrates with different sediment fractions (v/v) were measured intermittently after the rapid draining time. As shown in Figure 3, the apparent resistivity values decreased progressively with increased clogging, which indicates that resistivity is a highly accurate marker of sediment fraction (v/v). Moreover, the apparent resistivity values of substrates with sediment fractions (v/v) of 0%, 5%, 10%, and 20% were 2754, 1152, 519, and 272 Ω·m, respectively, at the initial measurement time. The highly significant differences in apparent resistivity observed between the lower sediment fractions (v/v) represented the high sensitivity and low detection limit of the measuring method. Such features were beneficial to quantifying the degree of clogging, especially in the initial clogging stage, and could provide effective information for clogging prevention.
The apparent resistivity values of all the mediums showed a tendency to increase with increased draining time (Figure 3). The continuous water loss may account for this phenomenon. Bulk water infiltration and free water (including capillary water and bulk water) evaporation are two dehydration mechanisms of clogged substrates [26]. It has been concluded that bulk water run off plays a leading role during the first stage (several days) of sediment drying, and free water evaporation becomes the main pathway of water loss in the second stage (several months) [27]. Water drainage by gravity is believed to be the dominant water loss pathway during our detection period (less than one day). As the temperature, humidity, and flow rate of air had little influence on the rate of water drainage by gravity, air-induced errors could be ignored.
As shown in Figure 4, the electrical conductivity increased with increasing water content. A similar correlation was also observed by Ozcep et al. [28]. Water usually contains a certain amount of conductive ions, and water content was linearly associated with electrical conductivity. The good linear relationship (R-squared = 0.99) between electrical conductivity and water content indicated that the immediate cause of apparent resistivity differences in different sediment fractions (v/v) was water content, rather than sediment volume. To avoid the errors brought about by continuous water loss, the draining time must be taken into consideration during the detection procedure.

3.3. Mathematical Model

A first-order kinetic model was applied to build the relationship between apparent resistivity and degree of clogging. The changes in apparent resistivity values across the sediment fractions (v/v) over the detection time satisfied the model with good agreement (R-squared > 0.96). The coefficients of the first-order kinetic model varied with detection time, and the form of the first-order kinetic model is shown in Equation (7). The coefficients of variation and detection time were further fitted to a linear function or quadratic polynomial functions, resulting in Equations (8)–(10):
φ Sed . = a ( t ) × exp [ ρ b ( t ) ] + c ( t )
a ( t ) = 9.24 × 10 7 t 2 8.73 × 10 4 t + 1.32
b ( t ) = 2.24 × 10 4 t 2 + 2.04 × 10 1 t + 1.54 × 10 2
c ( t ) = 1.08 × 1 0 5 t + 2.91 × 1 0 2
where φ Sed . is the sediment fraction (v/v); ρ is the detected apparent resistivity (Ω·m); t is the detection time (min); a(t), b(t), and c(t) are coefficients of the first-order kinetic model at detection time t.
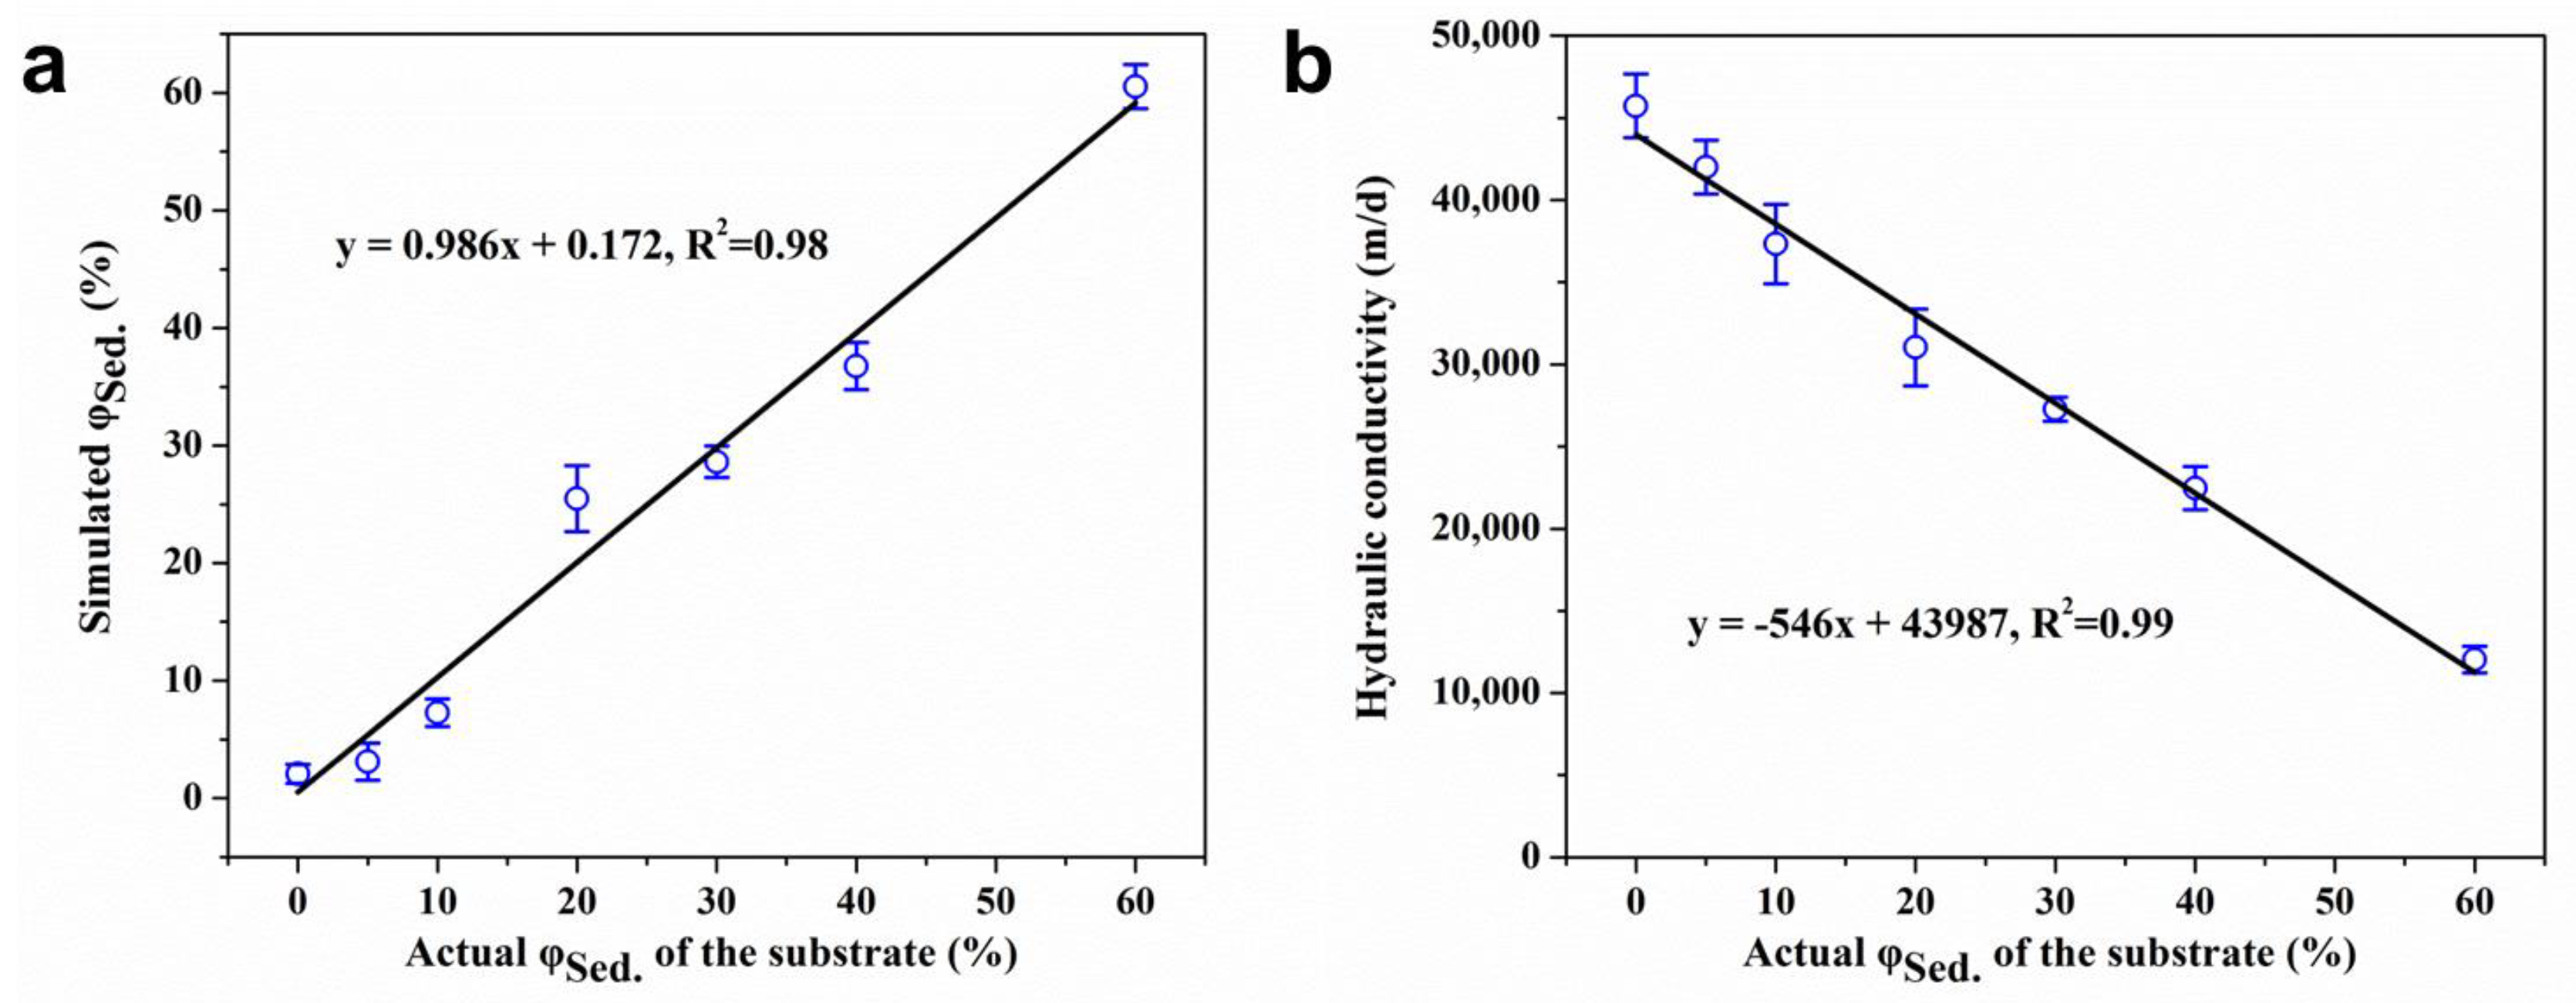
The degree of SSF CW clogging could be calculated by the apparent resistivity to sediment fraction (v/v) (ARSF) model, which contained only two variables (apparent resistivity and detection time). It should be noted that a lengthy draining phase could damage the vegetation in the wetlands. Thus, the detection process should be accomplished as soon as possible. Moreover, dry conditions are recommended to be staggered with hot weather to reduce heat stress and water loss by evapotranspiration. As shown in Figure 5a, the simulated sediment fractions (v/v) from the ARSF model were very close to the actual values on the whole (linear slope = 0.986; R-squared = 0.98). Note that the detected apparent resistivity of wetland substrate with a given sediment fraction (v/v) would vary with different electrode dispersal methods and substrate properties (size and type), and the coefficients of ARSF model should be corrected before application. In addition, regardless of the uncertain coefficients, information on clogging evolution could be received from long-term in situ monitoring of the resistivity changes in the wetland bed.
Solid accumulation in the wetland bed eventually led to changes in its hydraulic conductivity. It has been summarized by Nivala et al. [5] that hydraulic conductivity usually has an exponential relationship with the quantity of accumulated solid, and that hydraulic conductivity decreases with the accumulation of clogging matter. However, an uncertain relationship between hydraulic conductivity and accumulated clogging matter has also been reported in some studies [29]. The uncertainty was thought to be due to the form and water retention properties of the clogging matter. The hydraulic conductivities of substrates with different sediment fractions (v/v) were measured, and a significant linear correlation between the two parameters was observed (R-squared = 0.99). The retained water in the draining phase can be regarded as the stagnant water under normal operation. Therefore, in the draining phase, the reduction in hydraulic conductivity is more a reflection of water content, rather than the quantity of clogging matter. As the water content of the substrate can be obtained by detecting the apparent resistivity, the resistivity method is promising for the indirect detection of the hydraulic conductivity of clogged substrate.

3.4. In Situ Detection of Clogging in a Lab-Scale HSSF CW

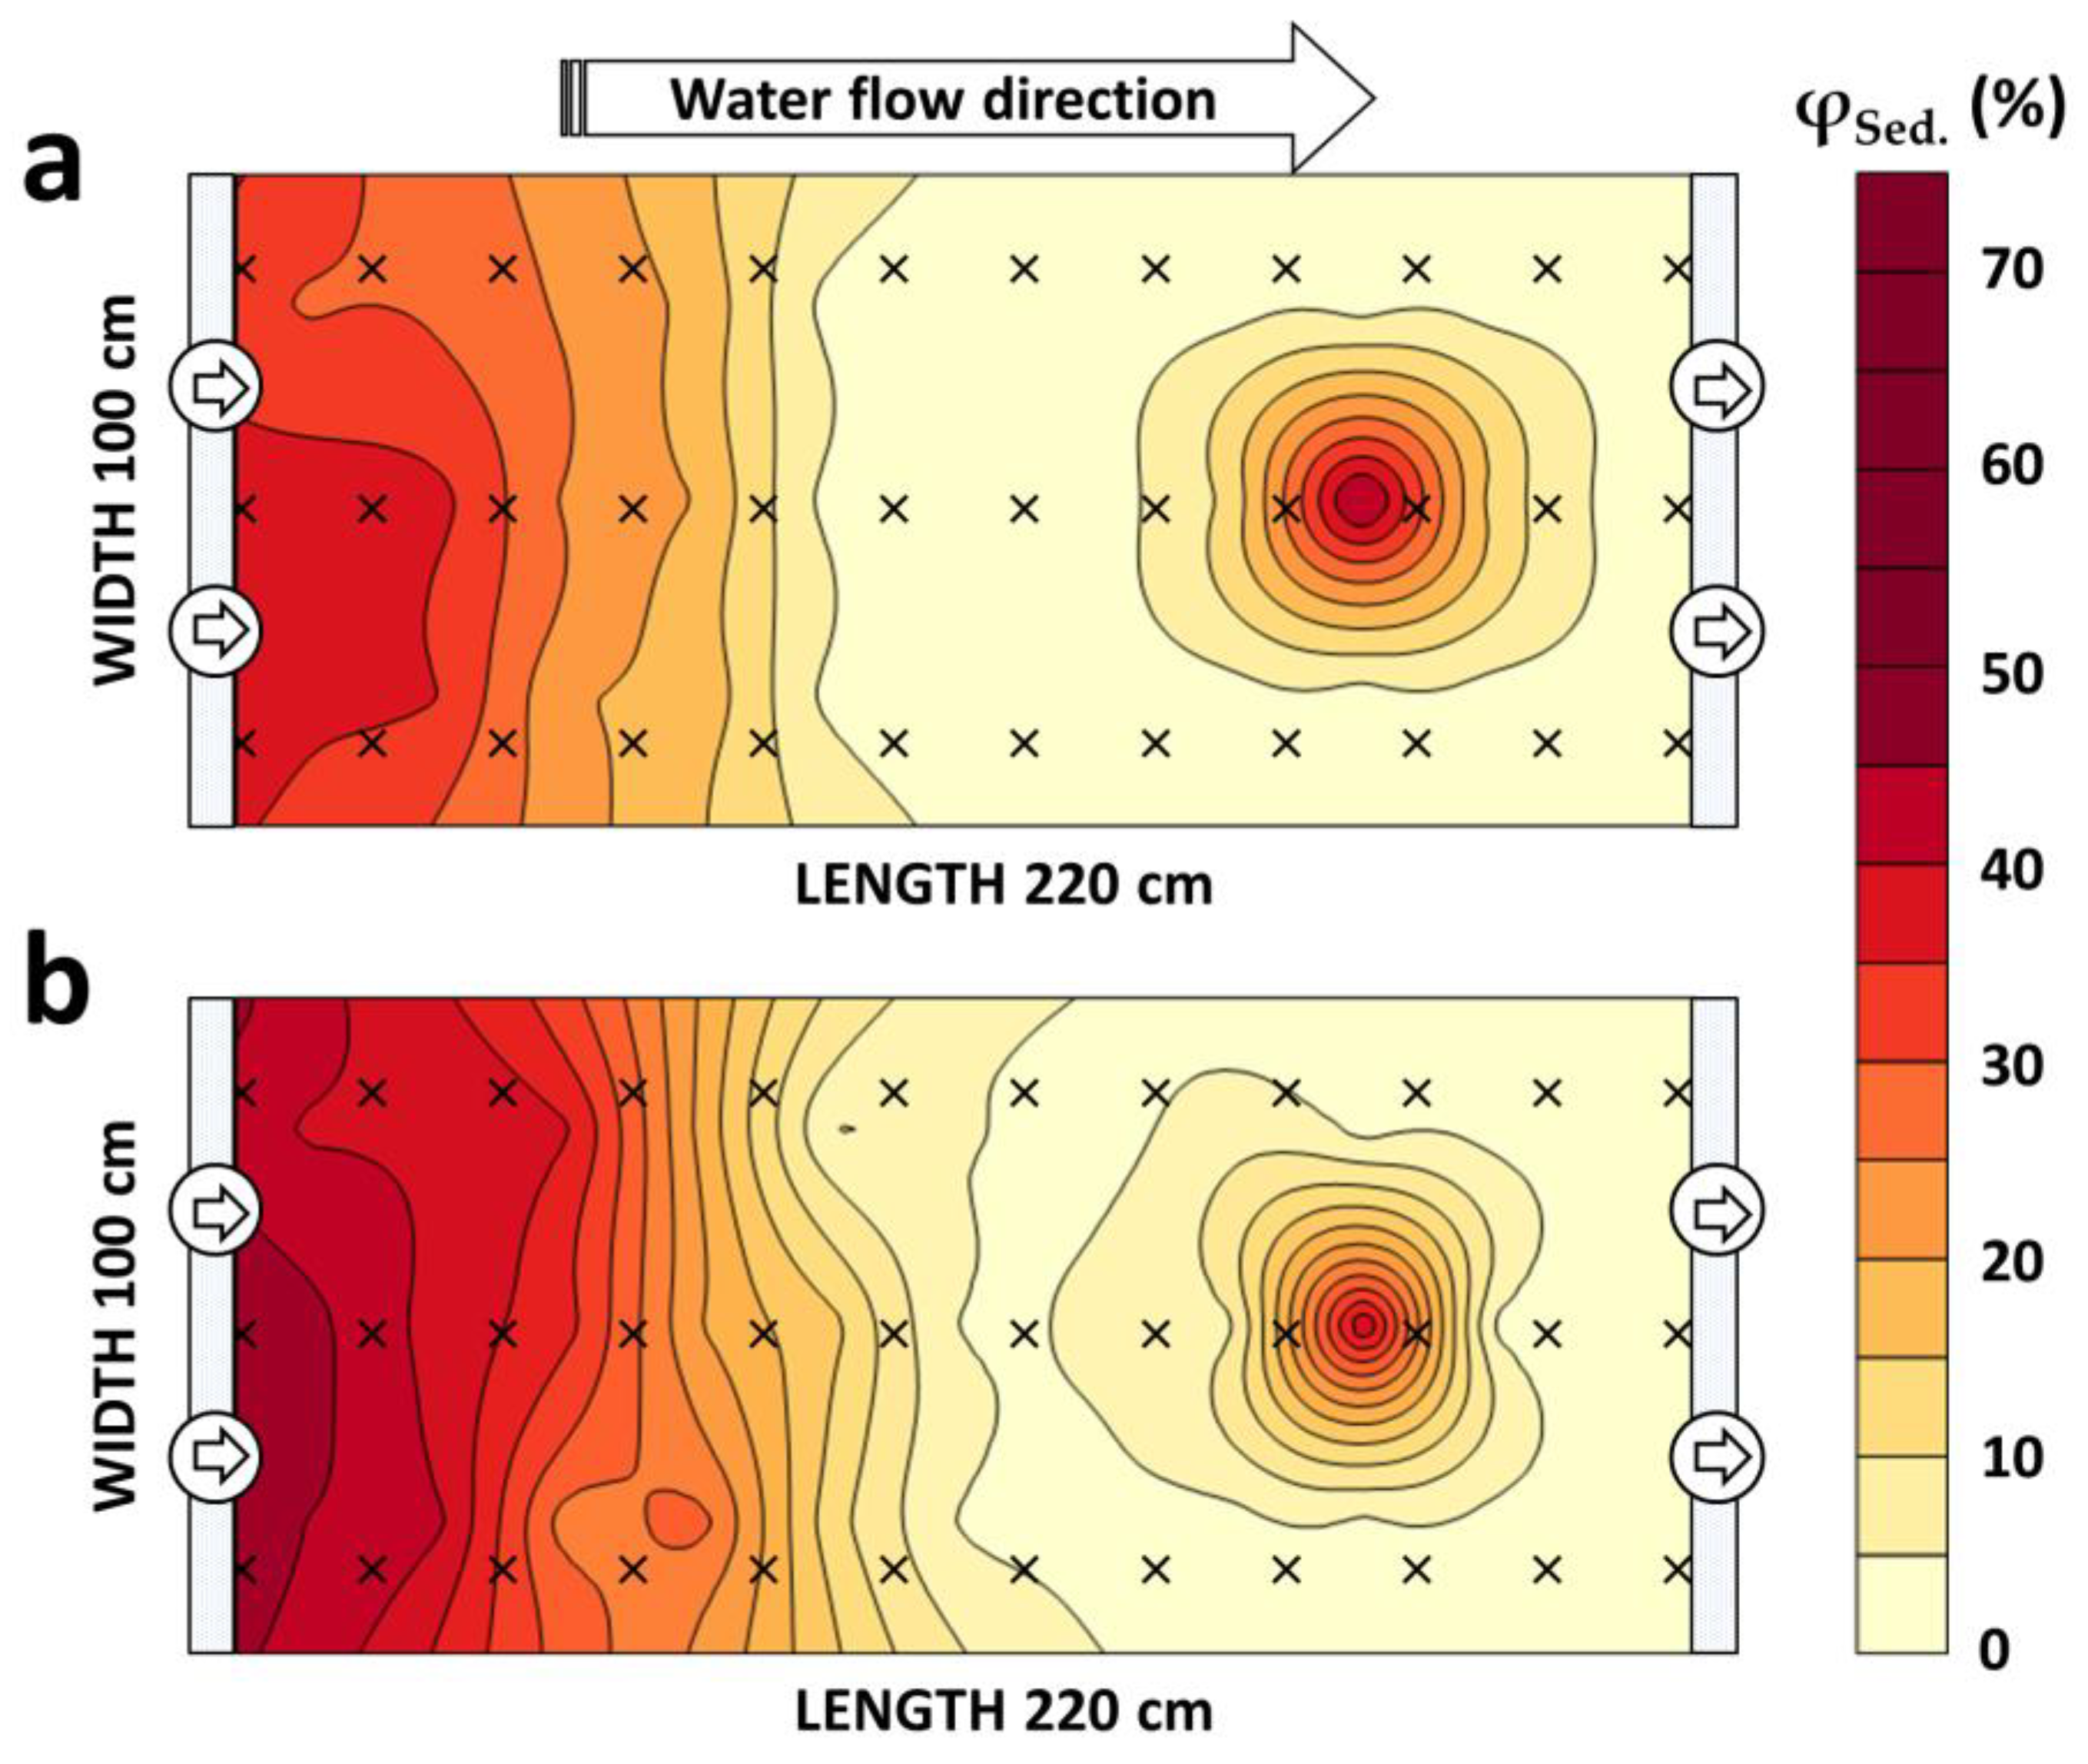
The in situ resistivity method for clogging quantification was tested in a lab-scale HSSF CW. Both the four-probe method and two-probe method were applied. Comparatively, the relative errors of the four-probe method and the two-probe method were 29.4% and 8.8%, respectively (Figure 6, Table S1). Nevertheless, the four-probe method is the most common method used in large-scale soil electivity surveys due to its high accuracy [20]. It should be noted that the apparent resistivity measurement by the four-probe method was based on the assumption that object medium was homogeneous [30]. However, in our study, the existence of uneven medium between the two potential electrodes limited the accuracy of the four-probe method. On the one hand, considering that the degree of clogging in full-scale SSF CWs usually changes gradually, the observed deviation in the detection results of the four-probe method could be avoided to a large extent. On the other hand, the two-probe method, which is simpler, can also meet the accuracy requirements of clogging quantification in small-scale HSSF CWs.
The contour map of the degree of clogging detected by the two-probe method is depicted in Figure 6a. Especially, the detected sediment fraction (v/v) of the unclogged area was 2% on average (not displayed). This phenomenon could be due to solid accumulation and microbial growth within the three months of operation. The uneven solid distribution in the inlet zone was detected by both the two-probe method and the four-probe method and was different from the preset distribution. This implied the existence of a preferential flow that increased the solid loading in the bottom section of the influent end of the wetland. A similar phenomenon was also observed by Knowles et al. [9]. Overall, when combined with the ARSF model, the two-probe method could not only identify the clogging locations in the inlet and internal zones but also quantify the degree of clogging with fairly good accuracy. Nevertheless, it will be essential to examine the in situ resistivity methods with full-scale experiments in future studies. It is worth noting that the degree of clogging is not always uniform across the depth of the substrate, and layered clogging can exist in different types of SSF CWs [9]. A three-dimensional resistivity method for clogging detection in SSF CWs should be developed.

4. Conclusions

Owing to differences in reserved water content, wetland substrates with heavier clogging showed lower apparent resistivities during the draining phase. The relationship between degree of clogging and apparent resistivity conformed to the ARSF model (Linear slope = 0.986; R-squared = 0.98), which contained only two variables—apparent resistivity and detection time. The resistivity method was also promising for the indirect detection of the hydraulic conductivity of clogged substrates (R-squared = 0.99). On the basis of the ARSF model, the two-probe method demonstrated high accuracy for in situ quantification of clogging in a HSSF CW (relative error less than 9%). The results indicate that the resistivity method is a promising technique for in situ detection of substrate clogging in full-scale SSF CWs.

Supplementary Materials

The following are available online at https://www.mdpi.com/2073-4441/10/10/1334/s1, Table S1: Specifics of lab scale HSSF CW and its detection results.

Author Contributions

The experimental work was conducted by J.Z., H.L., Z.H., S.S., L.N., and Z.L. The manuscript was written by H.L., Z.H., H.H., and F.L. Data analysis was performed by H.L., Z.H., J.Z., H.H., and F.L. All authors approved the final version of the article, including the authorship list.

Funding

This research was funded by the Fundamental Research Funds of Shandong University (No.2017JC025), the National Natural Science Foundation of China (No.51578321 & No.51878388), the Shandong Provincial Key Research and Development Plan (No. 2017GSF216011), and the China Postdoctoral Science Foundation (2016M600539 & 2017T100495).

Conflicts of Interest

The authors declare no conflict of interest.

References

  1. Zhang, X.; Hu, Z.; Ngo, H.H.; Zhang, J.; Guo, W.; Liang, S.; Xie, H. Simultaneous improvement of waste gas purification and nitrogen removal using a novel aerated vertical flow constructed wetland. Water Res. 2017, 130, 79–87. [Google Scholar] [CrossRef] [PubMed]
  2. Zhang, S.Y.; Williams, P.N.; Luo, J.; Zhu, Y.G. Microbial mediated arsenic biotransformation in wetlands. Front. Env. Sci. Eng. 2017, 11, 1–11. [Google Scholar] [CrossRef]
  3. Sun, H.; Hu, Z.; Zhang, J.; Wu, W.; Liang, S.; Lu, S.; Liu, H. Determination of hydraulic flow patterns in constructed wetlands using hydrogen and oxygen isotopes. J. Mol. Liq. 2016, 223, 775–780. [Google Scholar] [CrossRef]
  4. Knowles, P.; Dotro, G.; Nivala, J.; García, J. Clogging in subsurface-flow treatment wetlands: Occurrence and contributing factors. Ecol. Eng. 2011, 37, 99–112. [Google Scholar] [CrossRef]
  5. Nivala, J.; Knowles, P.; Dotro, G.; García, J.; Wallace, S. Clogging in subsurface-flow treatment wetlands: Measurement, modeling and management. Water Res. 2012, 46, 1625–1640. [Google Scholar] [CrossRef] [PubMed]
  6. Pedescoll, A.; Corzo, A.; Álvarez, E.; García, J.; Puigagut, J. The effect of primary treatment and flow regime on clogging development in horizontal subsurface flow constructed wetlands: An experimental evaluation. Water Res. 2011, 45, 3579–3589. [Google Scholar] [CrossRef] [PubMed]
  7. Pedescoll, A.; Uggetti, E.; Llorens, E.; Granés, F.; García, D.; García, J. Practical method based on saturated hydraulic conductivity used to assess clogging in subsurface flow constructed wetlands. Ecol. Eng. 2009, 35, 1216–1224. [Google Scholar] [CrossRef]
  8. Pedescoll, A.; Samsó, R.; Romero, E.; Puigagut, J.; García, J. Reliability, repeatability and accuracy of the falling head method for hydraulic conductivity measurements under laboratory conditions. Ecol. Eng. 2011, 37, 754–757. [Google Scholar] [CrossRef]
  9. Knowles, P.; Griffin, P.; Davies, P.A. Complementary methods to investigate the development of clogging within a horizontal sub-surface flow tertiary treatment wetland. Water Res. 2010, 44, 320–330. [Google Scholar] [CrossRef] [PubMed]
  10. Cooper, D.; Griffin, P.; Cooper, P. Factors affecting the longevity of subsurface horizontal flow systems operating as tertiary treatment for sewage effluent. Water Sci. Technol. 2005, 51, 127–135. [Google Scholar] [CrossRef] [PubMed]
  11. Shamim, M.; Bencsik, M.; Morris, R.; Newton, M. MRI measurements of dynamic clogging in porous systems using sterilised sludge. Microporous Mesoporous Mater. 2013, 178, 48–52. [Google Scholar] [CrossRef]
  12. Corbella, C.; García, J.; Puigagut, J. Microbial fuel cells for clogging assessment in constructed wetlands. Sci. Total Environ. 2016, 569, 1060–1063. [Google Scholar] [CrossRef] [PubMed]
  13. Samouëlian, A.; Cousin, I.; Tabbagh, A.; Bruand, A.; Richard, G. Electrical resistivity survey in soil science: A review. Soil Tillage Res. 2005, 83, 173–193. [Google Scholar] [CrossRef] [Green Version]
  14. Chrétien, M.; Lataste, J.; Fabre, R.; Denis, A. Electrical resistivity tomography to understand clay behavior during seasonal water content variations. Eng. Geol. 2014, 169, 112–123. [Google Scholar] [CrossRef]
  15. Siriwardene, N.; Deletic, A.; Fletcher, T. Clogging of stormwater gravel infiltration systems and filters: Insights from a laboratory study. Water Res. 2007, 41, 1433–1440. [Google Scholar] [CrossRef] [PubMed]
  16. Perrone, A.; Lapenna, V.; Piscitelli, S. Electrical resistivity tomography technique for landslide investigation: A review. Earth-Sci. Rev. 2014, 135, 65–82. [Google Scholar] [CrossRef]
  17. Scudiero, E.; Skaggs, T.H.; Corwin, D.L. Comparative regional-scale soil salinity assessment with near-ground apparent electrical conductivity and remote sensing canopy reflectance. Ecol. Indic. 2016, 70, 276–284. [Google Scholar] [CrossRef] [Green Version]
  18. Kalinski, R.J.; Kelly, W.E. Estimating water content of soils from electrical resistivity. Geotech. Test. J. 1993, 16, 323–329. [Google Scholar] [CrossRef]
  19. Angst, U.M.; Elsener, B. On the Applicability of the Wenner Method for Resistivity Measurements of Concrete. ACI Mater. J. 2014, 111, 661–672. [Google Scholar] [CrossRef]
  20. Faleiro, E.; Asensio, G.; Moreno, J. Improved measurements of the apparent resistivity for small depths in Vertical Electrical Soundings. J. Appl. Geophys. 2016, 131, 117–122. [Google Scholar] [CrossRef]
  21. Wang, L.; Zheng, Z.; Luo, X.; Zhang, J. Performance and mechanisms of a microbial-earthworm ecofilter for removing organic matter and nitrogen from synthetic domestic wastewater. J. Hazard. Mater. 2011, 195, 245–253. [Google Scholar] [CrossRef] [PubMed]
  22. Hua, G.; Zeng, Y.; Zhao, Z.; Cheng, K.; Chen, G. Applying a resting operation to alleviate bioclogging in vertical flow constructed wetlands: An experimental lab evaluation. J. Environ. Manag. 2014, 136, 47–53. [Google Scholar] [CrossRef] [PubMed]
  23. García-Bernet, D.; Buffière, P.; Latrille, E.; Steyer, J.P.; Escudié, R. Water distribution in biowastes and digestates of dry anaerobic digestion technology. Chem. Eng. J. 2011, 172, 924–928. [Google Scholar] [CrossRef]
  24. Noborio, K. Measurement of soil water content and electrical conductivity by time domain reflectometry: A review. Comput. Electron. Agric. 2001, 31, 213–237. [Google Scholar] [CrossRef]
  25. Basso, A.S.; Miguez, F.E.; Laird, D.A.; Horton, R.; Westgate, M. Assessing potential of biochar for increasing water-holding capacity of sandy soils. GCB Bioenergy 2013, 5, 132–143. [Google Scholar] [CrossRef]
  26. Mungray, A.K.; Kumar, P. Degradation of anionic surfactants during drying of UASBR sludges on sand drying beds. J. Environ. Manage. 2008, 88, 995–1002. [Google Scholar] [CrossRef] [PubMed]
  27. Zentar, R.; Miraoui, M.; Abriak, N.E.; Benzerzour, M. Natural dewatering of marine dredged sediments. Dry. Technol. 2011, 29, 1705–1713. [Google Scholar] [CrossRef]
  28. Ozcep, F.; Yıldırım, E.; Tezel, O.; Asci, M.; Karabulut, S. Correlation between electrical resistivity and soil-water content based artificial intelligent techniques. Int. J. Phys. Sci. 2010, 5, 47–56. [Google Scholar] [CrossRef]
  29. Caselles-Osorio, A.; Puigagut, J.; Segú, E.; Vaello, N.; Granés, F.; García, D.; García, J. Solids accumulation in six full-scale subsurface flow constructed wetlands. Water Res. 2007, 41, 1388–1398. [Google Scholar] [CrossRef] [PubMed]
  30. Minagawa, H.; Miyamoto, S.; Hisada, M. Relationship of Apparent Electrical Resistivity Measured by Four-Probe Method with Water Content Distribution in Concrete. J. Adv. Concr. Technol. 2017, 15, 278–289. [Google Scholar] [CrossRef]
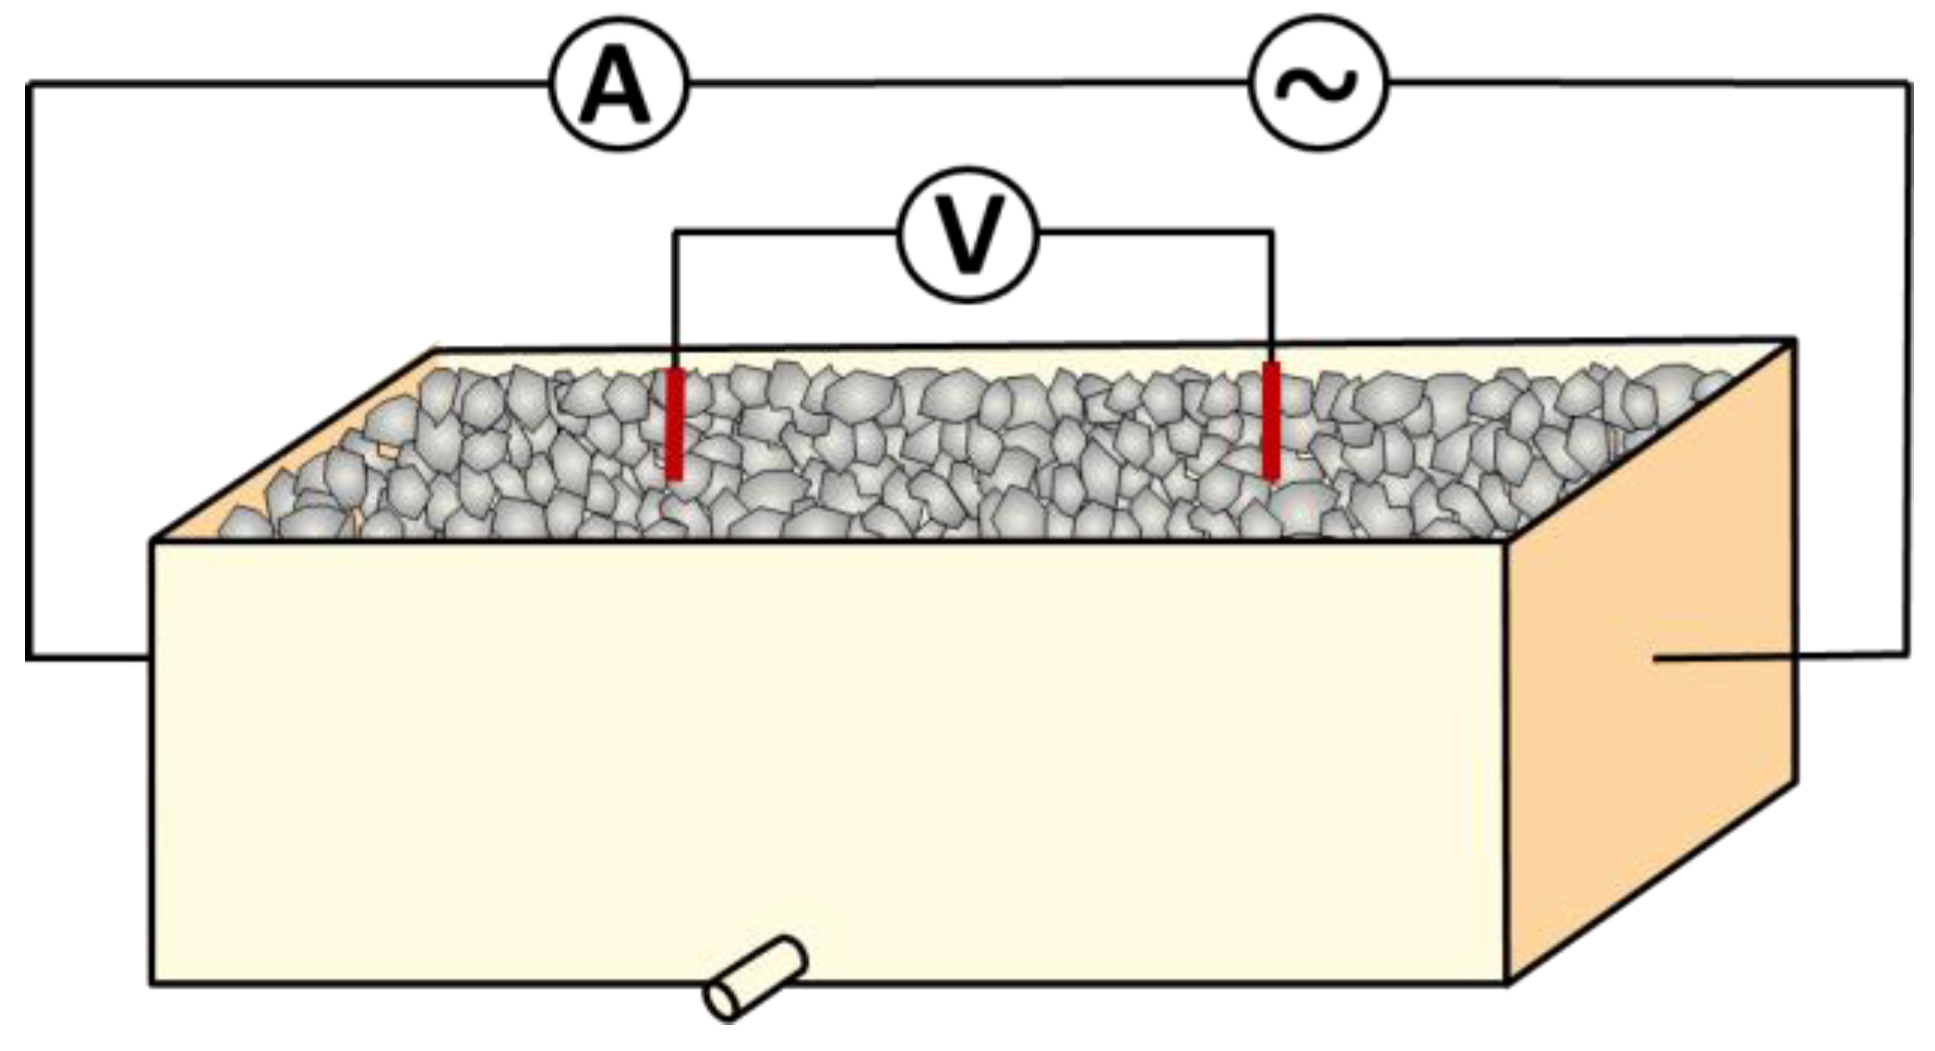
Figure 1. Schematic diagram of the Miller Soil Box. A represents the ammeter; V represents the voltmeter; ~ represents the power; the red bars represent the electrodes; the grey shapes inside the box represent the substrate.
Water 10 01334 g001
Figure 2. Schematic diagram of lab scale horizontal subsurface flow constructed wetland (HSSF CW) (plan view; different colors represent various sediment fractions (v/v); the crosses represent the positions of stainless-steel bar electrodes; the arrows represent the flow direction).
Water 10 01334 g002
Figure 3. Change of apparent resistivity with sediment fraction (v/v) (from 0% to 60%) and draining time (from 0 min to 550 min).
Water 10 01334 g003
Figure 4. Relationship between the electrical conductivity and water content of wetland substrates with different sediment fractions (v/v) (from 0% to 60%).
Water 10 01334 g004
Figure 5. Linear regression of (a) simulated sediment fraction (v/v) against actual sediment fraction (v/v) and (b) hydraulic conductivity against actual sediment fraction (v/v).
Water 10 01334 g005
Figure 6. Clogging contours in the HSSF CW based on (a) the two-probe method and (b) the four-probe method (plan view; different colors represent various sediment fractions (v/v); the crosses represent the positions of stainless steel bar electrodes; the arrows represent the flow direction).ϕ
Water 10 01334 g006
Table 1. Physical and chemical characteristics of the synthetic domestic wastewater.
IndexCOD 1 (mg/L)BOD5 2 (mg/L)TSS 3 (mg/L)Temperature (°C)pHConductivity (μS/cm)
Values253.8 ± 16.5198.3 ± 13.069.0 ± 6.224.0 ± 2.77.5 ± 0.21752 ± 26.1
1 COD is chemical oxygen demand; 2 BOD is biochemical oxygen demand; 3 TSS is total suspended solids.
Table 2. Apparent resistivities of wetland mediums.
IndexGravelSedimentMixture 1
Filling phase (Ω·m)29.8 ± 5.066.6 ± 5.234.4 ± 2.1
Draining phase (Ω·m)3174.8 ± 73.487.4 ± 7.6132.1 ± 10.6
1 Mixture of gravel and sediment with a sediment fraction (v/v) of 40%.