Season-Dependent Hedging Policies for Reservoir Operation—A Comparison Study


Abstract
:
1. Introduction
2. Methodology and Case Study
2.1. Parametrization-Simulation-Optimization (PSO) Framework
2.1.1. Objective Functions
- (i)
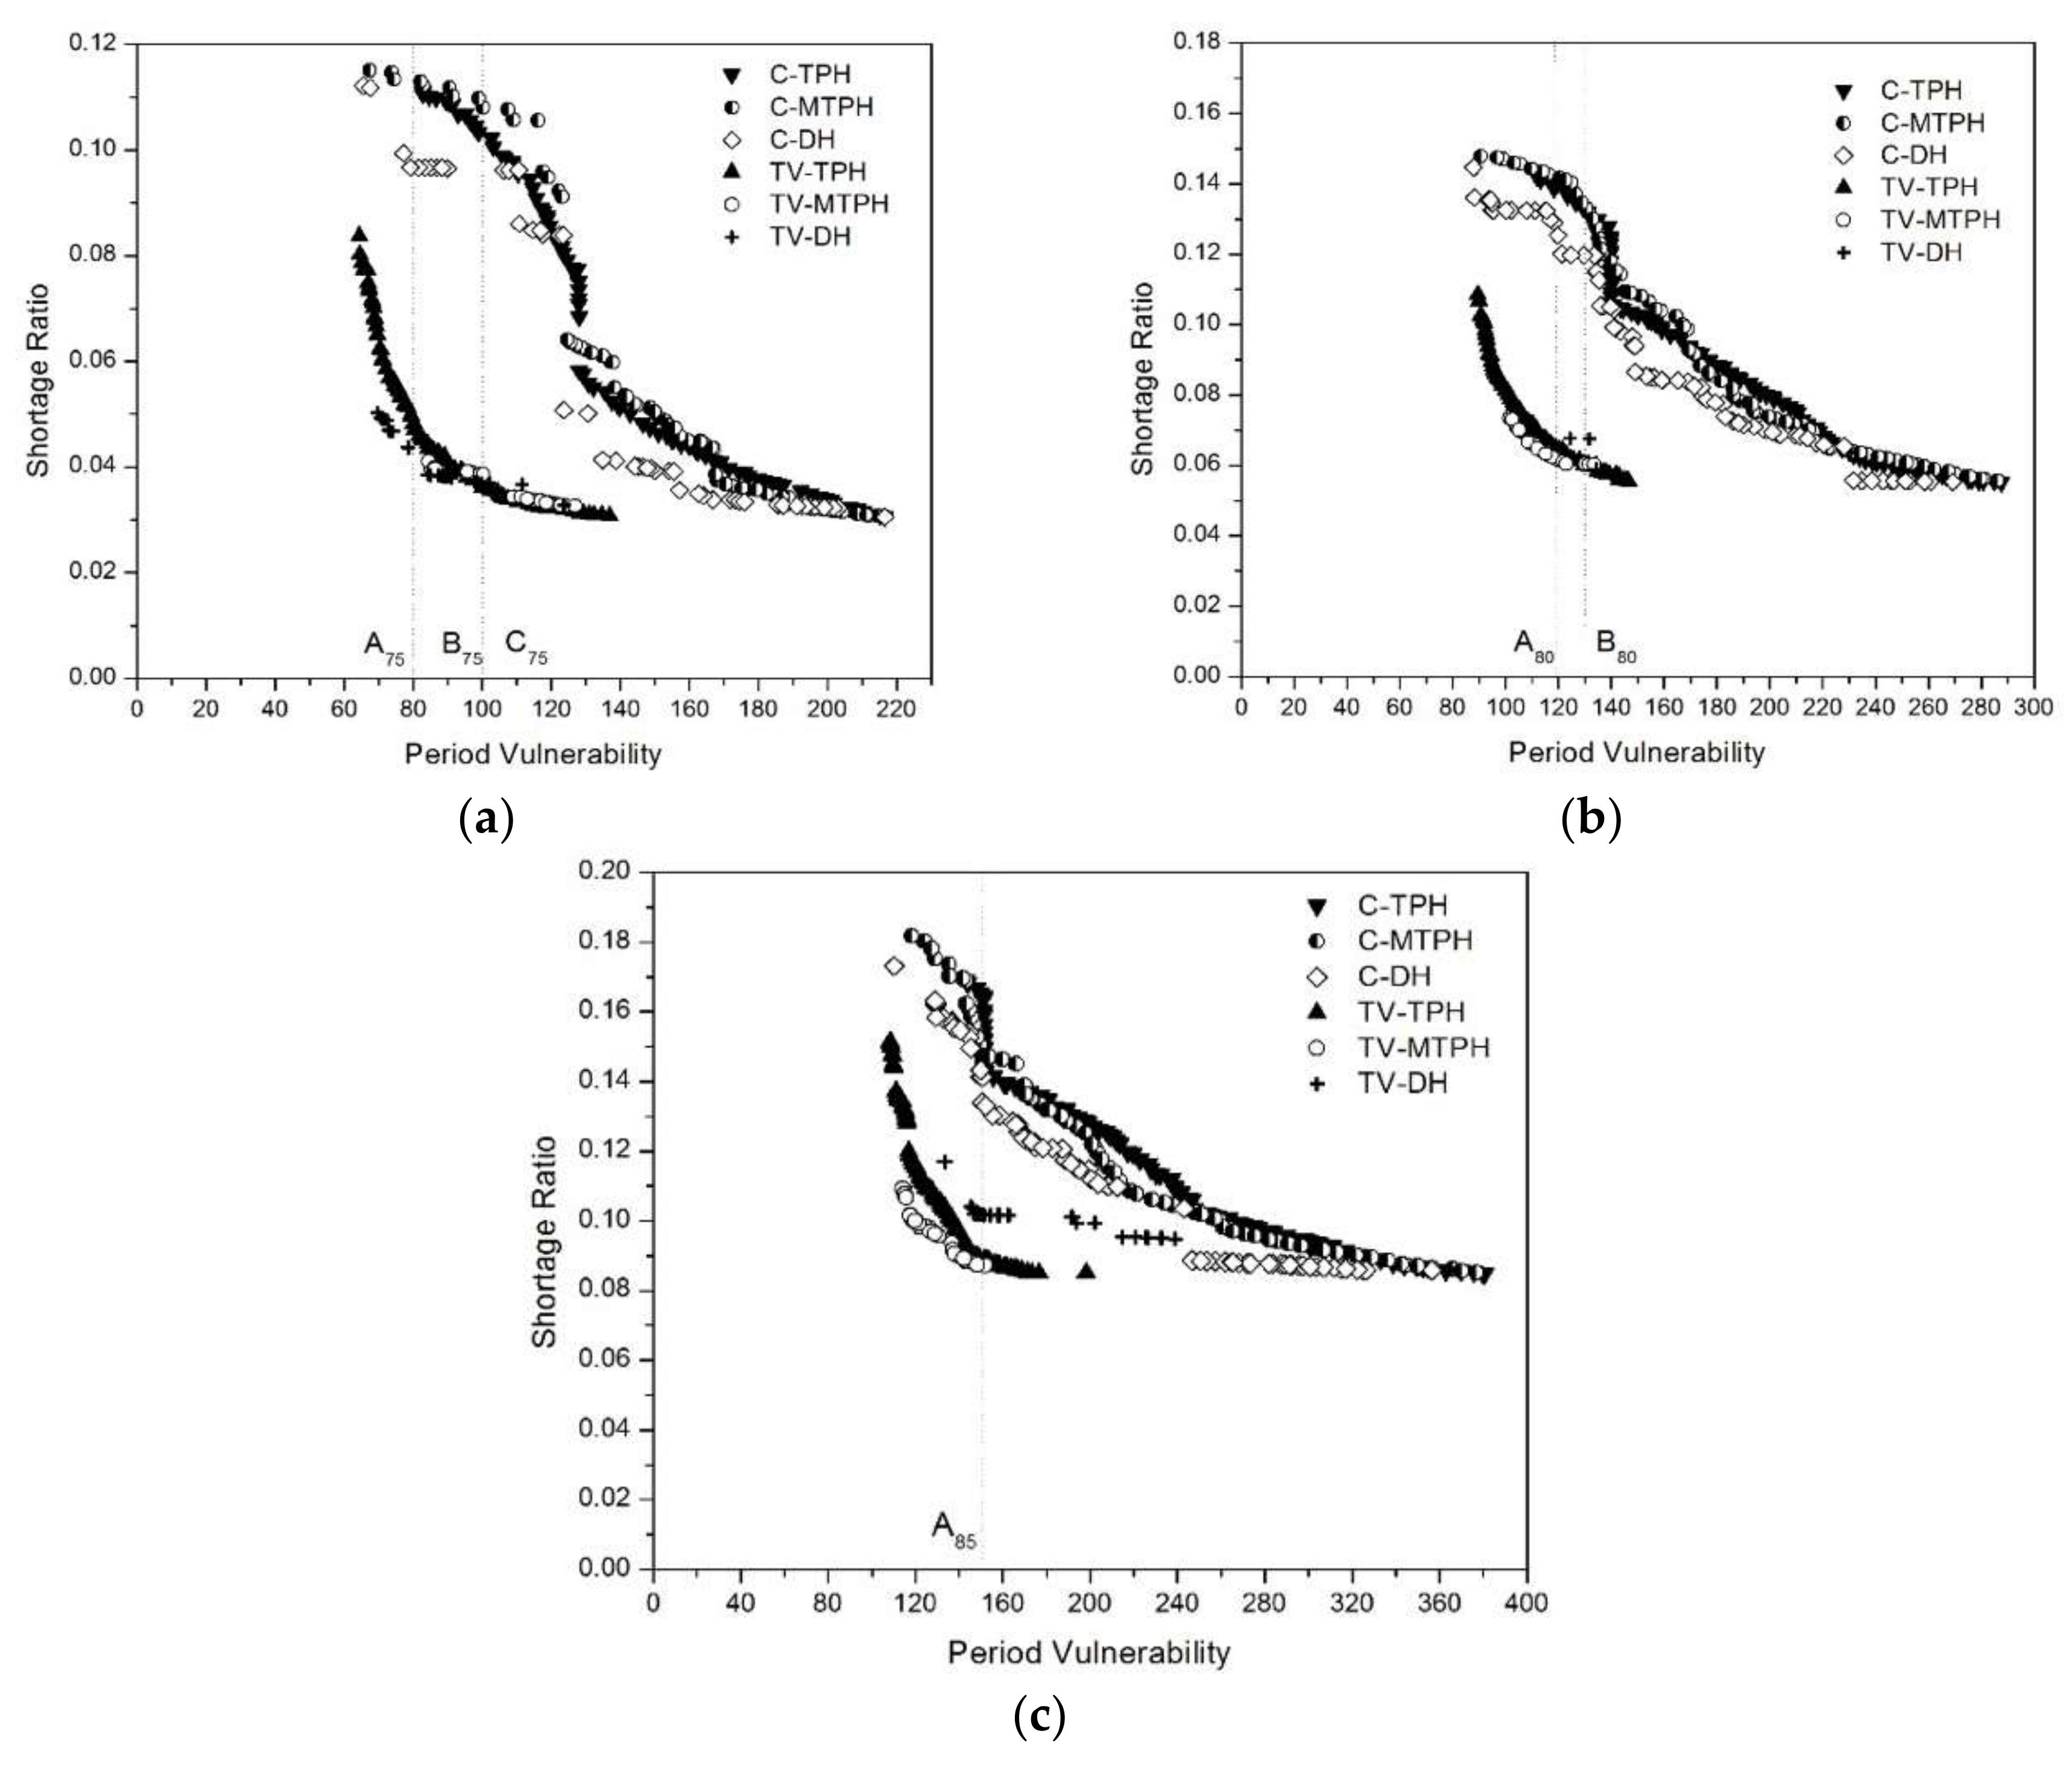
- Minimize the Period VulnerabilityZ1 = Minimize {Vp}
- (ii)
- Minimize Shortage RatioZ2 = Minimize {SR}
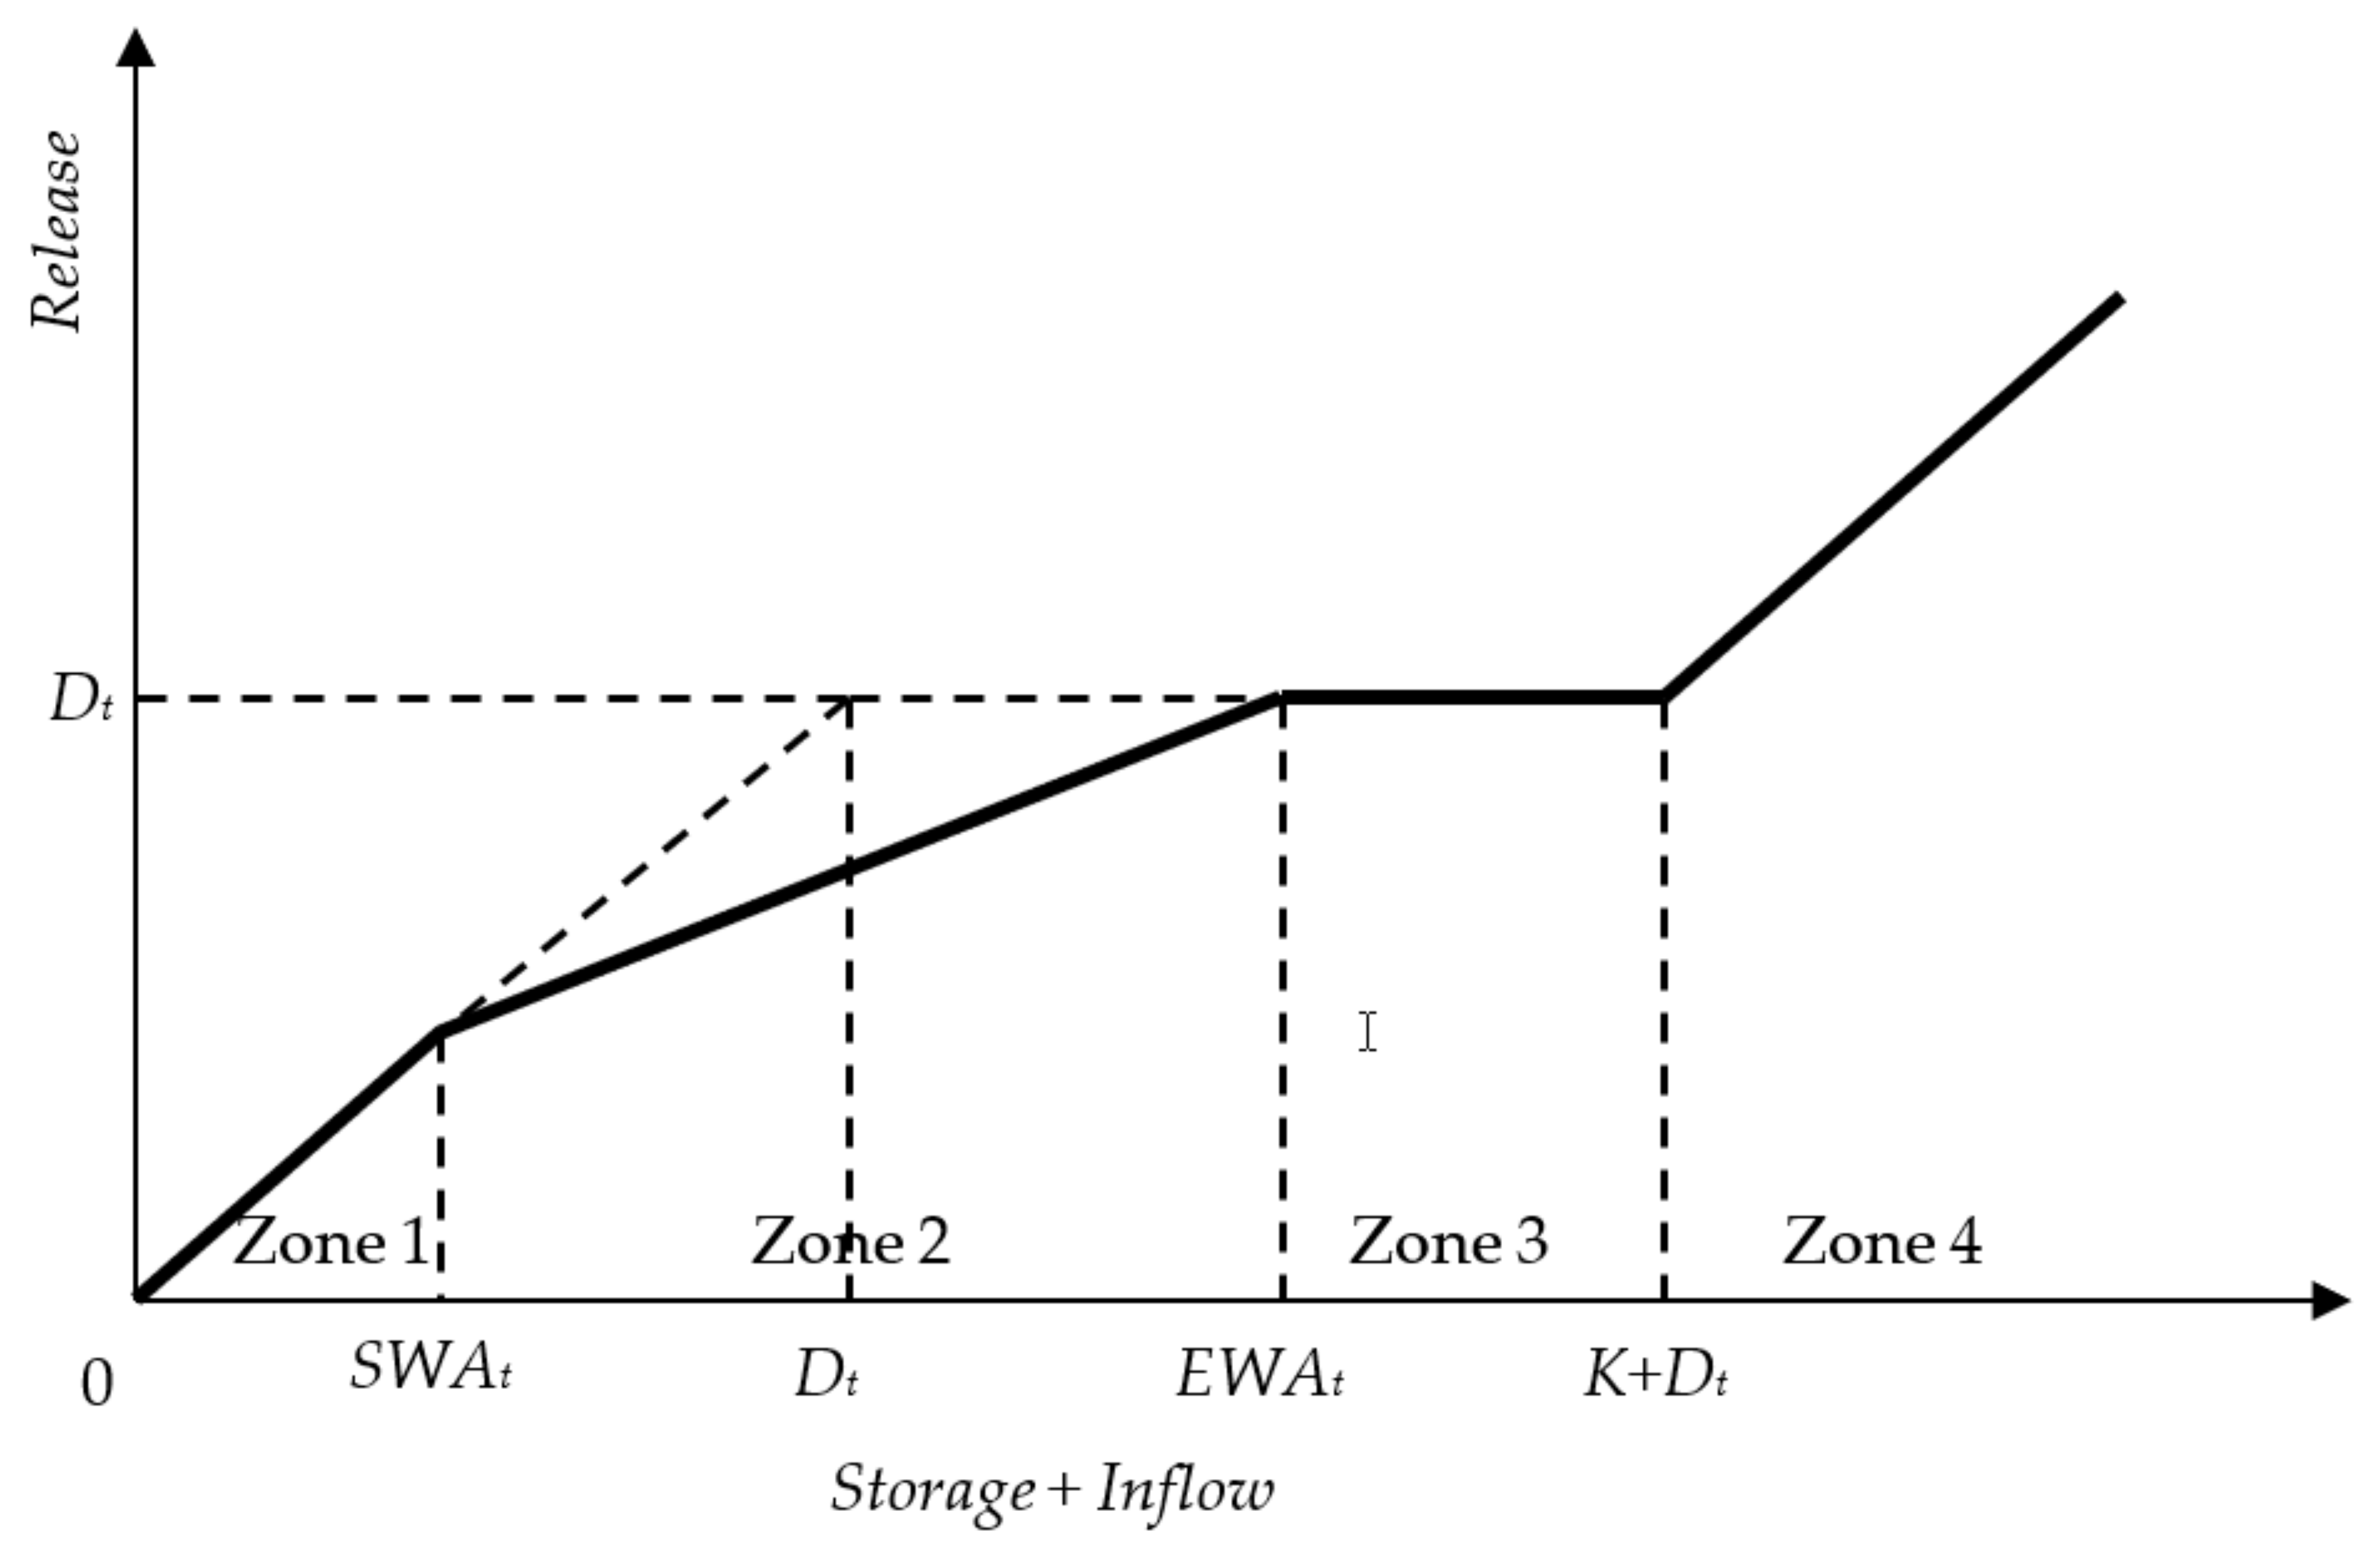
2.1.2. Two-Point Linear Hedging Rule
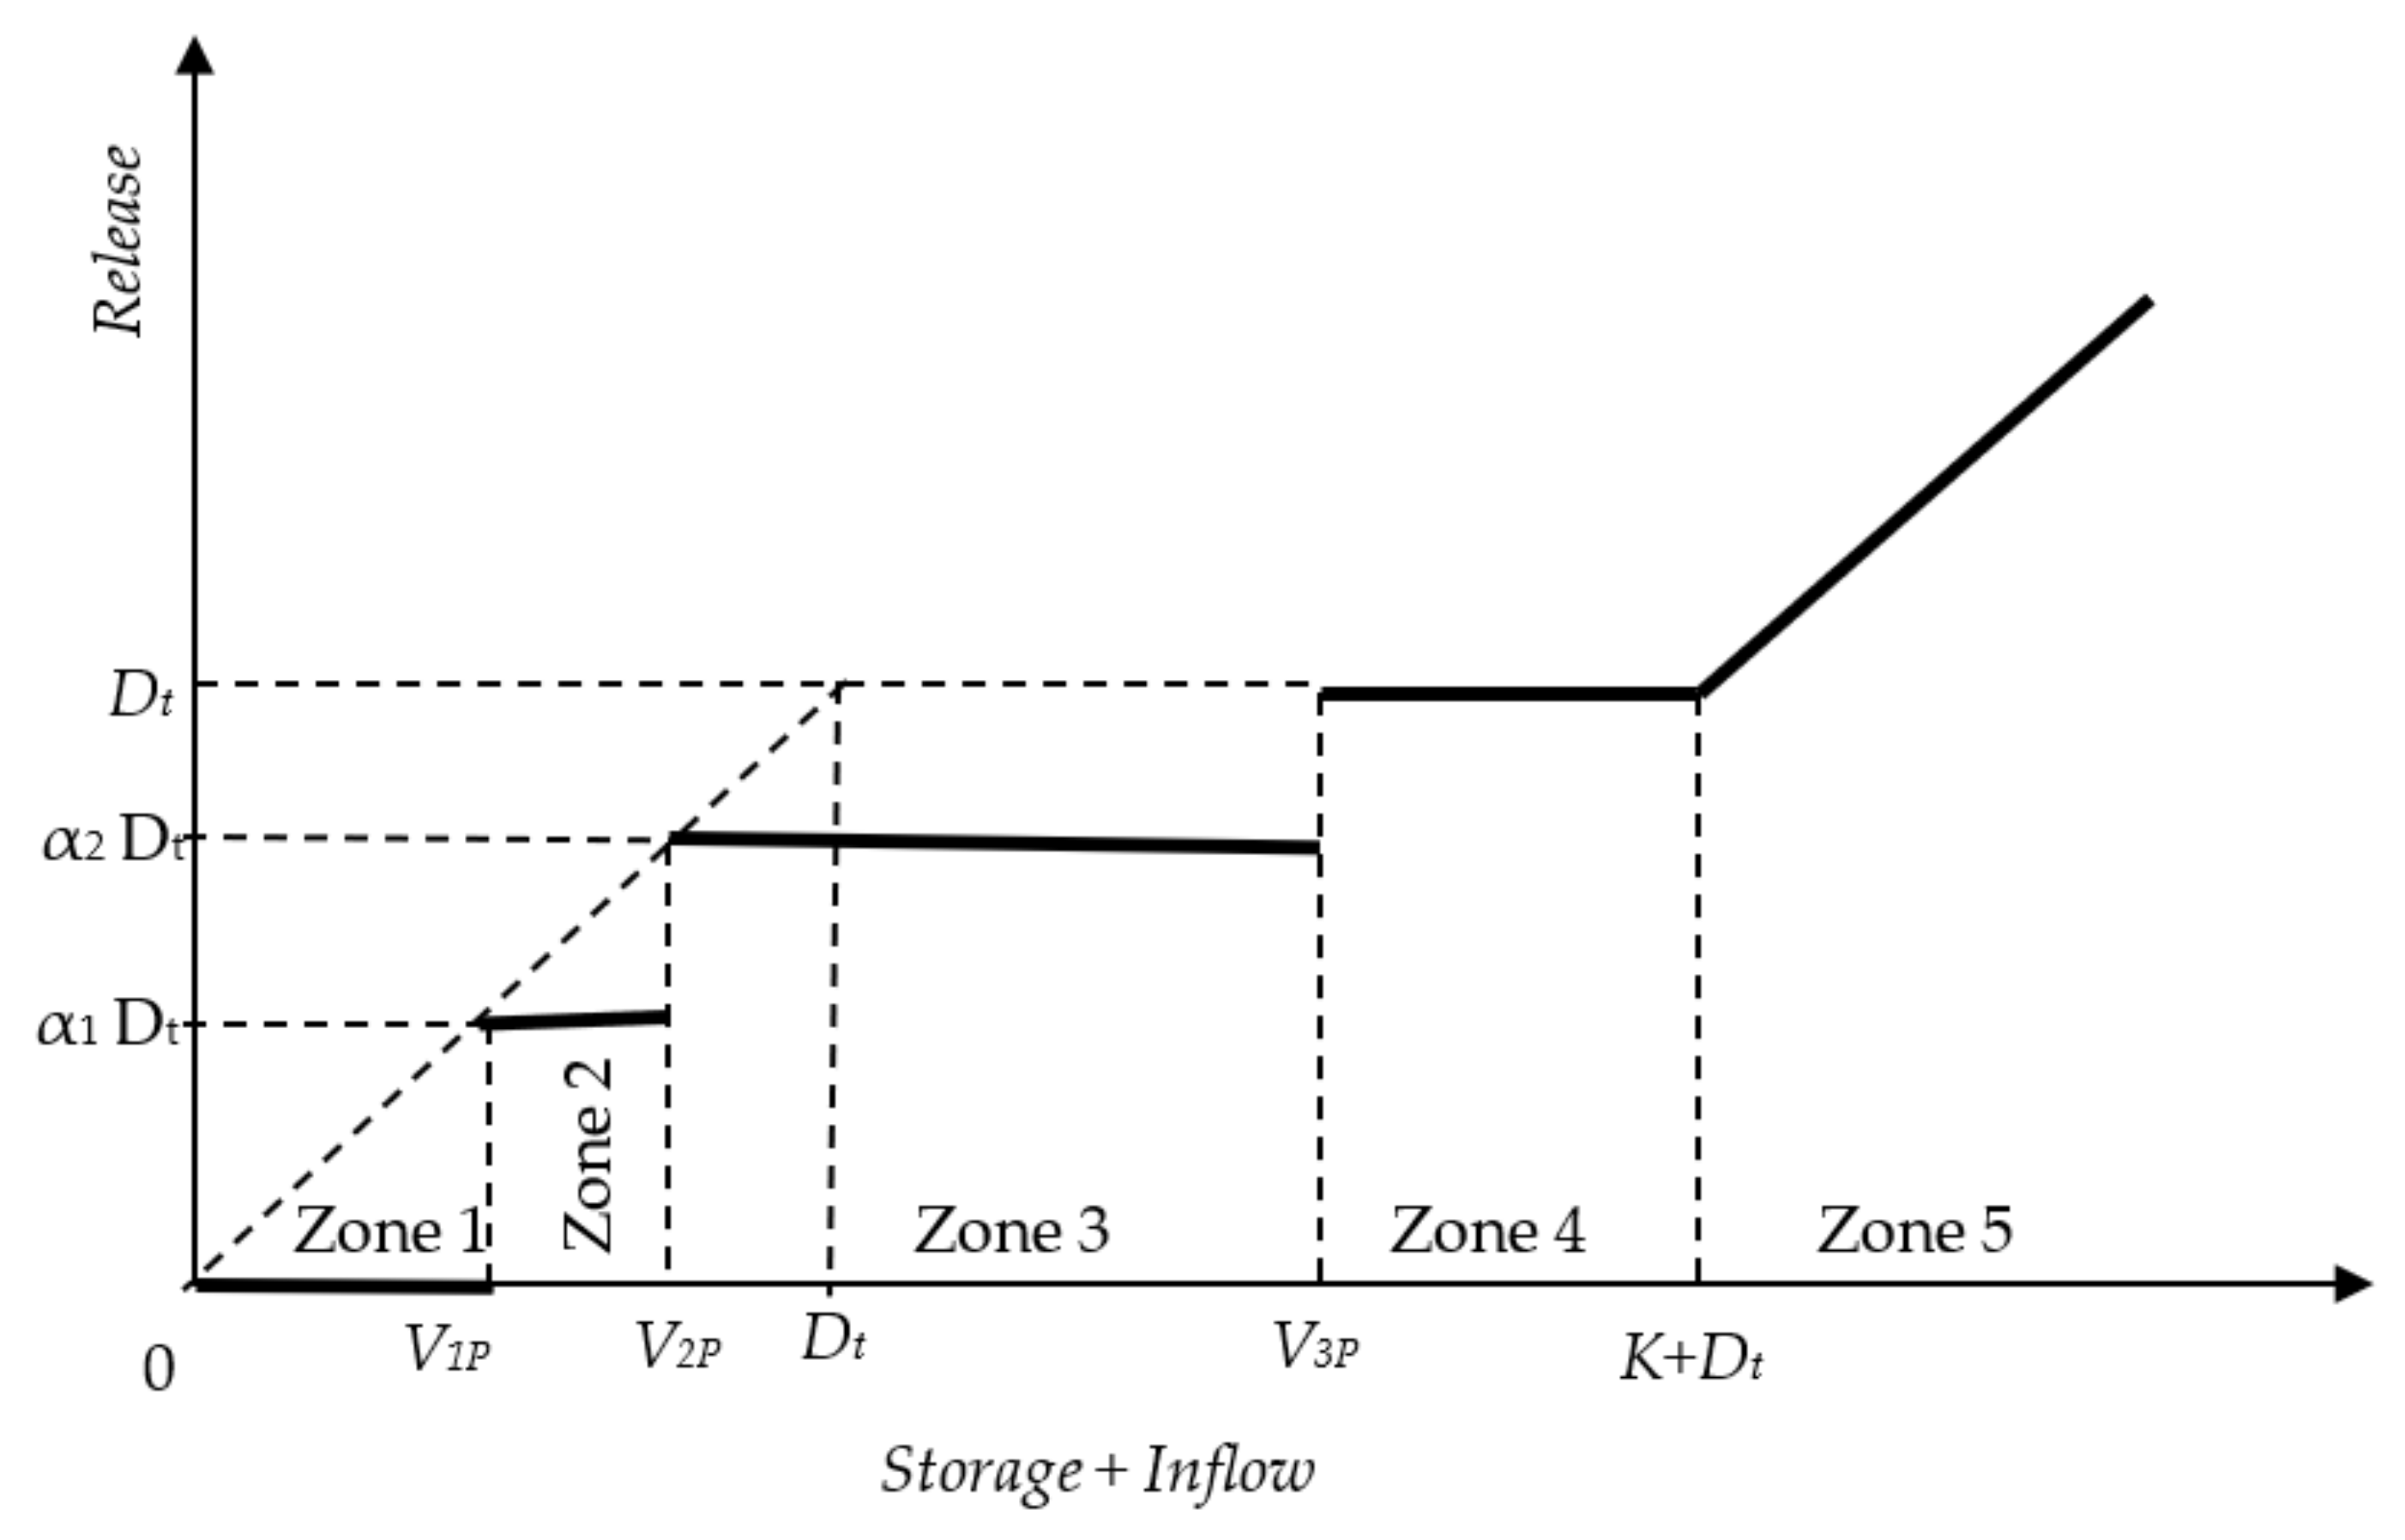
2.1.3. Discrete Hedging Rule
2.2. Performance Evaluation
- (i)
- Occurrence-based reliability, the ratio of the number of times the demand is satisfied to the number of times the reservoir is operated [7].
- (ii)
- Resilience, the ratio of the number of times the system moved from failure to success to the total number of periods the system was in a failure state [7].
- (iii)
- Mean event deficit, the ratio of the total deficit volume encountered during the operation horizon to the total number of failure events. Herein, ‘event’ denotes a sequence of failure periods. The high magnitude of event deficit encountered during an irrigation season is detrimental to crop yield.
- (iv)
- Event vulnerability is the maximum event deficit that is encountered during the operation horizon of the reservoir.
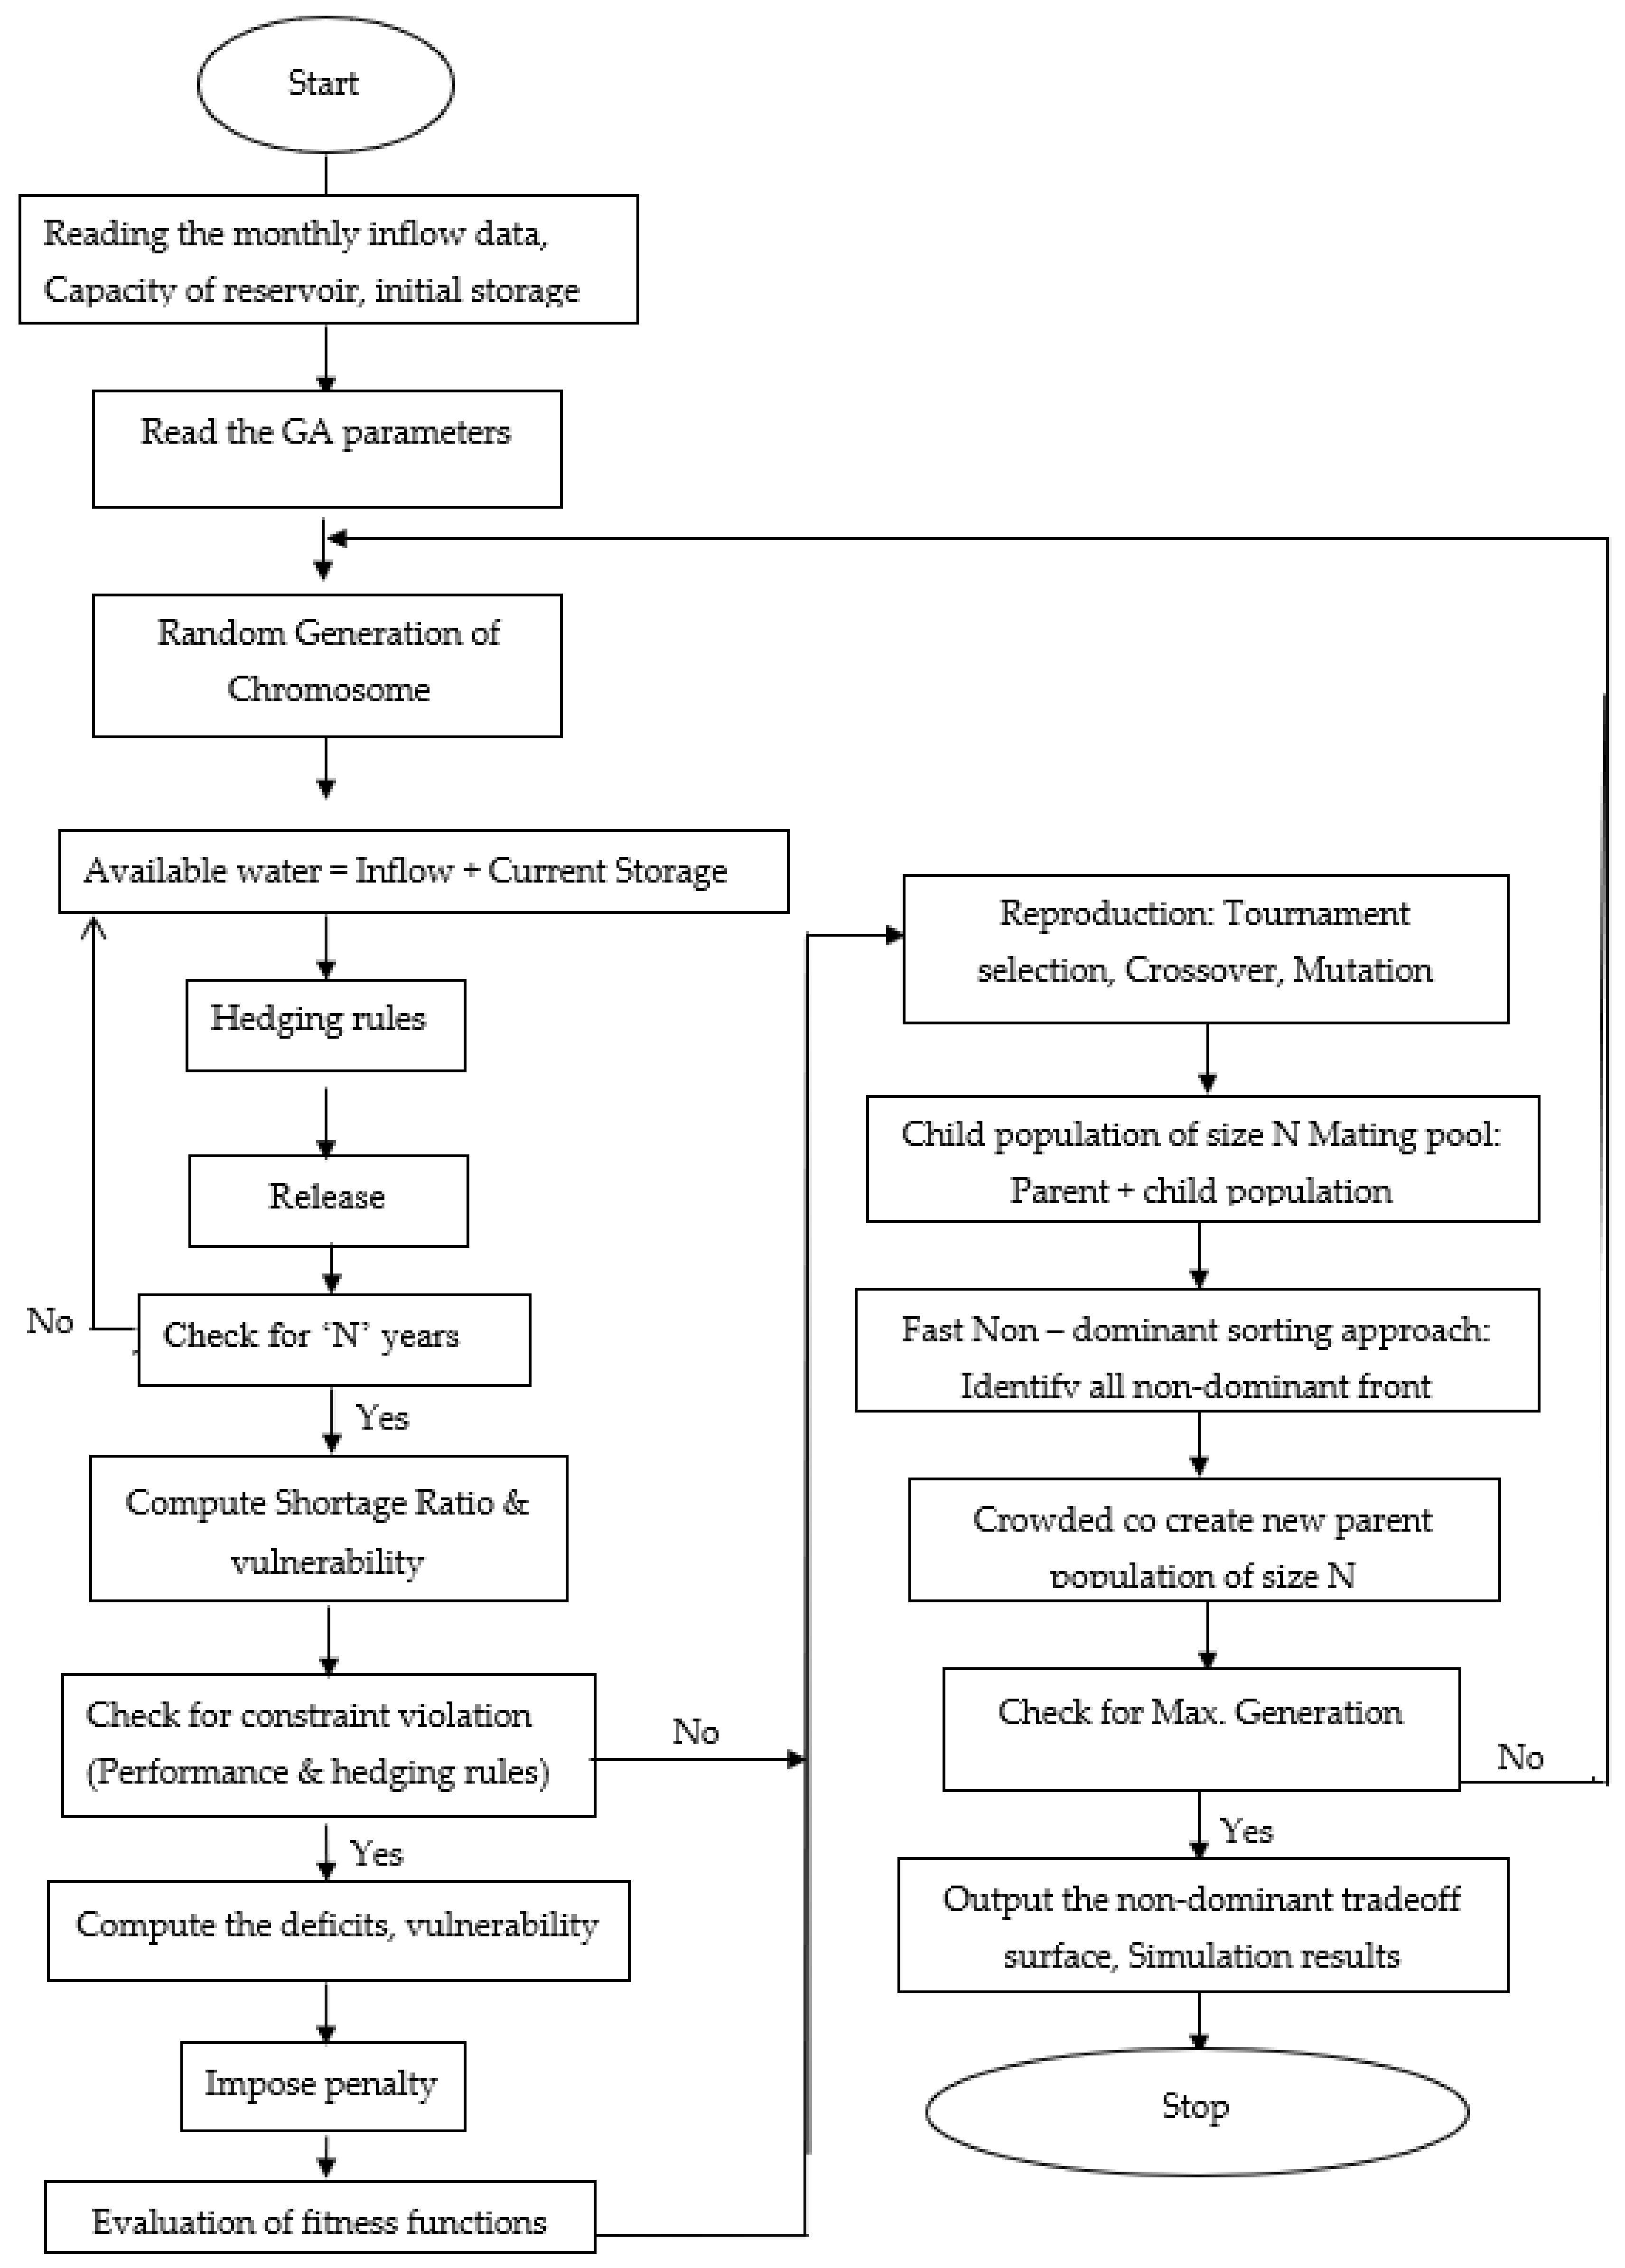
2.3. Solution Technique
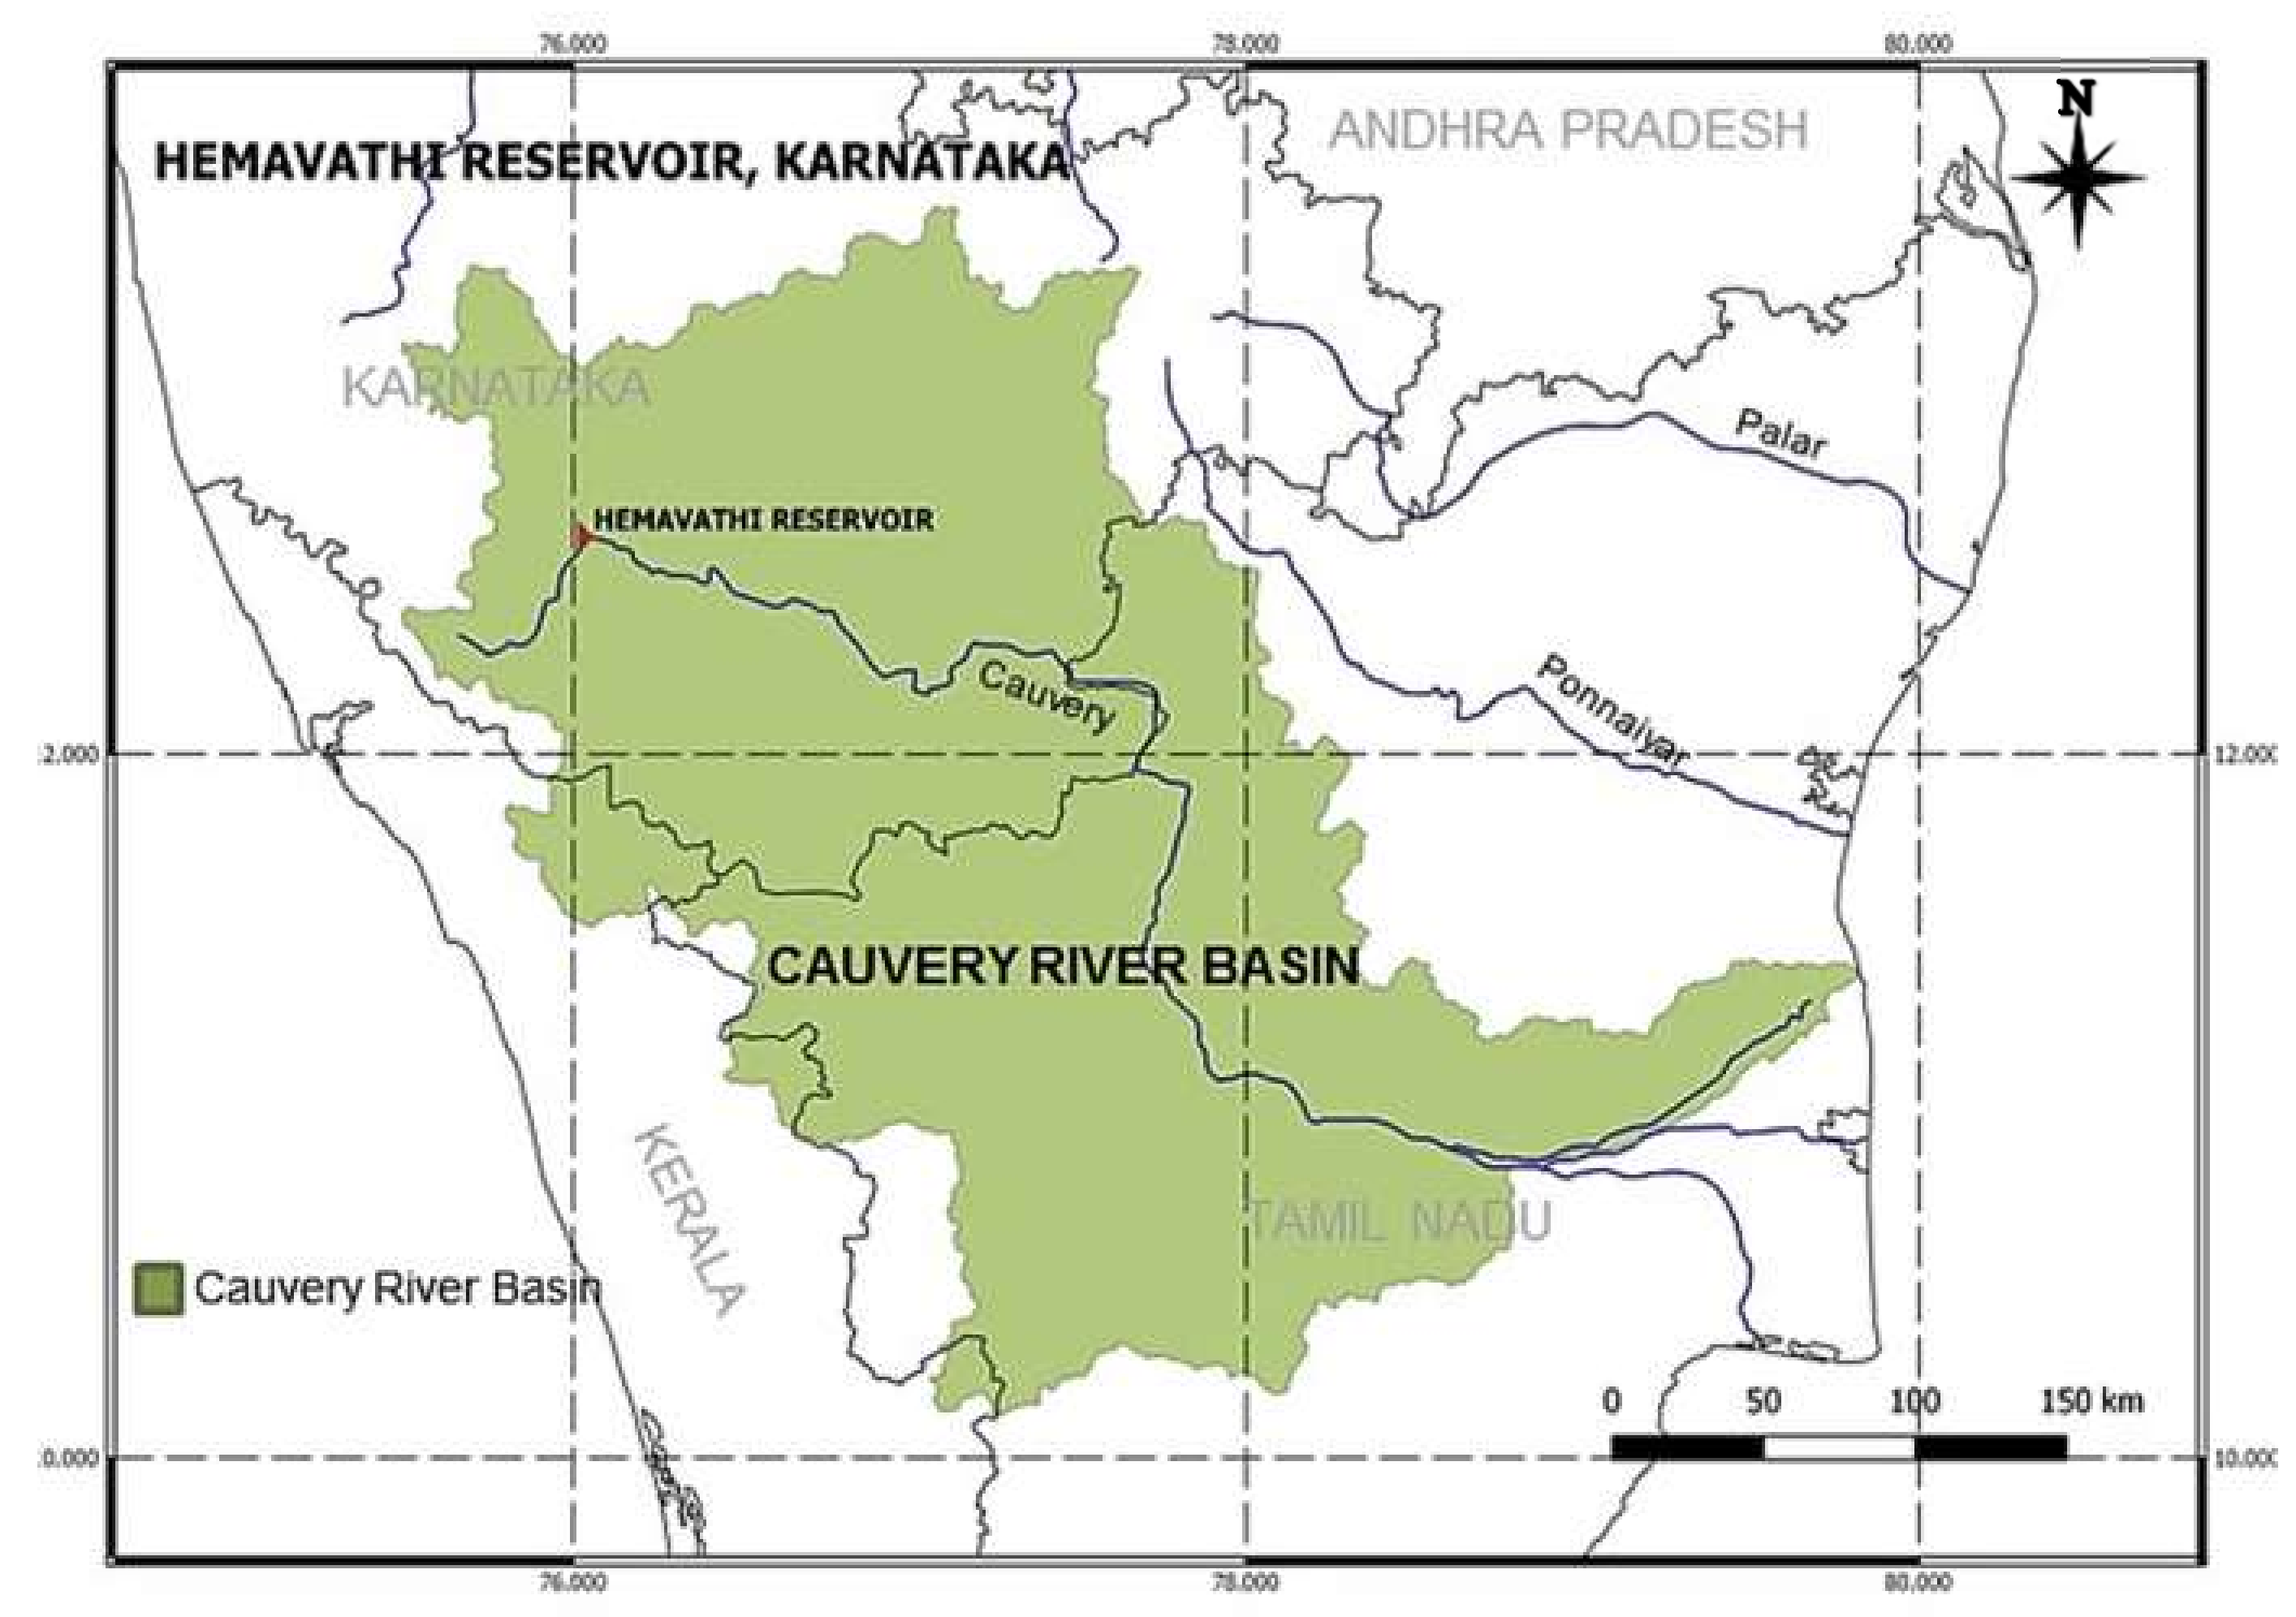
2.4. Case Study—Hemavathy Reservoir
3. Results and Discussion
3.1. Selection of GA Parameters
3.2. Comparison of Time-Varying and Constant Hedging Policies
- (i)
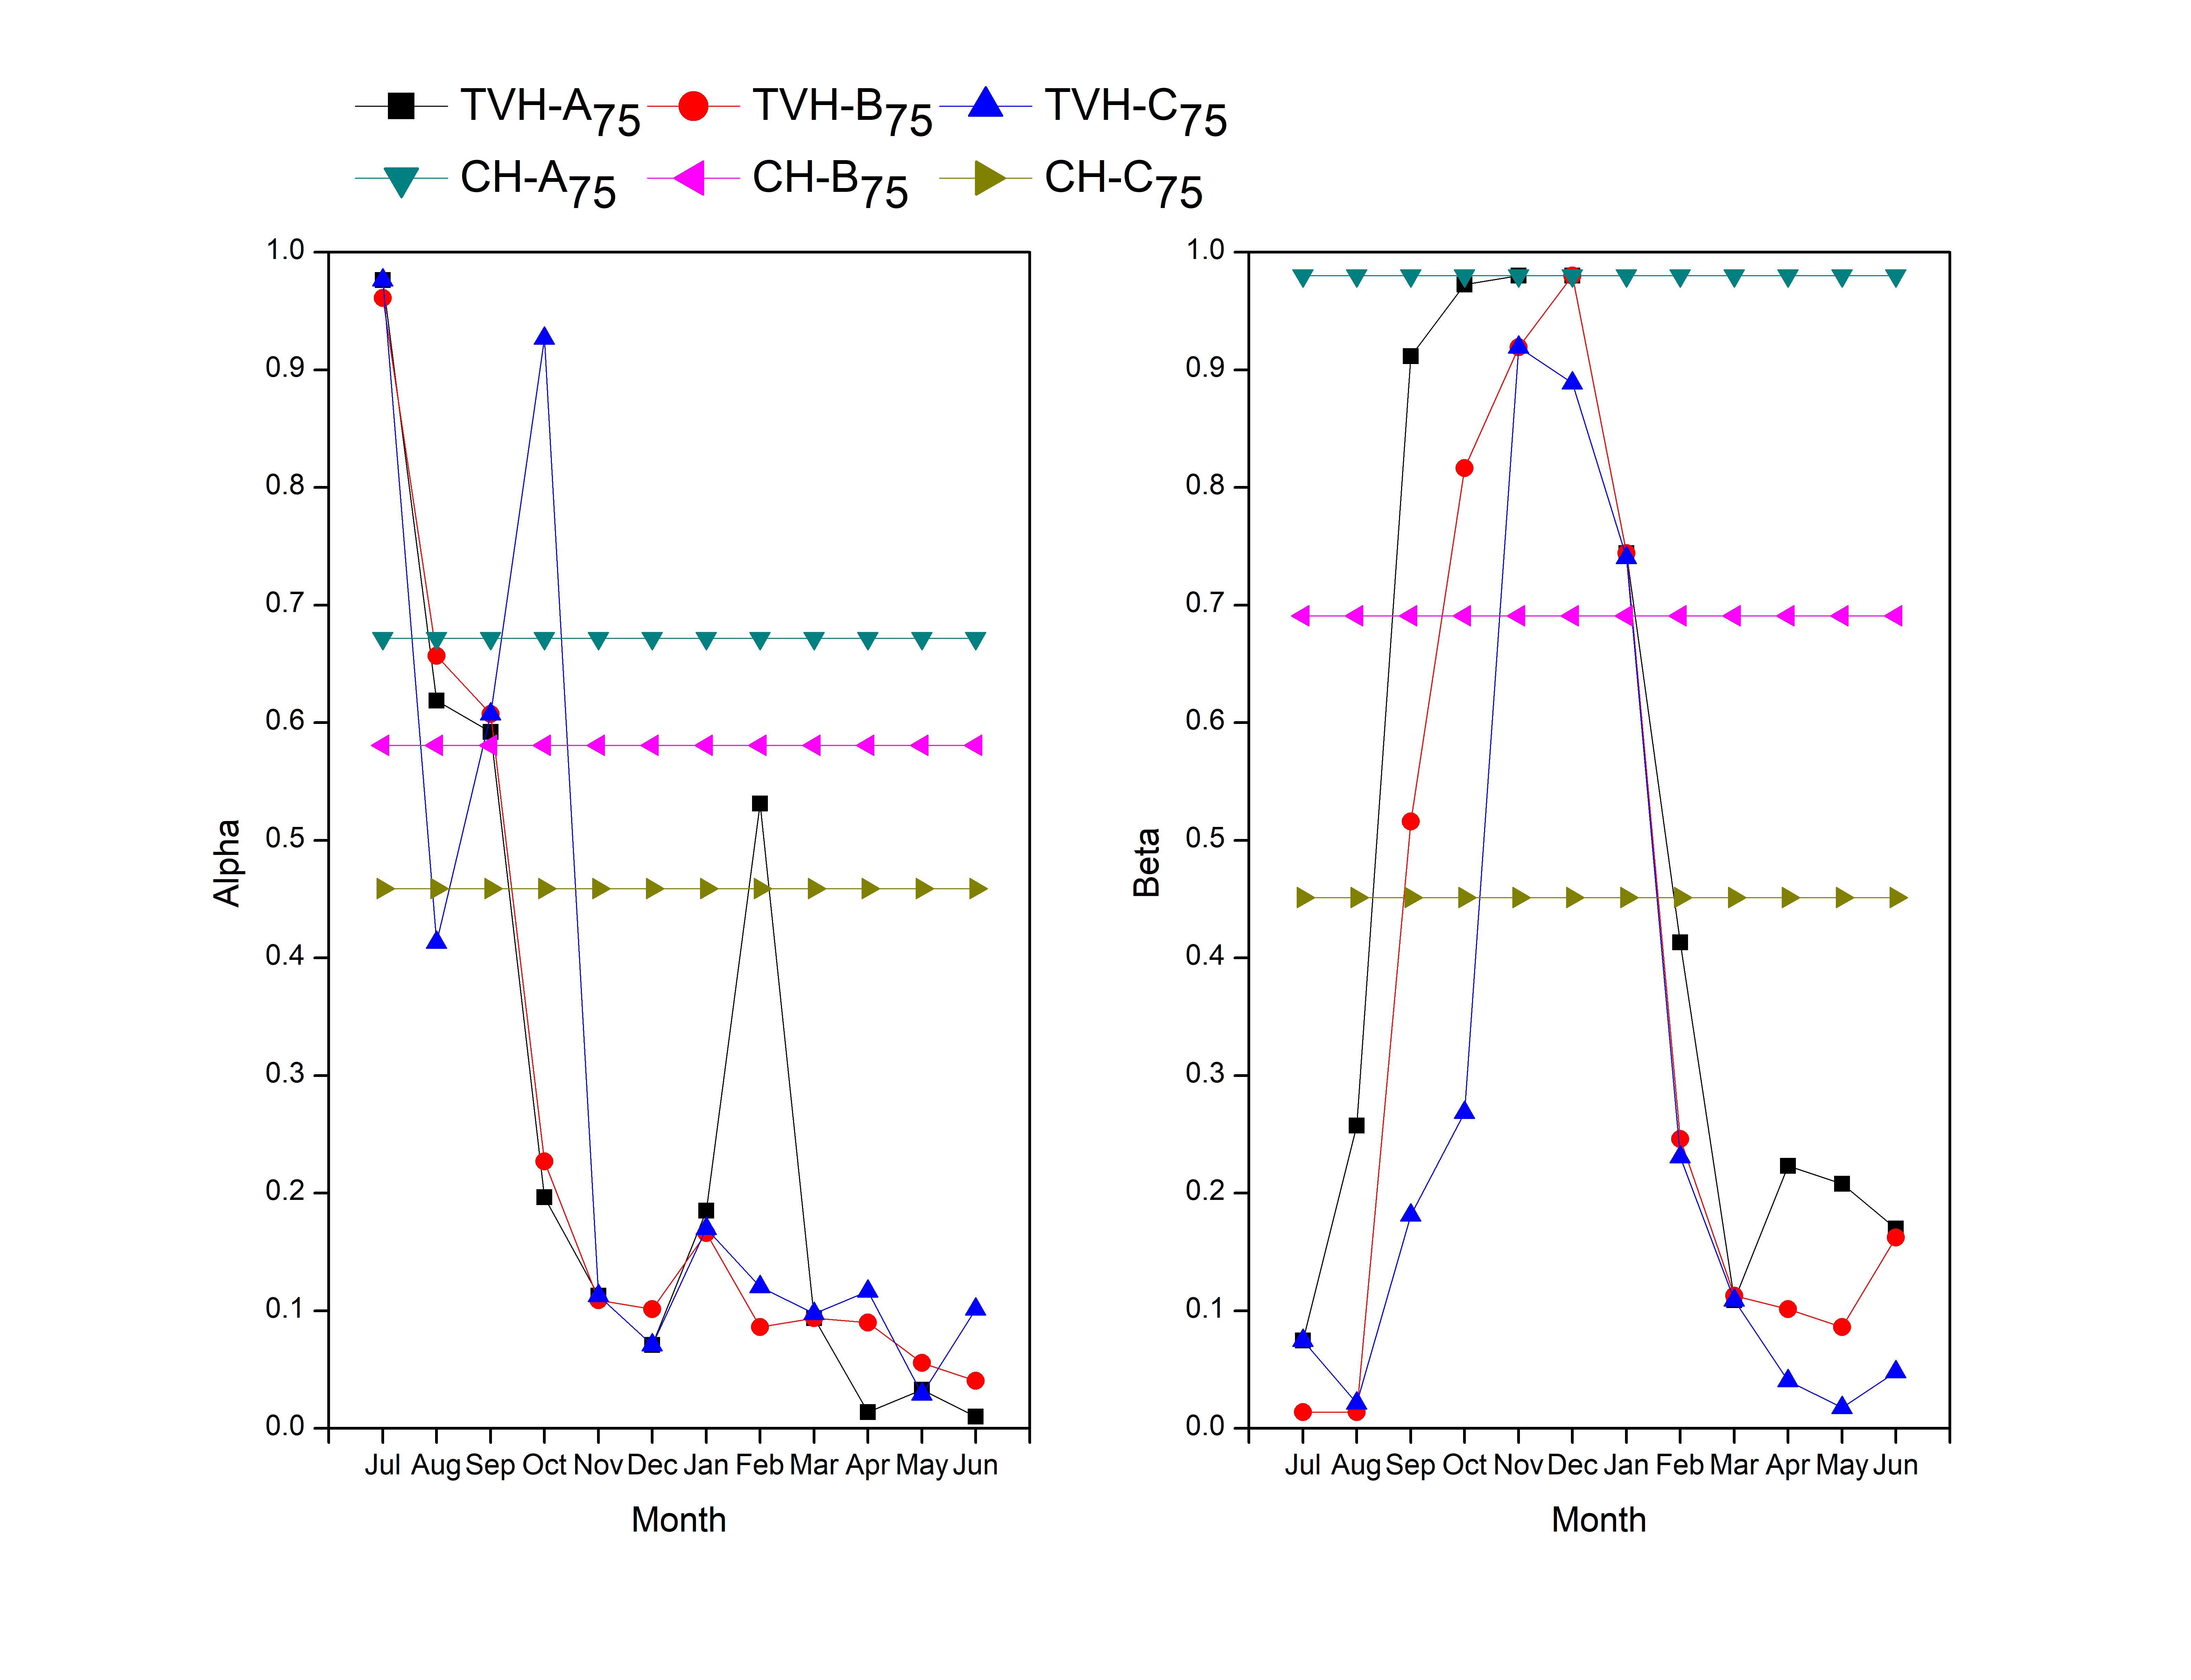
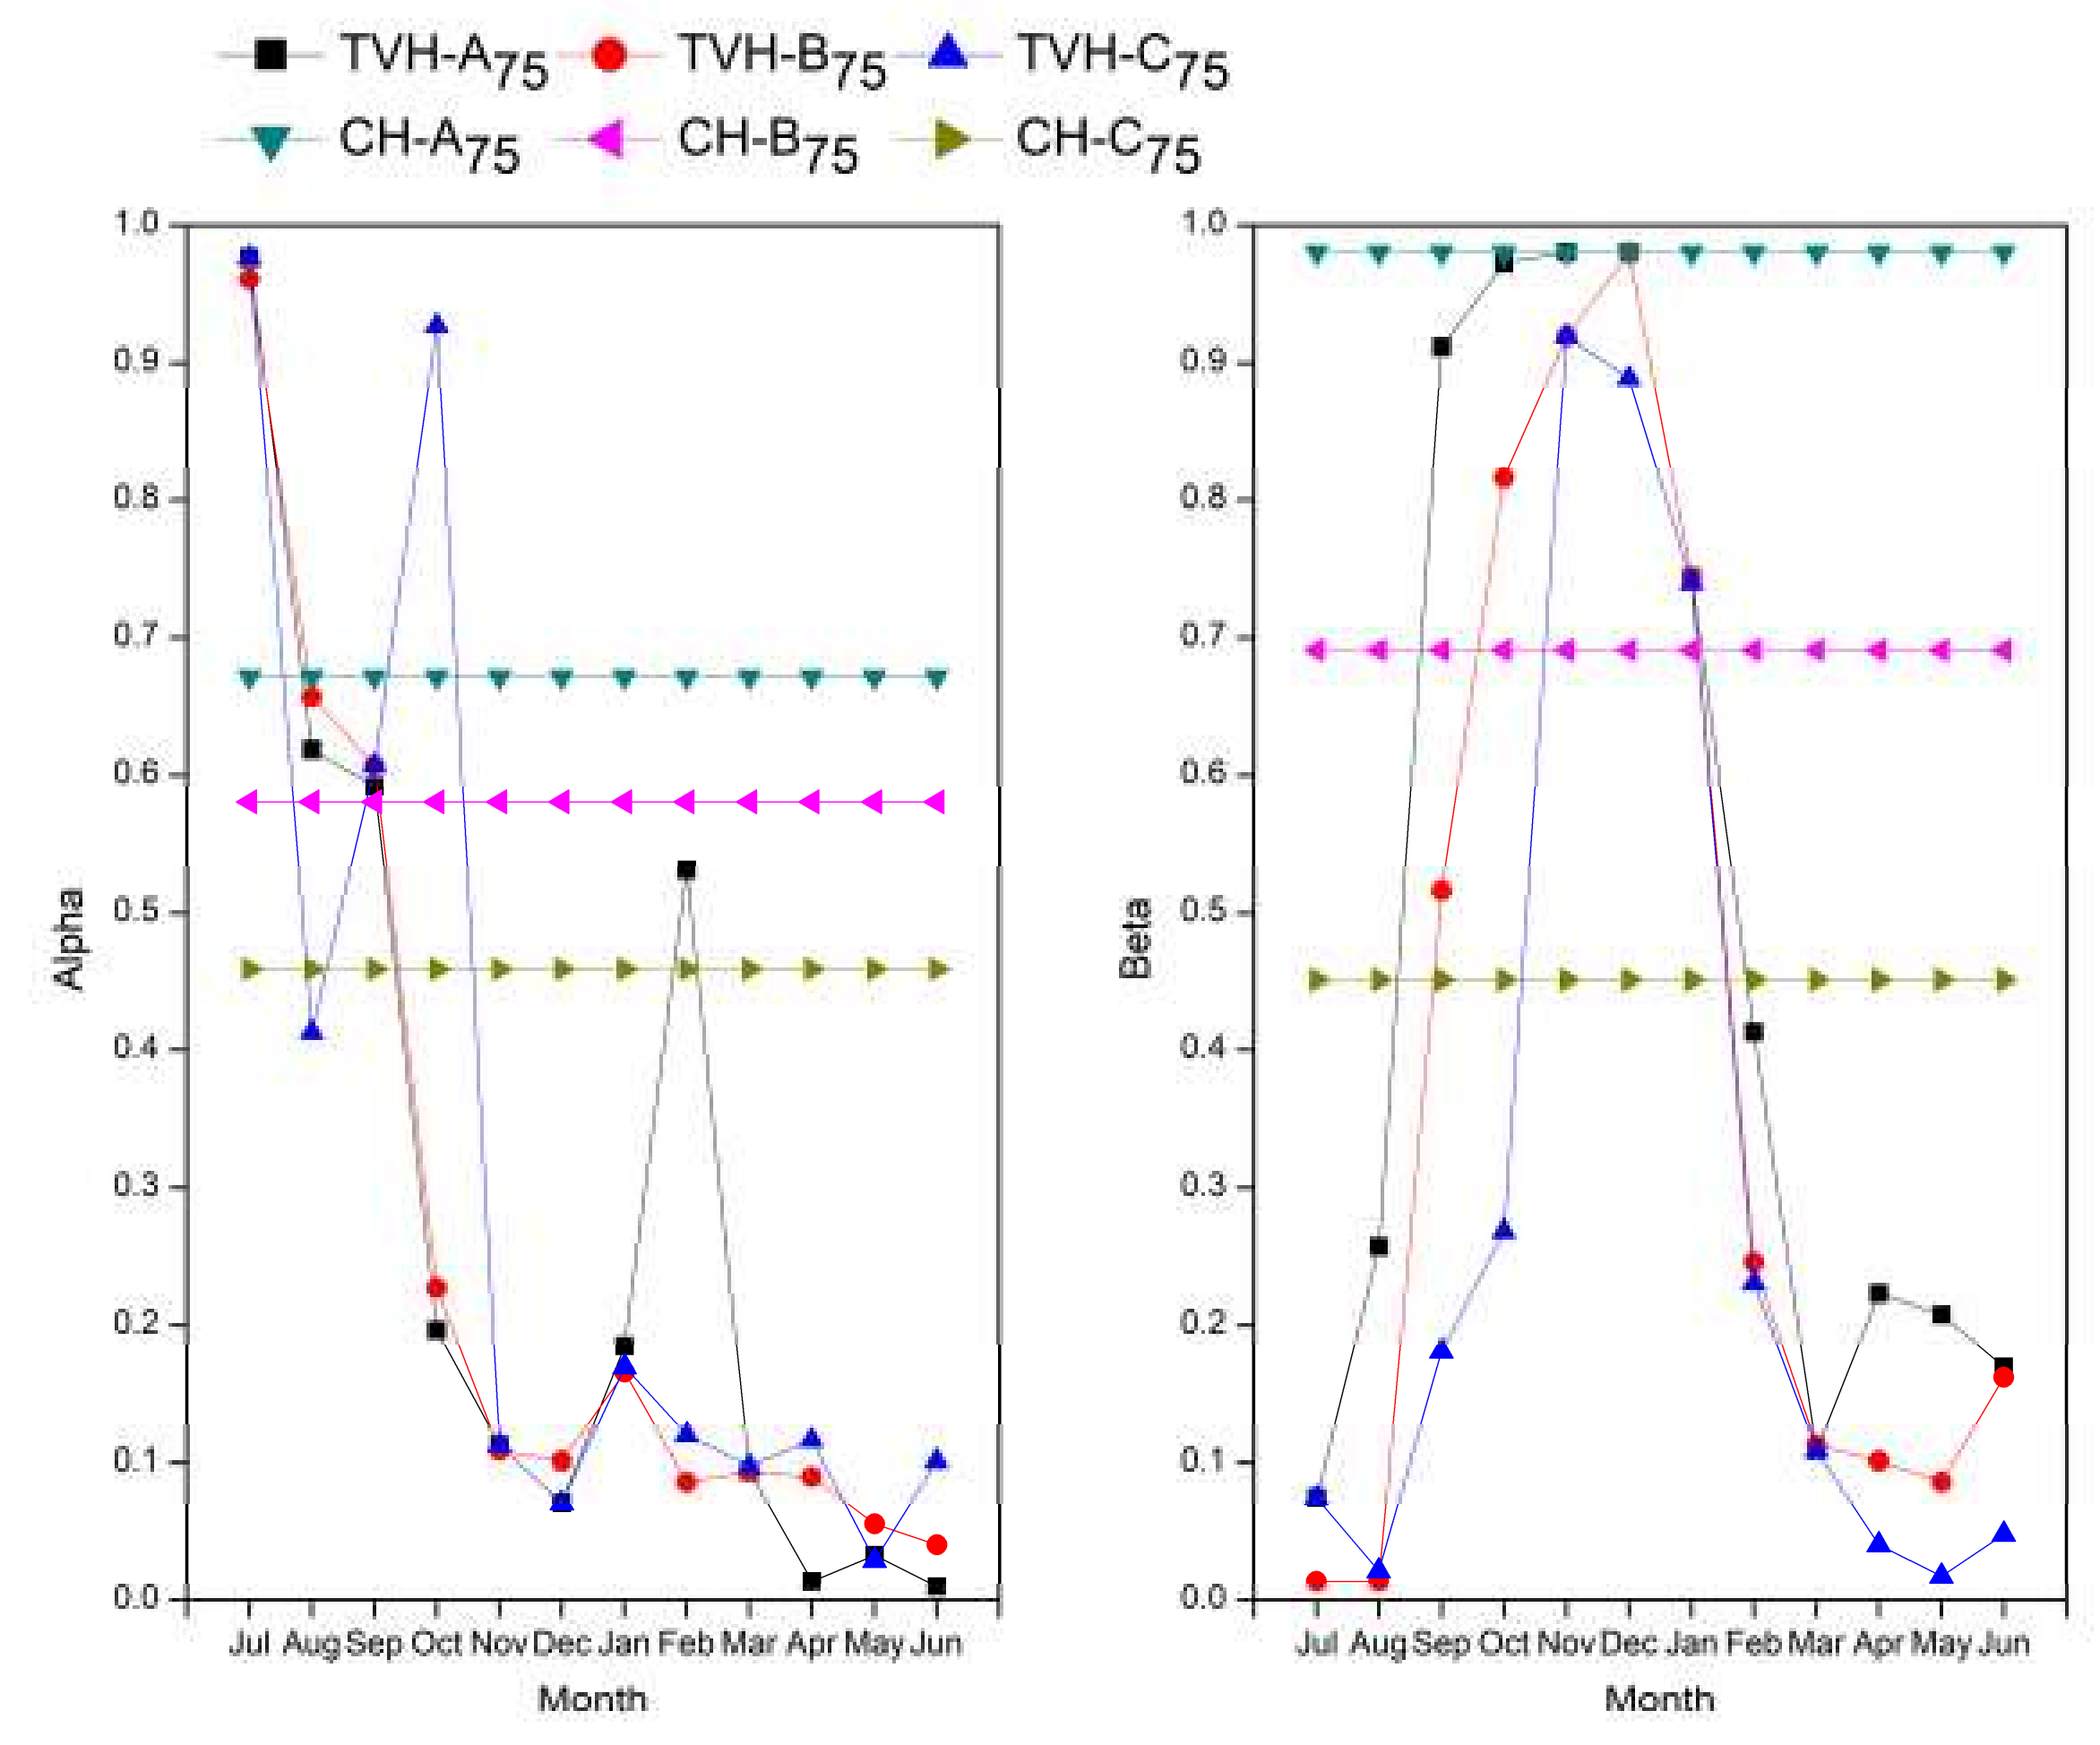
- The CH parameters are higher in many months when compared to TVH parameters, i.e., the hedging factors (rationing as well as storage levels-based factors) are higher. For example, in the case of two-point hedging policy (Figure 6): higher vulnerability solution (C-A75) the rationing is carried out even though the reservoir storage levels are high.
- (ii)
- For TV-TPH (Figure 6) it is observed that for the months April to August, the release is marginally different from SOP, i.e., the deficits are minimized by utilizing the maximum available water from the reservoir. It is evident from Figure 6 that the TVH parameters are adaptable to hedge the available water from high inflow months and carry-over the same during the low-flow months when compared to CH. In CH, although the hedging is carried out during the high-flow months, due to constant parameters, it is forced to continue hedging in low-flow periods, resulting in higher volume of deficits.
- (iii)
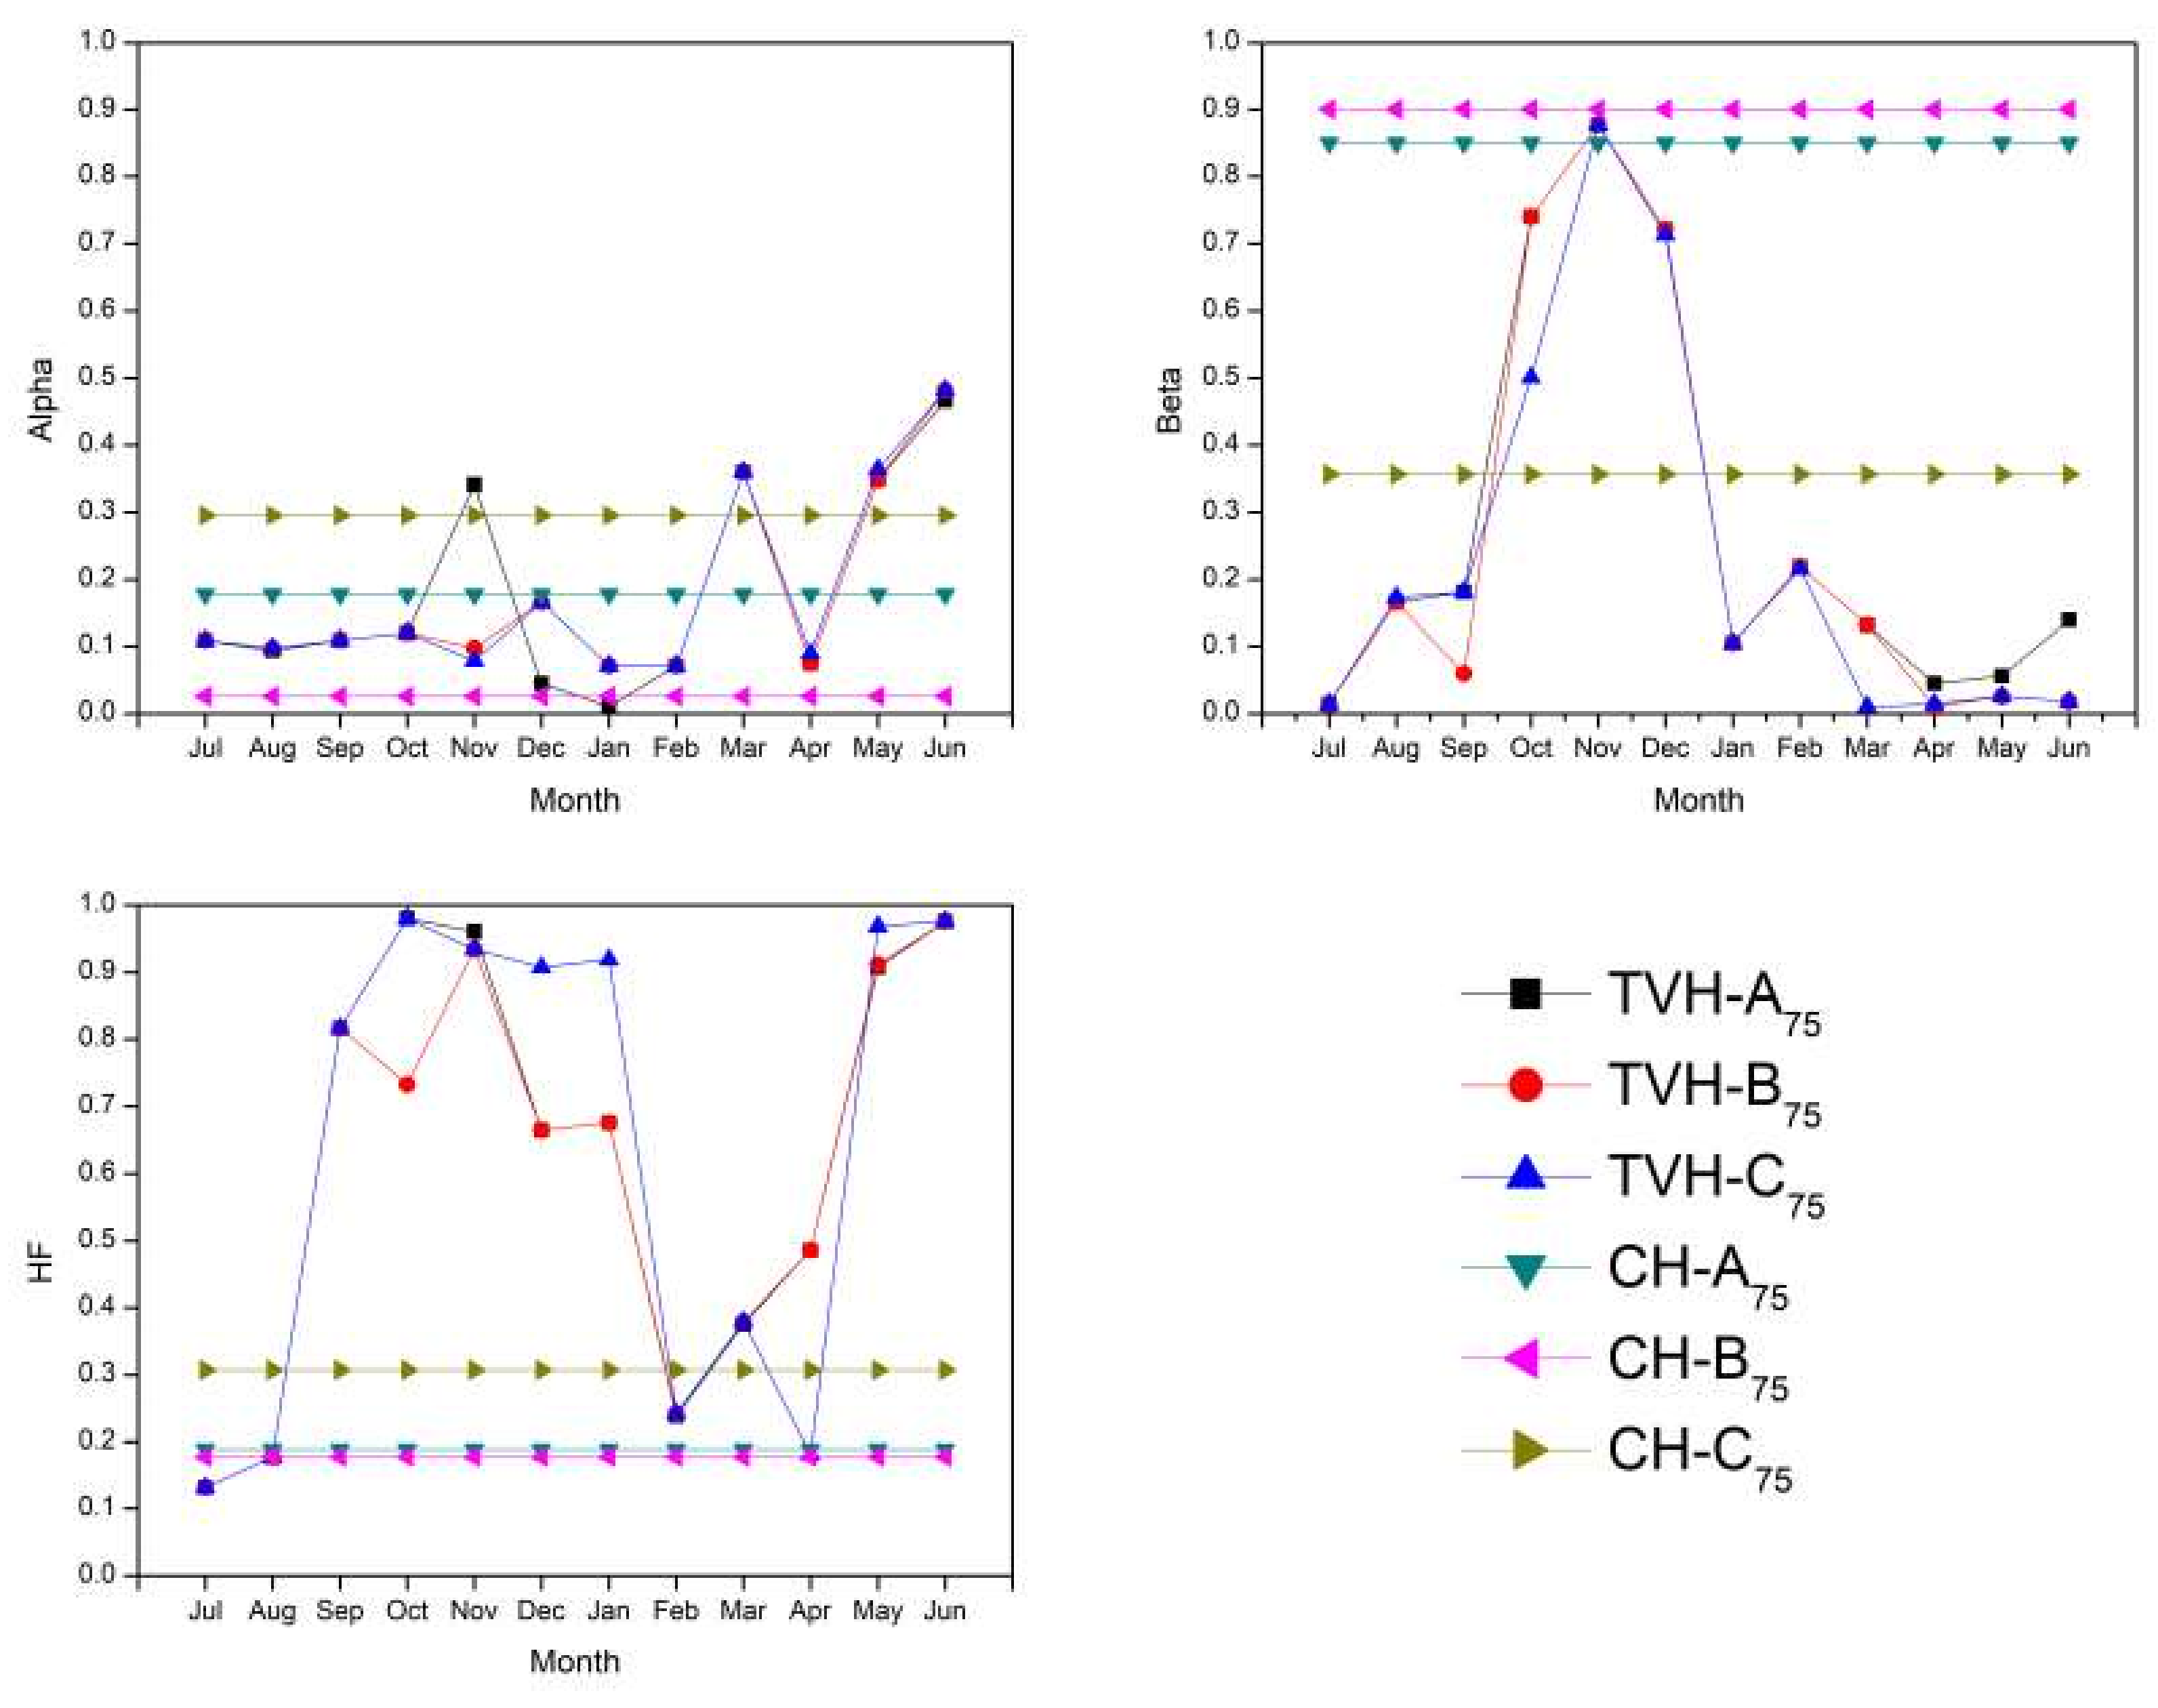
- Similarly it is observed from Figure 7, that for MTPH most of the dry months TVH parameters have low hedging factors, indicating that those months are simulated as a SOP. The rationing is carried out during high inflow months and low storage levels as contradictory to constant hedging policies.
- (iv)
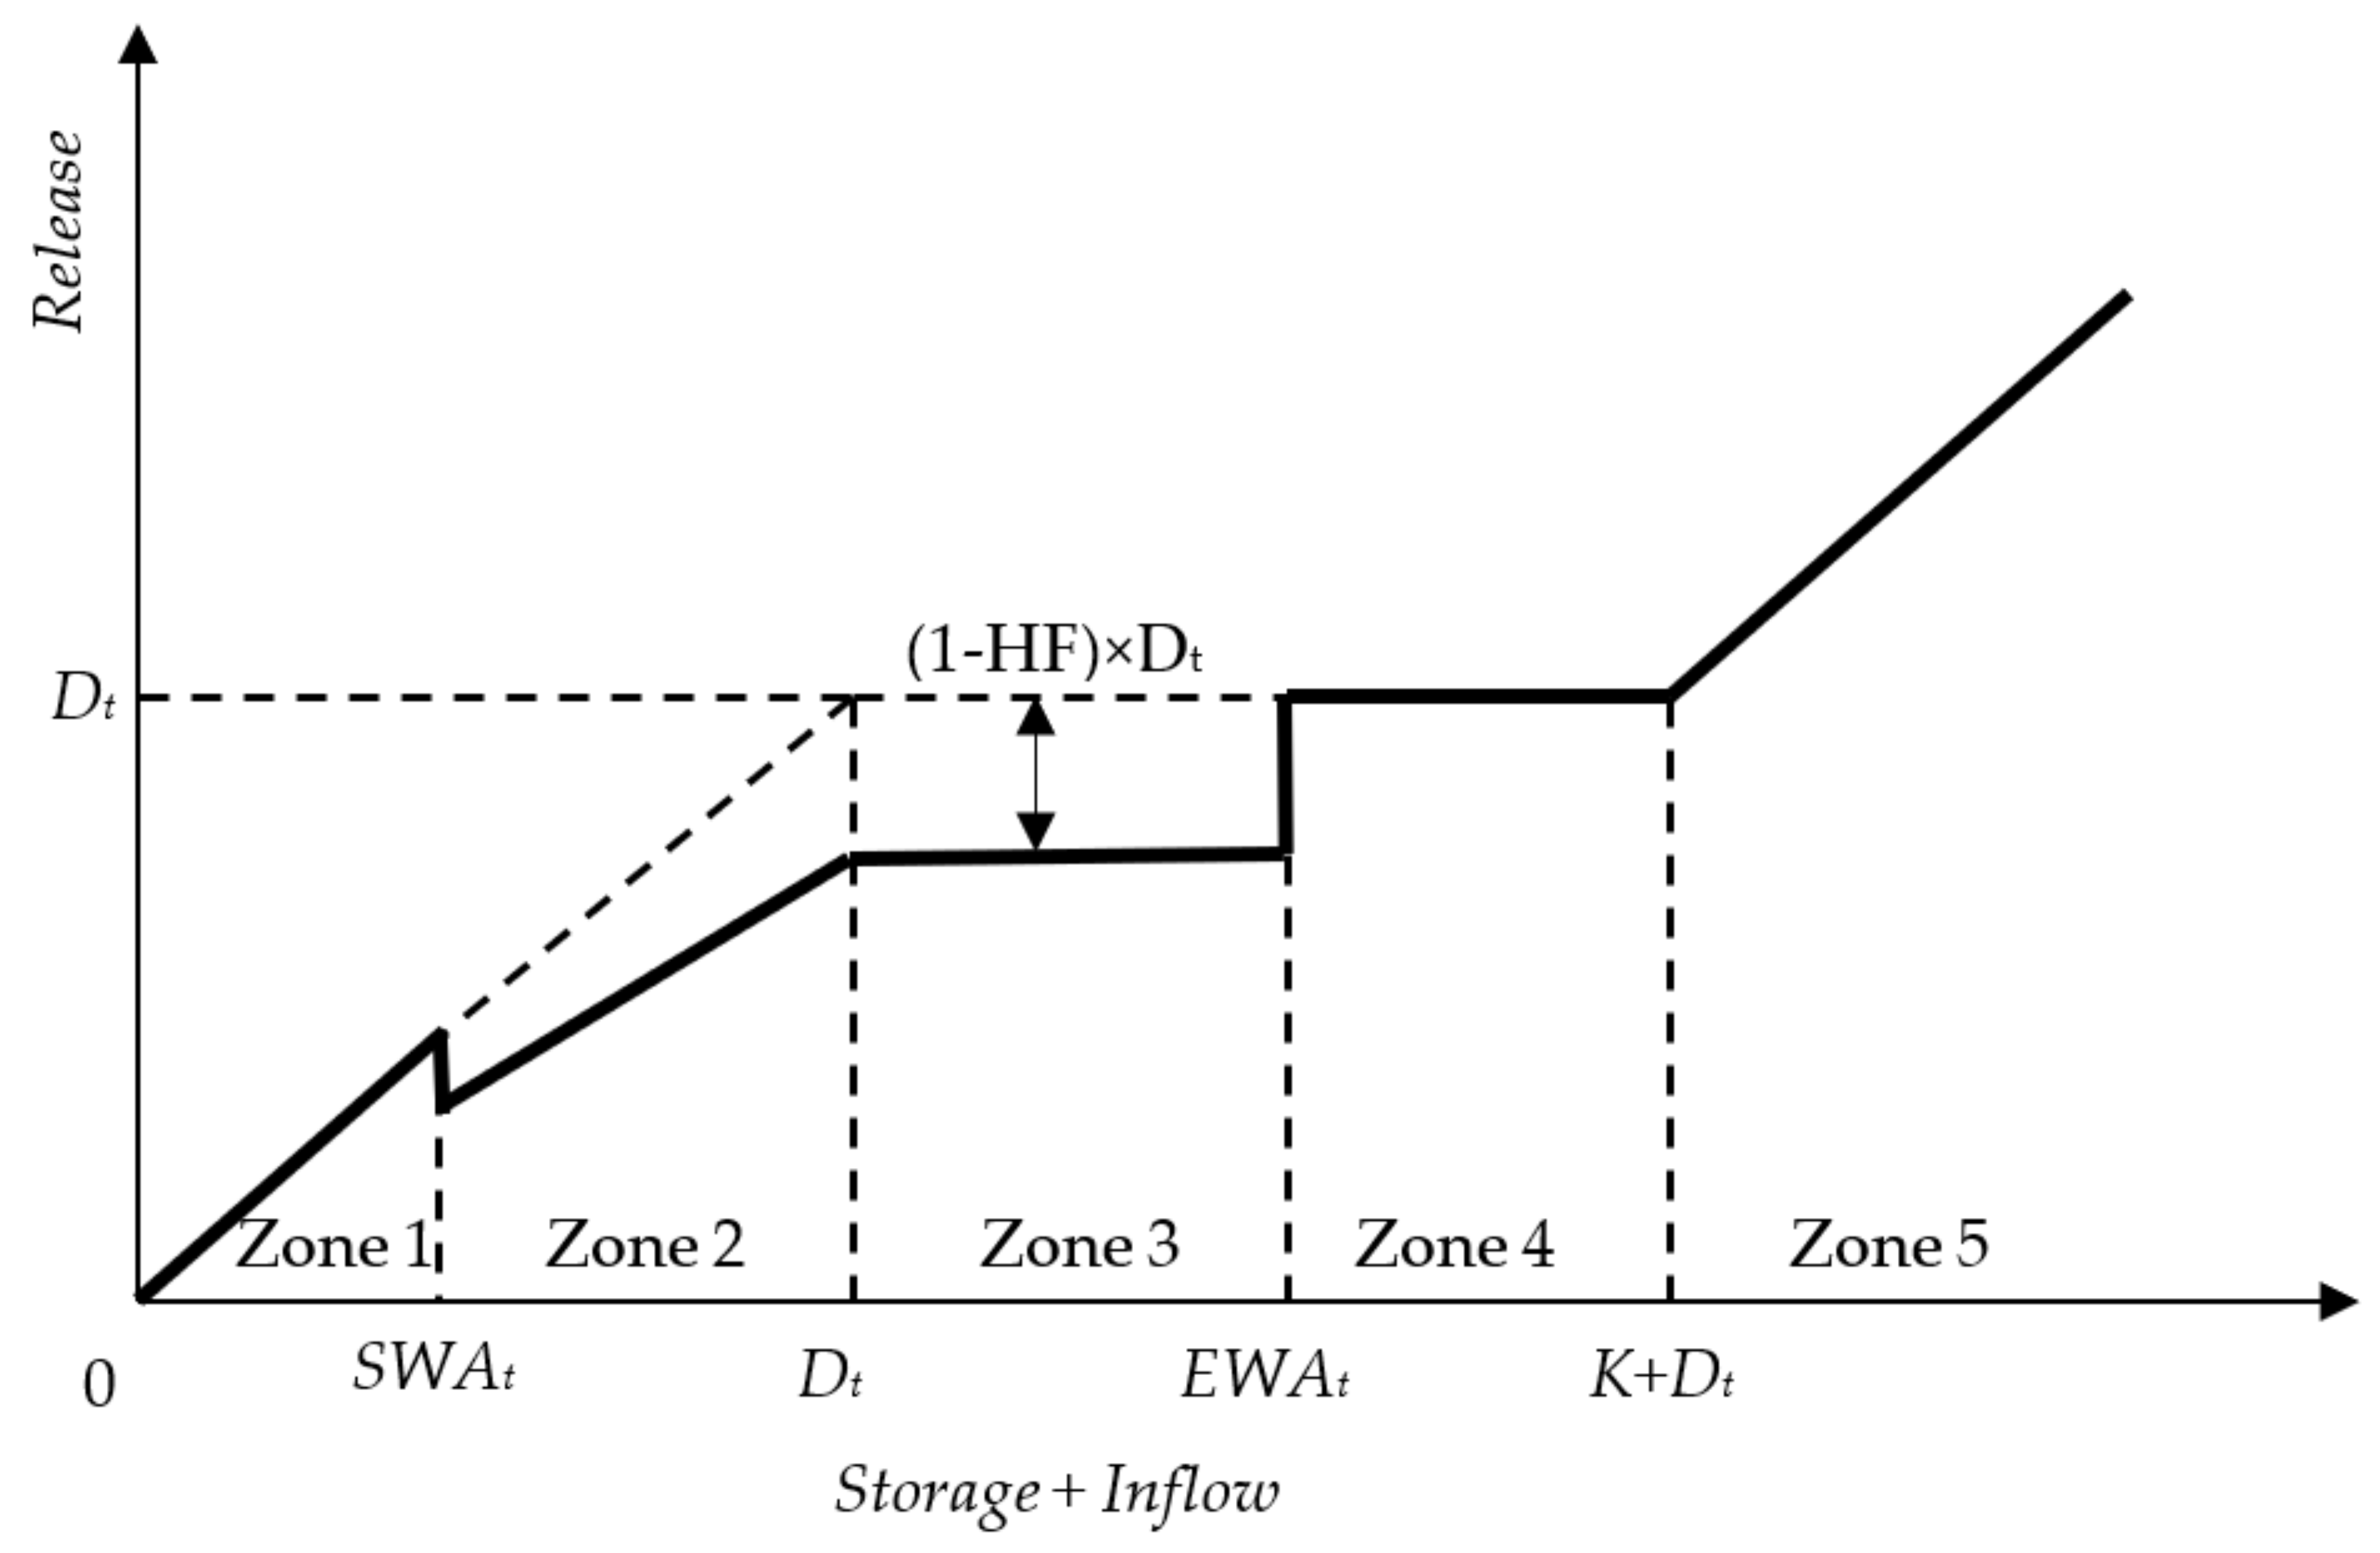
- In case of MTPH, the additional rationing factor HF plays a significant role in the variation of parameters alpha and beta. It is observed from Figure 7 that the rationing factor is higher in case of CH when compared to TVH, except for few months. In case of TVH, during October-January and April-May is simulated as two-point hedging rule. It is noted that, due to time-varying parameters in MTPH, it is able to efficiently hedge in demand (HF) and/or storage (alpha and beta), unlike the CH. This could be one of the plausible reasons for MTPH to perform better when compared to TPH. Further it is the variation of beta in both TPH and MTPH are similar, however MTPH alpha is significantly different from TPH. This shows that starting water availability is significantly affected by the rationing factor.
- (v)
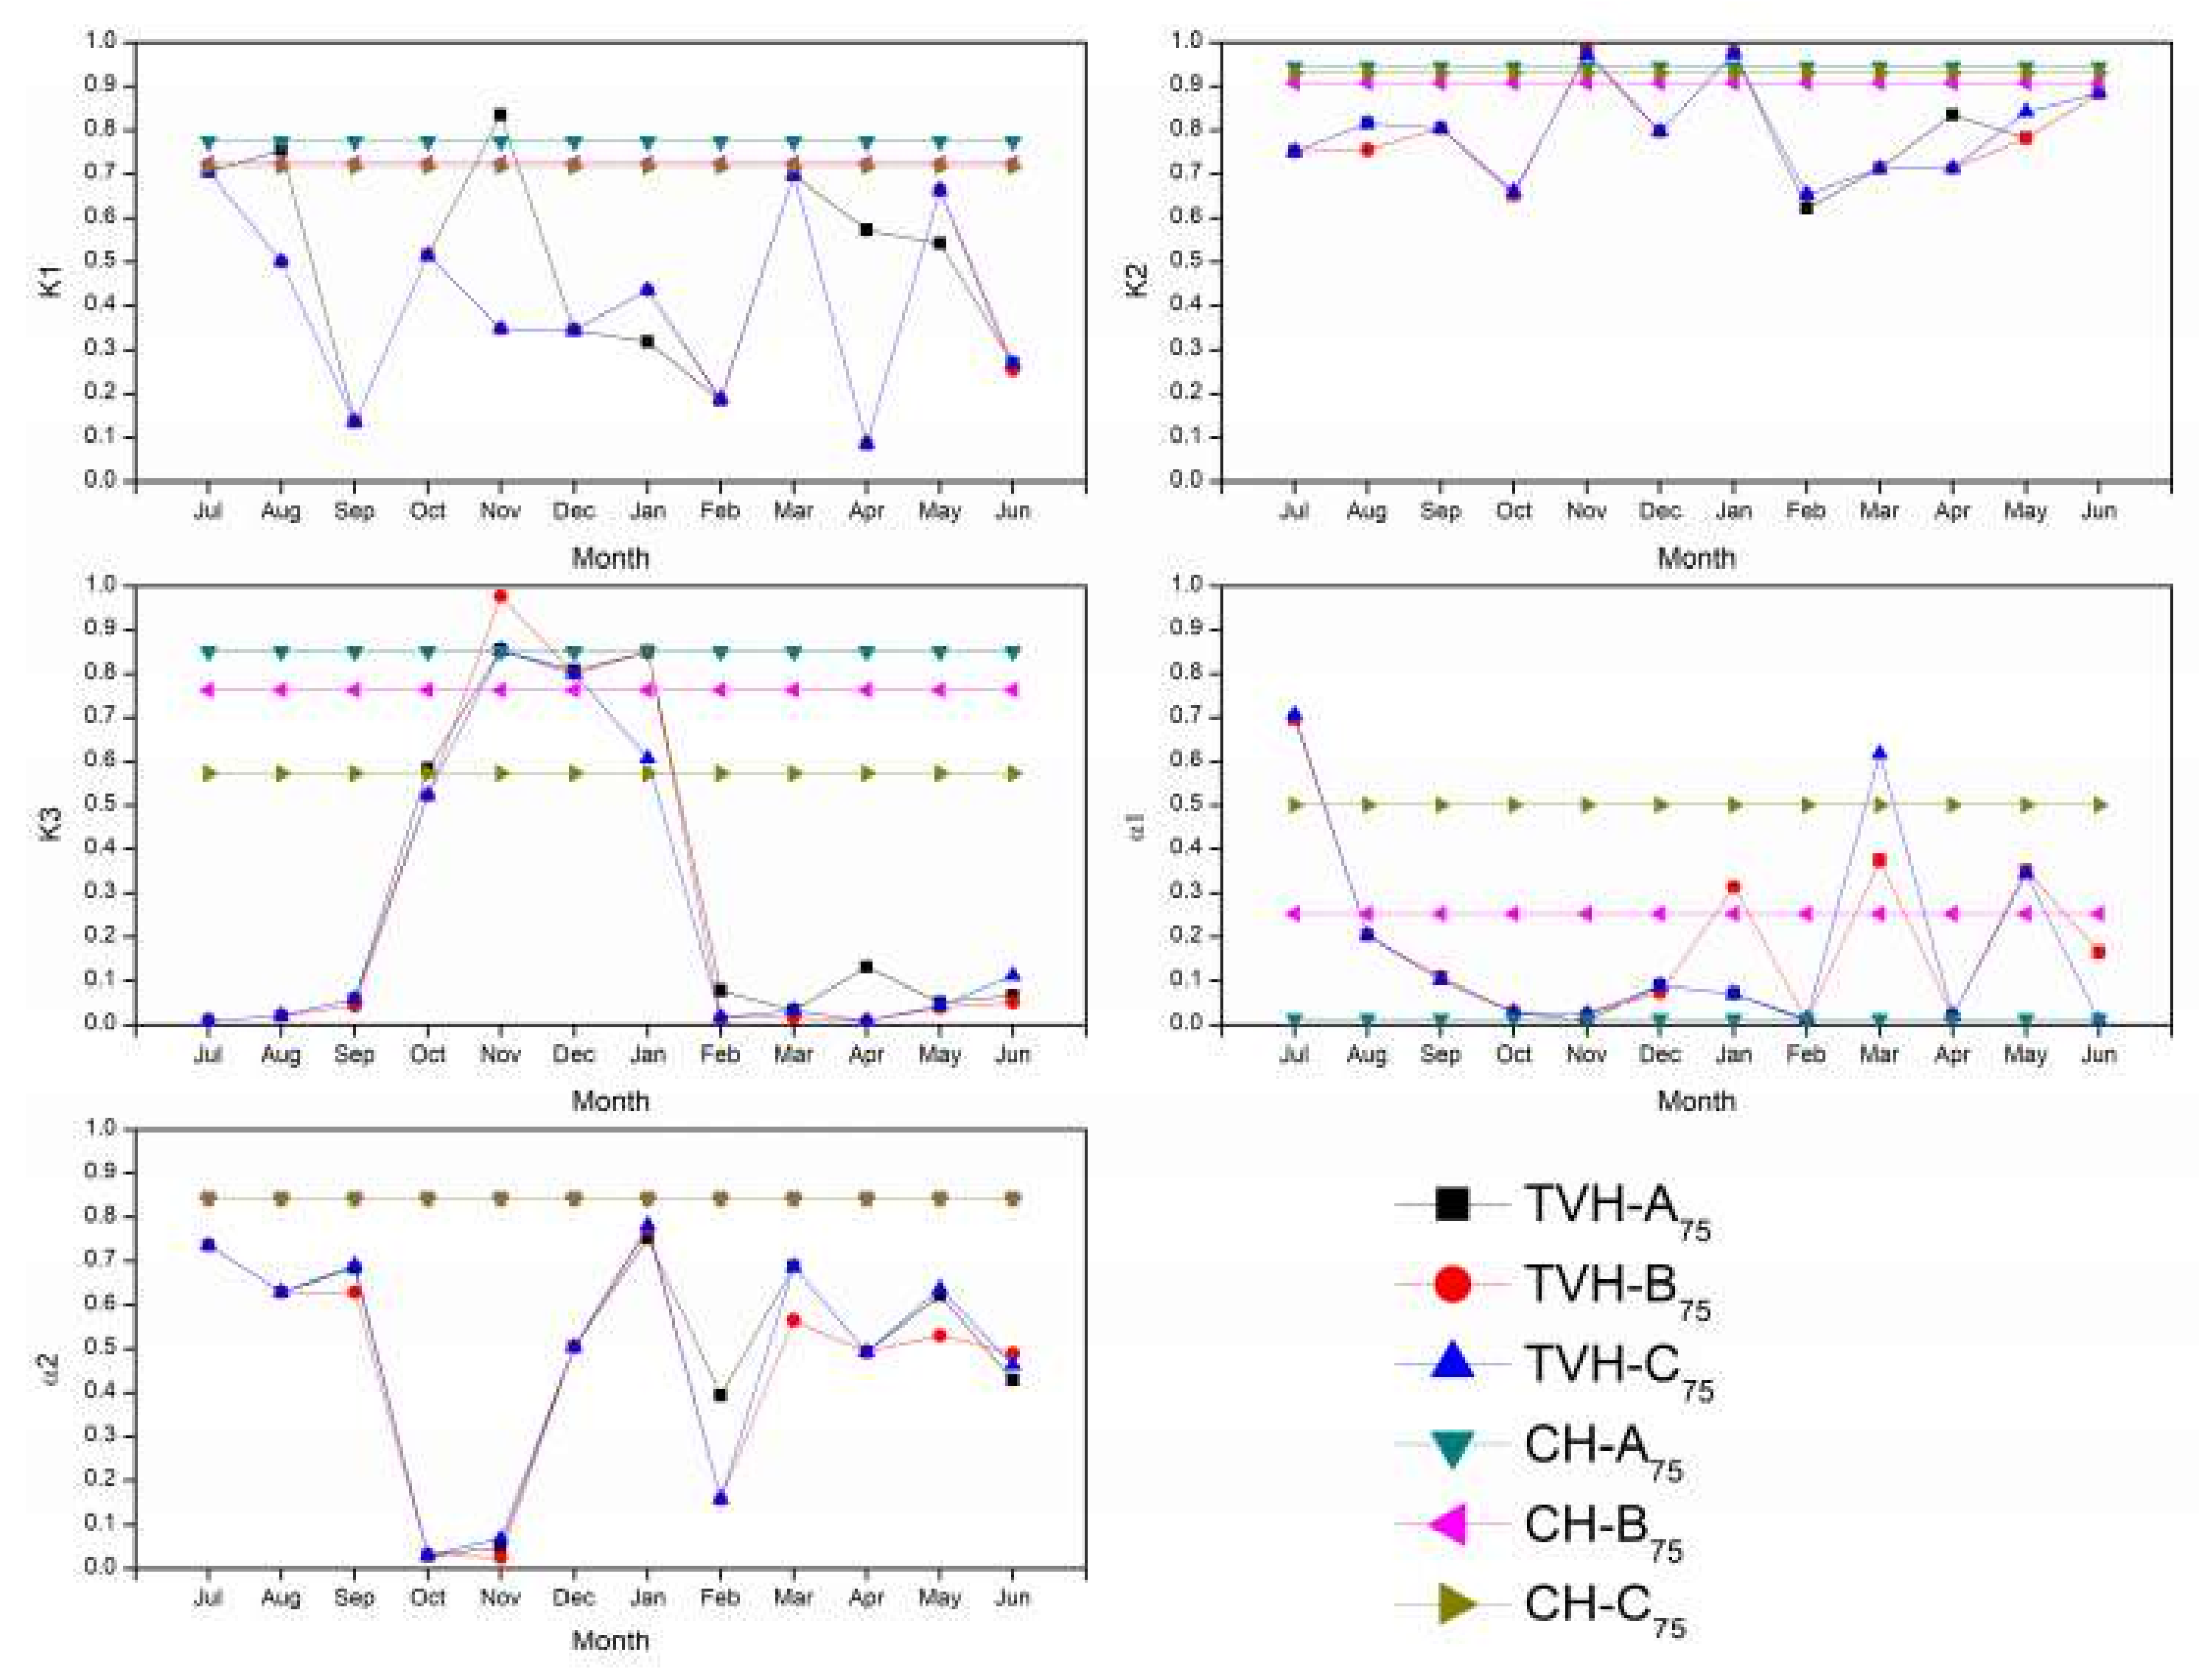
- It is observed from Figure 8, that, for discrete hedging policy, the time-varying parameters are significantly different for all of the months in comparison to constant hedging. The K3 parameter is has similar trend to beta parameter of TVH and MTPH.
- (vi)
- It is evident that, most of the rationing for CH is carried out in zones 1, 2, and 3. However, the TVH the rationing factors are dominant in high flow months when compared to low flow months. Therefore, the TVH is able reduce the number of failure events when compared to CH.
4. Summary and Conclusions
- (i)
- The sensitivity analysis on NSGA-II parameters indicated that the cross-over probability and random seed are found to be sensitive when compared to population size, number of generations, and mutation probability.
- (ii)
- Both the TVH and CH yield better alternative solutions in comparison to SOP, in terms of lower period vulnerabilities and shortage ratios.
- (iii)
- The reservoir performance has significantly increased with TVH when compared to CH.
- (iv)
- The decrease in number of deficits and mean period vulnerability are the key factors for better performance of the TVH
- (v)
- The hedging parameters for TVH indicate less rationing in low reservoir inflows and lower storage levels when compared to CH rationing, which is constant irrespective of inflows and storage levels.
Supplementary Materials
Author Contributions
Funding
Acknowledgments
Conflicts of Interest
Appendix A

References
- Draper, A.J.; Lund, J.R. Optimal hedging and carryover storage value. J. Water Resour. Plann. Manag. 2004, 130, 83–87. [Google Scholar] [CrossRef]
- Bayazit, M.; Unal, N.E. Effects of hedging on reservoir performance. Water Resour. Res. 1990, 26, 713–719. [Google Scholar] [CrossRef]
- Srinivasan, K.; Philipose, M.C. Evaluation and Selection of Hedging policies using stochastic Reservoir Simulation. Water Resour. Manag. 1996, 10, 163–188. [Google Scholar] [CrossRef]
- Srinivasan, K.; Philipose, M.C. Effect of hedging on over-year reservoir performance. Water Resour. Manag. 1998, 12, 95–120. [Google Scholar] [CrossRef]
- You, J.Y.; Cai, X. Hedging Rules for reservoir operations 1. A theoretical analysis. Water Resour. Res. 2008, 44, W01415. [Google Scholar] [CrossRef]
- You, J.Y.; Cai, X. Hedging rule for reservoir operations: 2. A numerical model. Water Resour. Res. 2008, 44, W01416. [Google Scholar] [CrossRef]
- Hashimoto, T.; Stedinger, J.R.; Loucks, D.P. Reliability, resiliency, and vulnerability criteria for water resources system evaluation. Water Resour. Res. 1982, 18, 14–20. [Google Scholar] [CrossRef]
- Shih, J.; ReVelle, C. Water-Supply Operations During Drought: Continuous Hedging Rule. J. Water Resour. Plan. Manag. 1994, 120, 613–629. [Google Scholar] [CrossRef]
- Shih, J.-S.; ReVelle, C. Water Supply Operations During Drought: A Discrete Hedging Rule. Eur. J. Oper. Res. 1995, 82, 163–175. [Google Scholar] [CrossRef]
- Neelakantan, T.R.; Pundarikanthan, N.V. Hedging rule optimization for water supply reservoirs system. J. Water Resour. Plann. Manag. 1999, 13, 409–426. [Google Scholar] [CrossRef]
- Shiau, J.T.; Lee, H.C. Derivation of optimal hedging rules for a water supply reservoir through compromise programming. Water Resour. Manag. 2005, 19, 111–132. [Google Scholar] [CrossRef]
- Celeste, A.B.; Billib, M. Evaluation of stochastic reservoir operation optimization models. Adv. Water Resour. 2009, 32, 1429–1443. [Google Scholar] [CrossRef]
- Oliveira, R.; Loucks, D. Operating rules for multi-reservoir systems. Water Resour. Res. 1997, 33, 839–852. [Google Scholar] [CrossRef]
- Srinivasan, K.; Kranthi, K. Multi-Objective Simulation-Optimization model for long-term reservoir operation using piecewise linear hedging rule. Water Resour. Manag. 2018, 32, 1901–1911. [Google Scholar]
- Liu, Y.; Zhao, J.; Hang, Z. Piecewise-linear hedging rules for reservoir operation with economic and ecologic objectives. Water 2018, 10, 865. [Google Scholar] [CrossRef]
- Neelakantan, T.R.; Pundarikanthan, N.V. Neural network-based simulation-optimization model for reservoir operation. J. Water Resour. Plan. Manag. 2000, 126, 57–64. [Google Scholar] [CrossRef]
- Sangiorgio, M.; Guariso, G. NN-Based Implicit Stochastic Optimization of Multi-Reservoir Systems Management. Water 2018, 10, 303. [Google Scholar] [CrossRef]
- Yi, J.; Lei, X.; Cai, S.; Wang, X. Hedging rules for water supply reservoir based on the model of simulation and optimization. Water 2016, 8, 249. [Google Scholar]
- Tu, M.N.; Hsu, N.S.; William, Y.G. Optimization of Hedging Rules for Reservoir Operations. J. Water Resour. Plan. Manag. 2008, 134, 3–13. [Google Scholar] [CrossRef]
- Shiau, T.J. Optimization of Reservoir Hedging Rules Using Multiobjective Genetic Algorithm. J. Water Resour. Plan. Manag. 2009, 135, 355. [Google Scholar] [CrossRef]
- Shiau, J.T. Analytical optimal hedging with explicit incorporation of reservoir release and carryover storage targets. Water Resour. Res. 2011, 47. [Google Scholar] [CrossRef] [Green Version]
- Wang, H.; Liu, J. Reservoir Operation Incorporating Hedging Rules and Operational Inflow Forecasts. Water Resour. Manag. 2013, 27, 1427–1438. [Google Scholar] [CrossRef]
- Spiliotis, M.; Luis, M.; Luis, G. Optimization of Hedging Rules for Reservoir Operation During Droughts Based on Particle Swarm Optimization. Water Resour. Manag. 2016, 30, 5759–5778. [Google Scholar] [CrossRef]
- Xu, B.; Zhong, P.-A.; Huang, Q.; Wang, J.; Yu, Z.; Zhang, J. Optimal Hedging Rules for Water Supply Reservoir Operations under Forecast Uncertainty and Conditional Value-at-Risk Criterion. Water 2017, 9, 568. [Google Scholar] [CrossRef]
- Koutsoyiannis Demetris; Athanasia Economou. Evaluation of the parameterization-simulation-optimization approach for the control of reservoir systems. Water Resour. Res. 2003, 39, 1170. [Google Scholar]
- Giuliani, M.; Emanuele, M.; Andrea, C.; Francesca, P.; Rodolfo, S. Universal approximators for direct policy search in multi-purpose water reservoir management: A comparative analysis. In Proceedings of the 19th World Congress, The International Federation of Automatic Control, Cape Town, South Africa, 24–29 August 2014; pp. 6234–6239. [Google Scholar]
- Deb, K.; Pratap, A.; Agarwal, S.; Meyarivan, T. A Fast and Elitist Multiobjective Genetic Algorithm: NSGA-II. IEEE Trans. Evolut. Comput. 2002, 6, 182–197. [Google Scholar] [CrossRef]
- Fonseca, C.M.; Fleming, P.J. An overview of evolutionary algorithms in multi-objective optimization. Evolut. Comput. 1995, 3, 1–16. [Google Scholar] [CrossRef]


| Month | June | July | August | September | October | November | December | January | February | March | April | May |
|---|---|---|---|---|---|---|---|---|---|---|---|---|
| Mean Monthly Inflow (Mm3) | 150 | 856 | 665 | 296 | 285 | 127 | 55 | 30 | 18 | 14 | 14 | 36 |
| Target Yield (Mm3) | 165 | 260 | 275 | 75 | 50 | 120 | 280 | 350 | 225 | 80 | 20 | 10 |
| Two-Point Hedging (TPH) | Modified Two-Point Hedging (MTPH) | Discrete Hedging (DH) | |
|---|---|---|---|
| Time-Varying | TV-TPH | TV-MTPH | TV-DH |
| Constant | C-TPH | C-MTPH | C-DH |
| GA Parameter | Range | Selected Parameter | ||||||||
|---|---|---|---|---|---|---|---|---|---|---|
| Two-Point Hedging (TV-TPH) | Modified Two-Point Hedging (TV-MTPH) | Discrete Hedging (TV-DH) | ||||||||
| Demand % | 75 | 80 | 85 | 75 | 80 | 85 | 75 | 80 | 85 | |
| Population | 50,100,200 | 100 | 100 | 100 | 100 | 100 | 100 | 100 | 100 | 100 |
| Generation | 100,300,500 | 300 | 300 | 300 | 300 | 300 | 300 | 300 | 300 | 300 |
| Cross Over | 0.6,0.7,0.8,0.9 | 0.7 | 0.8 | 0.9 | 0.8 | 0.7 | 0.7 | 0.6 | 0.7 | 0.7 |
| Mutation | 0.001,0.005,0.01 | 0.001 | 0.001 | 0.001 | 0.001 | 0.001 | 0.001 | 0.001 | 0.001 | 0.001 |
| Random Seed | 0.25,0.35,0.45 0.55,0.65,0.75 | 0.65 | 0.45 | 0.45 | 0.75 | 0.25 | 0.25 | 0.65 | 0.25 | 0.45 |
| Period Vulnerability | Shortage Ratio | Volume Reliability | Occurrence Reliability | Resilience | Mean Event Deficit | Number of Period Deficits | |
|---|---|---|---|---|---|---|---|
| SOP | 216.58 | 0.031 | 0.969 | 0.93 | 0.51 | 135.2 | 49 |
| Time-Varying Hedging | |||||||
| TV-Max S/R | 64.44 | 0.084 | 0.916 | 0.461 | 0.275 | 89.89 | 376 |
| TV-Max Vul | 136.97 | 0.031 | 0.969 | 0.841 | 0.387 | 79.2 | 111 |
| TV-A75 | 80.01 | 0.048 | 0.952 | 0.595 | 0.355 | 53.24 | 282 |
| TV-B75 | 102.08 | 0.036 | 0.964 | 0.728 | 0.344 | 61.12 | 189 |
| TV-C75 | 119.23 | 0.032 | 0.968 | 0.829 | 0.479 | 62.47 | 119 |
| Constant Hedging | |||||||
| C-Max S/R | 82.81 | 0.111 | 0.889 | 0.389 | 0.134 | 215.61 | 426 |
| C-Max Vul | 216.58 | 0.031 | 0.969 | 0.917 | 0.431 | 135.23 | 58 |
| C-A75 | 82.81 | 0.111 | 0.889 | 0.389 | 0.134 | 215.61 | 426 |
| C-B75 | 98.78 | 0.103 | 0.897 | 0.428 | 0.143 | 200.48 | 399 |
| C-C75 | 120.56 | 0.084 | 0.916 | 0.501 | 0.164 | 163.29 | 347 |
| Period Vulnerability | Shortage Ratio | Volume Reliability | Occurrence Reliability | Resilience | Mean Event Deficit | Number of Period Deficits | |
|---|---|---|---|---|---|---|---|
| SOP | 216.58 | 0.031 | 0.969 | 0.93 | 0.51 | 135.2 | 49 |
| Time-Varying Hedging | |||||||
| TV-Max S/R | 84.45 | 0.041 | 0.959 | 0.865 | 0.606 | 79.75 | 94 |
| TV-Max Vul | 126.95 | 0.033 | 0.967 | 0.911 | 0.709 | 81.96 | 62 |
| TV-A75 | 84.45 | 0.041 | 0.958 | 0.865 | 0.606 | 79.75 | 94 |
| TV-B75 | 100.34 | 0.039 | 0.961 | 0.904 | 0.716 | 89.08 | 67 |
| TV-C75 | 119.99 | 0.033 | 0.967 | 0.899 | 0.714 | 73.36 | 70 |
| Constant Hedging | |||||||
| C-Max S/R | 67.41 | 0.115 | 0.885 | 0.395 | 0.133 | 227.33 | 422 |
| C-Max Vul | 214.72 | 0.031 | 0.969 | 0.917 | 0.431 | 135.75 | 58 |
| C-A75 | 82.14 | 0.113 | 0.887 | 0.402 | 0.135 | 223.16 | 417 |
| C-B75 | 100.21 | 0.108 | 0.892 | 0.391 | 0.13 | 217.32 | 425 |
| C-C75 | 119.05 | 0.095 | 0.905 | 0.579 | 0.198 | 180.76 | 293 |
| Period Vulnerability | Shortage Ratio | Volume Reliability | Occurrence Reliability | Resilience | Mean Event Deficit | Number of Period Deficits | |
|---|---|---|---|---|---|---|---|
| SOP | 216.58 | 0.031 | 0.969 | 0.93 | 0.51 | 135.2 | 49 |
| Time-Varying Hedging | |||||||
| TV-Max S/R | 69.57 | 0.05 | 0.95 | 0.79 | 0.74 | 51.52 | 146 |
| TV-Max Vul | 123.61 | 0.033 | 0.967 | 0.856 | 0.43 | 84.19 | 100 |
| TV-A75 | 78.53 | 0.044 | 0.956 | 0.866 | 0.7 | 74.2 | 93 |
| TV-B75 | 98.35 | 0.037 | 0.963 | 0.888 | 0.628 | 83.76 | 78 |
| TV-C75 | 123.61 | 0.033 | 0.967 | 0.856 | 0.43 | 84.19 | 100 |
| Constant Hedging | |||||||
| C-Max S/R | 65.59 | 0.112 | 0.888 | 0.394 | 0.133 | 221.6 | 423 |
| C-Max Vul | 216.58 | 0.03 | 0.969 | 0.922 | 0.5 | 125.28 | 54 |
| C-A75 | 79.18 | 0.097 | 0.903 | 0.395 | 0.128 | 198.02 | 422 |
| C-B75 | 106.22 | 0.096 | 0.904 | 0.402 | 0.132 | 193.44 | 417 |
| C-C75 | 123.5 | 0.084 | 0.916 | 0.46 | 0.152 | 162.81 | 377 |
© 2018 by the authors. Licensee MDPI, Basel, Switzerland. This article is an open access article distributed under the terms and conditions of the Creative Commons Attribution (CC BY) license (http://creativecommons.org/licenses/by/4.0/).
Share and Cite
Bhatia, N.; Srivastav, R.; Srinivasan, K. Season-Dependent Hedging Policies for Reservoir Operation—A Comparison Study. Water 2018, 10, 1311. https://doi.org/10.3390/w10101311
Bhatia N, Srivastav R, Srinivasan K. Season-Dependent Hedging Policies for Reservoir Operation—A Comparison Study. Water. 2018; 10(10):1311. https://doi.org/10.3390/w10101311
Chicago/Turabian StyleBhatia, Nikhil, Roshan Srivastav, and Kasthrirengan Srinivasan. 2018. "Season-Dependent Hedging Policies for Reservoir Operation—A Comparison Study" Water 10, no. 10: 1311. https://doi.org/10.3390/w10101311
APA StyleBhatia, N., Srivastav, R., & Srinivasan, K. (2018). Season-Dependent Hedging Policies for Reservoir Operation—A Comparison Study. Water, 10(10), 1311. https://doi.org/10.3390/w10101311