Article

Effects of Crop Planting Structure Adjustment on Water Use Efficiency in the Irrigation Area of Hei River Basin

1
State Key Laboratory of Simulation and Regulation of Water Cycle in River Basin, China Institute of Water Resources and Hydropower Research, Beijing 100038, China
2
National Center of Efficient Irrigation Engineering and Technology Research, Beijing 100048, China
3
China Agricultural University of Water Conservancy and Civil Engineering, Beijing 100083, China
*
Authors to whom correspondence should be addressed.
Water 2018, 10(10), 1305; https://doi.org/10.3390/w10101305
Submission received: 21 August 2018 / Revised: 12 September 2018 / Accepted: 16 September 2018 / Published: 22 September 2018
(This article belongs to the Special Issue Water-Energy-Food Nexus in Asia, with Focus on the Mekong Region)

Abstract

:
The adjustment of crop planting structure can change the process of water and material circulation, and thus affect the total amount of water and evapotranspiration in the irrigation district. To guide the allocation of water resources in the region, it is beneficial to ascertain the effects of changing the crop planting structure on water saving and farmland water productivity in the irrigation district. This paper takes Yingke Irrigation District as the background. According to the continuous observation data from 2012 to 2013, Based on the modified Soil and Water Assessment Tool (SWAT) model and taking advantage of monthly scale remote sensing EvapoTranspiration (ET) and crop growth parameters (leaf area index and shoot dry matter), we tested the simulation accuracy of the model, proposed irrigation efficiency calculation methods considering water drainage, and established the scenario analysis method for the spatial distribution of crop planting structure. Finally, we evaluated the changes in water savings in irrigation district projects and resources, the irrigation water productivity and the net income water productivity under different planting structure scenarios. The results indicate that the efficiency of irrigation has increased by 15~20%, while considering drainage, as compared with conventional irrigation efficiency. Additionally, the adjustment of crop planting structure can reduce regional evapotranspiration by 14.9%, reduce the regional irrigation volume by 30%, and increase the net income of each regional water area by 16%.

1. Introduction

Water has been identified as one of the most limiting factors for ecosystem functioning in the arid district due to limited and unevenly distributed freshwater resources and high water demands to support its large cropland area, huge population, and rapid industrialization. Water resources allocation is an important means to realize effective and reasonable distribution of water resources between different regions and users and to promote the efficient and rational use of water resources [1]. The allocation of water resources in an arid irrigation district provides an important scientific basis for the efficient utilization of water resources, the ecological management of the basin, and the sustainable development of the society and economy. This is not only related to the irrigation engineering condition, the water management level, and the application of irrigation technology, but also closely related to a reasonable crop planting structure (spatial-temporal distribution of crop water requirements). Such information is critical for policy makers to design strategies for regional sustainability.
The optimization and adjustment of crop planting structure has long been an important research content of agricultural geography and sustainable development of agriculture, and it has attracted great attention of scholars [2]. Regional crop water requirements are one of the main factors affecting the total irrigation amount. A reasonable arrangement of regional crop planting proportions can reduce crop water requirements in the region, and it can also reduce the total amount of irrigation taking advantage of the irrigation efficiency indicators, which comprehensively reflect the management and engineering conditions of irrigation districts. As to the irrigation efficiency index, Israelsen defined irrigation efficiency as the ratio of irrigation water in the field to the actual imported irrigation water. Irrigation water use efficiency is the ratio of the amount of water available to crops in the field to the total amount of water from the source, and it is an important index to evaluate the efficiency of agricultural water use in irrigation areas. Some scholars have studied the performance indexes of different irrigation systems in different areas [3,4,5,6]. With the development of research on water-saving irrigation, previous studies have shown that water use efficiency can reflect the cyclicity and spatial variability of water [7]. The adjustment of planting structure changes the surface biochemical process, farmland hydrological cycle process, and ecosystem productivity by adjusting crop species, varieties and area. For agricultural water use, it directly affects the total water demand of each crop, causing the total water demand of all crops to change after structural adjustment. Research has shown that when arranging a water-saving agricultural planting structure, the continuity of the agricultural ecological system should be protected [8]. In Korla, the southern Xinjiang Autonomous Region of western China, a typical arid area, the suitable ratio of grain, economic crops, and orchard, while considering the reasonable allocation of water resources, is 26:56:18 [9]. The water requirement of a plant is a key factor for irrigation efficiency, and thus, irrigation efficiency should be changed as agricultural planting structure being changed. However, related studies have focused on (1) the effect of planting structure changes on water requirement and (2) planting structure optimization with limited water resources [10,11].
The distributed hydrological model can be used to evaluate the water use efficiency of irrigated areas in multiple scales, which can provide technical support for the improvement of water-saving in irrigated areas. The Soil and Water Assessment Tool (SWAT) model can predict the impact of different soil types, land use patterns, and management conditions on the hydrological cycle of the basin. According to the comprehensive review of studies on SWAT model by Gassman et al. [12], only a few literatures have conducted simulation and verification research on ET with SWAT model. Arnold et al. simulated ET using the SWAT model and verified ET while using traditional methods. Immerzeel and Droogers rate the simulated ET of SWAT model based on remote sensing ET. The use of remote sensing monitoring of regional distribution ET directly to the SWAT model simulation of ET rate is a relatively new model research method. Cui used the improved SWAT model to analyze the simulation of irrigation water consumption in the southern multi source irrigation area [13]. However, in the field of hydrological models, the key to using the SWAT model for ET simulation is to select reasonable soil and crop growth parameters. At present, there are few related studies in this area [14,15,16,17,18,19,20]. Based on the current water resources situation, most scholars discuss the planting structure adjustment policy and future development trends from the perspective of regional plant structure evolution, hydrological change response, and structural adjustment [21,22].
The main objective of this study were (i) calculating the irrigation efficiency, considering water draining, based on a further simplification of the irrigation efficiency calculation formula and the definition of the boundary of the spatial scale; (ii) setting up different planting structures and evaluating the changes in water saving amount, the irrigation water productivity, and the net income water productivity in different scenarios of irrigation district projects.

2. Materials and Methods
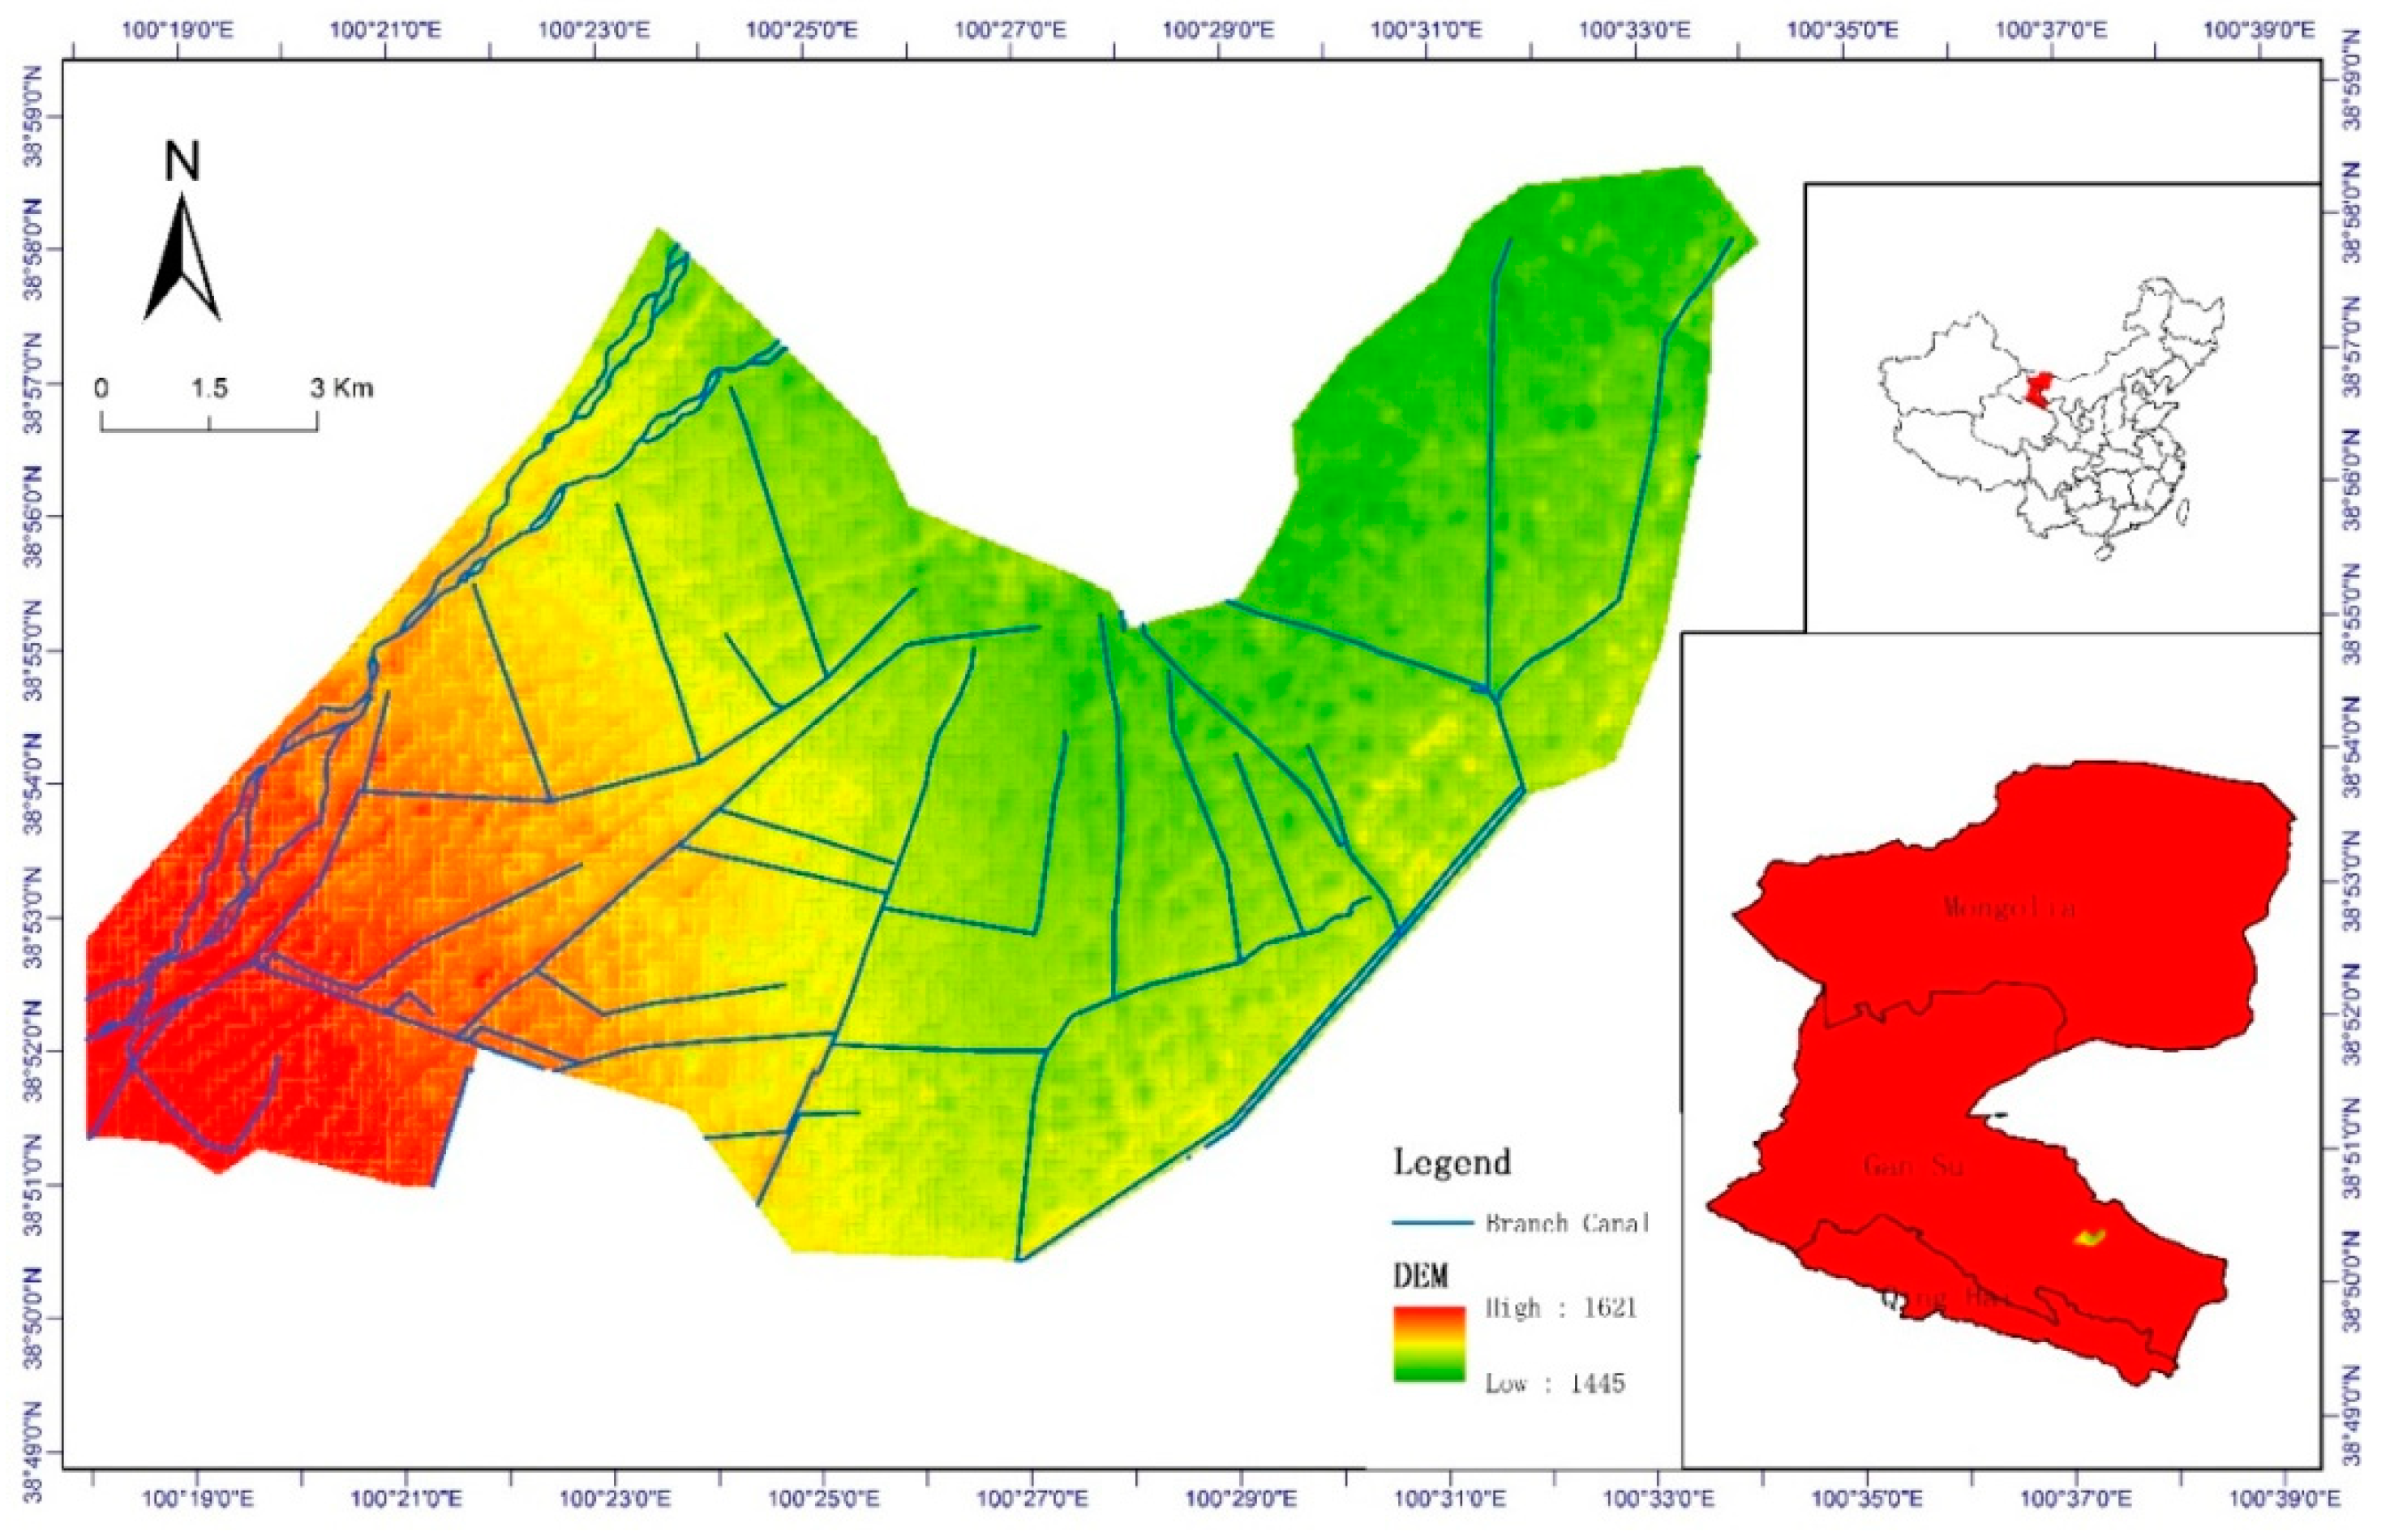
2.1. Study Area

The Yingke irrigation district is located in the middle reaches of the Heihe River in Ganzhou District, and the designed irrigation area is 192.2 km2 (Figure 1). The irrigation district is a typical well-canal combined irrigation district and it has an irrigation network with a water supply in Heihe as the backbone and the irrigation well pumping as a supplement. The Yingke irrigation district is in an inland arid climate zone with an annual average temperature of 6.5–7.0 °C, a minimum temperature of −28 °C, and a maximum temperature of 33.5 °C. The annual sunshine duration is over 3000 h, and the frost-free period is approximately 140 days. The annual average precipitation in the Yingke irrigation district is 125 mm and gradually decreases from east to west. The precipitation is concentrated from May to September, and its precipitation accounts for 80–90% of the annual precipitation, especially in July and August, which accounts for more than 40% of the annual precipitation. The main crops in the Yingke irrigation district in 2013 were corn for seed (41.49%), field corn (15.20%), vegetables (10.94%), and spring wheat (5.26%).

2.2. Methods

2.2.1. Crop Growth Indicators

Sixteen soil sampling points were arranged on Yingke Irrigation District, and the growth indicators of each growth stage were monitored at the corresponding soil moisture content monitoring points, including leaf area index (LAI), plant height, biomass, and yield. The leaf area index was directly determined by ACCUPAR-LP80 [23,24]. Statistics of typical crop yields when crops being harvested, fertilization and irrigation practices, and crop calendars were based on local farmers and consultants.

2.2.2. SWAT Model Input Parameters

The SWAT model database can be divided into two categories: spatial database and attribute database. The spatial database mainly includes digital elevation model (DEM), soil type distribution map, and land use map. The attribute database mainly includes meteorological data and ET data. DEM comes from geospatial database with spatial resolution of 90 m. Soil type map comes from the Chinese academy of sciences, Nanjing soil database, and comprehensive national soil classification. Land use type map is obtained through visual interpretation of LANDSATTM images, real-time field measurement data is taken into account, and land use interpretation is completed by combining with manual correction method [25,26].

2.2.3. Remote Sensing ET

The ET data of remote sensing monitoring month used in this study were verified by the institute of remote sensing application of the Chinese academy of sciences on the basis of ASTER/TM and AVHRR/MODIS remote sensing data, and the calculation results of ETWatch model [27,28].

2.2.4. Net Crop Irrigation System

Under the assumption that the soil moisture is constant, the net irrigation water requirement is equal to the crop water requirement minus the effective precipitation and the direct consumption of ground water [29,30,31,32]. According to the known data, the annual average net irrigation quota for various crops during the growth period in the Yingke irrigation district is shown in Table 1.

2.2.5. Crop Cost and Price

The unit yields of major crops, the market prices and the labor costs per unit area in the Ganzhou district according to survey data are shown in Table 2.

3. Mathematical Model

3.1. SWAT Model

The SWAT model is a comprehensive and distributed hydrological model with a physical basis, which has been used in many fields, such as water and nutrient cycling in irrigation districts [35,36]. Based on the DEM and the land use soil classification map, the research area was divided into 13 sub-basins and 275 hydrological response units, as shown in Figure 2. In this study, we calibrated and validated the model based on the ET value of the daily scale and the crop growth data of the spatial scale of the hydrological response unit (HRU). The main parameters of the model were obtained and validated by applying the remote sensing inversion of ET values (2012 and 2013) at a monthly scale. The remote sensing inversion of ET values in 2012 and 2013 and the simulation results of the crop growth are shown in Figure 3 and Figure 4.

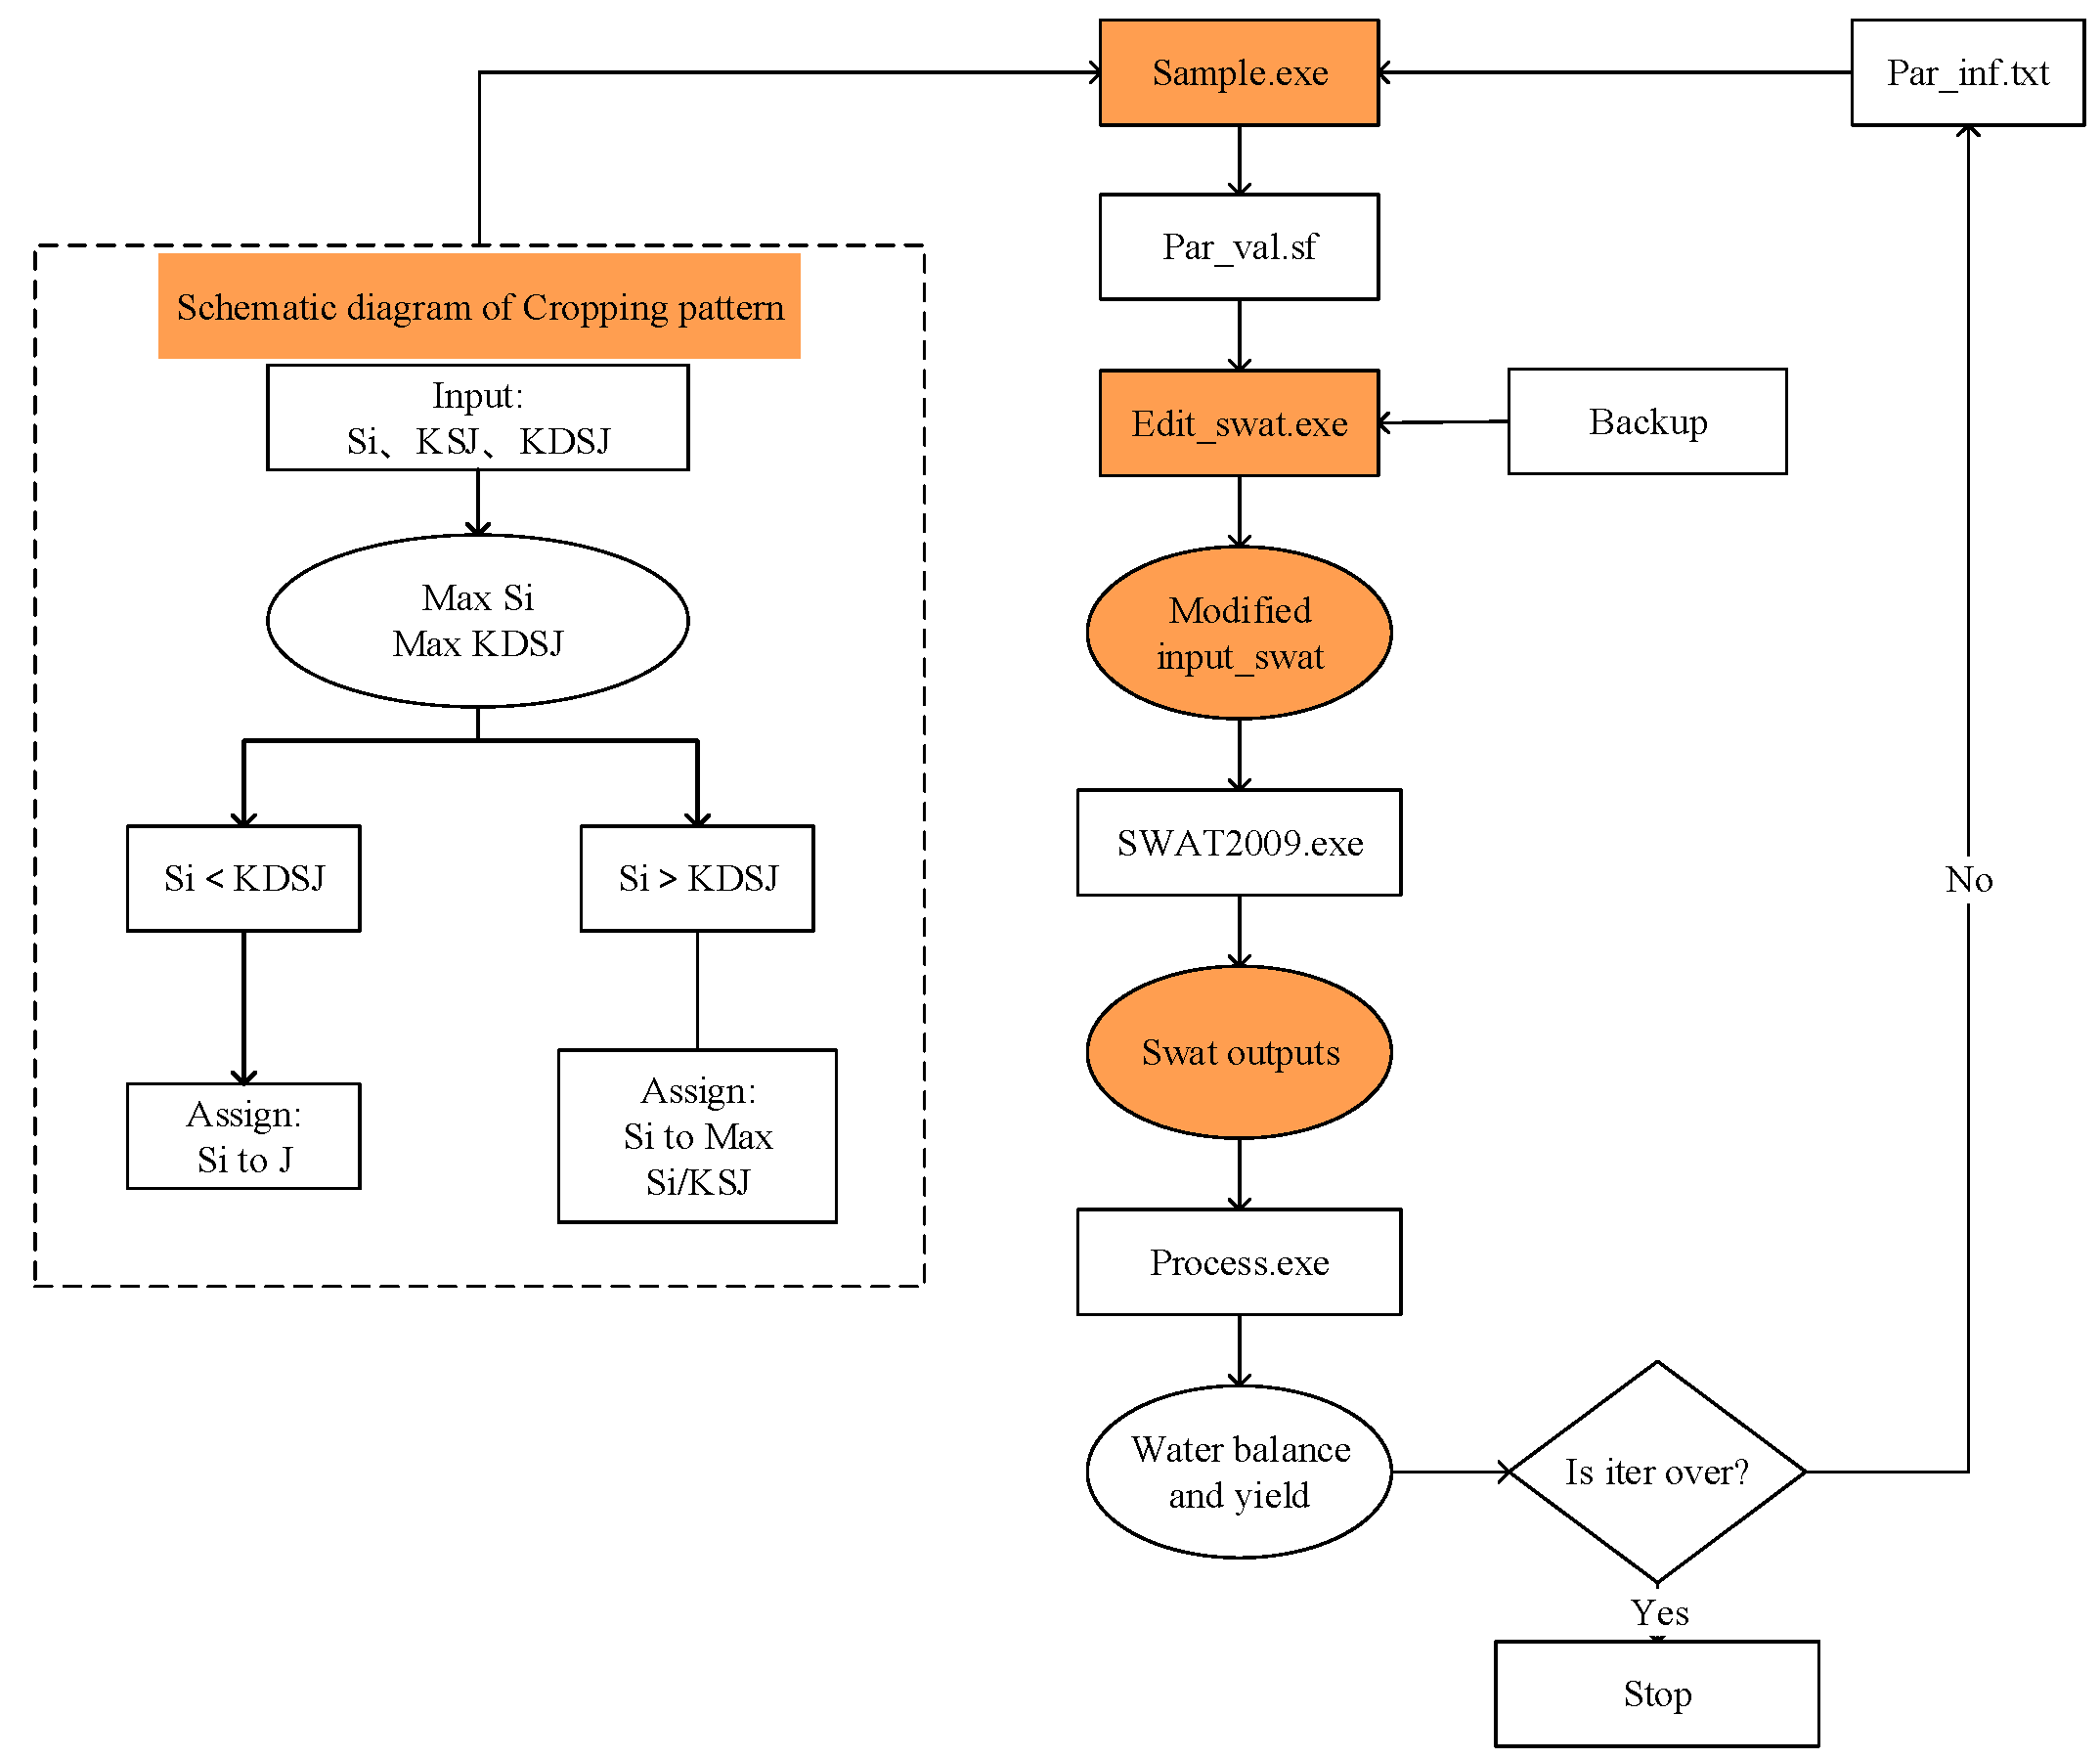
3.2. Spatial Distribution Model of Crop Planting Structure

The generation model of the crop planting structure [37,38,39] was established while using a greedy algorithm that forms the spatial distribution of different crops and the input files of the SWAT model according to the number of crop types, the sown area ratio of the specified crop type, the crop sowing/harvesting time, as well as the time and dosage of irrigation and fertilization. The detailed flow chart of the model is shown in Figure 5.
In Figure 5, i is the area of the i-th HRU(Hydrologic Research Unit), KSJ is the total area of the j-th type of crops, KDSJ is the area gap of the j-th type of crops, sample.exe is the crop type distribution procedure, par_inf.txt is the crop type occupying text, par_val is the calculated results of individual crop type distributions, edit_swat.exe is the input file modification procedure of the SWAT model, modified input_swat is the input file modification results of the swat model, and process.exe is the output results manipulation procedure of the SWAT model, which can obtain water balance factors and yields of the whole basin, the sub-basin, and the HRU.

3.3. Irrigation Efficiency

Irrigation water use efficiency refers to a period into the field of water that can be utilized by crops and water ratio of the total irrigation water, reflecting the whole irrigation canal system water and field water condition, and being a measure of water from water source to field crops absorption use in the process of irrigation water use level of an important indicator, it can comprehensively reflect the status of irrigated area projects, water management, and irrigation technology [40,41,42]. The calculation formula of irrigation water utilization ratio used in this paper is shown in formula (1).
η 1 = i = 1 n ( E T i P e i ) × A i ( Q w + Q m c ) S W d
where η I is irrigation efficiency in the irrigated district scale, S W d is the water loss from the irrigated district (m3), Q m c refers to the actual water diversion of the Yinke irrigation district main canal (m3), Q w is the water of well irrigation in the Yinke irrigation district (m3), P e i refers to the effective rainfall of the entire growth period for the i type of crop (m3), E T i is the evapotranspiration of the entire growth period for the i type of crop extracted through the remote sensing retrieval data in the Yinke irrigation district (mm), and A i is the total area of the i type of crop in the Yinke irrigation district (m2). There are three types of crops (corn, wheat, and vegetable) in the control area of every branch canal. When S W d is zero, the result is the traditional calculated formula for irrigation efficiency at the irrigation district scale [43].

3.4. Evaluation Indicators of the Adjustment of Planting Structure

3.4.1. Water Saving Volume

Ignoring the change in soil moisture, the formulas for water balance of the irrigation district scale are:
i = 1 n E T i × A i = Q t × η I + i = 1 n P e i × A i
Q S = Q t ( Q w Q m c )
Q s = ( i = 1 n E T i × A i i = 1 n P e i × A i ) η I ( Q w + Q m c )
where Q t is the water consumption in the irrigation district under different planting structures and η I is the irrigation efficiency at the irrigation district scale considering drainage and is calculated using formula (1). Finally, Q s is the amount of water that is saved in the Yingke irrigation district [44,45].

3.4.2. Irrigation Water Productivity

The production efficiency of irrigation water refers to the grain crop yield produced by unit irrigation water in the region [46,47,48]. The calculation formula is shown in formulas (5)–(7):
W U E I = i = 1 n Y i Q t × A i
W U E I = W U E I W U E I
W U E I = i = 1 n Y i × A i ( i = 1 n E T × A i i = 1 n P e i × A i ) η I
where W U E I is the irrigation water productivity (kg/m3) in the Yingke irrigation district, Yi is the economic output (yuan/ha) of the i-th type of crops, W U E I is the average value (yuan/ha) of irrigation water productivity in the Yingke irrigation district in 2012 and 2013, and W U E I is the variation of irrigation water productivity (yuan/m3) in the Yingke irrigation district.

3.4.3. Net Income Water Productivity

The calculation formula of Net Income Water Productivity [49] is shown in formula (8)–(10):
W U E n e t = i = 1 n Y n i × A i Q t
W U E n e t = W U E n e t W U E n e t
W U E n e t = i = 1 n Y n i × A i ( i = 1 n E T i × A i i = 1 n P e i × A i ) η I W U E n e t
where W U E n e t is the irrigation water productivity (yuan/m³) in the Yingke irrigation district, Y n i is the net income (yuan/ha) of the i-th type of crops, W U E n e t is the average value (yuan/ha) of irrigation water productivity in the Yingke irrigation district in 2012 and 2013, and W U E n e t is the variation in the net income water productivity (yuan/m³) in the Yingke irrigation district.

3.5. Statistical Indicators

The regression and determination coefficients [50] are defined as:
b = i = 1 n ( Q i O ¯ ) ( P i P ¯ ) i = 1 n ( O i O ¯ )
R 2 = { i = 1 n ( O i O ¯ ) ( P i P ¯ ) [ i = 1 n ( O i O ¯ ) 2 ] 0.5 [ i = 1 n ( P i P ¯ ) 2 ] 0.5 }
The root mean square error, which characterizes the variance of the errors.
RMSE = [ i = 1 n ( ( P i Q i ) ) 2 n ] 0.5
The average absolute error, which expresses the size of estimation errors as an alternative to RMSE
AAE = [ i = 1 n | Q i P i | n ]
The modelling efficiency (EF, non-dimensional), which is the ratio of the mean square error to the variance in the observed data, subtracted from unity [51]:
EF = 1 i = 1 n ( O i P ¯ ) 2 i = 1 n ( O i O ¯ ) 2
where Q i and P i are observations and the model outputs at the ith time point or in the ith grid, respectively, and n is the number of paired data points.

4. Results and Discussions

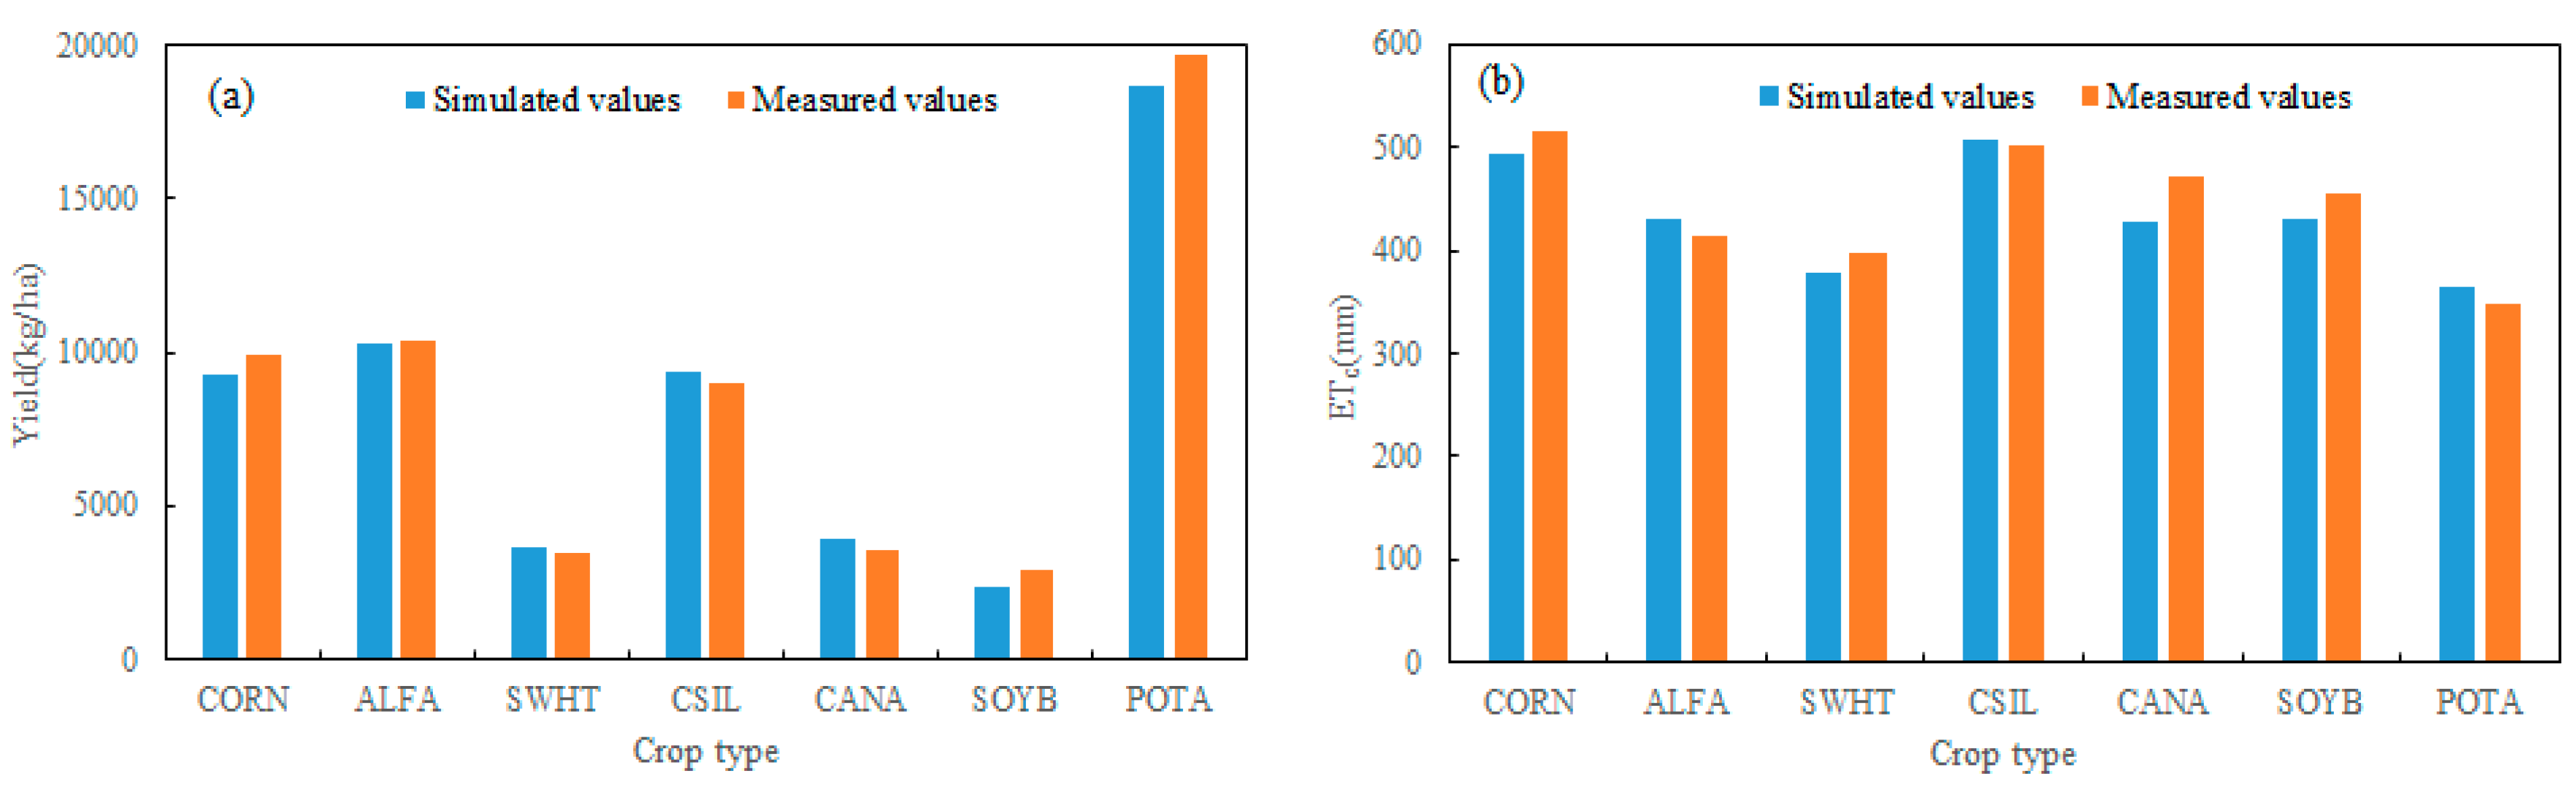
4.1. SWAT Model Verification

According to the comparison diagram between the simulated and the measured values of the LAI model, the LAI and the determination coefficients of the measured values that were simulated by the modified SWAT model are 0.94 and 0.98, the root mean square errors are 0.25 and 0.53, and the validity indices of the model are 0.95 and 0.89. According to the comparison diagram between the simulated and the measured values of shoot dry matter, the determination coefficients of the measured value simulated by the modified SWAT model are 0.99 and 0.92, the root mean square errors are 1.16 and 1.60 t/ha, and the validity indices of the model are 0.97 and 0.90. According to the comparison diagram between the simulated and the measured values of the monthly ET model, the monthly ET simulated by the modified SWAT model, and the determination coefficients of the monthly ET obtained by remote sensing inversion are 0.87 and 0.47, the root mean square errors are 7.40 and 36.62 mm/month, and the validity indices of the model are 0.76 and 0.42.
Consequently, the decision coefficients, the root mean square errors and the validity indices of the modified SWAT model for the LAI, shoot dry matter, and the simulation of monthly ET are all in a reasonable range (Table 3). In other words, the simulation results reflect the evapotranspiration and growth of crops and can be used to simulate the water circulation process and to analyse the irrigation efficiency in irrigation districts [52,53,54,55,56,57].

4.2. Irrigation Efficiency Considering Drainage

The values of the irrigation efficiency in the Yingke irrigation district in 2012 and 2013 are, respectively, 0.51 and 0.48 when calculated by Equation (1). However, the values of the irrigation efficiency are 0.59 and 0.56 considering drainage, which is a 16.9% and 16.3% improvement when compared with the traditional method. The Yingke irrigation district is an arid irrigation district, and the runoff yields of the whole irrigation district are, respectively, 14.70 and 14.19 million m3, as calculated by the modified SWAT model (Table 4), which accounts for 14.5% and 14% of the total irrigation amount in irrigation district.
Zhang [58,59] has researched the characteristics of water circulation in the Hetao irrigation district while using the distributed hydrological model and identified that the amount of drainage is 12.6% of the sum of the amount of irrigation and the amount of precipitation. This paper is more consistent with these results, and the effective coefficients of irrigation water utilization when considering drainage more accurately reflects the actual situation of water consumption in the irrigation district.
According to the comparison between traditional irrigation efficiency and irrigation efficiency while considering drainage, the irrigation efficiency considering drainage is 15% more than the traditional irrigation efficiency. Thus, it is necessary to consider the water flowing out of the spatial scale. Considering the original loss of water quantity will only result in a lower calculated result.

4.3. Scenario Analysis

According to the Figure 6, the yields and ET values of different types of crops simulated by the model are consistent with the statistical values and the error is less than 10% [60]. In terms of yield, POTA (Potato) has the highest yield of 18,678 kg/ha, followed by CORN (Corn for seed), CSIL (Field corn), and ALFA( Alfalfa), with yields of 9233 kg/ha, 9371 kg/ha, and 10,283 kg/ha, respectively. SOYB (Soybean) yield is the smallest, only 2403 kg/ha. In terms of ET, the ET of CSIL is the highest, which reached 506 mm, followed by CORN, ALFA, SOBY, and CANA (Spring canola-Argentine), the ET is 494 mm, 430 mm, 429 mm, and 426 mm, respectively, while the ET of POTA is the lowest, only 365 mm, of which SWHT (Spring wheat) is higher than POTA. In terms of ET, the ET of CSIL is the highest, which reached 506 mm, followed by CORN, ALFA, SOBY, and CANA, the ET is 494 mm, 430 mm, 429 mm and 426 mm, respectively, while the ET of POTA is the lowest, only 365 mm, of which SWHT is higher than POTA In terms of the difference in evapotranspiration, the difference between CORN and POTA is substantial, while the differences among the others are small.
According to the analysis results, CSIL has the largest amount of ET, but its yield is not the largest, while POTA with a small amount of ET reached the maximum yield in the selected crops, for the SWHT, CANA, and SOYB with small yields, the ET are relatively large. Therefore, the variation relationship between yield and ET of different crops should be analyzed according to the species of crops.

4.3.1. Water Saving Analysis

The average values of evapotranspiration in the Yingke district in 2012 and 2013 is 65.343 million m3, and the range of evapotranspiration in the Yingke district under different planting structures is 55.56~67.60 million m3, which means that the variation range is −14.98–3.45% as compared with the current evapotranspiration rates in the Yingke district. From the aspect of the water requirement in the irrigation district, 9.786 million m3 of the water requirements can be reduced at most. The average effective precipitation in 2012 and 2013 is 15.176 million m3, and the irrigation efficiency while considering drainage is 0.57, so the water diversion range of the canal head in the irrigation district is 70.050–100.820 million m3. Thus, the water diversion range of the canal head in the irrigation district can be reduced by the adjustment of planting structures and the amount of water saved can be up to 30.77 million m3, which accounts for 30.52% of the total irrigation water in the current irrigation district. The water diversion range of the canal head in the irrigation district can be reduced by up to 31.345 million m3. Under the condition of constant pumping irrigation water, the decrease in amplitude is up to 45.56%. The proportion of corresponding planting structure is shown in Table 5 and Figure 7.
Therefore, it is feasible to lower the pumping irrigation and raise the water level. From the perspective of the proportion of water-saving potential being generated by various measures, the amount of water-saving generated by reducing irrigation quota through strengthening water management and providing irrigation water utilization coefficient through implementing water-saving engineering measures still accounts for the majority, but the amount of water saving generated by optimizing planting structure is also considerable.
According to the relationship between the amount of water saved and the planting areas (Table 6), the amount of water saved is inversely proportional to the planting areas of crops with high water requirements (such as CORN and CSIL), which means that the larger the planting areas are, the smaller the amount of water saving is. To the contrary, the amount of water saved is proportional to the planting areas of crops with low water requirements, such as SWHT and POTA, which means that the larger the planting areas are, the larger the amount of water saving is. The results are similar to those of previous studies [61].

4.3.2. Irrigation Water Productivity Analysis

The average value of irrigation water productivity in the Yingke district in 2012 and 2013 is 6.63 yuan/m3, and the range of irrigation water productivity in the Yingke district under different planting structures is 2.33–6.72 yuan/m, which means that the variation range is −64.86–1.36% as compared with the current irrigation water productivity in the Yingke district. The crop with the largest planting area is corn for seed and its unit price is also higher (Shown Table 2). Thus, the irrigation water productivity of the corn for seed in the Yingke district is relatively high. From the point of view of irrigation water productivity, 1.36% of the irrigation water productivity can be increased at most under 800 combinations of scenarios. The total irrigation amount in this circumstance is 87.61 million m³ and the total water requirement is 55.02 million m3, both of which are less than the amount of water that is consumed in the irrigation district. The proportion of the corresponding planting structure is shown in Table 5 and Figure 7. Therefore, the irrigation water productivity in the current Yingke irrigation district is high, and there is an optimal scenario that is larger than the current, but the increase should be small.
According to the relationship between irrigation water productivity [62] and planting areas (Table 6), the irrigation water productivity is proportional to the planting areas of crops with high yields and unit prices, such as corn for seed and potatoes, which means that the larger the planting areas are, the bigger the irrigation water productivity is. To the contrary, the irrigation water productivity is inversely proportional to the planting areas of crops with low yields and unit prices, such as wheat and soybean.

4.3.3. Net Water Productivity Analysis

The average value of net water productivity in the Yingke district in 2012 and 2013 was 2.73 yuan/m3, and the range of net water productivity in the Yingke district under different planting structures was 1.94–3.17 yuan/m3, which means the variation range is −28.93–16.11% when compared with the current net water productivity in the Yingke district. From the point of view of the net income of crops, the net income of potatoes and corn for seed are the largest and they are 923.64 and 1374.8 yuan/hm2. Thus, increasing the planting area ratio of crops with a high net income can greatly improve the net water productivity in the whole irrigation district. The optimal planting structure is shown in Table 5 and Figure 7 under the existing planting scenario combinations
According to the correlation coefficients of the net water productivity [63] and the planting areas of crops, the increase in net water productivity is inversely proportional to the planting areas of crops with low net income, such as wheats. The correlation coefficient is −0.52; the larger the planting areas of wheats are, the smaller the increase in net water productivity is. To the contrary, the increase in net water productivity is proportional to the planting areas of crops with high net income, such as potatoes. The correlation coefficient is 0.94; the larger the planting areas of potatoes, the larger the increase in net water productivity.
This shows that reducing the area of crops with low water efficiency and low economic value and increasing the area of crops with high water efficiency and high economic value can increase farmers’ income and reduce agricultural investment [64].

5. Conclusions

Based on the improved SWAT model, the observation data of yingke irrigated area from 2012 to 2013 were used to calibrate and verify the SWAT model, and a higher accuracy was obtained. It shows that the simulation results can better reflect the evapotranspiration and growth of crops, so it can be used to simulate the water cycle process and analyze the irrigation efficiency of irrigation areas.
The scenario analysis method of the spatial distribution of crop planting structure was established to analyze the changes of irrigation efficiency under different planting structure scenarios. When considering the irrigation efficiency of drainage, the actual water consumption in the irrigated area was more accurately reflected as compared with the conventional irrigation efficiency, and the irrigation efficiency was improved by 15–20%.
The adjustment of crop planting structure can change crop water requirement and economic output. Planting crops with low water consumption and high economic benefits can effectively reduce regional evapotranspiration by 14.9%, regional irrigation by 30%, and net income by 16%.
This paper aims at changing the water and material circulation process of irrigated areas through rational allocation of crop planting structure, increasing water-saving amount in irrigated areas, and improving farmland water production efficiency, which is helpful for guiding rational allocation of water resources in irrigated areas. More comprehensive crop species will be selected for analysis in subsequent studies.

Author Contributions

Conceptualization, X.H., Z.W. and B.Z.; Methodology, X.H.; Software, C.H. and J.S.; Validation, X.H., Z.W. and B.Z.; Formal Analysis, X.H.; Investigation, B.Z.; Resources, C.H. and J.S.; Data Curation, Z.W.; Writing-Original Draft Preparation, X.H.; Writing-Review & Editing, X.H. and Z.W.; Supervision, C.H. and J.S.; Project Administration, Z.W. and B.Z.; Funding Acquisition, Z.W. and B.Z.

Funding

This study was supported by the National Key R&D Program of China (2017YFC0403202), the Chinese National Natural Science Fund (91425302, 51479210, and 51822907), IWHR Research & Development Support Program (ID0145B082017 and ID0145B742017), and the Special Fund of State Key Laboratory of Simulation and Regulation of Water Cycle in River Basin, China Institute of Water Resources and Hydropower Research (SKL2018CG03).

Conflicts of Interest

The authors declare no conflict of interest.

References

  1. Peng, L.; He, Y.; Mu, Z.; Chuan, L.; Fan, G. Evaluation of water resources allocation schemes of oasis areas based on water resource security assessment: A case study of Karamay city. South-to-North Water Transf. Water Sci. Technol. 2017, 15, 26–33. [Google Scholar]
  2. Jiang, S.; Huang, T.; Cao, X.; Jin, J.; Xu, H. Model for optimization of crop-planting structure adjustment in pond-irrigation area of Jianghuai Hilly Region. Water Resour. Hydropower Eng. 2018, 49, 217–223. [Google Scholar]
  3. Bos, M.G.; Burton, M.A.; Molden, D.J. Irrigation and Drainage Performance Assessment: Practical Guidelines; CABI: Wallingford, UK, 2005. [Google Scholar]
  4. Molden, D.; Burton, M.; Bos, M.G. Performance assessment, irrigation service delivery and poverty reduction: Benefits of improved system management. Irrig. Drain. 2007, 56, 307–320. [Google Scholar] [CrossRef]
  5. Huang, Y.; Qu, Z. Research on the Irrigation Water Use Efficiency in Different Spatial Scales—A case Study of Chaersen Irrigation District in Inner Mongolia. Water Sav. Irrig. 2017, 1, 45–49. [Google Scholar]
  6. Bos, M.G. Standards for irrigation efficiencies of ICID. J. Irrig. Drain. Div. 1979, 105, 37–43. [Google Scholar]
  7. Wang, X.; Wu, J.; Wang, B. Spatial variability of siol moisture in hilly and gully Loess Plateau. Chin. J. Ecol. 2015, 34, 2568–2575. [Google Scholar]
  8. Murtaza, G.; Ghafoor, A.; Owens, G.; Qadir, M.; Kahlon, U.Z. Environmental and Economic Benefits of Saline-Sodic Soil Reclamation Using Low-quality Water and Soil Amendments in Conjunction with a Rice–Wheat Cropping System. J. Agron. Crop. Sci. 2010, 195, 124–136. [Google Scholar] [CrossRef]
  9. Cao, X.; Ayitursun, S.; Jin, X.; Zhou, Y. Planting Structure Optimization in the Arid Area with Constrained Water Resources: A Case Study of Korla, Xinjiang. Resour. Sci. 2011, 34, 120–122. [Google Scholar]
  10. Agrell, P.J.; Stam, A.; Fischer, G.W. Interactive multiobjective agro-ecological land use planning: The Bungoma region in Kenya. Eur. J. Oper. Res. 2004, 158, 194–217. [Google Scholar] [CrossRef]
  11. Wang, Y.B.; Wu, P.T.; Zhao, X.N.; Li, J.L.; Lv, L.; Shao, H.B. The Optimization for Crop Planning and Some Advances for Water-Saving Crop Planning in the Semiarid Loess Plateau of China. J. Agron. Crop. Sci. 2010, 196, 55–65. [Google Scholar] [CrossRef]
  12. Gassman, P.W.; Reyes, M.R.; Green, C.H.; Arnold, J.G. The Soil and Water Assessment Tool: Historical Development, Applications, and Future Research Directions; Center for Agricultural and Rural Development, Iowa State University: Heady Hall, AI, USA, 2007. [Google Scholar]
  13. Cui, Y.; Wu, D.; Wang, S.; Wen, J.; Wang, H. Simulation and analysis of irrigation water consumption in multi-source water irrigation districts in Southern China based on modified SWAT model. Trans. Chin. Soc. Agric. Eng. 2018, 34, 94–100. [Google Scholar]
  14. Zhang, B.; Xu, D.; Liu, Y.; Li, F.; Cai, J.; Du, L. Multi-scale evapotranspiration of summer maize and the controlling meteorological factors in north China. Agric. For. Meteorol. 2016, 216, 1–12. [Google Scholar] [CrossRef]
  15. Zhou, J.; Shi, P.; Li, L. Study on the Planting Industry Structure Adjustment and Its Impact on the Water Demand of Crops in Minqin Oasis. J. Nat. Resour. 2016, 5, 823–832. [Google Scholar]
  16. Liu, Y.; Pereira, L. Validation of FAO methods for estimating crop coefficients. Trans. Chin. Soc. Agric. Eng. 2000, 16, 26–30. [Google Scholar]
  17. Pereira, L.; Cai, L.; Hann, M. Farm water and soil management for improved water use in the North China plain. Irrig. Drain. 2003, 52, 299–317. [Google Scholar] [CrossRef]
  18. Liu, Y.; Luo, Y. A consolidated evaluation of the FAO-56 dual crop coefficient approach using the lysimeter data in the North China Plain. Agric. Water Manag. 2010, 97, 31–40. [Google Scholar] [CrossRef] [Green Version]
  19. Tolk, J.; Howell, T. Measured and simulated evapotranspiration of grain sorghum grown with full and limited irrigation in three high plains soils. Trans. ASAE 2001, 44, 1553–1558. [Google Scholar]
  20. Zhao, N.; Liu, Y.; Cai, J.; Paredes, P.; Rosa, R.D. Dual crop coefficient modelling applied to the winter wheat–summer maize crop sequence in North China Plain: Basal crop coefficients and soil evaporation component. Agric. Water Manag. 2013, 117, 93–105. [Google Scholar] [CrossRef]
  21. Qi-Feng, L.I.; Zhang, H.L.; Chen, F. Changes in spatial distribution and planting structure of major crops in northeast China. J. China Agric. Univ. 2008, 13, 74–76. [Google Scholar]
  22. Pereira, L.S.; Cordery, I.; Iacovides, I. Improved indicators of water use performance and productivity for sustainable water conservation and saving. Agric. Water Manag. 2012, 108, 39–51. [Google Scholar] [CrossRef]
  23. Pan, G.Y.; Zhou, L.Q.; Shi, Z. Estimating Rice LAI Based on Digital Camera and Image Processing. Key Eng. Mater. 2012, 500, 586–591. [Google Scholar] [CrossRef]
  24. Paredes, P.; Wei, Z.; Liu, Y.; Xu, D.; Xin, Y.; Zhang, B.; Pereira, L.S. Performance assessment of the FAO AquaCrop model for soil water, soil evaporation, biomass and yield of soybeans in North China Plain. Agric. Water Manag. 2015, 152, 57–71. [Google Scholar] [CrossRef] [Green Version]
  25. Arnold, J.G.; Allen, P.M.; Bernhardt, G. A comprehensive surface-groundwater flow model. Hydrology 1993, 142, 47–69. [Google Scholar] [CrossRef]
  26. Droogers, P.; Immerzeel, W.W.; Terink, W. Modeling water resources trends in Middle East and North Africa towards 2050. Hydrol. Earth Syst. Sci. Discuss. 2012, 9, 3101–3114. [Google Scholar] [CrossRef]
  27. Paulmoiwo, J.; Yang, Y.; Yan, N.; Wu, B. Comparison of evapotranspiration estimated by ET-Watch with that derived from combined GRACE and measured precipitation data in Hai River Basin, North China. Int. Assoc. Sci. Hydrol. Bull. 2011, 56, 249–267. [Google Scholar]
  28. Choi, M.; Kustas, W.P.; Anderson, M.C.; Allen, R.G. An Intercomparison of three remote sensing-based EvapoTranspiration (ET) schemes for a corn and soybean production region during SMACEX. Agric. For. Meteorol. 2008, 149, 2082–2097. [Google Scholar] [CrossRef]
  29. Tian, H.; Lu, C.; Chen, G.; Xu, X.; Liu, M.; Ren, W.; Tao, B.; Sun, G.; Pan, S.; Liu, J. Climate and land use controls over terrestrial water use efficiency in monsoon Asia. Ecohydrology 2011, 4, 322–340. [Google Scholar] [CrossRef]
  30. Valipour, M. Increasing irrigiation efficiency by management strategies: Cutback and surge irrigiation. J. Agric. Biol. Sci. 2013, 8, 35–43. [Google Scholar]
  31. Usman, K. Effect of Phosphorus and Irrigation Levels on Yield, Water Productivity, Phosphorus Use Efficiency and Income of Lowland Rice in Northwest Pakistan. Rice Sci. 2013, 20, 61–72. [Google Scholar] [CrossRef]
  32. Jarosz, N.; Beziat, P.; Bonnefond, J.; Brunet, Y.; Calvet, J.; Ceschia, E.; Elbers, J.; Hutjes, R.; Traulle, O. Effect of land use on carbon dioxide, water vapour and energy exchange over terrestrial ecosystems in Southwestern France during the CERES campaign. Biogeosci. Discuss. 2009, 6, 2755–2784. [Google Scholar] [CrossRef]
  33. Konyar, K.; Howitt, R.E. The cost of the Kyoto Protocol to U.S. crop production: Measuring crop price, regional acreage, welfare, and input substitution effects. J. Agric. Resour. Econ. 2000, 25, 347–367. [Google Scholar]
  34. Hasan, B.; Higano, Y.; Yabar, H.; Devkota, M.; Lamers, J. Conservation agriculture practices in salt-affected, irrigated areas of Central Asia: Crop price and input cost variability effect on revenue risks. Sustain. Agric. Res. 2015, 4, 1–20. [Google Scholar] [CrossRef]
  35. Bouraoui, F.; Benabdallah, S.; Jrad, A.; Bidoglio, G. Application of the SWAT model on the Medjerda river basin (Tunisia). Phys. Chem. Earth Parts A/B/C 2005, 30, 497–507. [Google Scholar] [CrossRef]
  36. Jayakrishnan, R.; Srinivasan, R.; Santhi, C.; Arnold, J.G. Advances in the application of the SWAT model for water resources management. Hydrol. Process. 2005, 19, 1108–1120. [Google Scholar] [CrossRef]
  37. Reddy, M.J.; Kumar, D.N. Evolving strategies for crop planning and operation of irrigation reservoir system using multi-objective differential evolution. Irrig. Sci. 2008, 26, 177–190. [Google Scholar] [CrossRef]
  38. Wu, B.; Li, Q. Crop planting and type proportion method for crop acreage estimation of complex agricultural landscapes. Int. J. Appl. Earth Obs. Geoinf. 2012, 16, 101–112. [Google Scholar] [CrossRef]
  39. Chen, Y.; Zhang, X.; Wang, X.; Luo, W. Extraction of crop planting structure in seasons prone to waterlogging using Landsat8 OLI and MODIS data. Trans. Chin. Soc. Agric. Eng. 2014, 30, 165–173. [Google Scholar]
  40. Pereira, L.S. Higher performance through combined improvements in irrigation methods and scheduling: A discussion. Agric. Water Manag. 1999, 40, 153–169. [Google Scholar] [CrossRef]
  41. Solomon, K.H.; Burt, C.M. Irrigation sagacity: A measure of prudent water use. Irrig. Sci. 1999, 18, 135–140. [Google Scholar] [CrossRef]
  42. Wolters, W. Influences on the Efficiency of Irrigation Water Use. In Wageningen: ILRI; Publication/International Institute for Land Reclamation and Improvement 51; Publication/International Institute for Land Reclamation and Improvement: Wageningen, The Netherlands, 1992; p. 150. ISBN 9789070754297. [Google Scholar]
  43. Williams, J. The erosion-productivity impact calculator (EPIC) model: A. case history. Philos. Trans. R. Soc. Lond. Ser. B Boil. Sci. 1990, 329, 421–428. [Google Scholar] [CrossRef]
  44. Kang, S.; Davies, W.J.; Shan, L. Water Saving Agriculture and Sustainable Use of Water and Land Resources; Shaanxi Science & Technology Press: Shanxi, China, 2003; Volume 2. [Google Scholar]
  45. Yang, F.; Tang, D.S.; Yang, J. Apply the Compared Estimate Method to the Calculation of the Volume of Frugal Water in Water Saving Projects. Water Conserv. Sci. Technol. Econ. 2007, 13, 219–221. [Google Scholar]
  46. Kadigi, R.M.J.; Kashaigili, J.J.; Mdoe, N.S. The economics of irrigated paddy in Usangu Basin in Tanzania: Water utilization, productivity, income and livelihood implications. Phys. Chem. Earth Parts A/B/C 2004, 29, 1091–1100. [Google Scholar] [CrossRef]
  47. Steduto, P.; Hsiao, T.C.; Fereres, E. On the conservative behavior of biomass water productivity. Irrig. Sci. 2007, 25, 189–207. [Google Scholar] [CrossRef]
  48. Li, Q.; Chen, Y.; Liu, M.; Zhou, X.; Yu, S.; Dong, B. Effects of irrigation and planting patterns on radiation use efficiency and yield of winter wheat in North China. Agric. Water Manag. 2008, 95, 469–476. [Google Scholar] [CrossRef]
  49. Tian, H.; Chen, G.; Liu, M.; Zhang, C.; Su, G.; Lu, C.; Xu, X. Model estimates of net primary productivity, evapotranspiration, and water use efficiency in the terrestrial ecosystems of the southern United States during 1895–2007. For. Ecol. Manag. 2010, 259, 1311–1327. [Google Scholar] [CrossRef]
  50. Tisak, J. Determination of the Regression Coefficients and Their Associated Standard Errors in Hierarchical Regression Analysis. Multivar. Behav. Res. 1994, 29, 185. [Google Scholar] [CrossRef] [PubMed]
  51. Haie, N.; Keller, A.A. Effective Efficiency as a Tool for Sustainable Water Resources Management. JAWRA J. Am. Water Resour. Assoc. 2008, 44, 961–968. [Google Scholar] [CrossRef]
  52. Luo, Y.; He, C.; Sophocleous, M.; Yin, Z.; Hong, R.; Ou, Z. Assessment of crop growth and soil water modules in SWAT2000 using extensive field experiment data in an irrigation district of the Yellow River Basin. J. Hydrol. 2008, 352, 139–156. [Google Scholar] [CrossRef]
  53. Vazquez-Amabile, G.; Engel, B. Use of SWAT to compute groundwater table depth and streamflow in the Muscatatuck River watershed. Trans. ASAE 2005, 48, 991–1003. [Google Scholar] [CrossRef]
  54. Kannan, N.; White, S.; Worrall, F.; Whelan, M. Sensitivity analysis and identification of the best evapotranspiration and runoff options for hydrological modelling in SWAT-2000. J. Hydrol. 2007, 332, 456–466. [Google Scholar] [CrossRef]
  55. Chen, H. Analysis on Water Saving Potential and Water Saving Measures in Liuyuan Town. Water Resour. Hydropower 2017, 20, 110–112. [Google Scholar]
  56. Wang, L. Optimization of Agricultural Planting Structure under Water Resources Constraints; Northwest Agriculture and Forestry University: Yangling, China, 2017. [Google Scholar]
  57. Li, M. Methods and Models for Agricultural Water-Land Resources Multi-Scale Optimal Allocation Based on Uncertainty Analysis; China Agricultural University: Beijing, China, 2017. [Google Scholar]
  58. Zhang, F.; Li, C.; Wang, Z.; Wu, H. Modeling impacts of management alternatives on soil carbon storage of farmland in Northwest China. Biogeosci. Discuss. 2006, 3, 451–466. [Google Scholar] [CrossRef] [Green Version]
  59. Zheng, W.; Yu, L.; Di, X.U.; Cai, J.B.; Zhang, B.Z. Application and comparison of winter wheat canopy resistance estimation models based on the scaling-up of leaf stomatal conductance. Chin. Sci. Bull. 2013, 58, 2909–2916. [Google Scholar]
  60. Zhang, Y.; Zhao, W.; He, J.; Zhang, K. Energy exchange and evapotranspiration over irrigated seed maize agro-ecosystems in a desert-oasis region, northwest China. Agric. For. Meteorol. 2016, 223, 48–59. [Google Scholar] [CrossRef]
  61. Cao, X.; Wu, P.; Wang, Y. Spatiotemporal variation and correlation of different irrigation water productivity indicators. J. Agric. Mach. 2014, 45, 189–194. [Google Scholar]
  62. Tan, J. Analysis on the effectiveness of unified management of water resources in Tarim River Basin. Tech. Superv. Water Resour. 2015, 23, 18–20. [Google Scholar]
  63. Dong, H. Effects of Irrigation and Planting Methods on Water Consumption Characteristics and Yield of Wheat and Maize Two Crops; Shandong Agricultural University: Tai’an, China, 2011. [Google Scholar]
  64. Zheng, L. Changes of Oasis Agriculture Structure and Water Efficiency in Arid Regions–A Case Study of Zhangye Region; University of Chinese Academy of Sciences: Beijing, China, 2016. [Google Scholar]
Figure 1. Location of the Yingke irrigation district.
Water 10 01305 g001
Figure 2. Basic data for the improved Soil and Water Assessment Tool (SWAT) mode.
Water 10 01305 g002
Figure 3. Simulated and measured values: (a,b) leaf area index (LAI) in 2012 and 2013; (c,d) shoot dry matter in 2012 and 2013.
Water 10 01305 g003
Figure 4. Relationship diagram between simulated Evapotranspiration (ET) and monthly Remote Sensing RS_ET.
Water 10 01305 g004
Figure 5. The flow chart of crop planting structure model.
Water 10 01305 g005
Figure 6. Yield and ET simulation of crops under different scenarios.
Water 10 01305 g006
Figure 7. The spatial distribution of crop planting structure: (a) the current; (b) the optimal maximum water saving; (c) the optimal maximum irrigation water productivity; and, (d) the optimal maximum Net water productivity.
Water 10 01305 g007
Table 1. Net irrigation quota for main crops.
ProjectAlfalfaCorn for SeedField CornRapeWheatSoybeanPotato
Net irrigation quota (mm)250360260220270220220
ET (mm)400545501472398456349
Table 2. Crop cost and price for main crops [33,34].
ProjectAlfalfaCorn for SeedField CornRapeWheatSoybeanPotato
Unit-Yield (kg/ha)10,032.159895.89037.353574.353464.552075.2527,163.35
Unit-Price (yuan/kg)1.4761.9542.223.81.6
Net Income (yuan/ha)10,477.213,854.610,083.1511,364.456653.558878.520,622
Table 3. Indicators of goodness of fit after model calibration.
YearParameterRegression CoefficientR2RMSEAREEF
2012LAI1.050.980.250.010.95
Shoot dry matter0.900.991.160.160.97
ET0.940.7818.1516.920.76
2013LAI0.840.940.530.040.89
Shoot dry matter0.950.921.600.010.90
ET0.900.6426.8327.910.42
Table 4. The total amount of water balance during the growth period.
YearTotal Amount of Irrigation 104 m3Effective Precipitation 104 m3Evapotranspiration 104 m3Outflow 104 m3
201210,139.091430.016547.891469.95
201310,145.151605.196520.721419.07
Table 5. The optimal planting area and proportion of various crops under the maximum target value.
Target ValueProjectCORNALFASWHTCSILCANASOYBPOTA
Water saving volumeplanting areas (km2)8.326.93106.798.3208.320
planting proportion (%)65776060
Irrigation water productivityplanting areas (km2)97.0812.4811.109.7108.320
planting proportion (%)70987060
Net water productivityplanting areas (km2)29.1213.8724.9612.48015.2642.99
planting proportion (%)211018901131
Table 6. Correlation coefficients.
Correlation CoefficientCORNALFASWHTCSILCANASOBYPOTA
Water Saving Volume0.620.07−0.380.66−0.26−0.22−0.53
Irrigation Water Productivity0.82−0.12−0.28−0.12−0.02−0.300.16
Net Water Productivity−0.15−0.25−0.52−0.470.50.230.94

