Article

Baseflow Contribution to Streamflow and Aquatic Habitats Using Physical Habitat Simulations

1
School of Engineering, The University of Newcastle, Callaghan NSW 2308, Australia
2
Department of Land and Water Environment Research, Korea Environment Institute, Sejong 30147, Korea
3
Department of Civil Engineering, Sangji University, Wonju 26339, Korea
*
Author to whom correspondence should be addressed.
Water 2018, 10(10), 1304; https://doi.org/10.3390/w10101304
Submission received: 3 August 2018 / Revised: 13 September 2018 / Accepted: 17 September 2018 / Published: 21 September 2018

Abstract

:
A scientific understanding of the baseflow contribution to streams and watershed processes is critical when dealing with water policy and management issues. However, most previous studies involving physical habitat simulation have been performed without considering the seepage of water from the underground into streams. Motivated by this, herein, we report an investigation of the impact of baseflow using physical habitat simulations for both dominant fish and benthic macroinvertebrate. The study area was located along the reach of the Ungcheon Stream, located 16.50 km downstream and 11.75 km upstream from the Boryeong Dam in the Republic of Korea. For the physical habitat simulation, Zacco platypus and Baetis fuscatus were selected as the target fish and benthic macroinvertebrate, respectively. The HydroGeoSphere (HGS) model (Aquanty Inc., Waterloo, ON, Canada) and the River2D model (Version 0.95a, University of Alberta, Edmonton, AB, Canada) were used for hydrologic and hydraulic simulations, respectively. The Habitat Suitability Index (HSI) model was used for the habitat simulations. Three habitat variables, flow depth, velocity, and substrate, were used. To assess the impact of baseflow, this study performed a physical habitat simulation using each representative discharge, with and without considering baseflow. It was found that the baseflow effects significantly increase the habitat suitability in the study reach. To restore the aquatic habitat, a scenario for modifying dam operations through natural flow patterns is presented using the Building Block Approach (BBA). In the study, the adjusted minimum flow allocation concept was used. It was revealed that the modified dam operations significantly increased the Weighted Usable Area (WUA) by about 48% for both target species. The results indicate that modifying the dam operations through restoration to natural flow regimes but also through inclusion of the baseflow are advantageous to aquatic fish habitats.

Graphical Abstract

1. Introduction

In general, river flow is classified into two groups: surface flow and subsurface flow [1]. The subsurface flow is defined as the baseflow contributions to river flow. The baseflow refers to the flow rate from underground to a stream. The baseflow is closely related to geological catchment properties [2,3,4]. The importance of baseflow intrusion into aquatic ecosystem processes and biodiversity in rivers has been addressed in previous studies [5,6,7]. Baseflow often influences the surface channel and hyporheic zones that can maintain a river’s productivity and biodiversity, habitat availability and aquatic species migration, and influence water quality [5,6,7,8]. The degree of dependency on the baseflow is important for maintaining the biodiversity, habitat connectivity, composition, and function of an aquatic ecosystem [7,9,10,11,12,13,14].
Understanding the characteristics of the baseflow is important when dealing with various environmental issues (e.g., aquatic ecosystem, water quality, and river restoration). However, unfortunately, baseflow cannot easily be measured using direct methods and commonly it is estimated by using a variety of methods [15,16,17]. The conventional approach to baseflow assessment is typically based on hydrograph analysis on a long-term basis, for example, the displacement recession curve techniques [18], the curve-fitting method [19], the Water Table Fluctuation (WTF) method [20], the hydrograph-separation method [21,22], PART [23], BFlow [24], and the Web GIS-based Hydrograph Analysis Tool [25]. Several fundamental approaches underlying the various analysis methods have been developed, but these are not always correct. This is because hydrological cycle is a complicated physical process and involves highly three-dimensional flows [26,27]. An alternative method is to use techniques for computational modeling of fluid dynamics. It is true that this method can be used to reveal the detailed mechanisms that are relevant to the entire terrestrial portion of the hydrologic cycle [26,27].
Instream structures, such as dams, can affect the flow regimes, result in reducing or increasing flows; changing the frequency, duration, magnitude, and timing; and altering the level of surface and subsurface water. Dams also block the migration route for fish [28,29,30], reduce the density and composition of aquatic species such as phytoplankton and benthic macro invertebrate [31,32,33], decrease aquatic species growth and survival [34], and change the morphological and hydrological conditions of the stream [35,36,37,38,39]. In addition, flow patterns are regularly changed by pumping or extraction of surface and subsurface water [7,40,41]. The change of flow regimes affects both the aquatic ecosystems and the biodiversity in the downstream reach from the dam [42,43]. To mitigate the dam effects, various ecological models have been proposed and used. Nguyen et al. [44] pointed out that ecological models are an important tool for investigating the impacts of dams on the aquatic habitat. They developed an integrated conceptual model that can be used to select an appropriate ecological modeling method to assess the complex interactions in aquatic ecosystems. Aquatic ecosystems are complex and ecological indicators can be used to represent and understand them, which can be useful in restoring or designing rivers. Before applying ecological models, ecological indicators should be reviewed by local experts for applicability. In addition, physical habitat simulations have been applied to identify the impacts of constructing dams on the aquatic habitat. Physical habitat simulation is a numerical tool that quantifies the habitats for target species in terms of the physical habitat variables in a stream. Previous studies showed that released water from a dam adversely affects the downstream fish habitat [45,46,47,48]. A variety of physical habitat simulations have been carried out, showing that hydropeaking and thermopeaking flows decrease habitat suitability for target species in the downstream reach of the dam [49,50,51,52]. However, most previous physical habitat simulations did not consider the baseflow and modifying dam operations effects when investigating the impact of regulation by the dam on the aquatic habitat [5,41,42,43,53,54,55].
The objective of the present study was to investigate the impact of baseflow on the aquatic habitat using a physical habitat simulation. For this, 16.50 km and 11.75 km long reaches located downstream and upstream from the Boryeong Dam, respectively, were selected for the study area. Field monitoring revealed that Pale chub (Zacco platypus) and Baetis fuscatus are the dominant fish and benthic macroinvertebrate in the study reach, respectively. The HydroGeoSphere (HGS) model was used for hydrologic simulation to optimize the baseflow from the seepage of water from the ground into the stream. Additionally, the River2D model and the HSI (Habitat Suitability Index) model were used for the hydraulic and habitat simulations, respectively. The Habitat Suitability Curves (HSCs) of target species were constructed using the method of Gosse [56]. As a general strategy, a scenario of the modification of dam operations through natural flow patterns is presented. The determination of the impact of the proposed scenario in physical habitat simulations was performed quantitatively. The Composite Suitability Index (CSI), which is an aggregation of habitat suitability indices including individual physical habitat variables and the Weighted Usable Area (WUA). under modified dam operations were computed, and they are discussed.

2. Materials and Methods

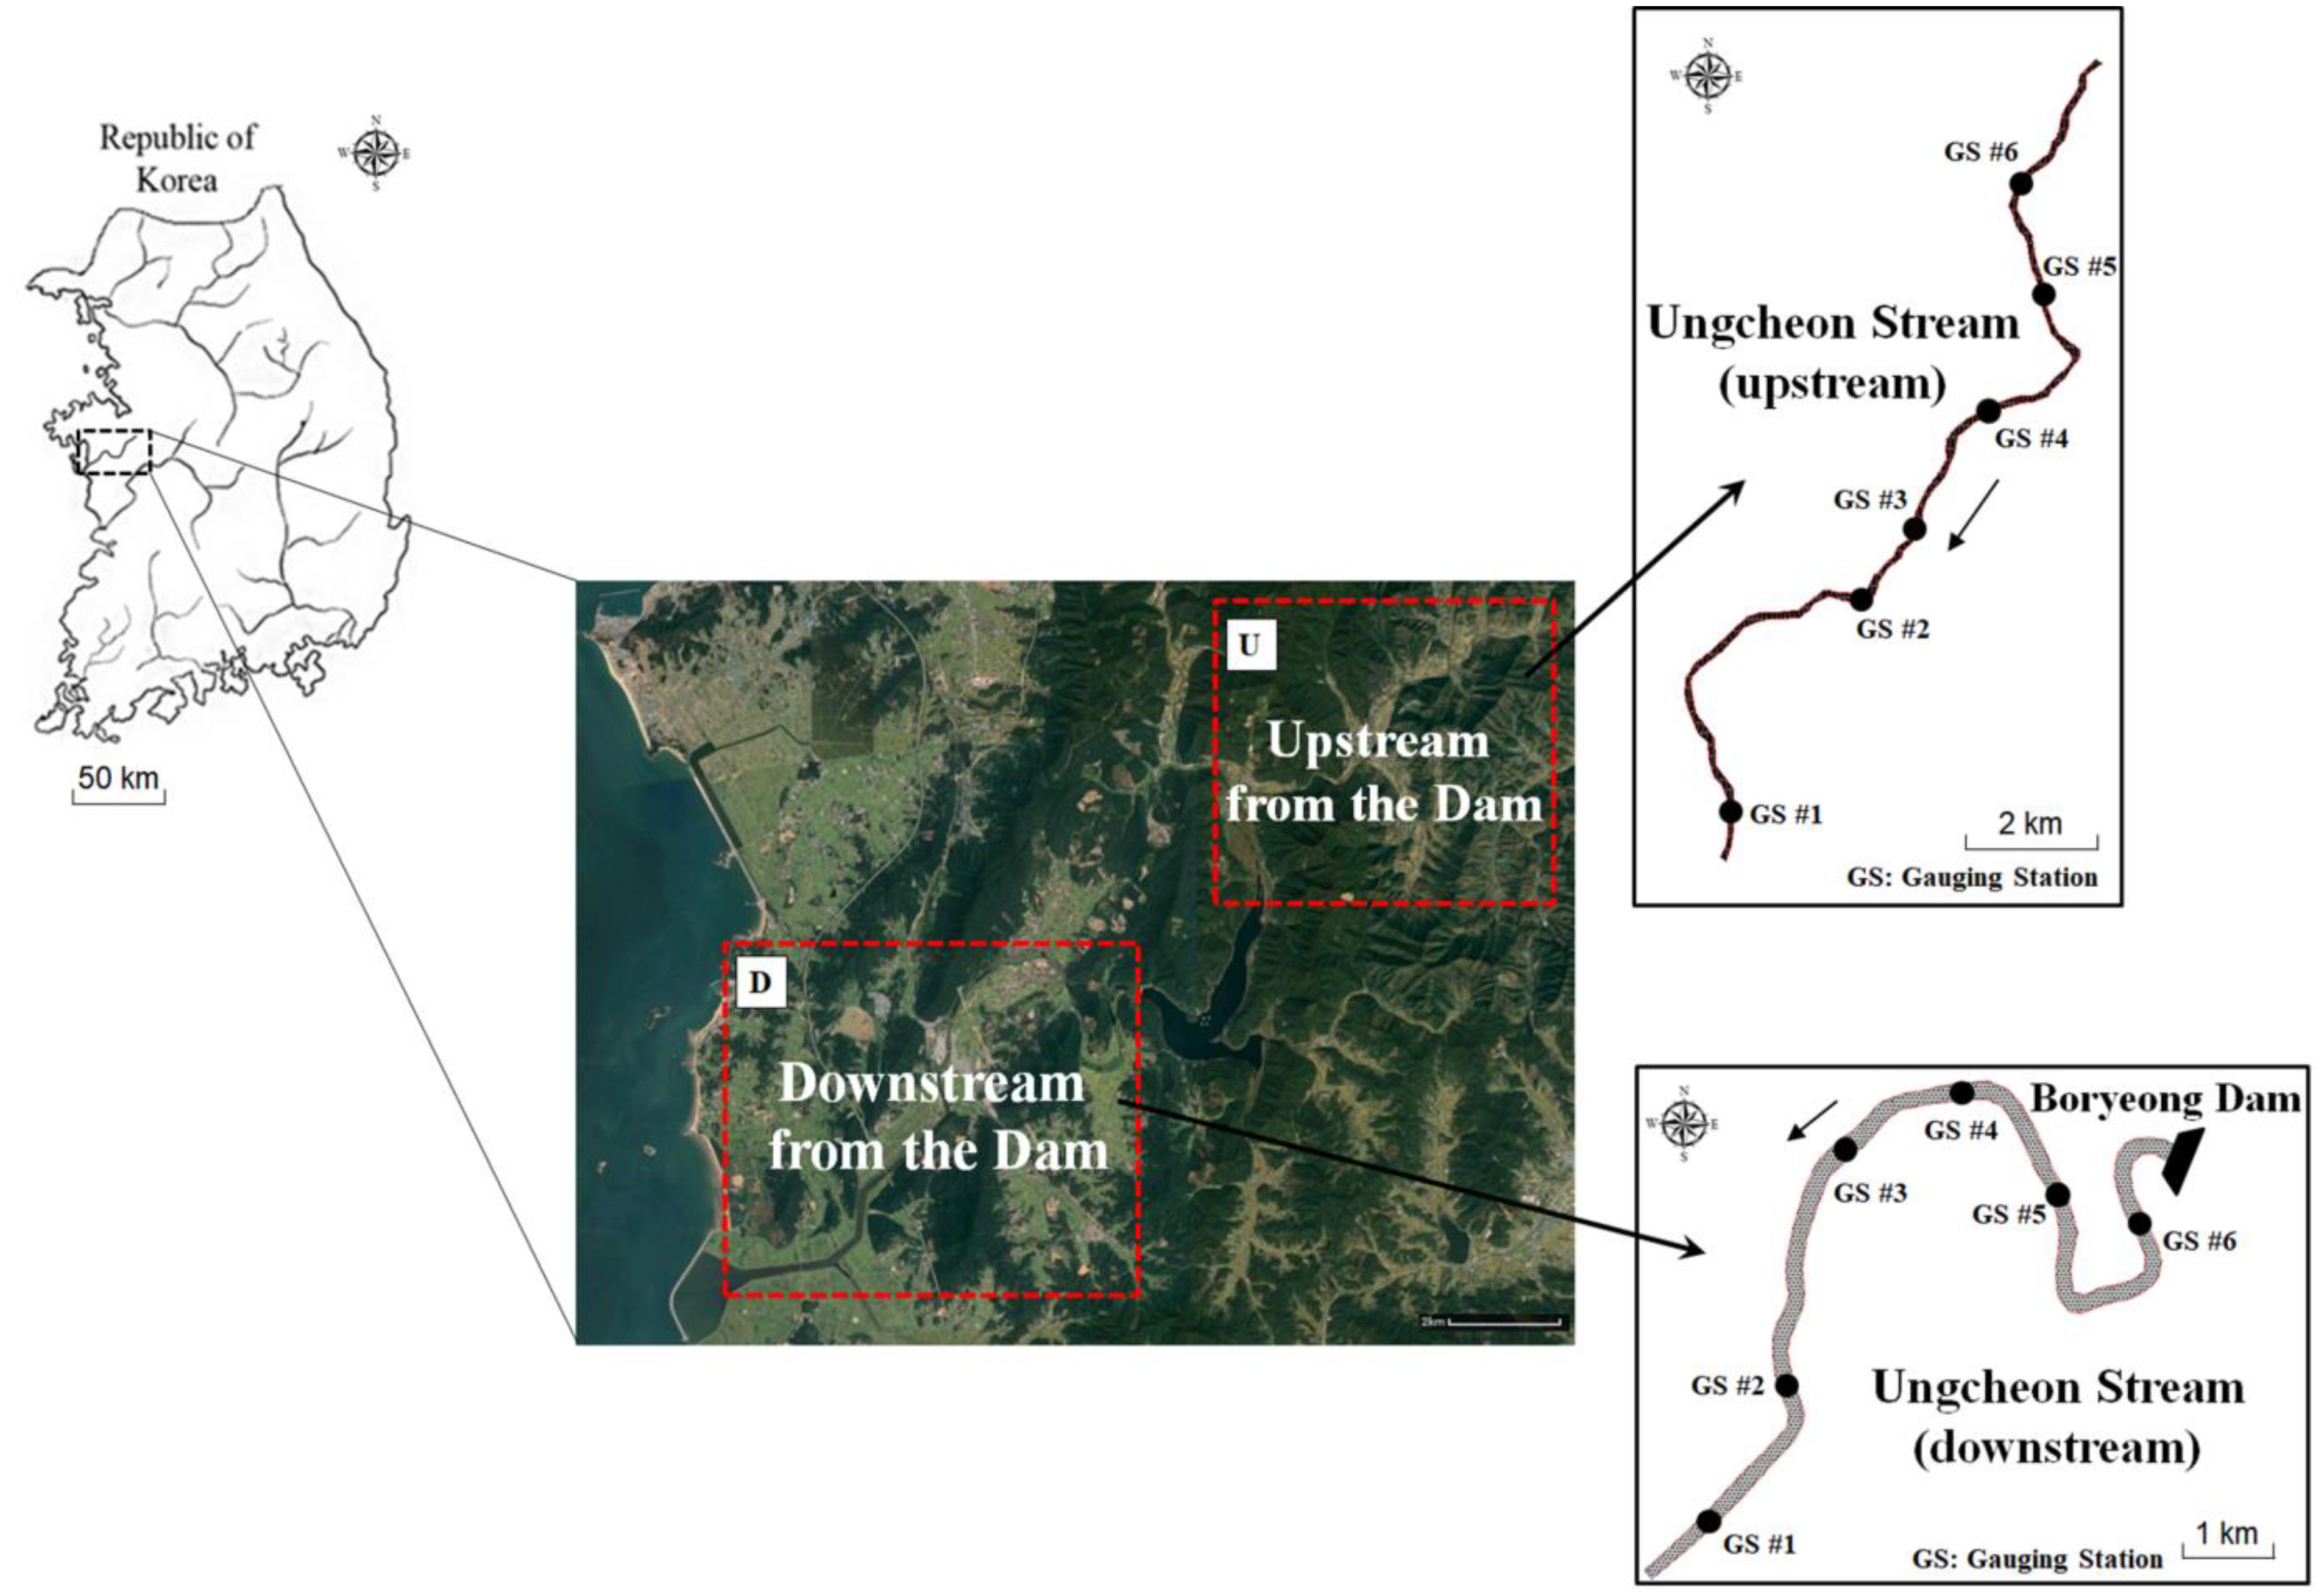
2.1. Study Area and Monitoring Data

The study area was in the Ungcheon Stream, Republic of Korea and is shown in Figure 1. The Ungcheon Stream is a mid-sized gravel-bed river that is a tributary of the Geum River. The Ungcheon Stream is located in Chungcheongnam-do in the Western part of Korea. The Ungcheon Stream is 37.10 km long and has a basin area of 234.35 km2. The study reach was located downstream and upstream from the Boryeong Dam, as shown in Figure 1. The dam was constructed in 1998 and has a total storage of 116.90 × 10⁶ m3. The water quality of both reaches and the released water from the dam is very good. The downstream reach is 16.50 km in length and extends from the dam to the closed estuary. The upstream reach extends 11.75 km from the dam. The downstream reach is regulated by the Boryeong Dam. However, the upstream reach is an unregulated stream and has a natural flow pattern in contrast to the downstream reach. For the study reach, the discharge rates for drought flow (Q355), low flow (Q275), normal flow (Q185), and averaged-wet flow (Q95) were 0.04, 0.51, 1.39 and 3.28 m3/s, respectively [57]. Here, Qn denotes the average flow discharge that was exceeded on n days of the year.
In the present reach, for the 2007–2010 period, field monitoring data were collected through government R&D projects [57,58]. The monitoring data included the date, flow depth, velocity, substrate, water temperature, concentration of suspended solids, and the number of individuals. Fish monitoring was carried out using cast nets and kick nets, revealing the Zacco platypus (31%) to be a dominant species in the study reach, followed by Zacco koreanus (16%), Tridentiger brevispinis (15%), Rhinogobius brunneus (8%), and Pungtungia herzi (5%) [57]. The benthic macroinvertebrate was used as a comprehensive indicator of the river’s health and as a food resource for most aquatic fishes [59,60,61,62,63,64,65]. Field monitoring by Choi et al. [66] revealed that the dominant benthic macroinvertebrate in the study reach is Baetis fuscatus. Detailed data regarding this can be found in Kang and Choi [67]. For the success of physical habitat simulation, the choice of the target species is very important. The target species should reflect the environmental constraints on the entire aquatic community. In addition, overall aquatic community’s abundance should rely on environmental changes that affect habitat variables [68]. In general, the target species can be candidates for dominant, endangered, protected, and commercial species. In the present study, the dominant fish and benthic macroinvertebrate were selected as the target species.

2.2. Physical Habitat Simulation

2.2.1. Hydraulic and Hydrologic Simulation

For the hydraulic simulation, the River2D model was used. The model was developed by Steffler and Blackburn at the University of Alberta in Canada [69]. The River2D model solves two-dimensional depth-averaged hydrodynamic equations using the finite element method [68]. The 2D shallow water equations in the x-y horizontal plane are given by
H t + q x x + q y y = 0  
q x t + x ( U q x ) + y ( V q x ) + g 2 H 2 x = g H ( S 0 x S f x ) + 1 ρ { x ( H τ x x ) } + 1 ρ { y ( H τ x y ) }  
q y t + x ( U q y ) + y ( V q y ) + g 2 H 2 x = g H ( S 0 x S f y ) + 1 ρ { x ( H τ y x ) } + 1 ρ { y ( H τ y y ) }  
where t is time; x and y are the streamwise and transverse directions, respectively; H is the flow depth; U and V are the depth-averaged velocities in the x- and y-directions, respectively; q x ( = H U ) and q y ( = H V ) are the respective unit discharges in the x- and y-directions, respectively; S 0 i and S f i are the friction slopes in the x- and y-directions, respectively; g is the gravitational acceleration; ρ is the water density; and τ i j is the horizontal stress tensor. The x and y components of the friction slope are respectively estimated by
S f x = n 2 U U 2 + V 2 H 4 / 3  
S f y = n 2 V U 2 + V 2 H 4 / 3  
where n is the Manning’s roughness coefficient.
The HGS model was used for the hydrologic simulation. The model was developed by Aquanty Inc. [27]. The model is based on a rigorous conceptualization of the hydrologic cycle that integrates the surface water and variably-saturated subsurface with interactions [26,27]. In addition, the model solves surface and subsurface flow, solute and transport equations simultaneously using the finite element method. To validate the HGS model, various results, such as the depth of groundwater related to hydraulic conductivity, flow rate, and reservoir water level, were compared with measured data. In this study, a steady-state model was investigated to estimate the changes in baseflow in the study reach calibrated by field measurements [70]. The simulated baseflow from the HGS model was used as the input value of each node of the two-dimensional model to analyze the flow depth and velocity under the boundary conditions.

2.2.2. Habitat Simulation

In the present study, the HSI model to simulate the habitats of both fish and benthic macroinvertebrate. The HSI models describe the relationships between habitat variables and suitability. The HSI model is a numerical tool that quantifies the habitat for target species. The HSI ranges from 0 to 1, representing unsuitable and optimal habitats, respectively [71]. In this study, the HSCs for the target species constructed by the method of Gosse [56] were used. We evaluated the HSI model based on the range and distribution of calculated suitability index. Thus, this method gave suitability index values of 1.0, 0.5, 0.1 and 0.05 to the range of habitat variables (flow depth, velocity, and substrate) that encompassed 50%, 75%, 90% and 95% of the number of individuals, respectively. For example, the HSC for the flow depth of Zacco platypus was divided into 12 parts for each habitat variable, and habitat conditions that scored in 3–5 received 1.0 points; 1–2 and 6–7 received 0.05 points; 7–10 received 0.03 points; and <1 and >11 received 0 points. The WUA is the Weighted Usable Area and spatially integrates the values of the CSI. It is computed as
WUA = j C S I j A j  
where C S I j is the combined suitability index for the flow depth, velocity, and substrate ( H S I H × H S I v × H S I s ) and A j is the area of the j -th computation cell. To calculate the WUA in Equation (6), the multiplicative aggregation method was used with three habitat variables: flow depth, velocity, and substrate.

2.3. Building Block Approach

The Building Block Approach (BBA) was introduced to modify dam operations using hydrologic and ecological data [72]. This approach has been used as a holistic method to estimate environmental flows [43,73]. The procedures of modifying dam operations using the BBA can be divided into the following three steps: (1) definition of the minimum in-stream flow using the averaged hydrologic data for each month; (2) building the flushing flood for channel maintenance and habitat improvement; and (3) increasing the discharge in the dry season for spawn habitat and migration. Attempts to restore regulated streams by dam re-operation strategies have been proposed and used [42,43,67]. Postel and Richter [43] introduced dam re-operation strategies based on natural flow patterns. They proposed four methods: static minimum flow allocation, percent flow allocation, seasonally adjusted minimum flow allocation, and seasonally adjusted minimum flow allocation with seasonal flushing flow. In addition, Kang and Choi [67] determined the impact of natural flow patterns on downstream aquatic species using physical habitat simulations. Three scenarios were constructed with using the magnitude-duration concept, minimum flow allocation concept, and seasonally adjusted minimum flow allocation concept. It was found that not only the changes in dam operations through natural flow patterns but also the changes in morphology with the restoration of flood events are advantageous to aquatic species. In the present study, among these, the adjusted minimum flow allocation concept was used. This is because the releasing pattern from upstream dam was nearly constant over the year. Therefore, in the present study, the monthly averaged data within a range was not significantly different from the releasing patterns.

3. Results and Discussion

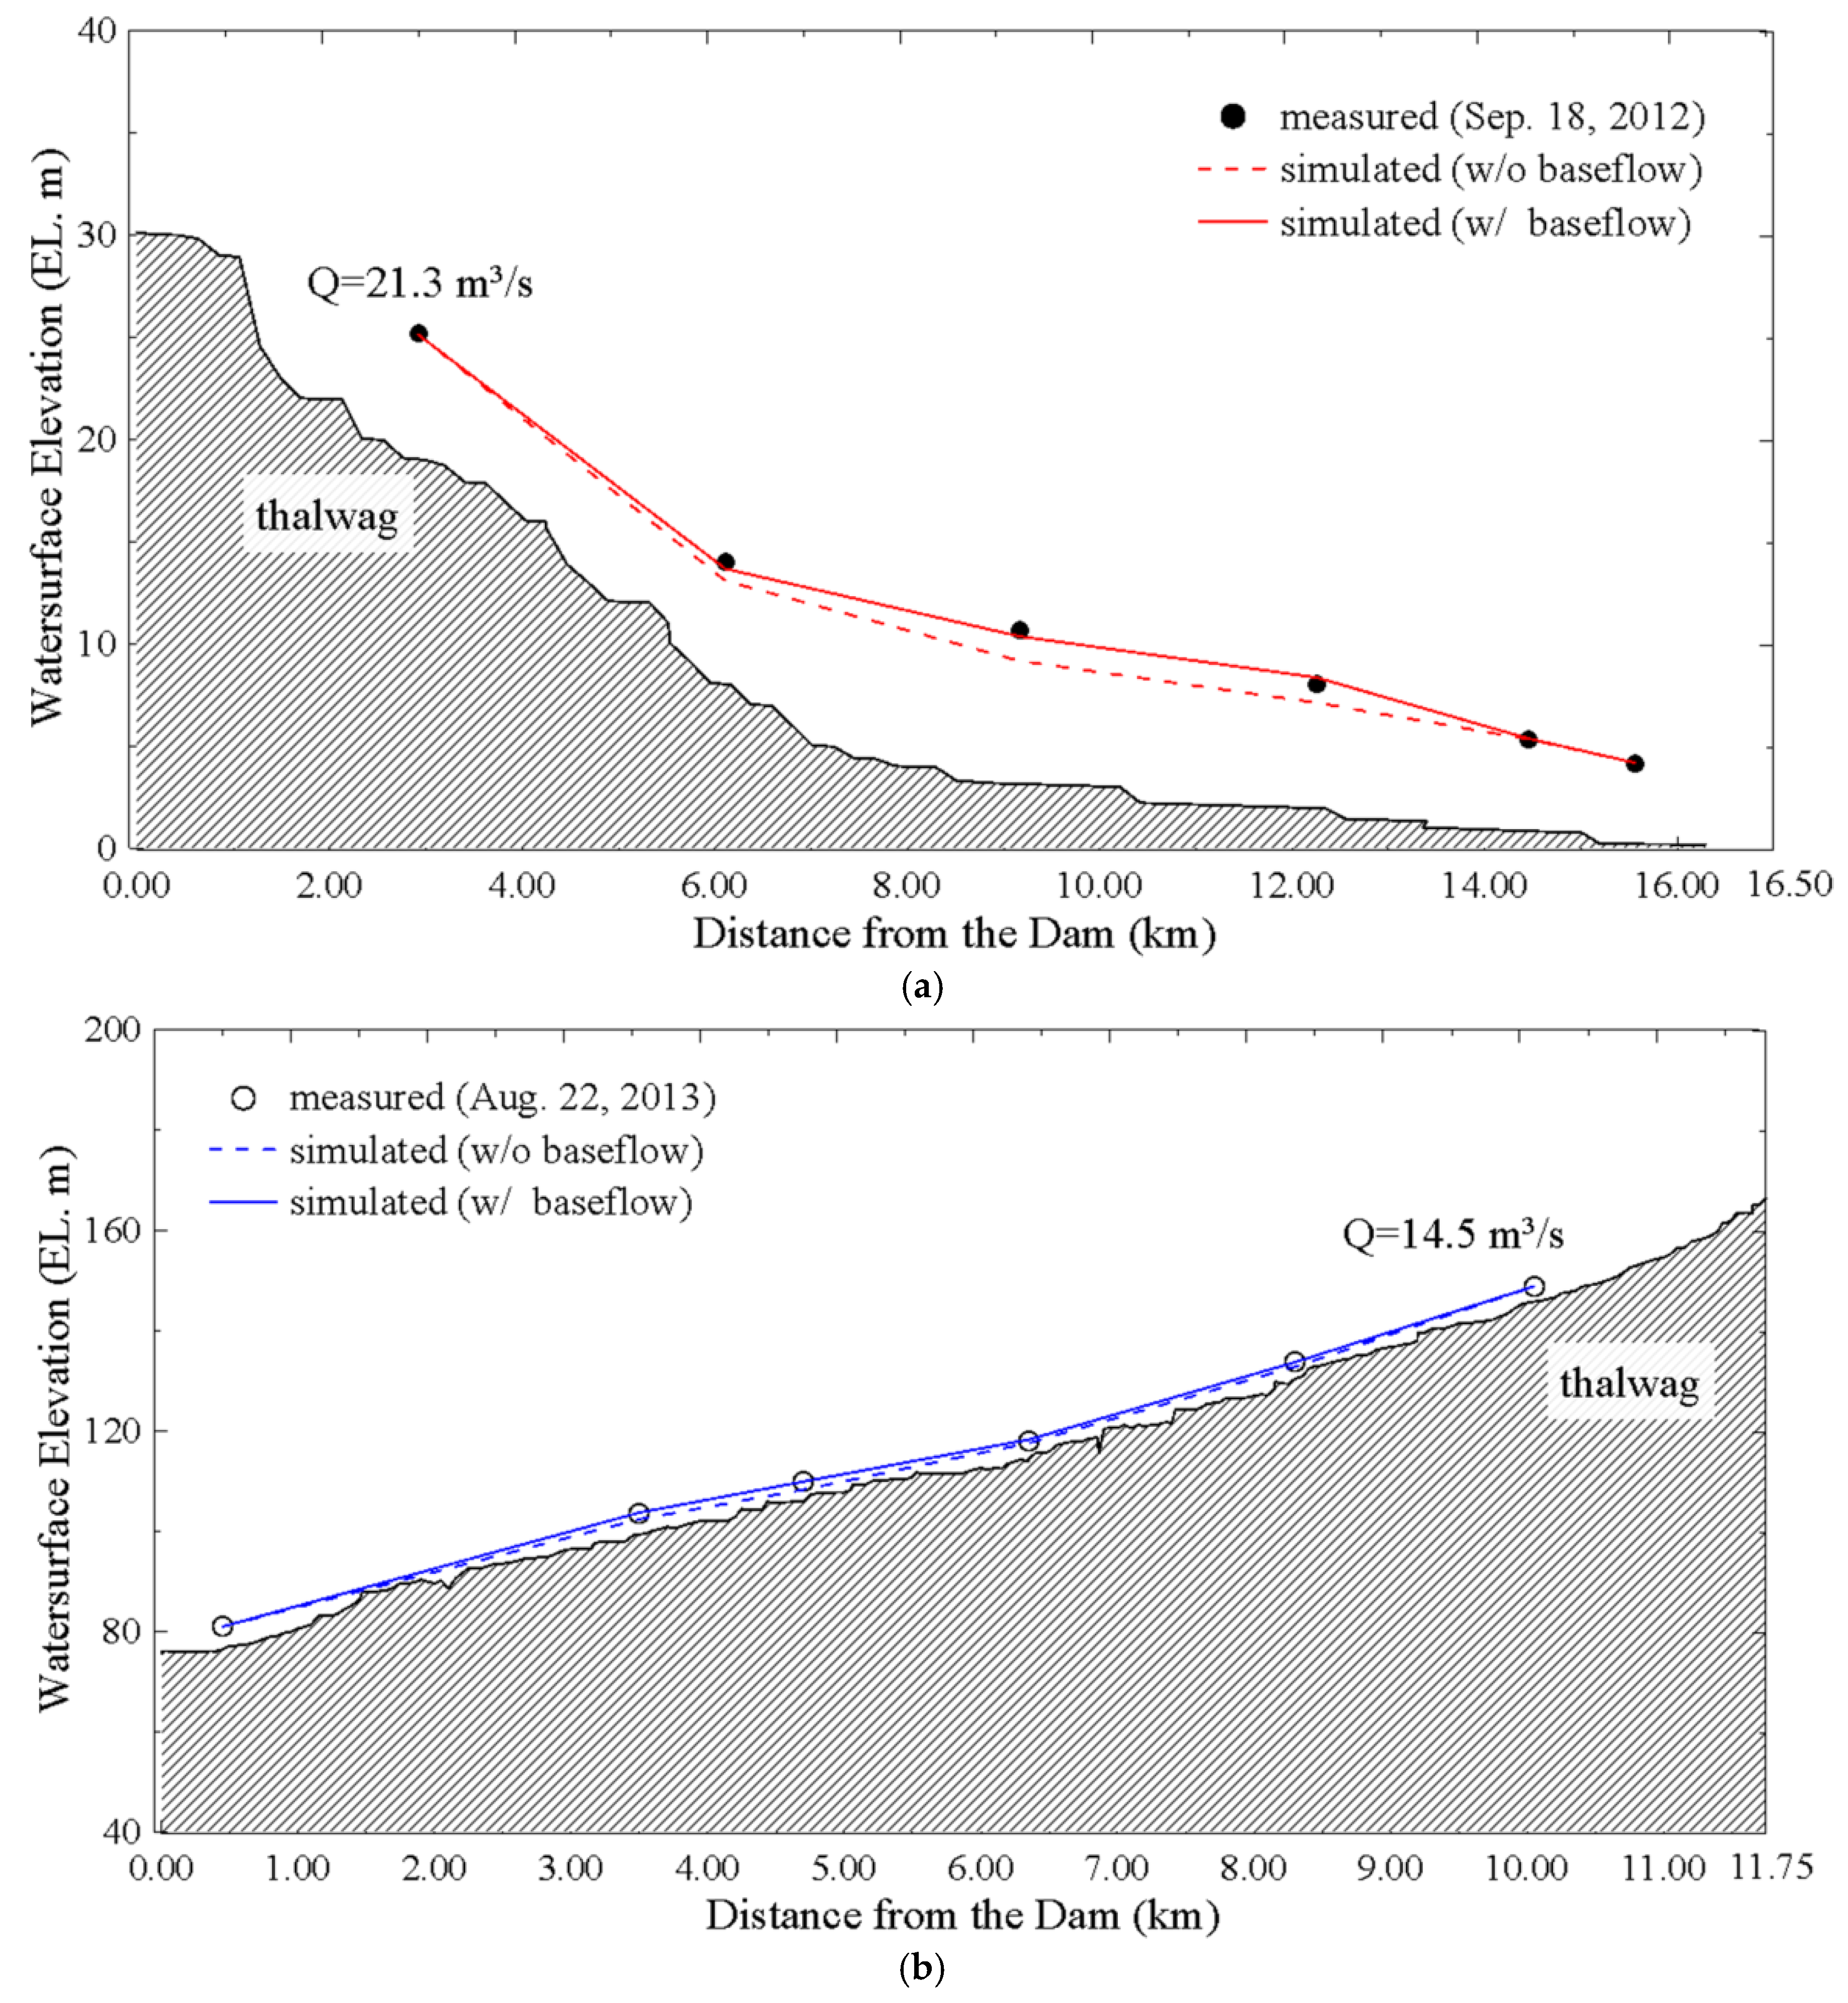
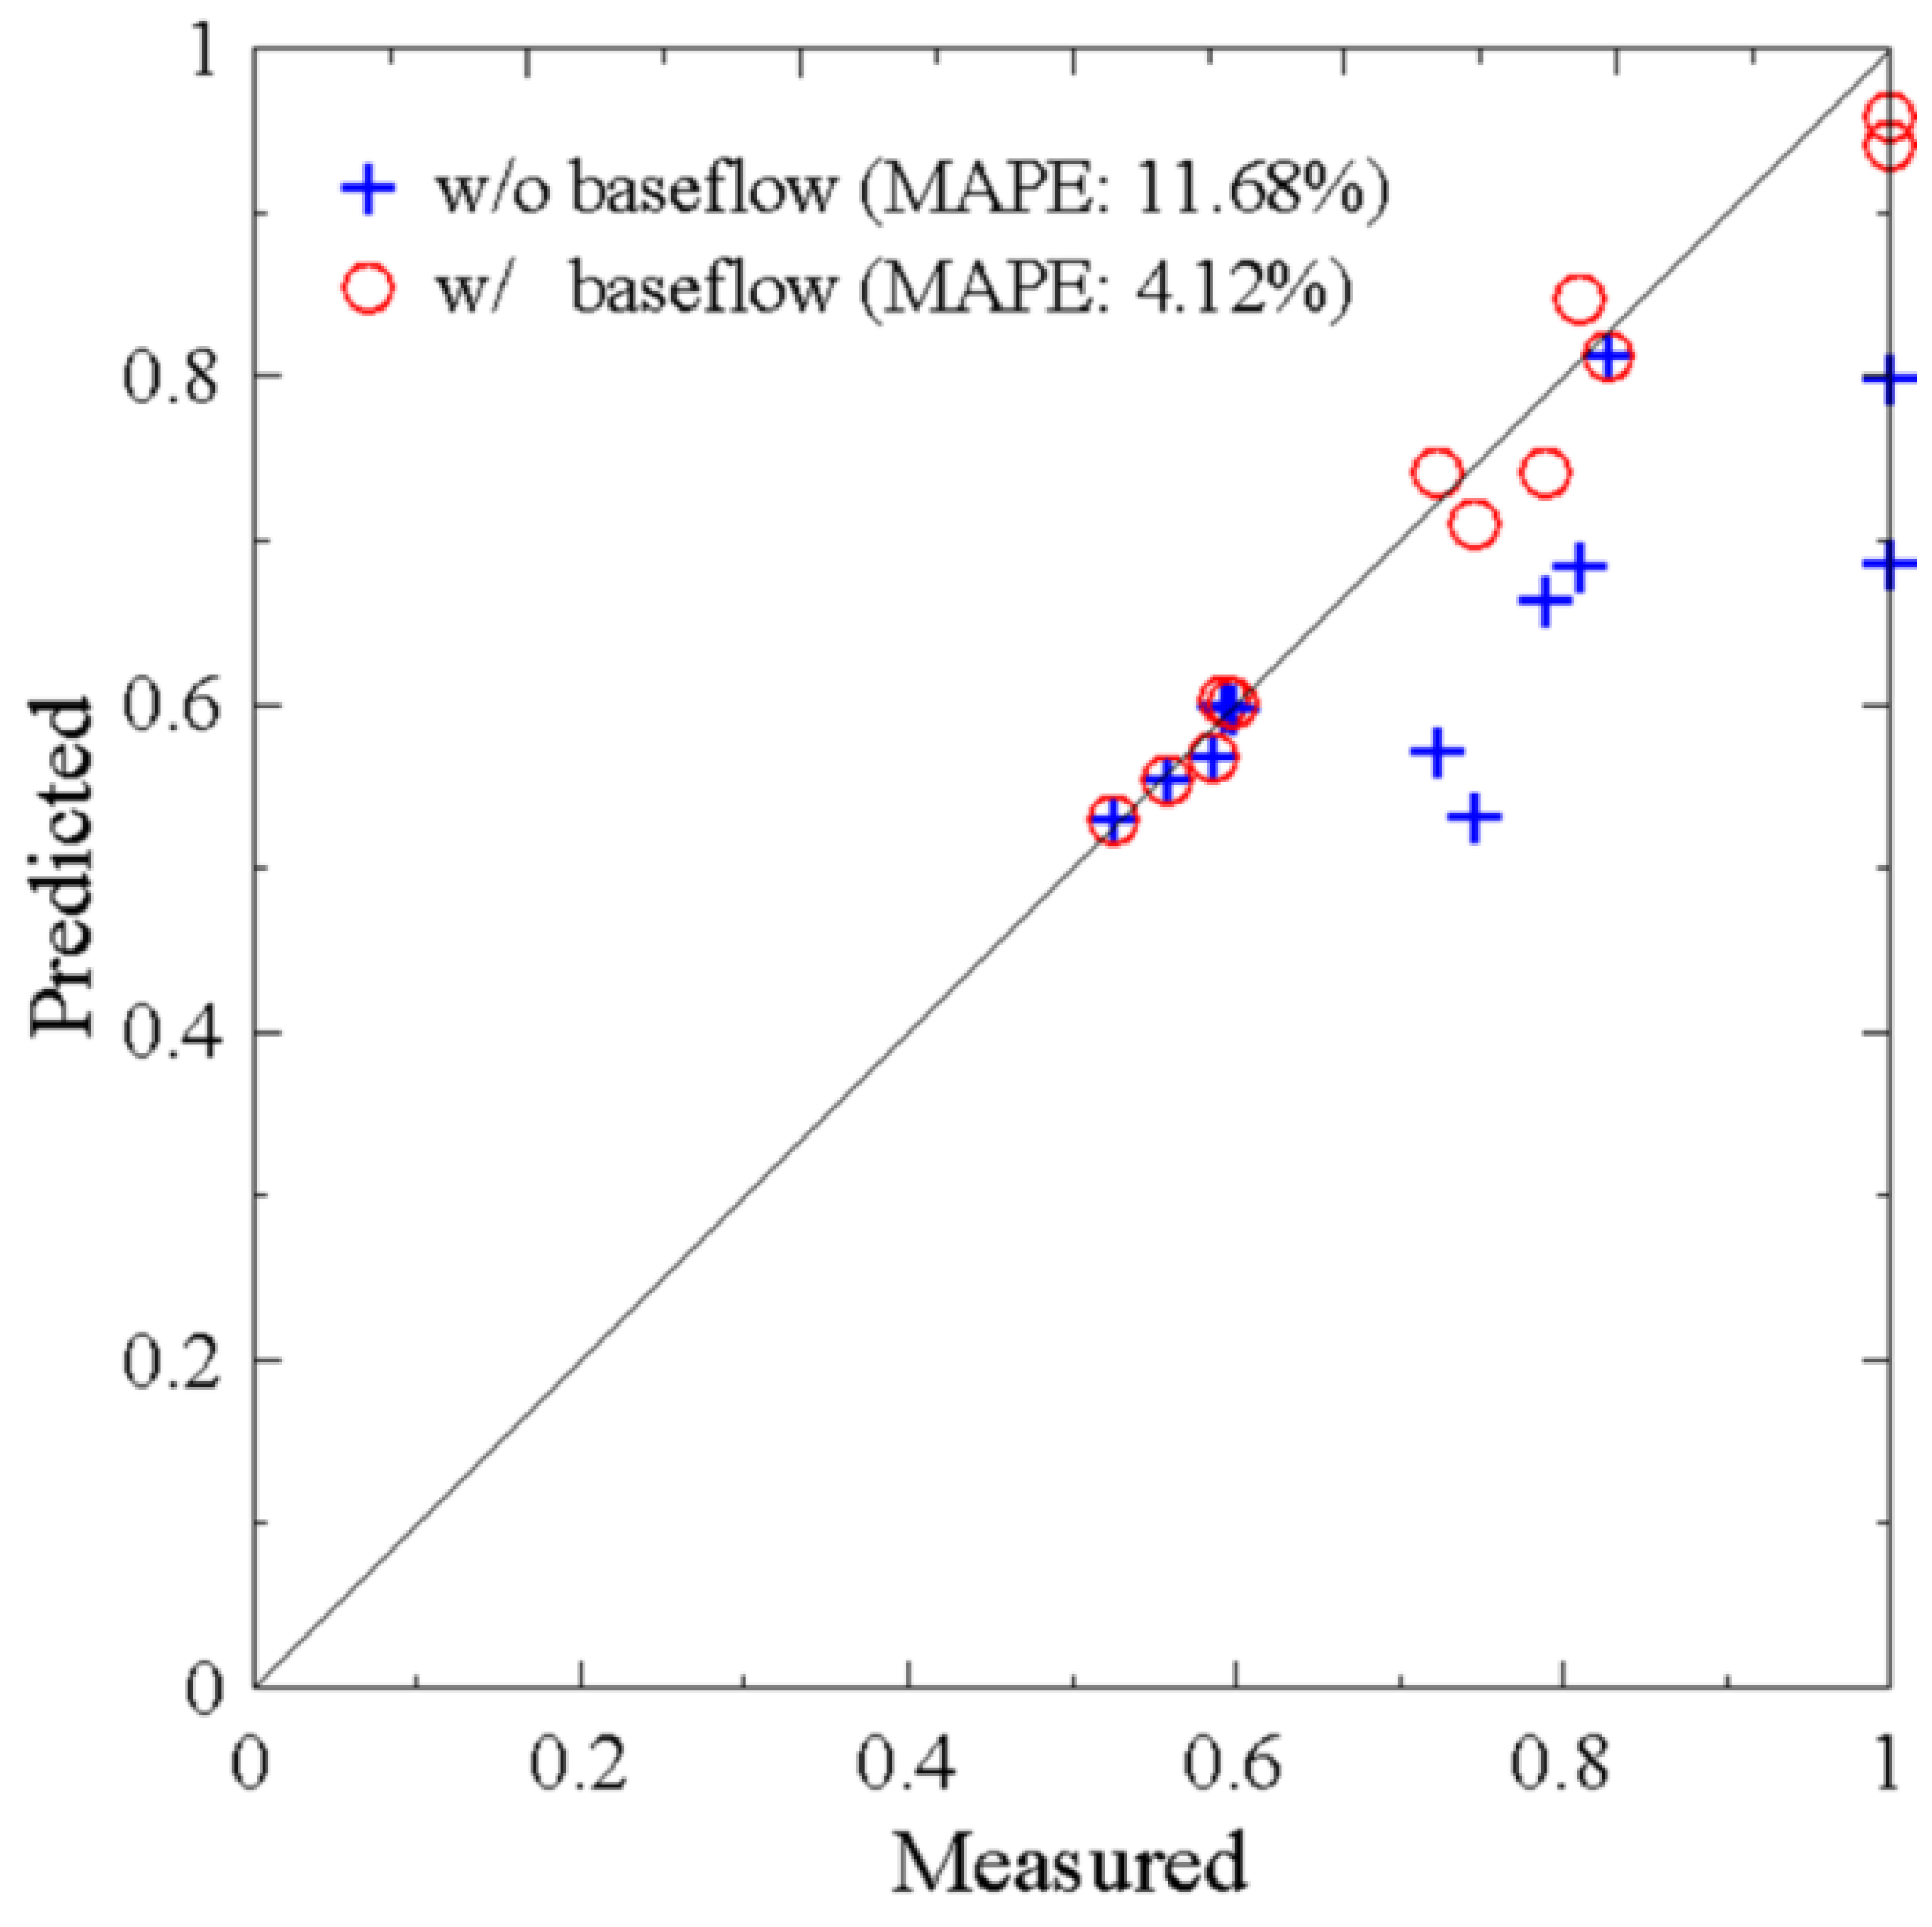
3.1. Model Validation

Figure 2 shows the flow modeling validation. In the figure, the longitudinal distributions of the elevation of the water surface with baseflow in the downstream and upstream reaches from the dam are presented. The distributions of the water surface elevation in the downstream reach (18 September 2012) and the upstream reach (22 August 2013) were obtained and compared. The discharges were 21.3 m3/s and 14.5 m3/s, on 18 September 2012 and on 22 August 2013, respectively. In the downstream and upstream reaches, six stations located near the Boryeong Dam were used for the stage measurements, as shown in Figure 1. To measure the water surface elevation, a radar water gauge (CS477, Campbell Scientific, Inc., Logan, UT, USA) and an air purge level gauge (HS40, HYQUEST SOLUTIONS, Warwick Farm, NSW, Australia) were used. The predicted water surface elevation was averaged over the width. In the downstream and upstream reaches, the stream and groundwater pumping for drinking water and irrigation are located between 3.2 km and 11.4 km in the downstream reach from the dam and between 2 km and 5.8 km in the upstream reach from the dam, respectively. The discharge rates of the water intake in the downstream reach and upstream reach were about 0.35 m3/s and 0.27 m3/s, respectively. In the present study, the calibrated roughness coefficient for different field flow conditions and the proposed Manning’s n range of 0.030–0.046 were used [69]. To determine the model performance in the validation assessment, the Mean Absolute Percent Errors (MAPE) were calculated (Equation (7)).
MAPE = 1 n | H m H p | H m × 100 ( % )  
where H p and H m are the predicted and measured flow depths, respectively.
Figure 3 shows the predicted versus measured flow depths for the validation of the 2D flow model. The validation data were obtained (Figure 2). The 45-degree line indicates perfect agreement. In the figure, the predicted flow depths with and without consideration of the baseflow are marked by open circles and crosses, respectively. The respective values of MAPE were 4.12% and 11.68%. This indicates that the 2D flow model predicts flow depths very accurately when considering the baseflow. This is because the water-use by people from rivers and groundwater for irrigation, food production, and drinking is extremely high. However, the predicted water surface elevation with the baseflow is in good agreement with the measured data. This indicates that the baseflow compensates for the dam discharge and water intake in the river. Apparently, the baseflow and the water-use due to human activities are expected to affect both CSI and WUA for the target species.

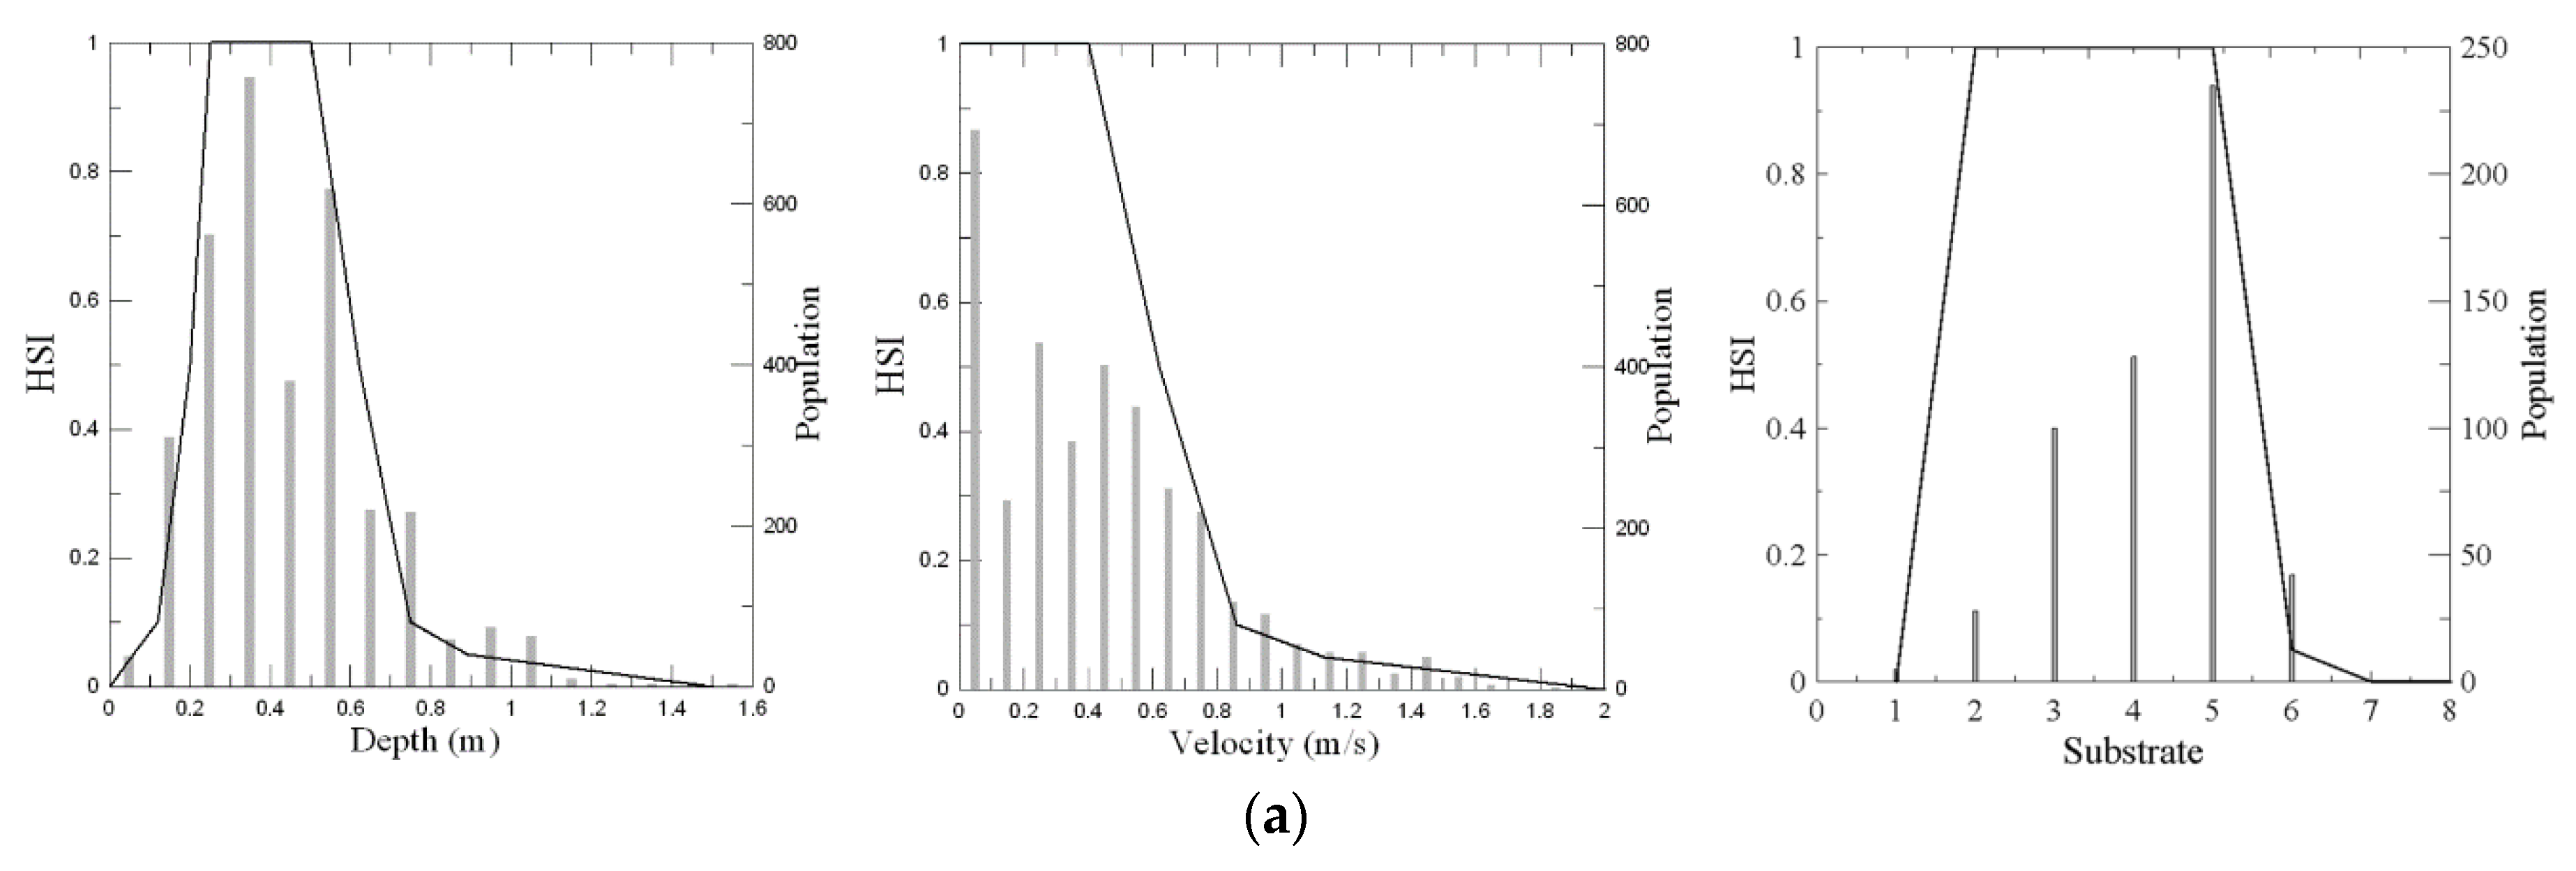
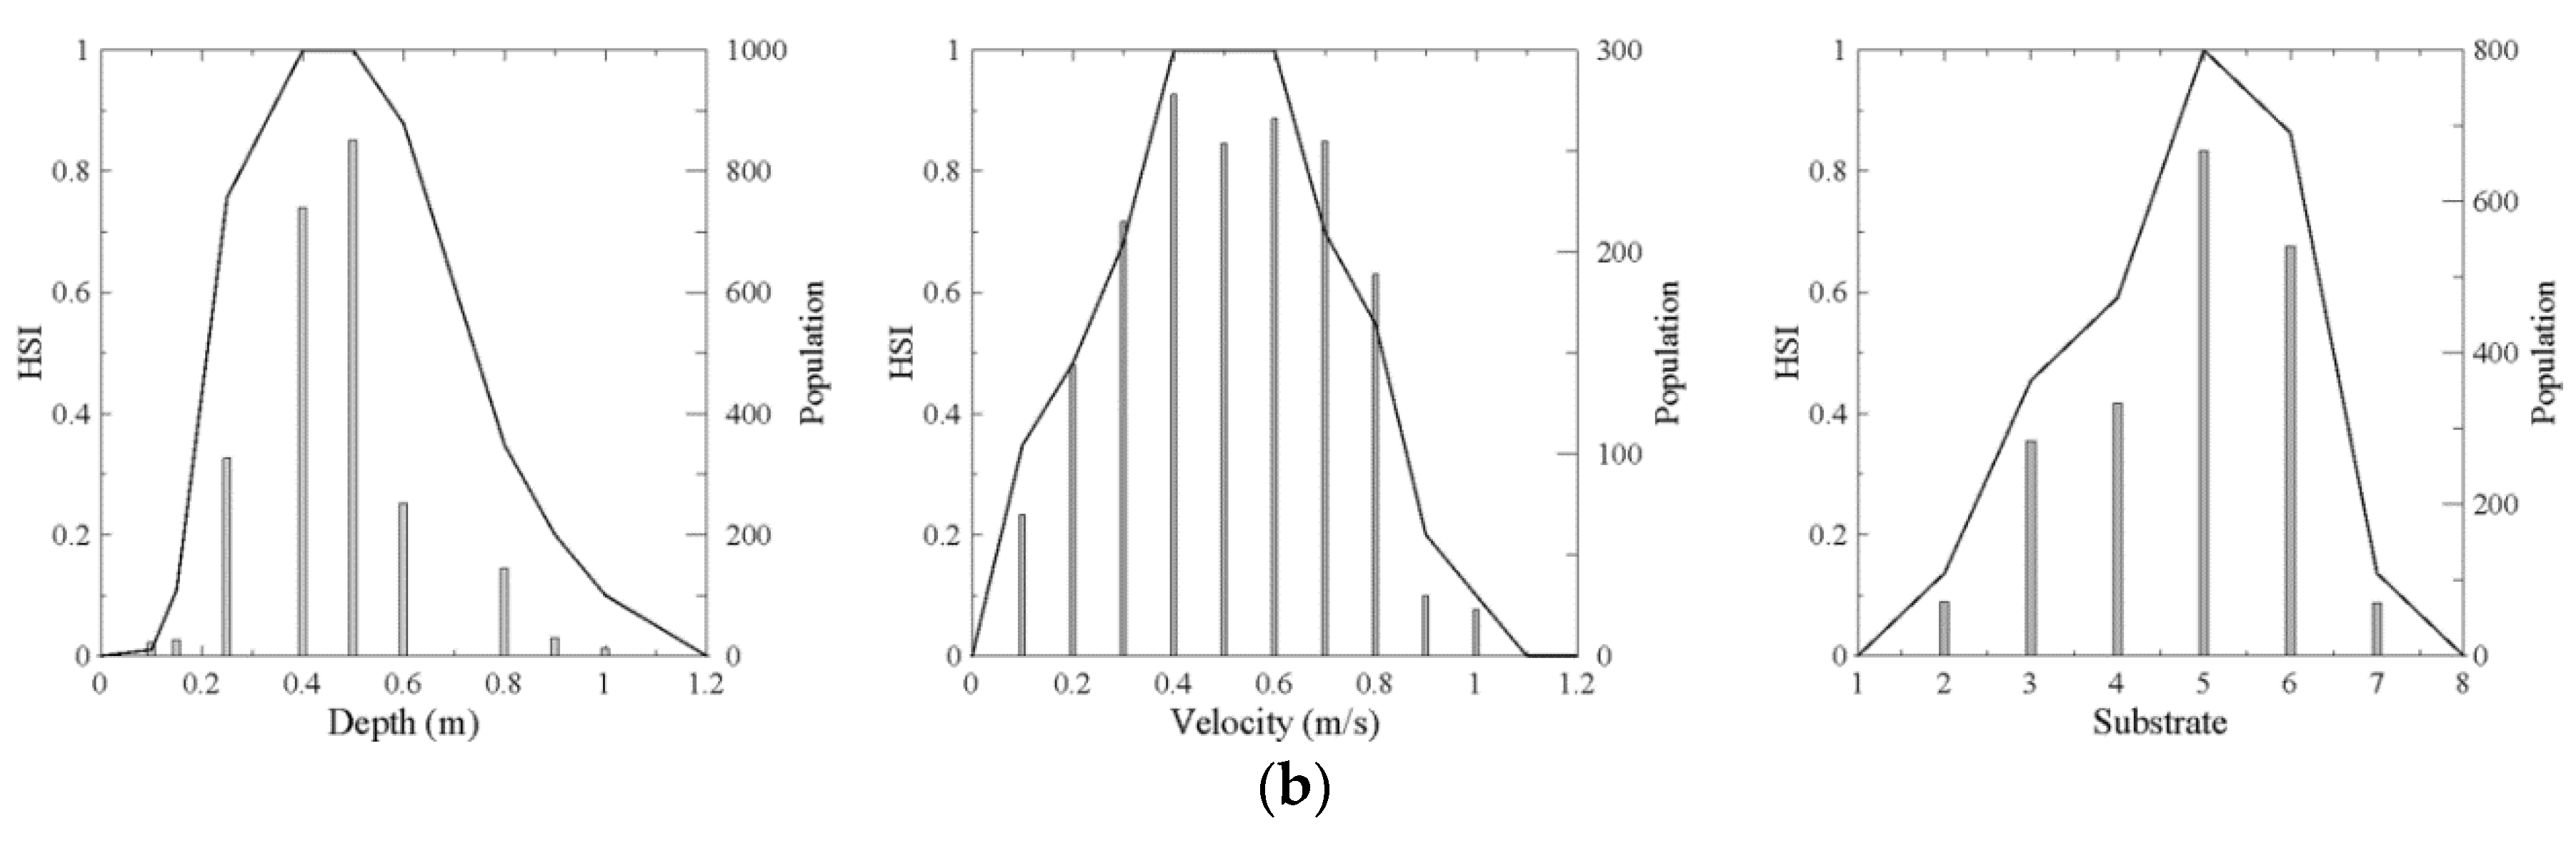
3.2. Habitat Suitability Curve

Before performing the physical habitat simulations, the HSCs for each target species constructed by the method of Gosse [56], given in Figure 4, were obtained. These HSCs can be used to predict the CSIs by the multiplicative aggregation method. The total number of data for the constructed HSCs was 1675. The number of individuals was plotted in the equally-divided range for each habitat variable in Figure 4. The HSCs generally develop at a microscale level; the most important habitat variables are flow depth, velocity, and substrate [74,75]. For the target fish, the preferred ranges were 0.20–0.50 m, 0.25–0.45 m/s, and 2–5 for the flow depth, velocity, and substrate, respectively. Additionally, the respective preferred ranges for the benthic macroinvertebrate were 0.40–0.50 m, 0.40–0.60 m/s, and 5, that is, they prefer shallow water, a high velocity, and coarse substrate. It can be seen that the ranges for the physical habitat variables overlap.

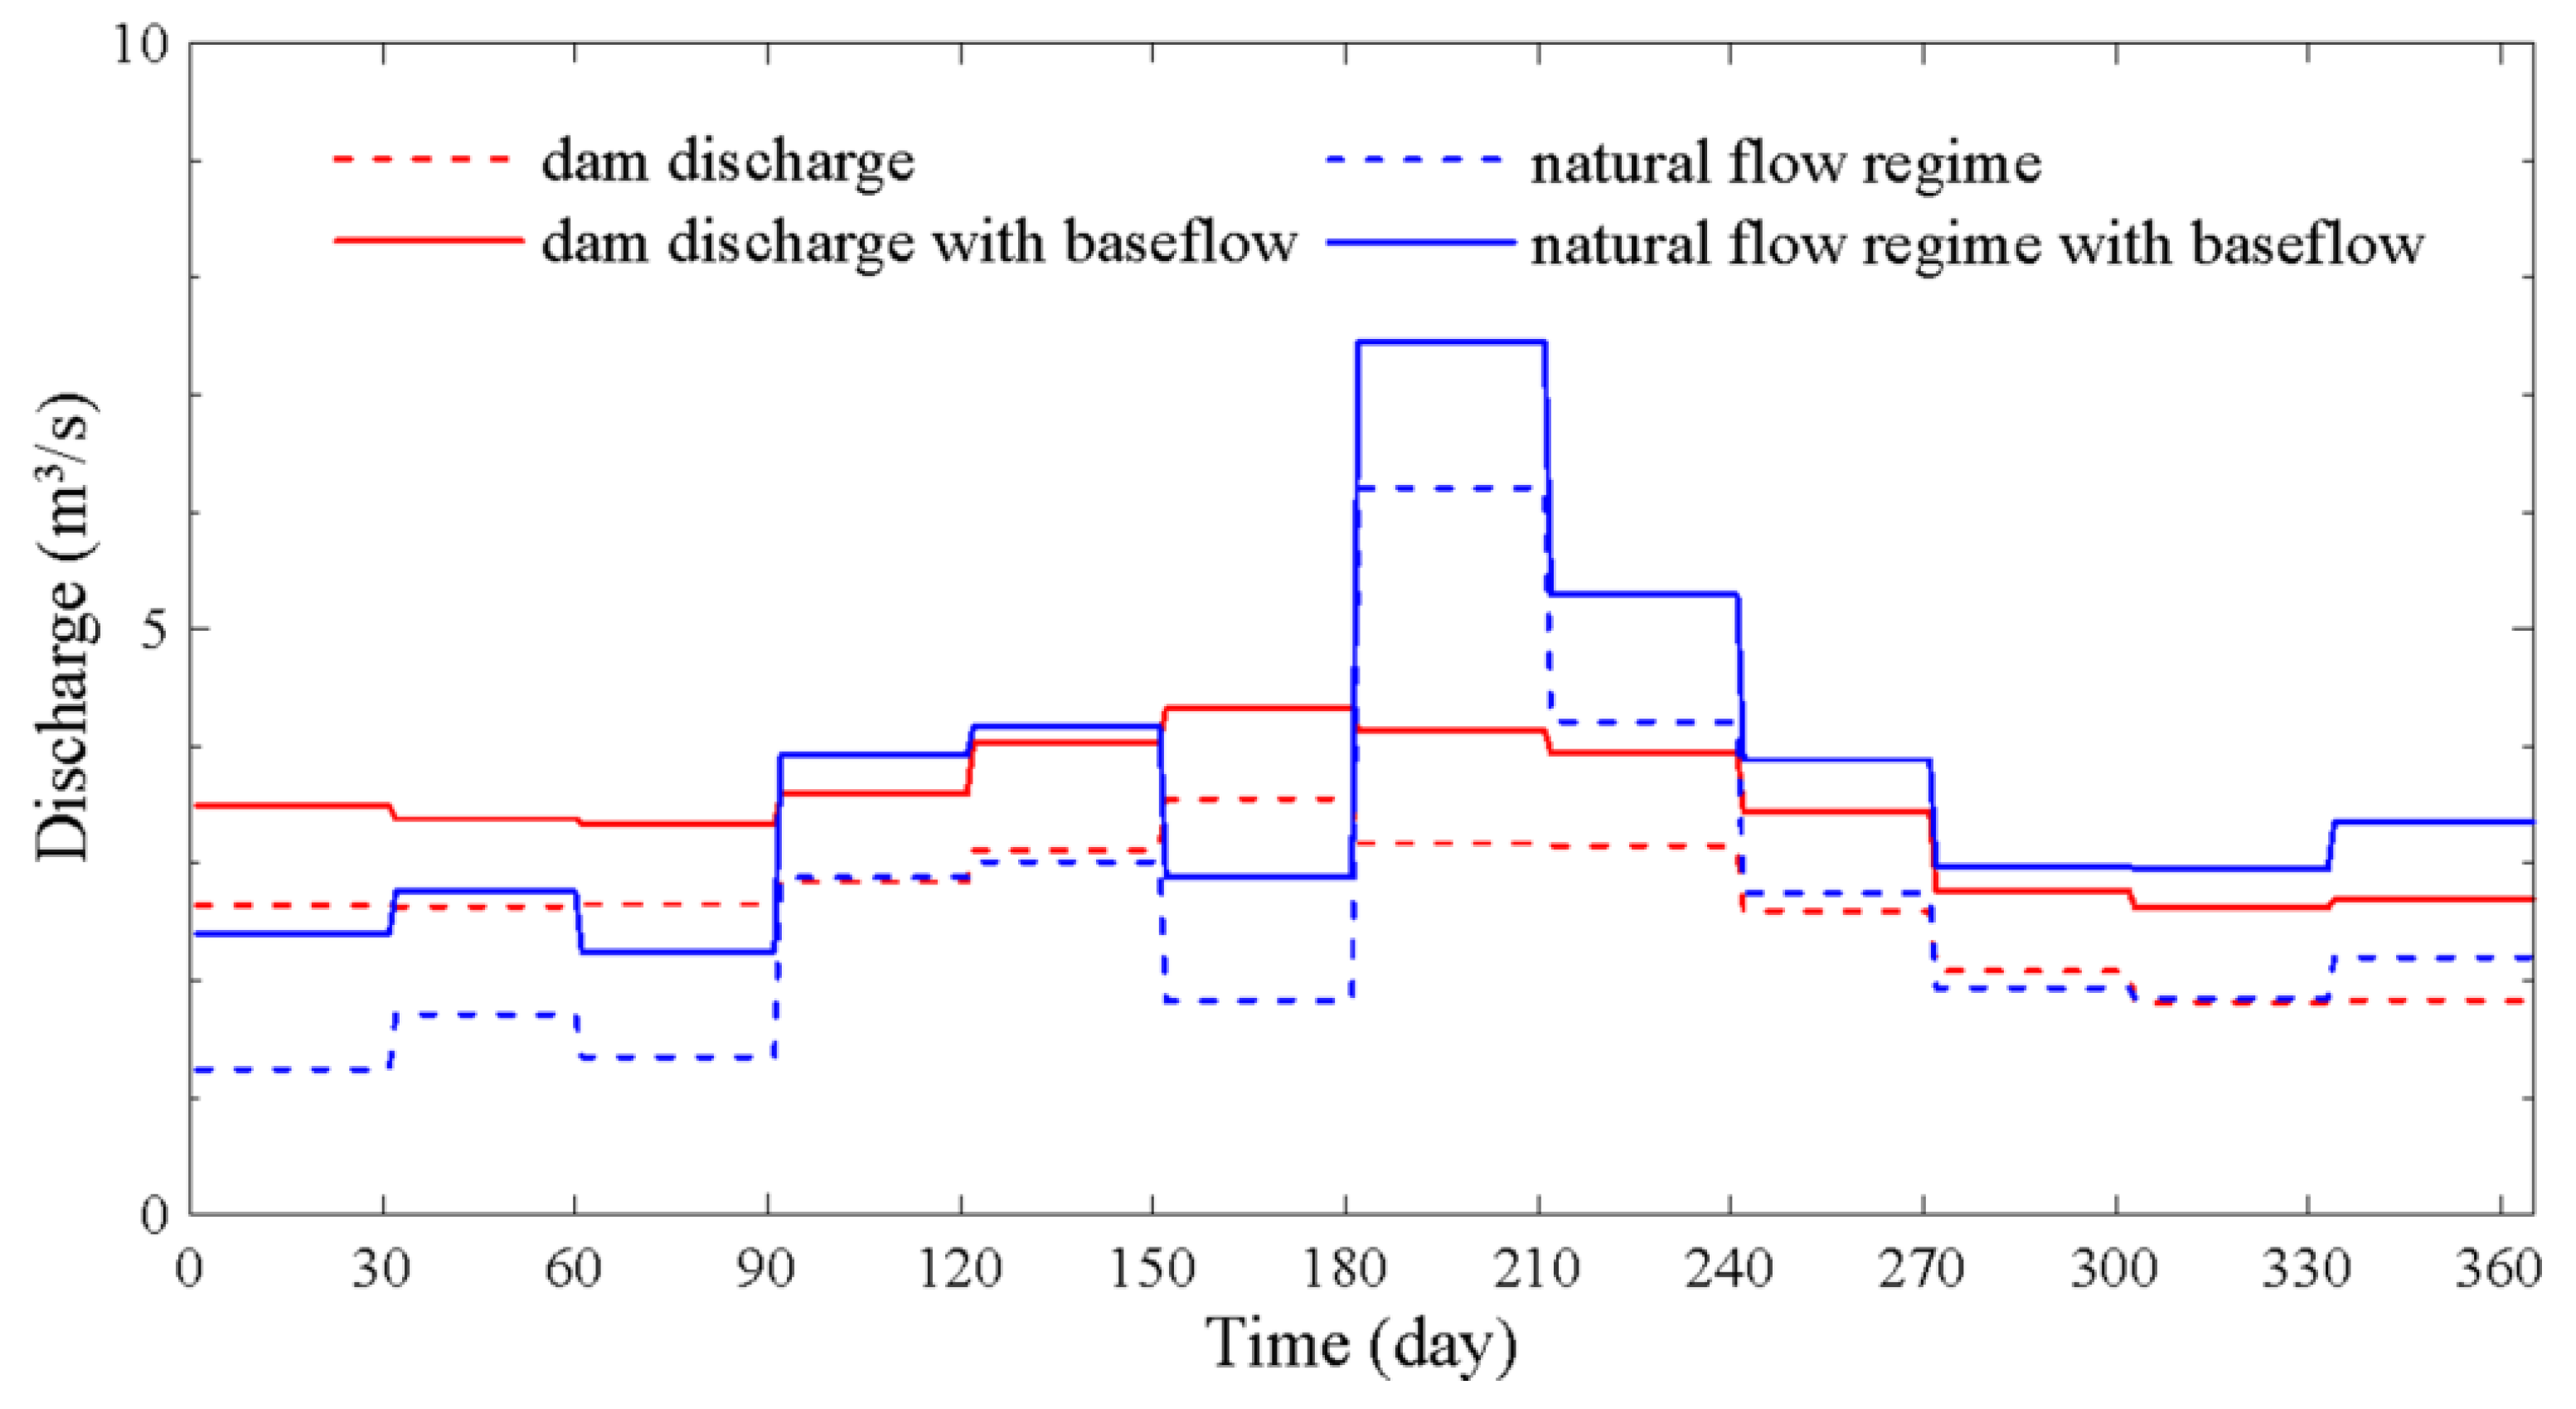
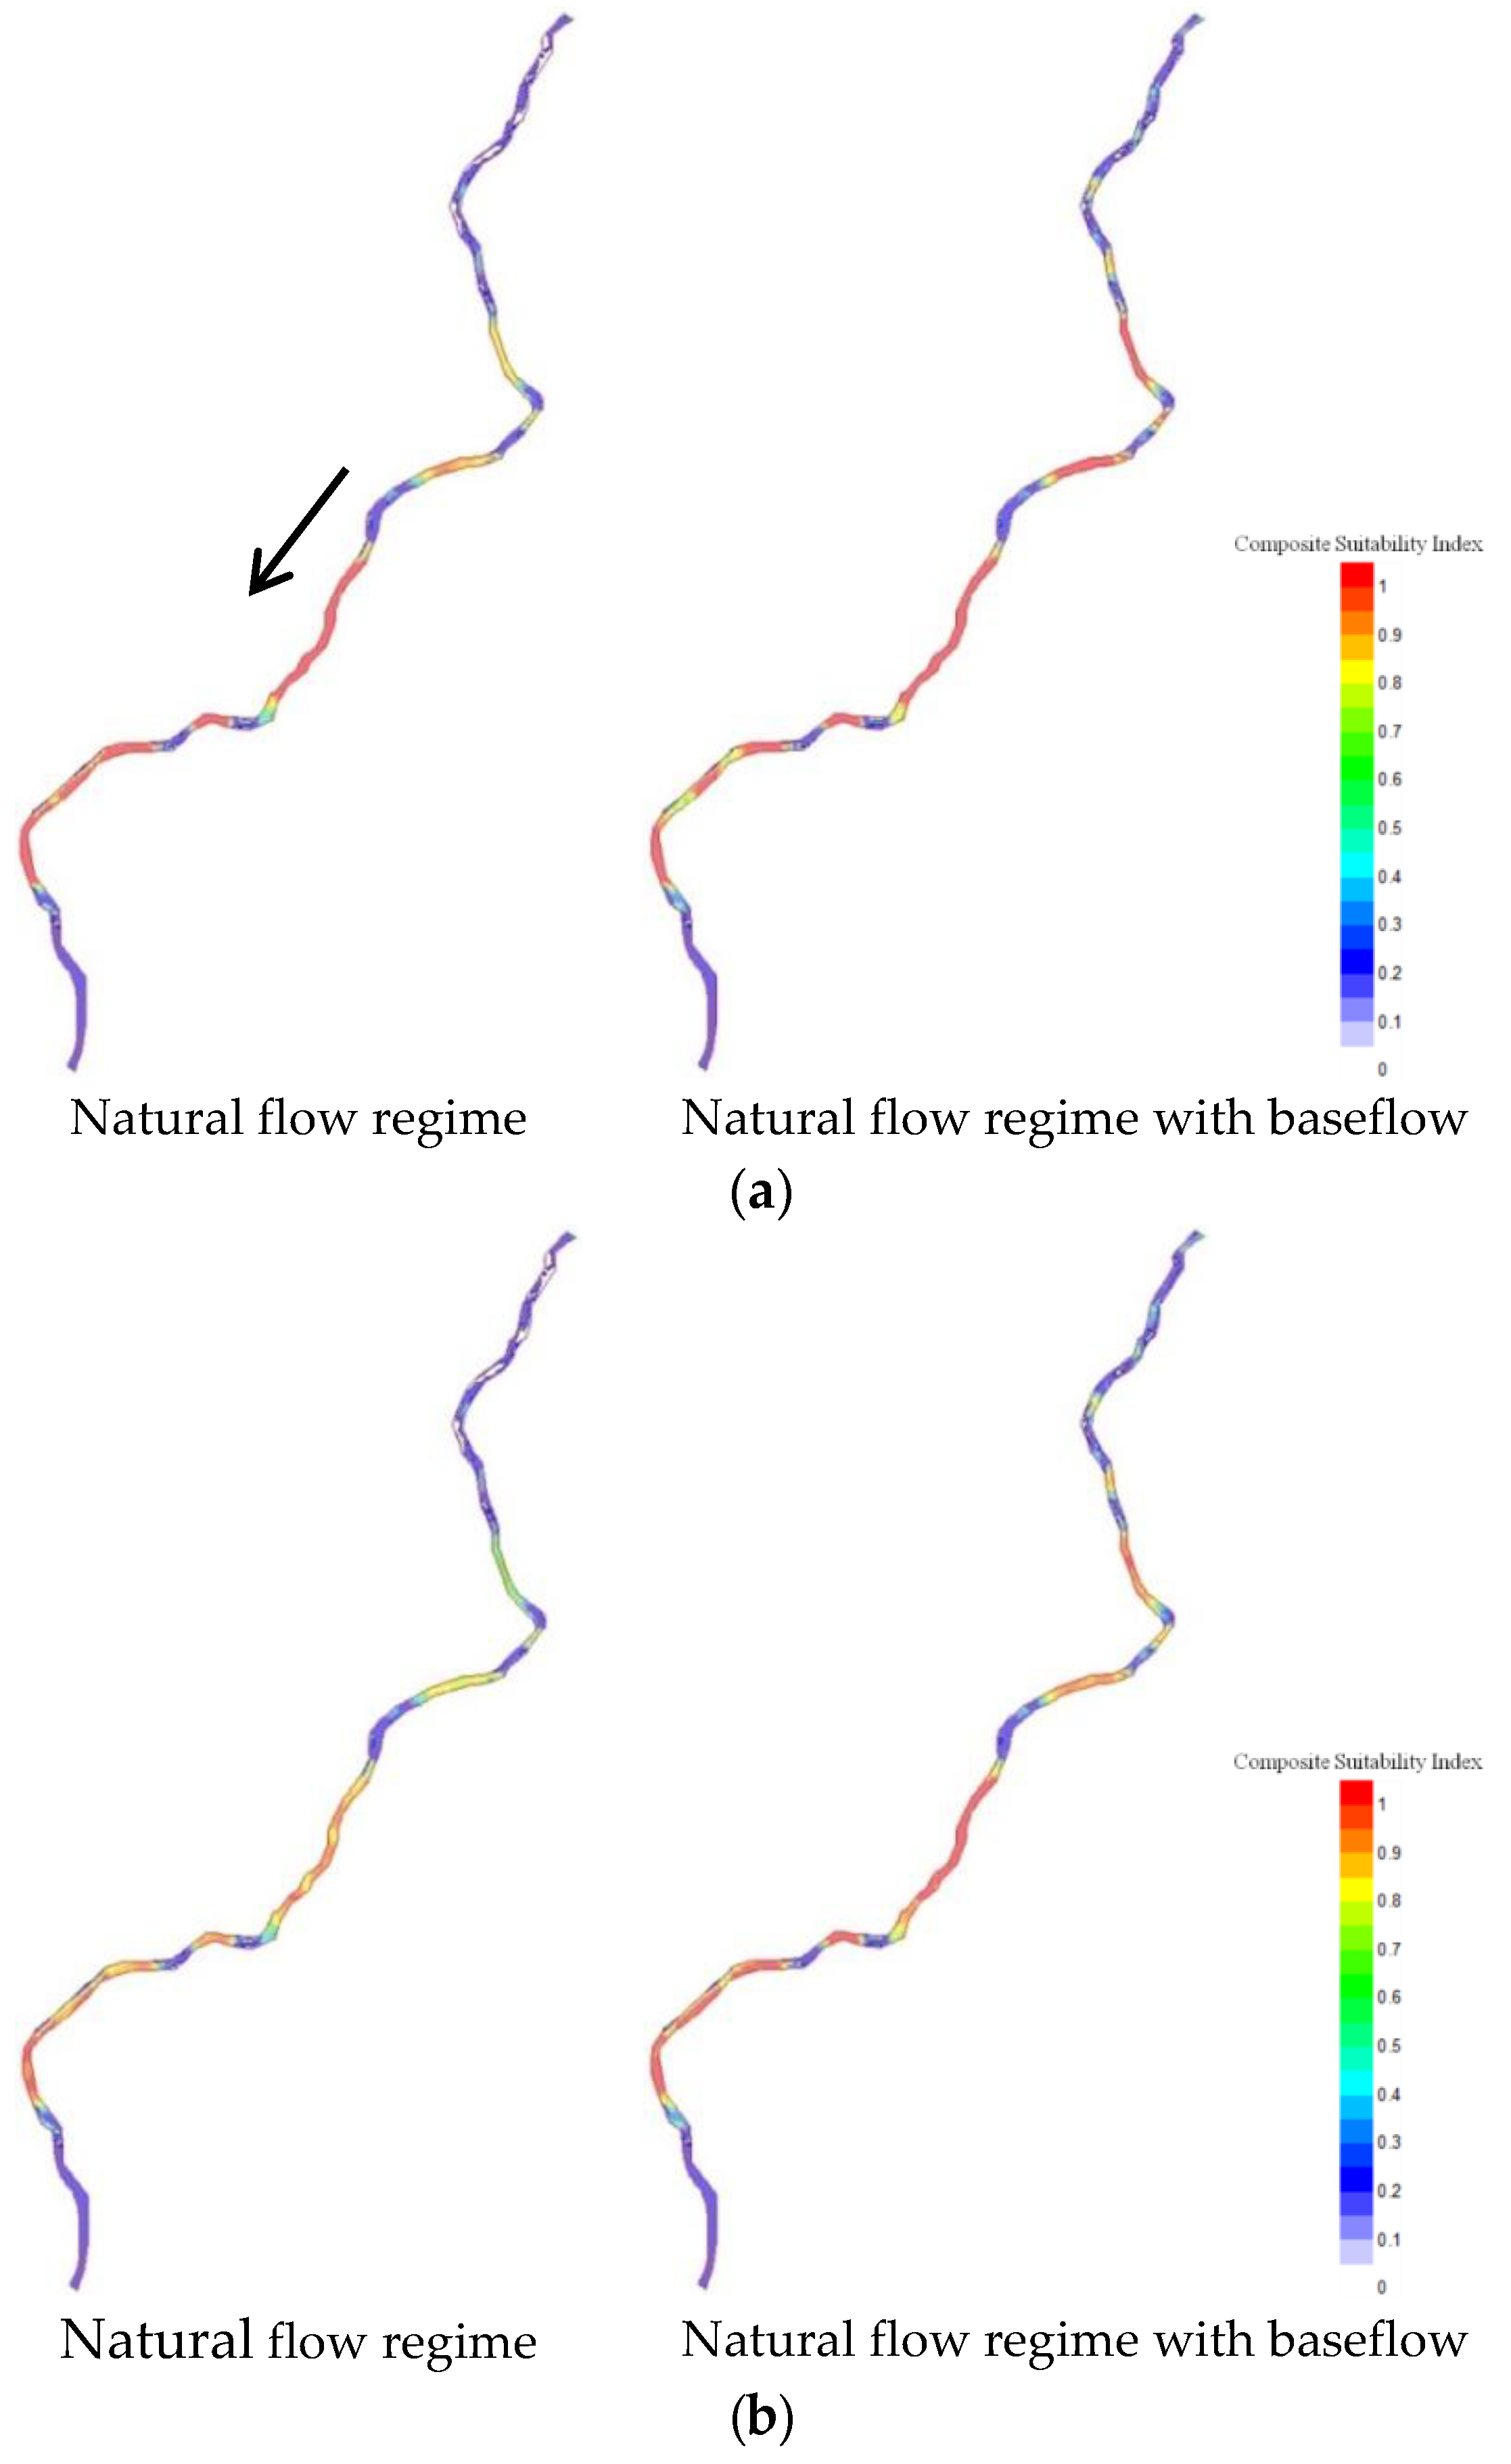
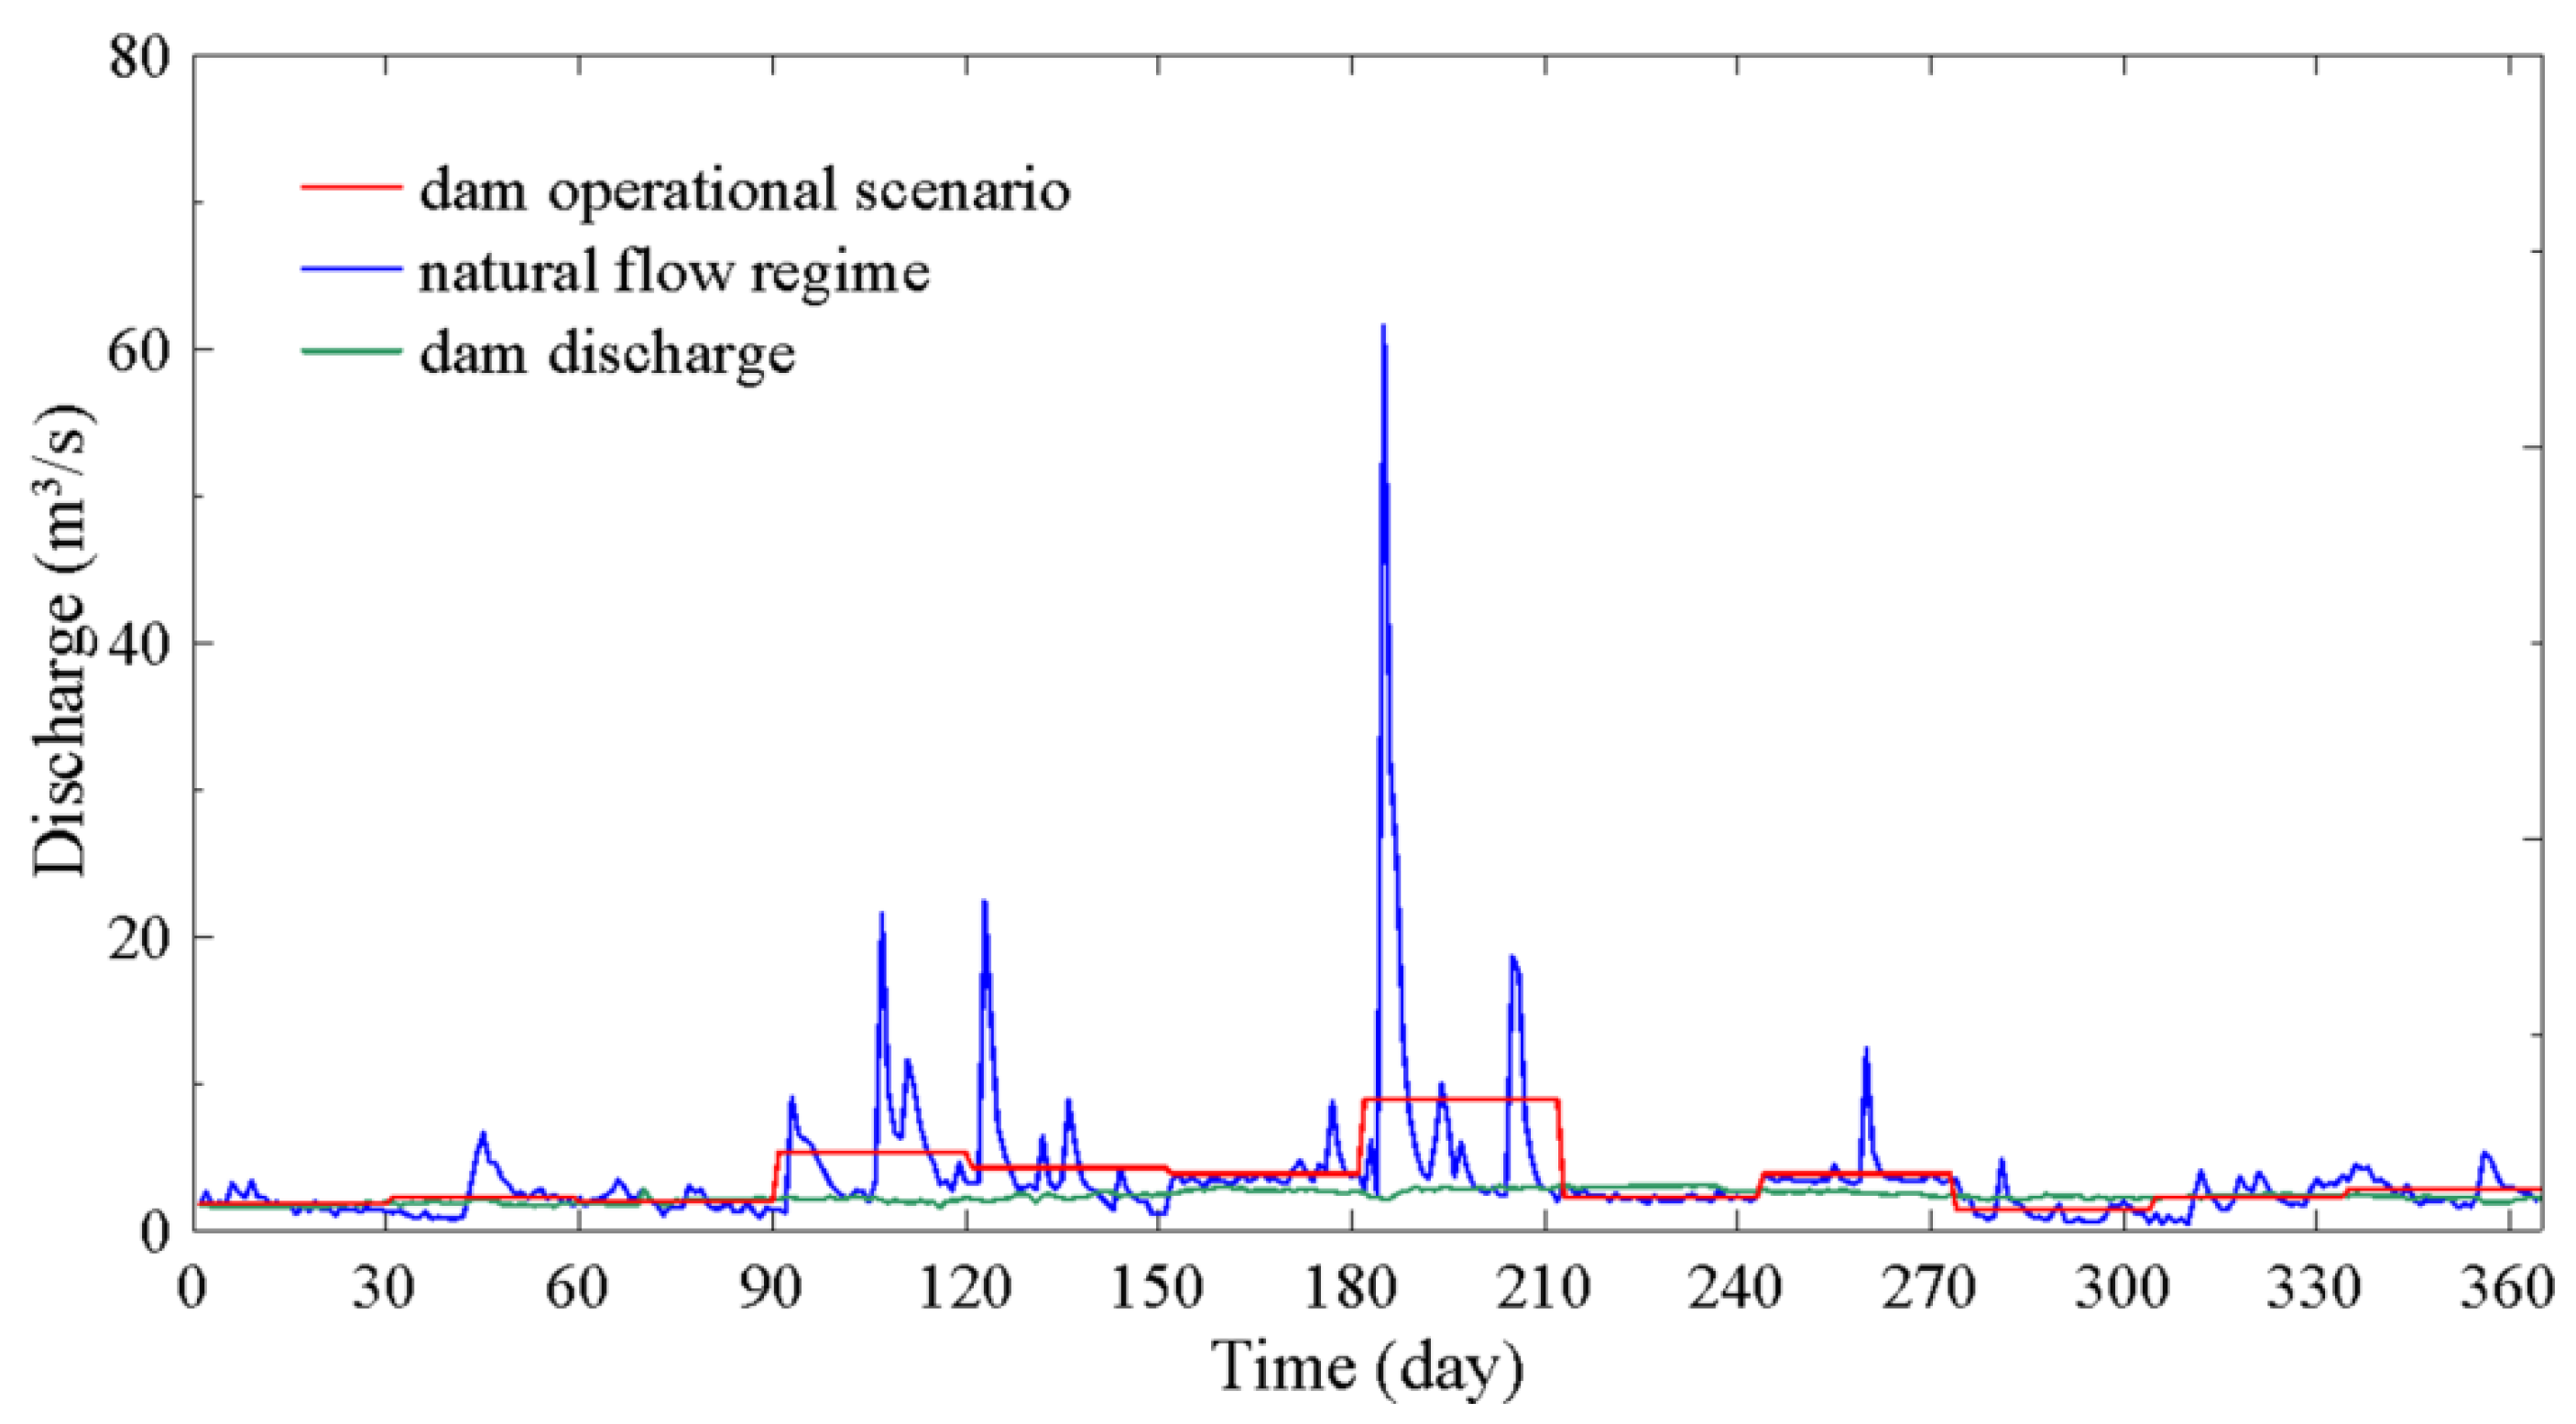
3.3. Flow Regime with Baseflow

Figure 5 shows the discharges with and without considering baseflow in the study reach. The dam discharge and natural flow regime, as shown in Figure 5, were observed in 2015. The dam discharge and natural flow pattern refer to the water released from the upstream dam and the inflow from the upstream reach to the dam, respectively. Then, the baseflow data were calculated using the HGS model. The natural flow regimes were the discharges measured at a station located 3.91 km upstream from the dam, and the data for the dam discharges were obtained from the records of water discharge at the dam. It can be seen that the averaged dam discharges rate was about 3 m3/s throughout the year. However, the natural flow regime can be composed of low flow events and high flow events. Additionally, the total discharge rates of the inflow to the stream were about 1 m3/s and 1.5 m3/s in the downstream reach and upstream reach, respectively.
Figure 6 shows the CSI distributions in the downstream reach for target species under the flow conditions shown in Figure 6. The CSI values represent the habitat quality in the study reach. The computed CSI distributions were averaged over the year. It can be seen that the baseflow significantly increased the habitat suitability compared with the CSI distribution for the dam discharge. It is also interesting to note that the preferred habitats for the target species were distributed more widely than the result that did not consider the baseflow. The preferred ranges of the physical habitat variables for the target species are shown in Figure 4. They prefer shallow water and a high velocity. Physical habitat simulations have taken the baseflow effects into account in habitat modeling, by increasing the velocity increased which improves the habitat suitability. This indicates that the baseflow has a significant effect on fish habitat suitability.
The CSI distributions for the target species in the upstream reach are presented in Figure 7. In the figure, the CSI distributions that were predicted by performing physical habitat simulations with and without considering baseflow are compared. In general, it can be seen that the baseflow increased the CSI relative to the CSI distribution for the natural flow regime. This is consistent with the predicted results in Figure 6. However, the baseflow effect was smaller than the habitat suitability in the downstream reach. This is because the downstream reach is a regulated stream, that is, the downstream aquatic habitat for the target species was destroyed by the upstream dam. This result is consistent with the previous findings of studies conducted by Bowen et al. [76]. It is important to note that the modification of dam operations is expected to affect the habitat suitability for the target species in the downstream reach.

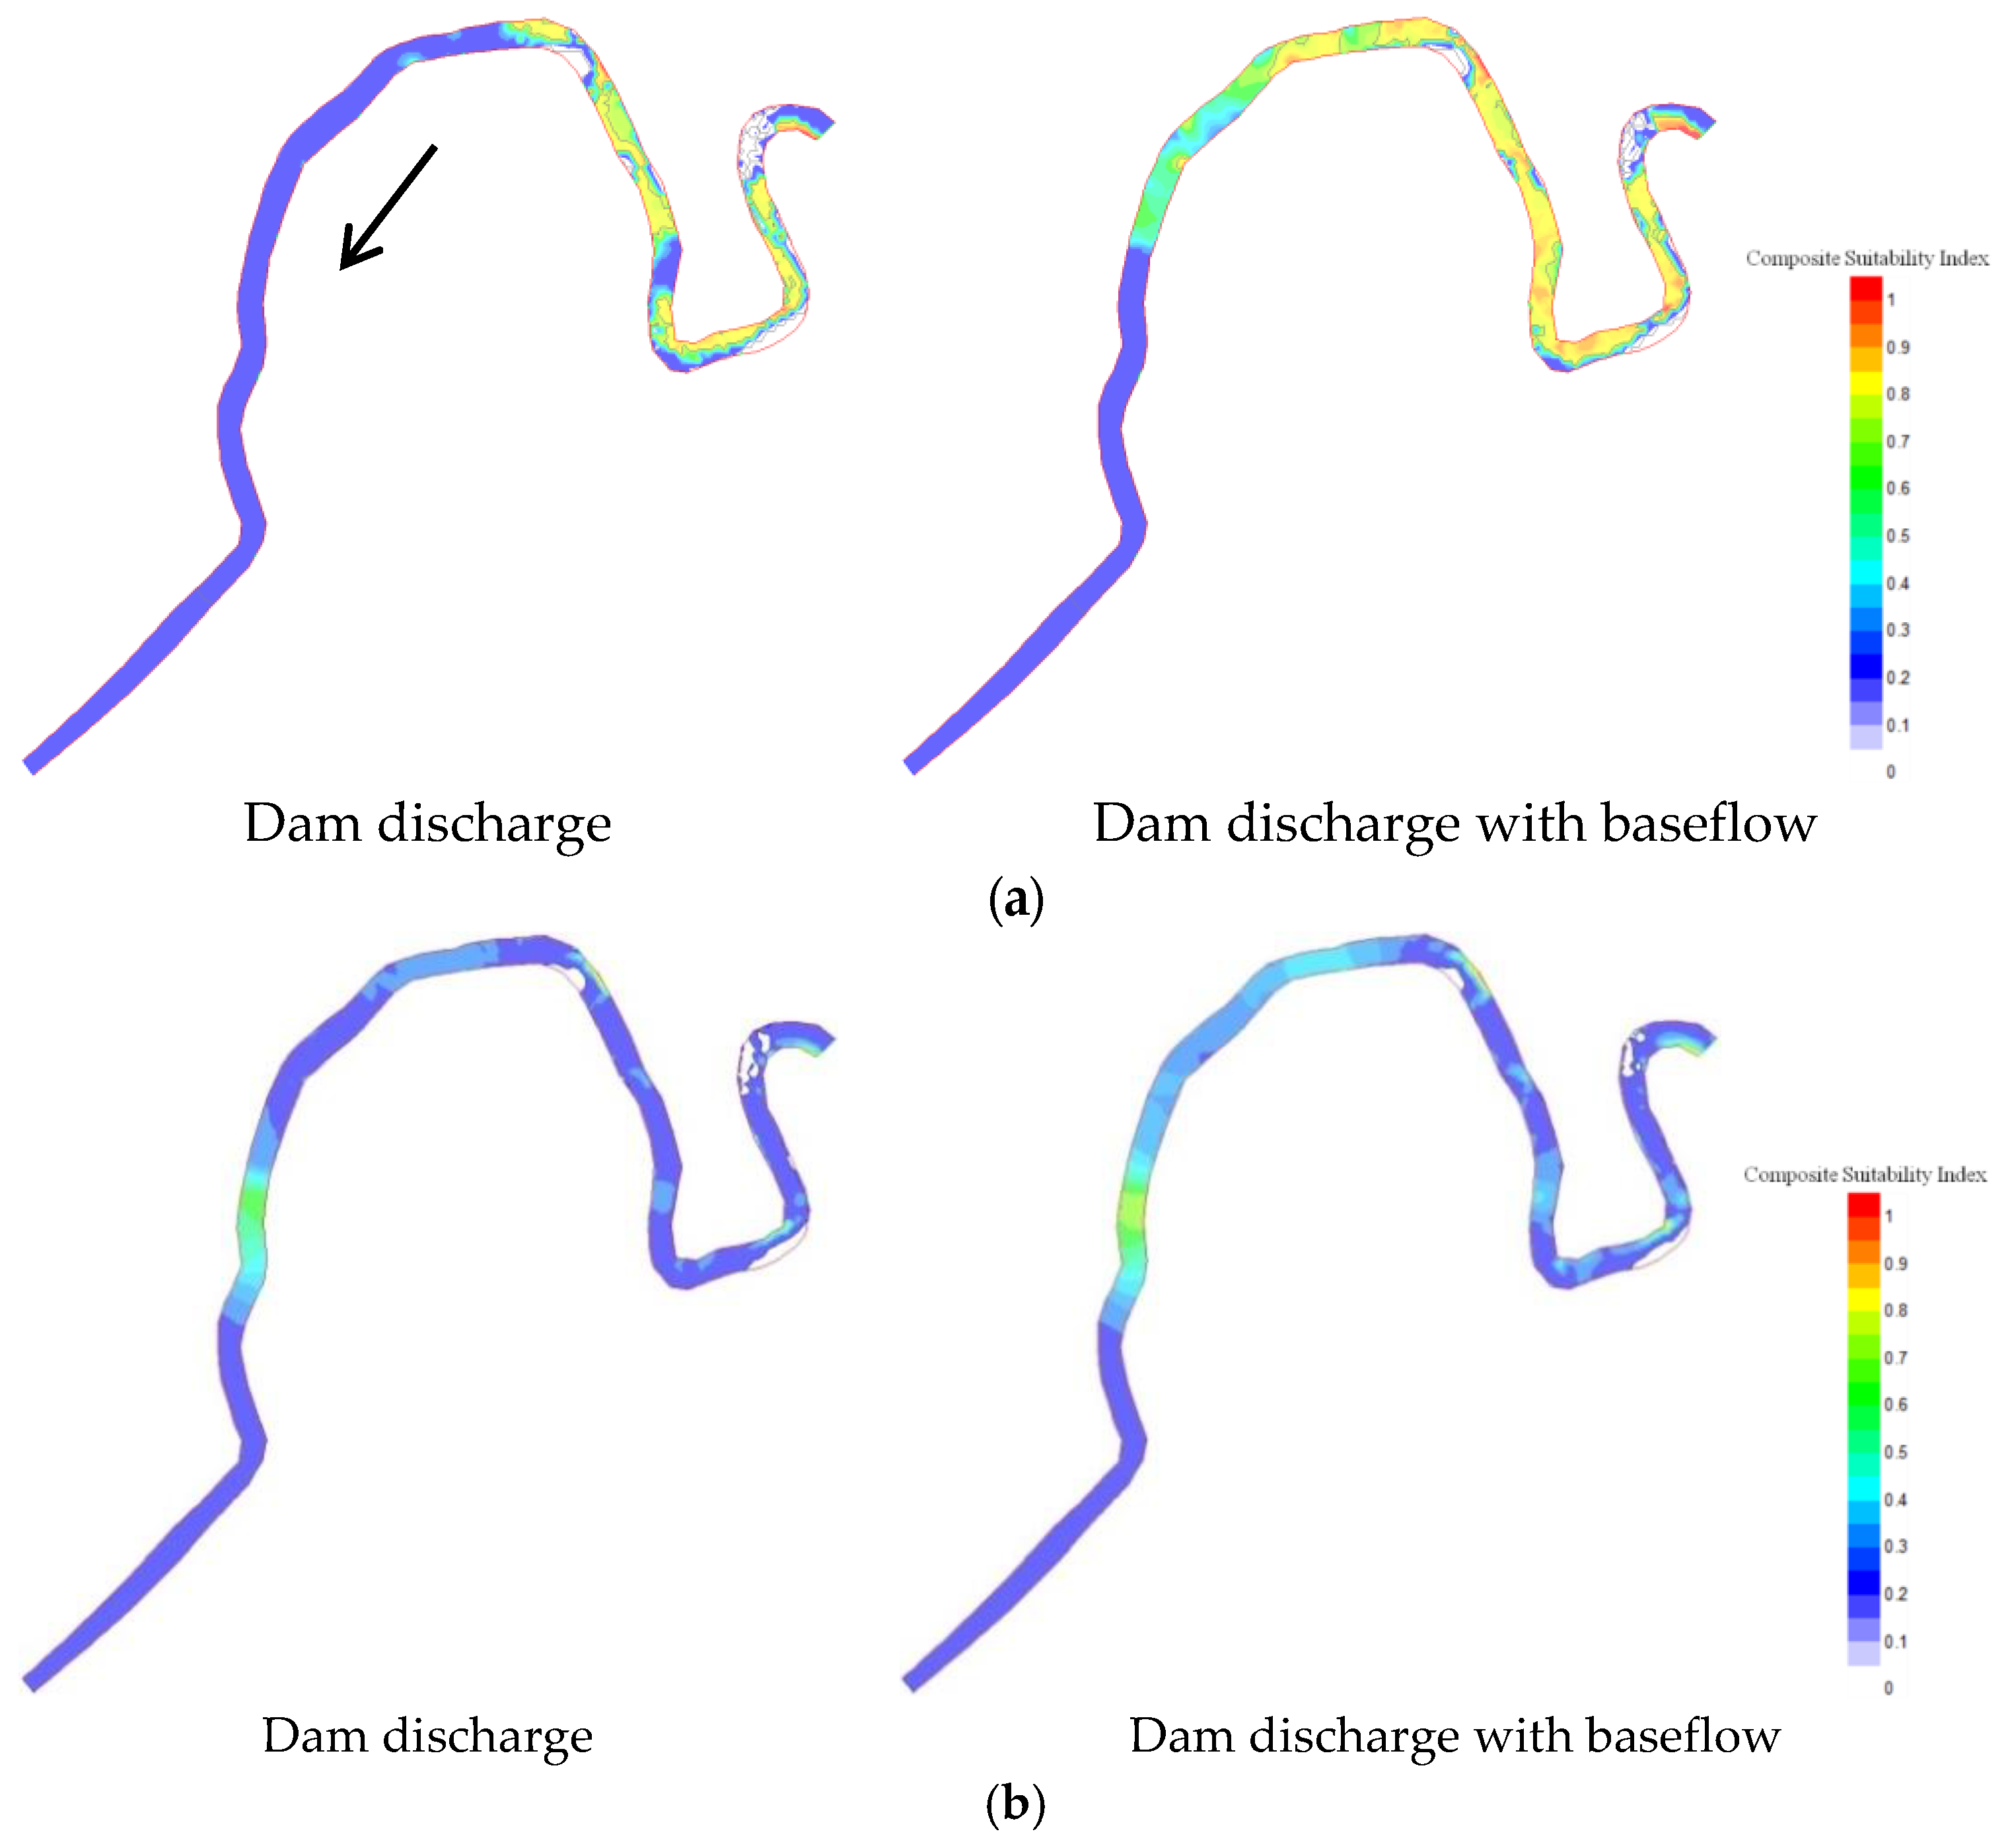
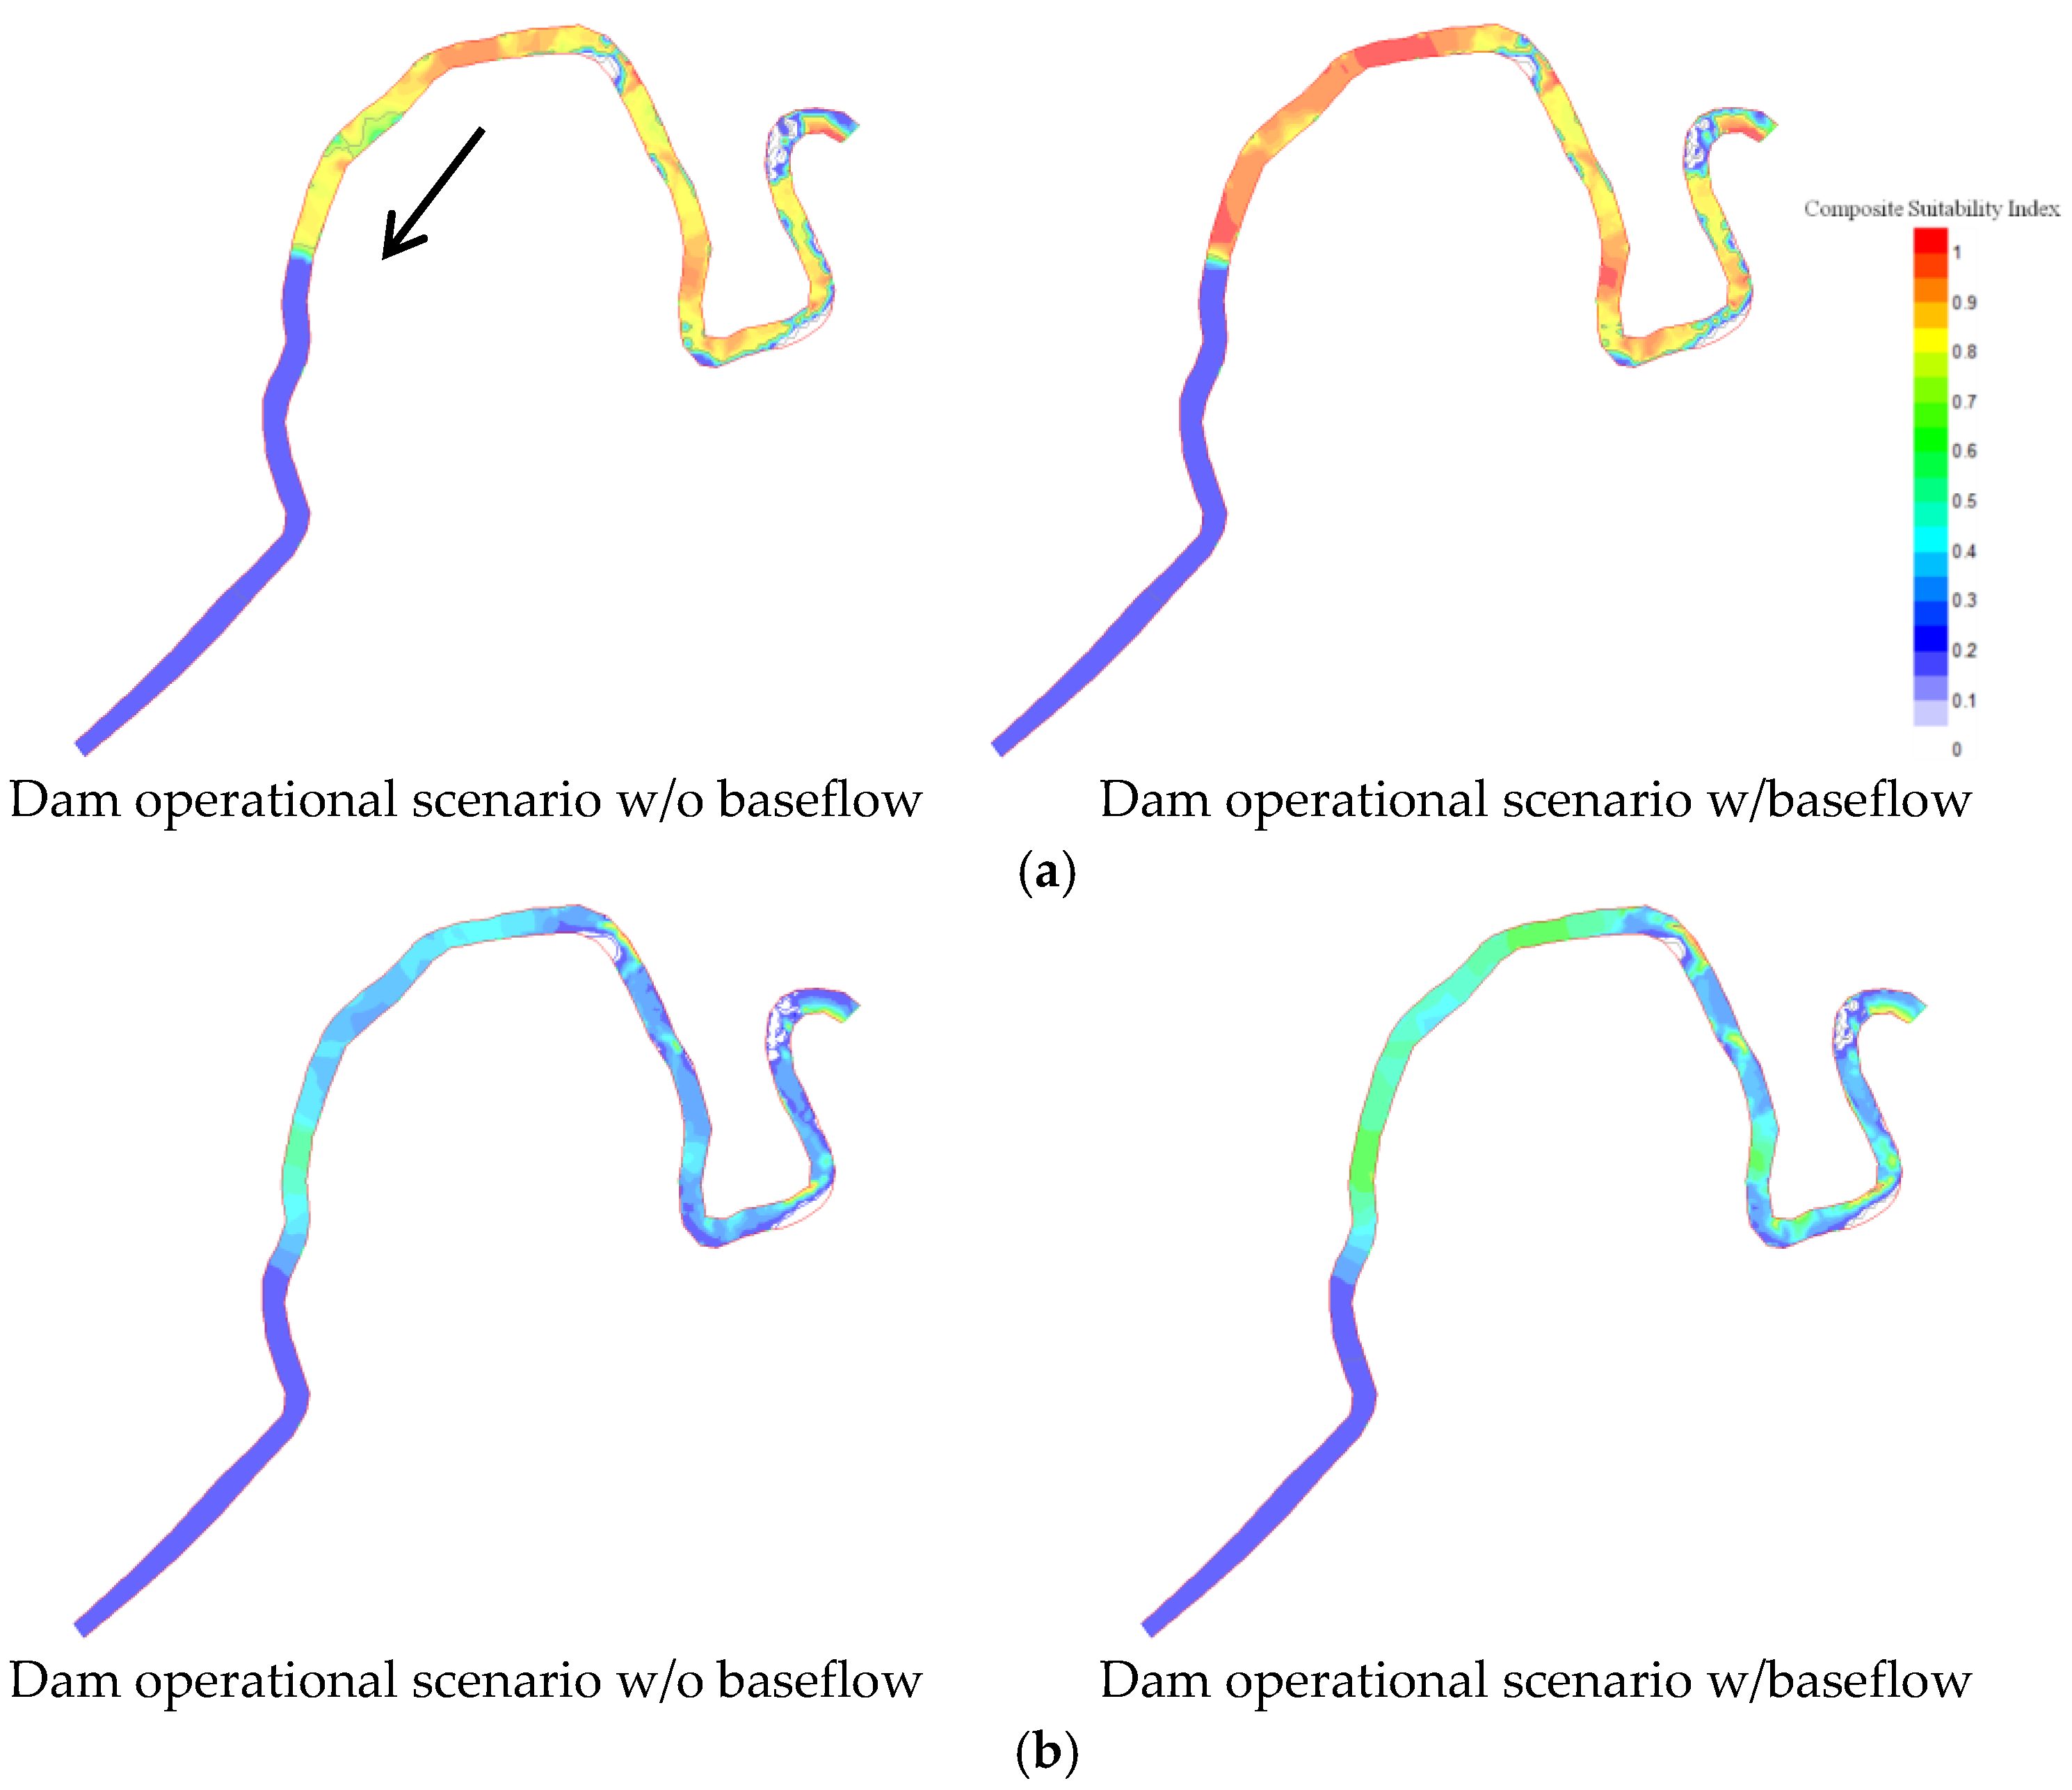
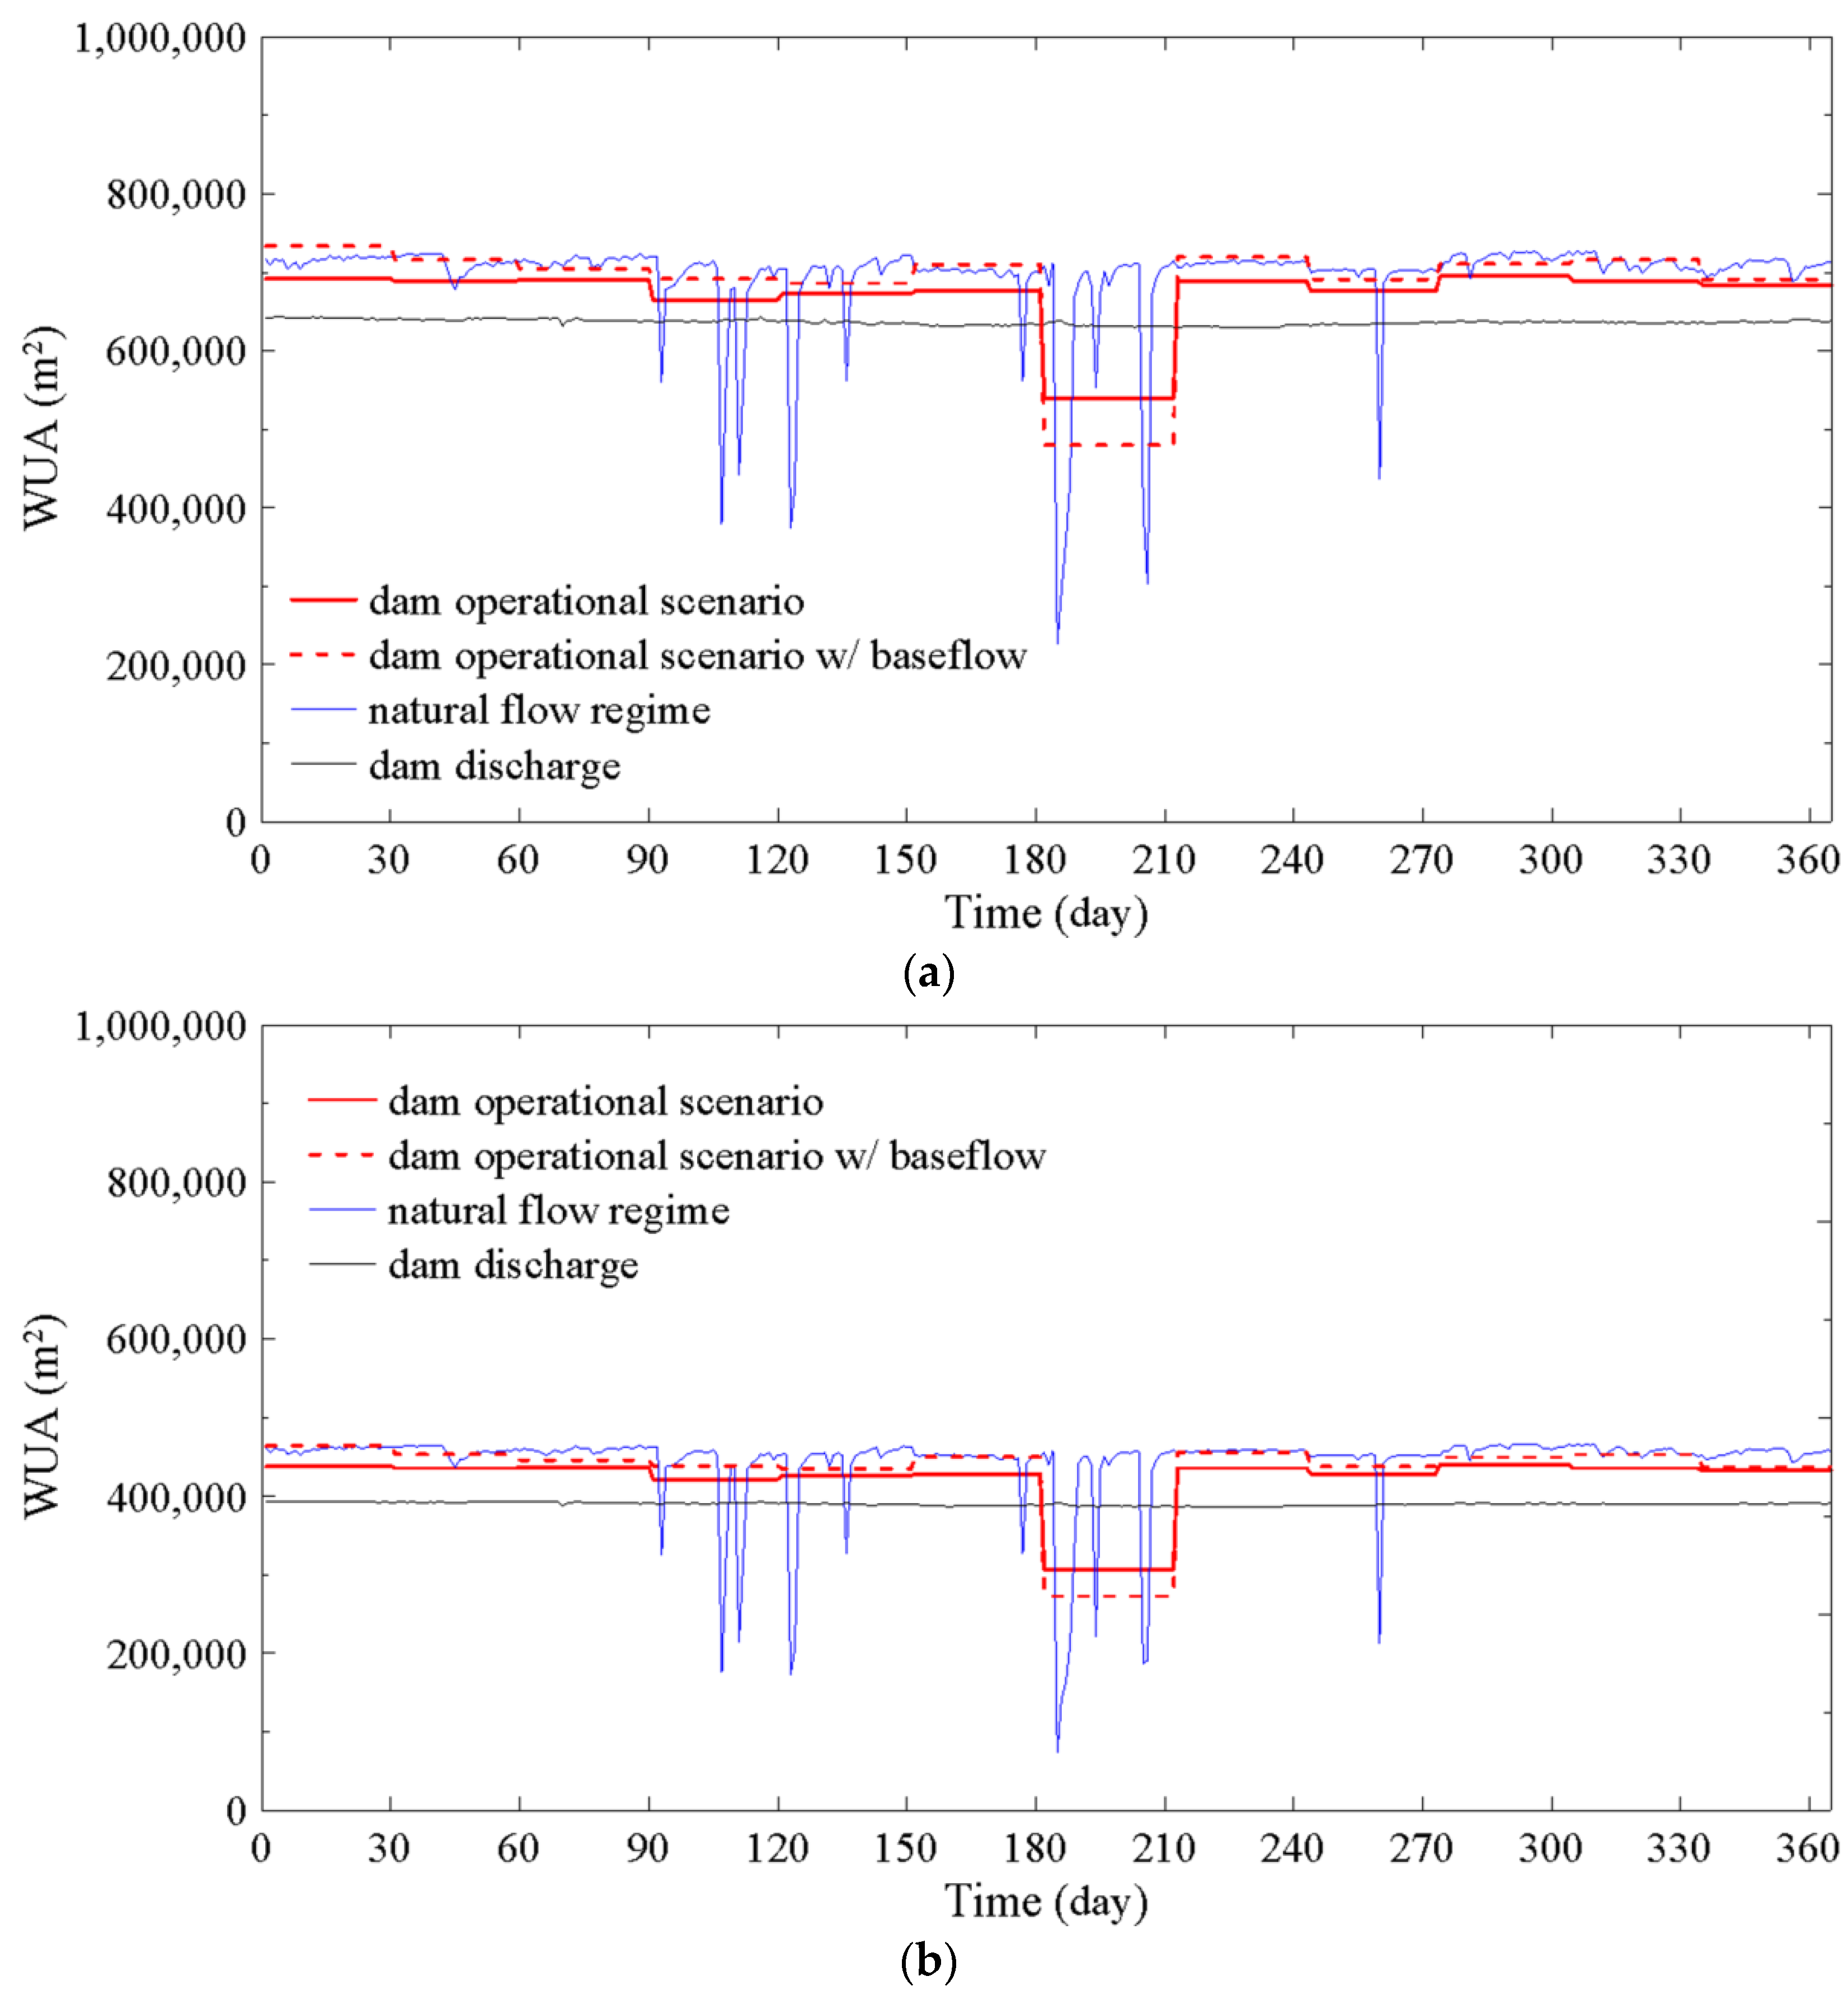
3.4. Modified Dam Operation Scenario for Physical Habitat Simulation

Figure 8 is the modified dam operation scenario for the physical habitat simulation using the BBA. For comparison, the natural flow regime and dam discharges are provided. In the figure, the natural flow regime is composed of the low flow events, high flow events, and flood events. The peak discharge of natural flow regime was 51.3 m3/s in July. Additionally, the figure shows the scenario using the adjusted minimum flow allocation, that is, the hydrologic data averaged over each month. In general, previous studies have shown that released water from the dam adversely affects the downstream habitat [45,46,47]. Physical habitat simulations have quantitatively shown that hydropeaking flows reduce the habitat availability and suitability for certain aquatic species in the downstream reach [49,51,67]. In addition, the change from a natural flow regime to constant flow will directly affect the downstream habitat [67]. Therefore, the use of the modified dam operation scenario (hereafter, this is referred to as the dam operational scenario) is expected to improve the habitat suitability for the target species.

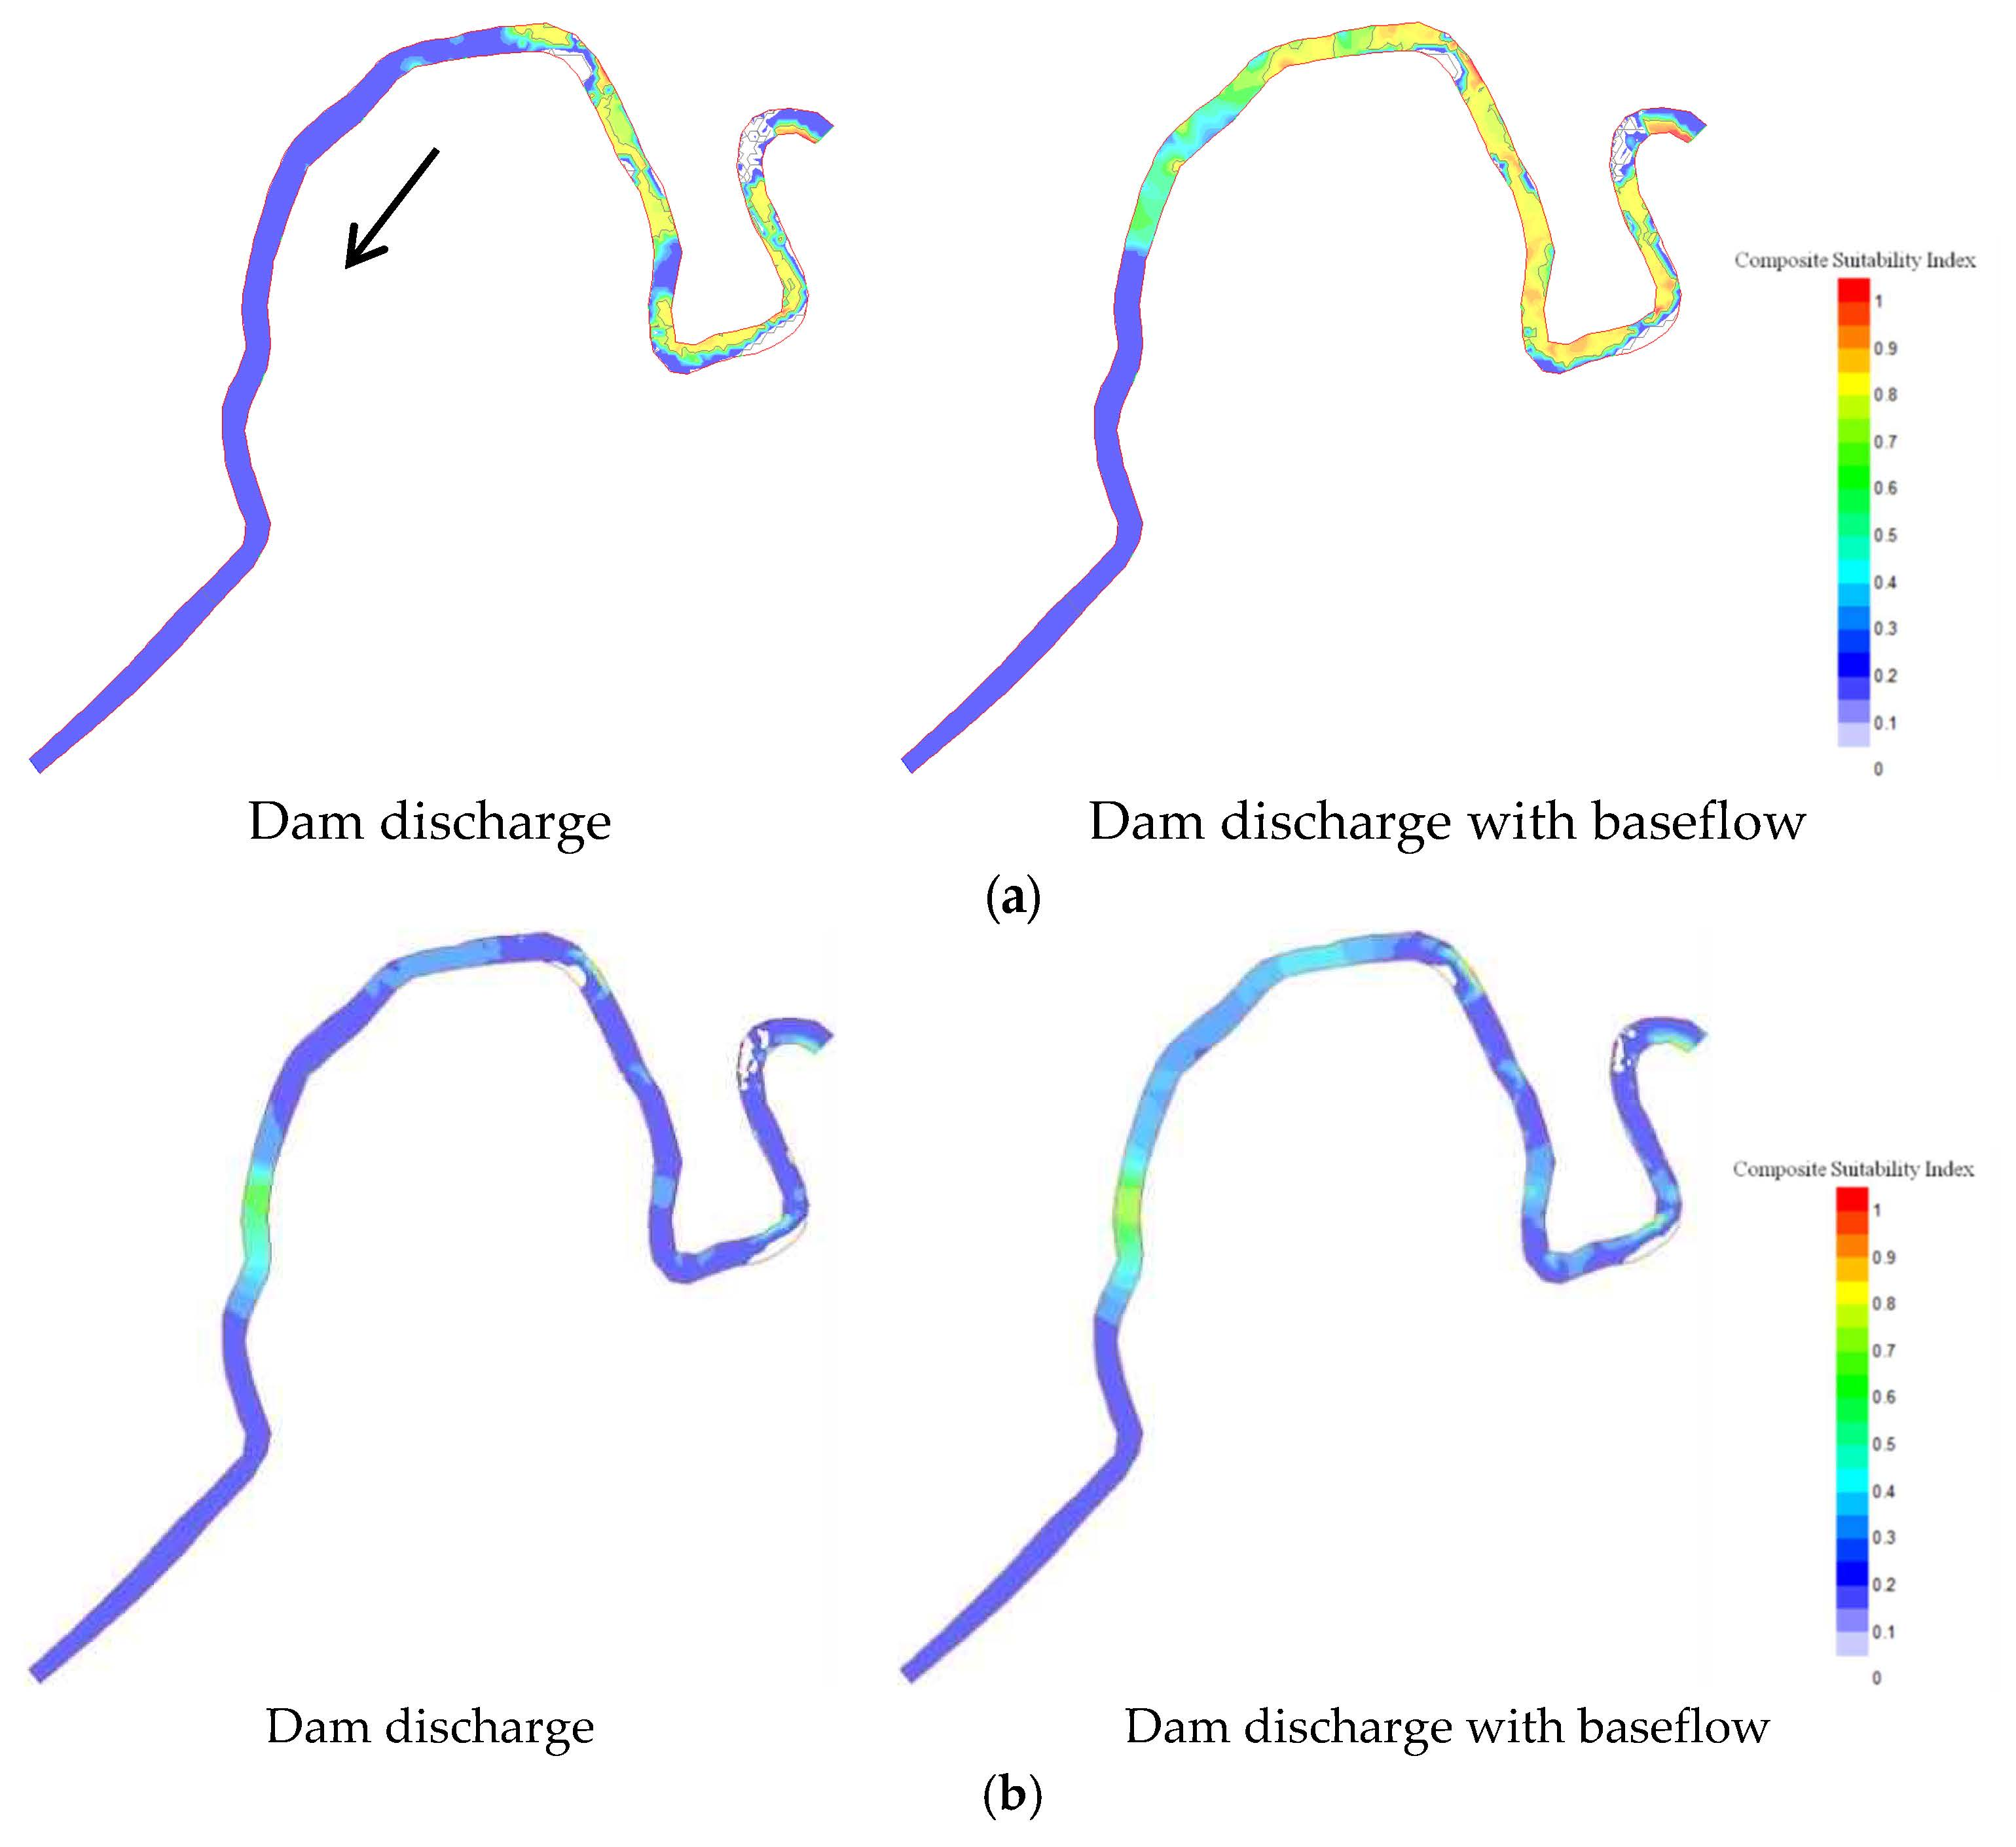
3.5. Changes in CSI and WUA

Figure 9 shows the CSI distributions in the downstream reach for the dam operational scenario. In each case, the CSI distributions obtained from the physical habitat simulations with and without considering the baseflow are compared. Figure 9 shows that the dam operational scenario significantly increased the CSI. This result is consistent with previous findings [67]. Additionally, when the impact of the baseflow was also considered, the habitat suitability for the target species increased further. This is because the dam discharge at the upstream end and the baseflow at each node in the study reach were both considered. This indicates that the baseflow effect should be considered in the assessment of aquatic habitat suitability, especially for streams with large baseflow influences.
The changes in the WUA with time are presented for the target species in Figure 10. In the figure, for comparison, two WUAs for the target species are plotted: the WUAs for the natural flow regime and dam discharge. It can be seen that the effects of the WUAs for the dam operational scenario and natural flow regime were larger than the WUA for the dam discharge, except during the flood season. Quantitatively, the dam operational scenario and natural flow regime increased the WUA by 45.12% and 50.33% for the target species, respectively. Similarly, when the WUA was computed from the physical habitat simulation with the baseflow included, there was a further increase in the WUA of about 9%. This indicates that the dam operational scenario significantly affects the habitat suitability of the target species. The results demonstrate clear evidence that modifying the dam operations through restoration to natural flow patterns but also including the baseflow is the most advantageous method for aquatic species situated downstream from the dam.

4. Conclusions

This study investigated the impact of the baseflow on downstream and upstream dominant target species and proposed a method for modifying the dam operations through the natural flow regime. Downstream and upstream reaches from the Boryeong Dam were chosen for the study area. In the study reach, according to field investigations, the dominant fish and benthic macroinvertebrate species are Zacco platypus and Baetis fuscatus, respectively. The HGS model and River2D model were used to predict the flow, and the HSI model was used for habitat simulation. For habitat simulation, HSCs were used for both dominant fish and benthic macro invertebrate. Three habitat variables—flow depth, velocity, and substrate—were used in the physical habitat simulations.
First, using the HGS model, the longitudinal distributions of the baseflow were presented in the study area. It was found that the baseflow increases gradually with the longitudinal distance. For the dam discharge with and without baseflow, the computed water surface elevations were compared with the measured data. It was shown that the computed water surface elevation method considering baseflow has good agreement. The CSI distributions were presented in the study reach using the HSI model. It was found that the CSI for the baseflow increased significantly in comparison to the CSI when baseflow was not considered. Additionally, the habitat connectivity for the target species significantly improved due to the inclusion of baseflow. In the present study, the consideration of baseflow in the physical habitat simulation satisfied the flow computation results as well as the habitat suitability. Thus, baseflow is an important component which plays an important role in maintaining suitable habitat conditions in the study reach.
In addition, the modified dam operation was proposed as a general strategy for the restoration of the aquatic habitat in the downstream reach of the dam. The method can be used for physical habitat simulation with data from the inflow to the dam. The method used the average hydrologic data over each month. The CSI for the target species was predicted for the dam operational scenario and the water release from the dam. The results indicated that the dam operational scenario significantly increased the CSIs in comparison to the CSI distribution for the water release from the dam. Additionally, the inclusion of baseflow in the physical habitat simulation further increased the habitat suitability.
However, most previous studies on physical habitat simulation did not consider the baseflow from the seepage of water from the ground into the stream. Physical habitat simulations that do not consider the baseflow may underestimate the habitat suitability. The applicability of the modified dam re-operation strategies can be determined further by applying them to various target streams for which the baseflow data are known. In addition, if data on various fish species and benthic macroinvertebrate in streams are available, further research will be required. If the method that includes baseflow is combined for physical habitat simulation, the methodology can support the ecological restoration and management of rivers.

Author Contributions

B.C. performed the hydraulic and habitat simulations and wrote the manuscript. H.K. collected the data and designed the article. W.H.L. contributed to the article’s discussion and revision.

Funding

This research was supported by a grant (12-TI-C02) from the Advanced Research Program funded by the Ministry of Land, Infrastructure and Transport of the Korean government. In addition, this paper is a part of KEI research report (Report Name: “Evaluation of Environmental Ecological Drought Considering Stream Baseflow”).

Acknowledgments

The authors appreciate the suggestions and enthusiastic support of editors and reviewers.

Conflicts of Interest

The authors declare no conflict of interest.

References

  1. Sophocleous, M. Interactions between groundwater and surface water: The state of the science. Hydrogeol. J. 2002, 10, 52–67. [Google Scholar] [CrossRef]
  2. Eckhardt, K.A. comparison of baseflow indices, which were calculated with seven different baseflow separation methods. J. Hydrol. 2008, 352, 168–173. [Google Scholar] [CrossRef]
  3. Hong, J.; Lim, K.J.; Shin, Y.; Jung, Y. Quantifying Contribution of Direct Runoff and Baseflow to Rivers in Han River System, South Korea. J. Korea Water Resour. Assoc. 2015, 48, 309–319. (In Korean) [Google Scholar] [CrossRef] [Green Version]
  4. Lee, J.; Kim, J.; Jang, W.S.; Lim, K.J.; Engel, B.A. Assessment of Baseflow Estimates Considering Recession Characteristics in SWAT. Water 2018, 10, 371. [Google Scholar] [CrossRef]
  5. Power, G.; Brown, R.S.; Imhof, J.G. Groundwater and fish–insights from northern North America. Hydrol. Process. 1999, 13, 401–422. [Google Scholar] [CrossRef]
  6. Malcolm, I.A.; Soulsby, C.; Youngson, A.F.; Hannah, D.M.; Mclaren, I.S.; Thorne, A. Hydrological influences on hyporheic water quality: Implications for salmon egg survival. Hydrol. Process. 2004, 18, 1543–1560. [Google Scholar] [CrossRef]
  7. Beatty, S.J.; Morgan, D.L.; McAleer, F.J.; Ramsay, A.R. Groundwater contribution to baseflow maintains habitat connectivity for Tandanus bostocki (Teleostei: Plotosidae) in a south-western Australian river. Ecol. Freshw. Fish 2010, 19, 595–608. [Google Scholar] [CrossRef]
  8. Vrdoljak, S.M.; Hart, R.C. Groundwater seeps as potentially important refugia for freshwater fishes on the Eastern Shores of Lake St Lucia, KwaZulu-Natal, South Africa. Afr. J. Aquat. Sci. 2007, 32, 125–132. [Google Scholar] [CrossRef]
  9. Hatton, T.; Evans, R. Dependence of Ecosystems on Groundwater and Its Significance to Australia; Land and Water Resources Research and Development Corporation: Canberra, ACT, Australia, 1998.
  10. Murray, B.R.; Zeppel, M.J.B.; Hose, G.C.; Eamus, D. Groundwater-dependent ecosystems in Australia: It’s more than just water for rivers. Ecol. Manag. Restor. 2003, 4, 110–113. [Google Scholar] [CrossRef]
  11. Humphreys, W.F. Aquifers: The ultimate groundwaterdependent ecosystems. Aust. J. Bot. 2006, 54, 115–132. [Google Scholar] [CrossRef]
  12. Isaak, D.J.; Thurow, R.F.; Rieman, B.E.; Dunham, J.B. Chinook salmon use of spawning patches: Relative roles of habitat quality, size, and connectivity. Ecol. Appl. 2007, 17, 352–364. [Google Scholar] [CrossRef] [PubMed]
  13. Danehy, R.J.; Bilby, R.E.; Owen, S.; Duke, S.D.; Farrand, A. Interactions of baseflow habitat constraints: Macroinvertebrate drift, stream temperature, and physical habitat for anadromous salmon in the Calapooia River, Oregon. Aquat. Conserv. Mar. Freshw. Ecosyst. 2017, 27, 653–662. [Google Scholar] [CrossRef]
  14. Hitchman, S.M.; Mather, M.E.; Smith, J.M.; Fencl, J.S. Identifying keystone habitats with a mosaic approach can improve biodiversity conservation in disturbed ecosystems. Glob. Chang. Biol. 2018, 24, 308–321. [Google Scholar] [CrossRef] [PubMed]
  15. Hall, F.R. Base-flow recessions—A review. Water Resour. Res. 1968, 4, 973–983. [Google Scholar] [CrossRef]
  16. Tallaksen, L.M. A review of baseflow recession analysis. J. Hydrol. 1995, 165, 349–370. [Google Scholar] [CrossRef]
  17. Smakhtin, V.U. Low flow hydrology: A review. J. Hydrol. 2001, 240, 147–186. [Google Scholar] [CrossRef]
  18. Rutledge, A.T.; Mesko, T.O. Estimated Hydrologic Characteristics of Shallow Aquifer Systems in the Valley and Ridge, the Blue Ridge, and the Piedmont Physiographic Provinces Based on Analysis of Streamflow Recession and Base Flow; U.S. Geological Survey: Reston, VA, USA, 1996; pp. 1–58.
  19. Molugaram, K.; Rao, G.S.; Shah, A.; Davergave, N. Chapter 5—Curve Fitting. In Statistical Techniques for Transportation Engineering; Butterworth-Heinemann: Woburn, MA, USA, 2017; pp. 281–292. [Google Scholar]
  20. Healy, R.W.; Cook, P.G. Using groundwater levels to estimate recharge. Hydrogeol. J. 2002, 10, 91–109. [Google Scholar] [CrossRef]
  21. Pettyjohn, W.A.; Henning, R. Preliminary Estimate of Ground-Water Recharge Rates, Related Streamflow and Water Quality in Ohio; Ohio State University Water Resources Center Project Completion Report Number 552; Water Resources Center, Ohio State University: Columbus, OH, USA, 1979; 323p. [Google Scholar]
  22. Sloto, R.A.; Crouse, M.Y. HYSEP: A Computer Program for Streamflow Hydrograph Separation and Analysis; No. 96-4040, U.S. Geological Survey Water-Resources Investigations Report; U.S. Geological Survey: Reston, VA, USA, 1996; pp. 1–54.
  23. Rutledge, A. Computer Programs for Describing the Recession of Ground-Water Discharge and for Estimating Mean Ground-Water Recharge and Discharge from Stream-Flow Records: Update; U.S. Geological Survey Water-Resources Investigations Report Number 98-4148; U.S. Geological Survey: Reston, VA, USA, 1998; pp. 1–52.
  24. Arnold, J.G.; Allen, P.M. Automated Methods for Estimating Baseflow and Groundwater Recharge from Streamflow Records. J. Am. Water Resour. Assoc. 1999, 35, 411–424. [Google Scholar] [CrossRef]
  25. Lim, K.J.; Engel, B.A.; Tang, Z.; Choi, J.; Kim, K.; Muthu, K.S.; Tripathy, D. Automated Web GIS Based Hydrograph Analysis Tool, WHAT 1. J. Am. Water Resour. Assoc. 2005, 41, 1407–1416. [Google Scholar] [CrossRef]
  26. Hwang, H.T.; Park, Y.J.; Sudicky, E.A.; Forsyth, P.A. A parallel computational framework to solve flow and transport in integrated surface–subsurface hydrologic systems. Environ. Model. Softw. 2014, 61, 39–58. [Google Scholar] [CrossRef]
  27. Aquanty Inc. HydroGeoSphere. A Three-Dimensional Numerical Model Describing Fully-Integrated Subsurface and Surface Flow and Solute Transport; Aquanty Inc.: Waterloo, ON, Canada, 2015. [Google Scholar]
  28. Han, S.-Y.; Kwak, S.-J.; Yoo, S.-H. Valuing environmental impacts of large dam construction in Korea: An application of choice experiments. Environ. Impact Assess. Rev. 2008, 28, 256–266. [Google Scholar] [CrossRef]
  29. Makrakis, M.C.; Miranda, L.E.; Makrakis, S.; Fontes, H.M.; Morlis, W.G.; Dias, J.H.P.; Garcia, J.O. Diversity in migratory patterns among Neotropical fishes in a highly regulated river basin. J. Fish Biol. 2012, 81, 866–881. [Google Scholar] [CrossRef] [PubMed]
  30. Brown, J.J.; Limburg, K.E.; Waldman, J.R.; Stephenson, K.; Glenn, E.P.; Juanes, F.; Jordaan, A. Fish and hydropower on the US Atlantic coast: Failed fisheries policies from half-way technologies. Conserv. Lett. 2013, 6, 280–286. [Google Scholar] [CrossRef]
  31. Tonkin, J.D.; Death, R.G.; Joy, M.K. Invertebrate Drift Patterns in a Regulated River: Dams, Periphyton Biomass or Longitudinal Patterns? River Res. Appl. 2009, 25, 1219–1231. [Google Scholar] [CrossRef]
  32. Wang, Z.Y.; Lee, J.H.W.; Xu, M.Z. Eco-hydraulics and eco-sedimentation studies in China. J. Hydraul. Res. 2013, 51, 19–32. [Google Scholar] [CrossRef]
  33. Shen, Y.; Diplas, P. Modeling unsteady flow characteristics of hydropeaking operations and their implications on fish habitat. J. Hydraul. Eng. 2010, 136, 1053–1066. [Google Scholar] [CrossRef]
  34. Grand, T.C.; Railsback, S.F.; Hayse, J.W.; Lagory, K.E. A physical habitat model for predicting the effects of flow fluctuations in nursery habitats of the endangered Colorado pikeminnow (Ptychocheilus lucius). River Res. Appl. 2006, 22, 1125–1142. [Google Scholar] [CrossRef]
  35. Yi, Y.; Wang, Z.; Yang, Z. Impact of the Gezhouba and Three Gorges Dams on habitat suitability of carps in the Yangtze River. J. Hydrol. 2010, 387, 283–291. [Google Scholar] [CrossRef]
  36. Käiro, K.; Möls, T.; Timm, H.; Virro, T.; Järvekülg, R. The effect of damming on biological quality according to macroinvertebrates in some Estonian streams, Central—Baltic Europe: A pilot study. River Res. Appl. 2011, 27, 895–907. [Google Scholar] [CrossRef]
  37. Bruno, M.C.; Siviglia, A. Assessing Impacts of Dam Operations-Interdisciplinary Approaches for Sustainable Regulated River Management. River Res. Appl. 2012, 28, 675–677. [Google Scholar] [CrossRef]
  38. Sinokrot, B.A.; Gulliver, J.S. In-stream flow impact on river water temperatures. J. Hydraul. Res. 2000, 38, 339–349. [Google Scholar] [CrossRef]
  39. Krause, C.W.; Newcomb, T.J.; Orth, D.J. Thermal habitat assessment of alternative flow scenarios in a tailwater fishery. River Res. Appl. 2005, 21, 581–593. [Google Scholar] [CrossRef]
  40. Richter, B.D.; Baumgartner, J.V.; Powell, J.; Braun, D.P. A method for assessing hydrologic alteration within ecosystems. Conserv. Biol. 1996, 10, 1163–1174. [Google Scholar] [CrossRef]
  41. Wills, T.C.; Baker, E.A.; Nuhfera, A.J.; Zornb, T.G. Response of the benthic macroinvertebrate community in a northern Michigan stream to reduced summer streamflows. River Res. Appl. 2006, 22, 819–836. [Google Scholar] [CrossRef] [Green Version]
  42. Poff, N.L.; Allan, J.D.; Bain, M.B.; Karr, J.R.; Prestegaard, K.L.; Richter, B.D.; Sparks, R.E.; Stromberg, J.C. The natural flow regime: A paradigm for river conservation and restoration. BioScience 1997, 47, 769–784. [Google Scholar] [CrossRef]
  43. Postel, S.; Richter, B.D. Rivers for Life: Managing Water for People and Nature; Island Press: Washington, DC, USA, 2003. [Google Scholar]
  44. Nguyen, T.H.T.; Everaert, G.; Boets, P.; Forio, M.A.E.; Bennetsen, E.; Volk, M.; Hoang, T.H.T.; Goethals, P.L. Modelling Tools to Analyze and Assess the Ecological Impact of Hydropower Dams. Water 2018, 10, 259. [Google Scholar] [CrossRef]
  45. Valentin, S.; Lauters, F.; Sabaton, C.; Breil, P.; Souchon, Y. Modelling temporal variations of physical habitat for brown trout (Salmo trutta) in hydropeaking conditions. Regul. Rivers 1996, 12, 317–330. [Google Scholar] [CrossRef]
  46. Booker, D.J.; Dunbar, M.J. Application of physical habitat simulation (PHABSIM) modelling to modified urban river channels. River Res. Appl. 2004, 20, 167–183. [Google Scholar] [CrossRef]
  47. Garcia, A.; Jorde, K.; Habit, E.; Caamano, D.; Parra, O. Downstream environmental effects of dam operations: Changes in habitat quality for native fish species. River Res. Appl. 2011, 27, 212–327. [Google Scholar] [CrossRef]
  48. Choi, S.-U.; Kim, S.K.; Choi, B.; Kim, Y. Impact of hydropeaking on downstream fish habitat at the Goesan Dam in Korea. Ecohydrology 2017, 10, e1816. [Google Scholar] [CrossRef]
  49. Li, R.; Chen, Q.; Ye, F. Modelling the impacts of reservoir operations on the downstream riparian vegetation and fish habitats in the Lijiang River. J. Hydroinform. 2011, 13, 229–244. [Google Scholar] [CrossRef]
  50. Zolezzi, G.; Siviglia, A.; Toffolon, M.; Maiolini, B. Thermopeaking in Alpine streams: Event characterization and time scales. Ecohydrology 2011, 4, 564–576. [Google Scholar] [CrossRef]
  51. Boavida, I.; Santos, J.M.; Ferreira, T.; Pinheiro, A. Barbel habitat alterations due to hydropeaking. J. Hydro-Environ. Res. 2015, 9, 237–247. [Google Scholar] [CrossRef]
  52. Choi, B.; Choi, S.-U. Impact of hydropeaking and thermopeaking on the downstream habitat in the Dal River, Korea. Ecol. Inform. 2018, 43, 1–11. [Google Scholar] [CrossRef]
  53. Gore, J.A. Hydrological changes. In The Rivers Handbook; Calow, P., Petts, G.E., Eds.; Blackwell Scientific: Oxford, UK, 1994; Volume 2, pp. 33–54. [Google Scholar]
  54. Petts, G.E.; Bickerton, M.A.; Crawford, C.; Lerner, D.N.; Evans, D. Flow management to sustain groundwaterdominated stream ecosystems. Hydrol. Process. 1999, 13, 497–513. [Google Scholar] [CrossRef]
  55. Richter, B.D.; Matthews, R.; Harrison, D.L.; Wigington, R. Ecologically sustainable water management: Managing river flows for river integrity. Ecol. Appl. 2003, 13, 206–224. [Google Scholar] [CrossRef]
  56. Gosse, J.C. Microhabitat of Rainbow and Cutthroat Trout in the Green River below Flaming Gorge Dam; Final Report, Contract 81-5049; Utah Division of Wildlife Resources Ministry of Science and Technology: Salt Lake City, UT, USA, 1982; p. 114.
  57. Ministry of Land, Transport and Maritime Affairs. Development of Techniques for Creation of Wildlife Habitat Environment; Ministry of Land, Transport and Maritime Affairs: Seoul, Korea, 2011. (In Korean)
  58. Ministry of Science and Technology. Technology for Surface Water Resources Investigation; Ministry of Science and Technology: Seoul, Korea, 2007. (In Korean)
  59. Furukawa-Tanaka, T. The ecology of salmonid fishes in Japanese mountain streams I: Food condition and feeding habit of Japanese charr, Salvelinus leucomaenis (Pallas). Jpn. J. Ecol. 1985, 35, 481–504. [Google Scholar]
  60. Katano, O. Social structure of the dark chub, Zacco temmincki, in a small pond in relation to individual differences. Physiol. Ecol. Jpn. 1987, 24, 1–132. [Google Scholar]
  61. Katano, O. Foraging tactics and home range of dark chub in a Japanese river. Oecologia 1996, 106, 199–205. [Google Scholar] [CrossRef] [PubMed]
  62. Lillie, R.A.; Budd, J. Habititat architecture of Myriophyllum spicatum L. as an index to habitat quality for fish and macroinvertebrates. J. Freshw. Ecol. 1992, 7, 113–125. [Google Scholar] [CrossRef]
  63. Ponsard, S.; Arditi, R.; Jost, C. Assessing top-down and bottom-up control in a litter-based soil macroinvertebrate food chain. Oikos 2000, 89, 524–540. [Google Scholar] [CrossRef]
  64. Molina, C.I.; Gibon, F.M.; Duprey, J.L.; Dominguez, E.; Guimarães, J.R.D.; Roulet, M. Transfer of mercury and methylmercury along macroinvertebrate food chains in a floodplain lake of the Beni River, Bolivian Amazonia. Sci. Total Environ. 2010, 408, 3382–3391. [Google Scholar] [CrossRef] [PubMed]
  65. Jones, L.; Stevens, C.; Rowe, E.C.; Payne, R.; Caporn, S.J.; Evans, C.D.; Field, S.; Dale, S. Can on-site management mitigate nitrogen deposition impacts in non-wooded habitats? Biol. Conserv. 2017, 212, 464–475. [Google Scholar] [CrossRef]
  66. Choi, J.-K.; Kim, J.-S.; Lee, H.G. An Ecological Comparison of Benthic Macroinvertebrate Community in Downstream Region of Large Dams. Korean J. Environ. Ecol. 2013, 27, 52–63. (In Korean) [Google Scholar]
  67. Kang, H.; Choi, B. Dominant Fish and Macroinvertebrate Response to Flow Changes of the Geum River in Korea. Water 2018, 10, 942. [Google Scholar] [CrossRef]
  68. Bovee, K.D. Instream flow methodology. In US Fish and Wildlife Service; ARLIS: Anchorage, AK, USA, 1982; Volume 82, p. 26. [Google Scholar]
  69. Steffler, P.; Blackburn, J. River 2D-Two-Dimensional Depth Averaged Model of River Hydrodynamics and Fish Habitat Introduction to Depth Averaged Modeling and User’s; University of Alberta: Edmonton, AB, Canada, 2002. [Google Scholar]
  70. Hyun, Y.; Kang, H.; Lee, J.-M.; Hwang, H.T. Evaluation of Environmental Ecological Drought Considering Stream Baseflow; Basic Research Report; Korea Environment Institute: Sejong, Korea, 2017; p. 109. (In Korean) [Google Scholar]
  71. U.S. Fish and Wildlife Service. Standards for the Development of Habitat Suitability Index Models; 103 ESM; Division of Ecological Services, U.S. Fish and Wildlife Service, Department of the Interior: Washington, DC, USA, 1981.
  72. Tharme, R.E.; King, J.M. Development of the Building Block Methodology for Instream flow Assessments, and Supporting Research on the Effects of Different Magnitude Flows on Riverine Ecosystems; Water Research Commission: Pretoria, South Africa, 1998. [Google Scholar]
  73. King, J.; Louw, D. Instream flow assessments for regulated rivers in South Africa using the Building Block Methodology. Aquat. Ecosyst. Health Manag. 1998, 1, 109–124. [Google Scholar] [CrossRef]
  74. Boavida, I.; Santos, J.M.; Cortes, R.V.; Pinheiro, A.N.; Ferreira, M.T. Assessment of instream structures for habitat improvement for two critically endangered fish species. Aquat. Ecol. 2011, 45, 113–124. [Google Scholar] [CrossRef]
  75. Santos, J.M.; Rivaes, R.; Boavida, I.; Branco, P. Structural microhabitat use by endemic cyprinids in a Mediterranean-type river: Implications for restoration practices. Aquatic Conservation. Mar. Freshw. Ecosyst. 2018, 28, 26–36. [Google Scholar] [CrossRef]
  76. Bowen, Z.H.; Freeman, M.C.; Bovee, K.D. Evaluation of generalized habitat criteria for assessing impacts of altered flow regimes on warmwater fishes. Trans. Am. Fish. Soc. 1998, 127, 455–468. [Google Scholar] [CrossRef]
Figure 1. The study area.
Water 10 01304 g001
Figure 2. The validation of the flow modeling (with and without baseflow): (a) downstream from the dam; and (b) upstream from the dam.
Water 10 01304 g002
Figure 3. Predicted versus measured flow depth.
Water 10 01304 g003
Figure 4. The habitat suitability curves for the target species: (a) Zacco platypus; and (b) Baetis fuscatus.
Water 10 01304 g004aWater 10 01304 g004b
Figure 5. Annual hydrological cycle showing the mean monthly flow (m3/s) in 2015.
Water 10 01304 g005
Figure 6. The CSI distributions for the target species in the downstream reach: (a) Zacco platypus; and (b) Baetis fuscatus.
Water 10 01304 g006
Figure 7. The CSI distributions for the target species in the upstream reach: (a) Zacco platypus; and (b) Baetis fuscatus.
Water 10 01304 g007
Figure 8. The scenario using the Building Block Approach in 2015.
Water 10 01304 g008
Figure 9. The distributions of CSI for the target species in the downstream reach: (a) Zacco platypus; and (b) Baetis fuscatus.
Water 10 01304 g009
Figure 10. The changes in the WUA with time: (a) Zacco platypus; and (b) Baetis fuscatus.
Water 10 01304 g010

