Article

Removal of Hardness from Water Samples by a Carbonation Process with a Closed Pressure Reactor

1
Ewha Girls High School, 26 Jeongdong-gil, Jung-gu, Seoul 04516, Korea
2
Carbon Mineralization Center, Climate Change Mitigation and Sustainability Division, Korea Institute of Geosciences and Mineral Resources (KIGAM), 124, Gwahak-ro, Yuseong-gu, Daejeon 34132, Korea
3
Chemical Engineering Department, Kwangwoon University, 20 Kwangwoon-ro, Nowong-gu, Seoul 01897, Korea
*
Author to whom correspondence should be addressed.
Water 2018, 10(1), 54; https://doi.org/10.3390/w10010054
Submission received: 15 November 2017 / Revised: 3 January 2018 / Accepted: 8 January 2018 / Published: 10 January 2018

Abstract

:
One of the undesirable characteristics of some ground and natural water sources is hardness. Hard water can cause many problems around the world, including increased scaling on water pipes, boilers, atopic eczema and odd-tasting drinking water. Hardness in natural water is caused by dissolved minerals, mainly calcium and magnesium compounds. According to the Water Quality Association (WQA) and the United States Geological Survey (USGS), hard water is classified based on the Ca2+ and Mg2+ ion concentration in waters, as follows: 0–60 ppm as soft; 61–120 ppm as moderately hard; 121–180 ppm as hard and more than 180 ppm as very hard water. Most water utilities consider a hardness level between 50 and 150 ppm of CaCO3 as publicly acceptable. The present study investigated the effects of a carbonation process on the removal of hardness in different water samples. Currently, a wide variety of hardness removal technologies are available. Among those conventional methods, carbonation is an inexpensive process which can be used for the removal of Ca2+ and Mg2+ ions from hard water. This study measured the hardness levels of 17 different water samples using the ethylene diamine tetra acetic acid (EDTA) method. Among these, Seoul outdoor swimming pool water (140 ppm) samples showed high concentrations of Ca2+ and Mg2+ ions. The hardness of the different water samples was reduced by 40–85% by a carbonation process with a closed pressure reactor for a 5 min reaction time.

Graphical Abstract

1. Introduction

Hardness (hard water) is one of the common water quality problems throughout the world. A total of 70% of the earth’s surface is covered by water. Of this, 97% is only sea water (non-drinkable). Only 2.5% of fresh water is accessible for human use and of this only 0.5% is used as drinking water. Hard water is found at a rate exceeding 85%, as water picks up minerals such as magnesium and calcium ions from rocks and soil, leading to the hard water. Ground water contains more minerals than surface water, so it is harder than surface water. There are many exceptions, i.e., lakes in lime soil districts [1]. Knowing the hardness of water is important when evaluating its use as a domestic or industrial water supply. Hard water interferes with laundering, washing, bathing and personal grooming [2]. Clothes laundered in hard water may look dingy and harsh. Hard water utilization in the home can lead to other issues as well. It also affects soap and detergent used for cleaning because soap used in hard water combines with the high amount of minerals to form a sticky sludge. Bathing with soap in hard water can deposit this sticky residue onto the skin and can lead to irritation under slightly acid conditions.
Several studies have indicated a link between hardness concentrations (particularly calcium and magnesium) and cardiovascular diseases, Alzheimer’s disease and atopic eczema [3,4]. However, the link is tenuous, and many confounding variables exist in the studies [5]. Hard water is mainly caused by calcium and magnesium cations and to a lesser extent aluminum, iron and other cations. Calcium and magnesium are the two major cations responsible for hardness in natural water [6]. Therefore, for most waters, the total hardness is caused by major cations and associated anions as shown in Figure 1.
The cations are usually associated with the anions of HCO3−, CO32− and OH alkalinity ions and acidity-associated ions such as SO42−, NO3, and Cl. Carbonate hardness refers to the number of hardness ions associated with alkalinity ions. When the solution is super-saturated, the cations in the water can precipitate as a hard scale. Carbonate hardness is sensitive to temperature and can precipitate easily. At high temperatures, Mg salts can also produce hard scales in boilers.
The main objective of this study is to describe the removal of hardness in water by a carbonation process in a closed-pressure reactor. In this paper, the crystallization process of precipitated calcium carbonate (PCC) and magnesium carbonate from hard water samples were investigated. The calcite PCC thus obtained could be utilized as a filler material to enhance the mechanical properties of composites in the plastics and paper industries.

2. Materials and Methods

The existence of Ca2+ and Mg2+ ions in water causes hardness. A water supply with a hardness level of 100 parts per million (100 ppm) contains the equivalent of 100 g of CaCO3 in one liter of water. The total hardness is equal to the sum of magnesium hardness and calcium hardness.
In the present experiment, total hardness was measured by the EDTA method for hard water samples collected from different areas of South Korea and artificial hard water samples that were prepared in the lab. The hardness was then reduced by the carbonation process. In all, five different artificial hard water samples, five different drinking water samples, and eight different natural water samples were tested, as shown in Table 1.

2.1. Artificial Hard Water Samples

Synthetic artificially hard water was prepared with major ions mixed into the proper amounts of fresh water. Most compositions include Mg2+, Ca2+, Na+, K+ and Cl, SO42− depending on their hardness and on the user requirements. CO32− is present at low concentrations in most natural water samples at a pH of seven. The alkalinity was measured frequently for the soft and hard water and was assumed to be equal to the concentration of the HCO3 ions [7]. The different artificial water samples were denoted as soft, slightly hard, moderately hard and very hard water with respect to the chemical compositions [8], as shown in Table 2.

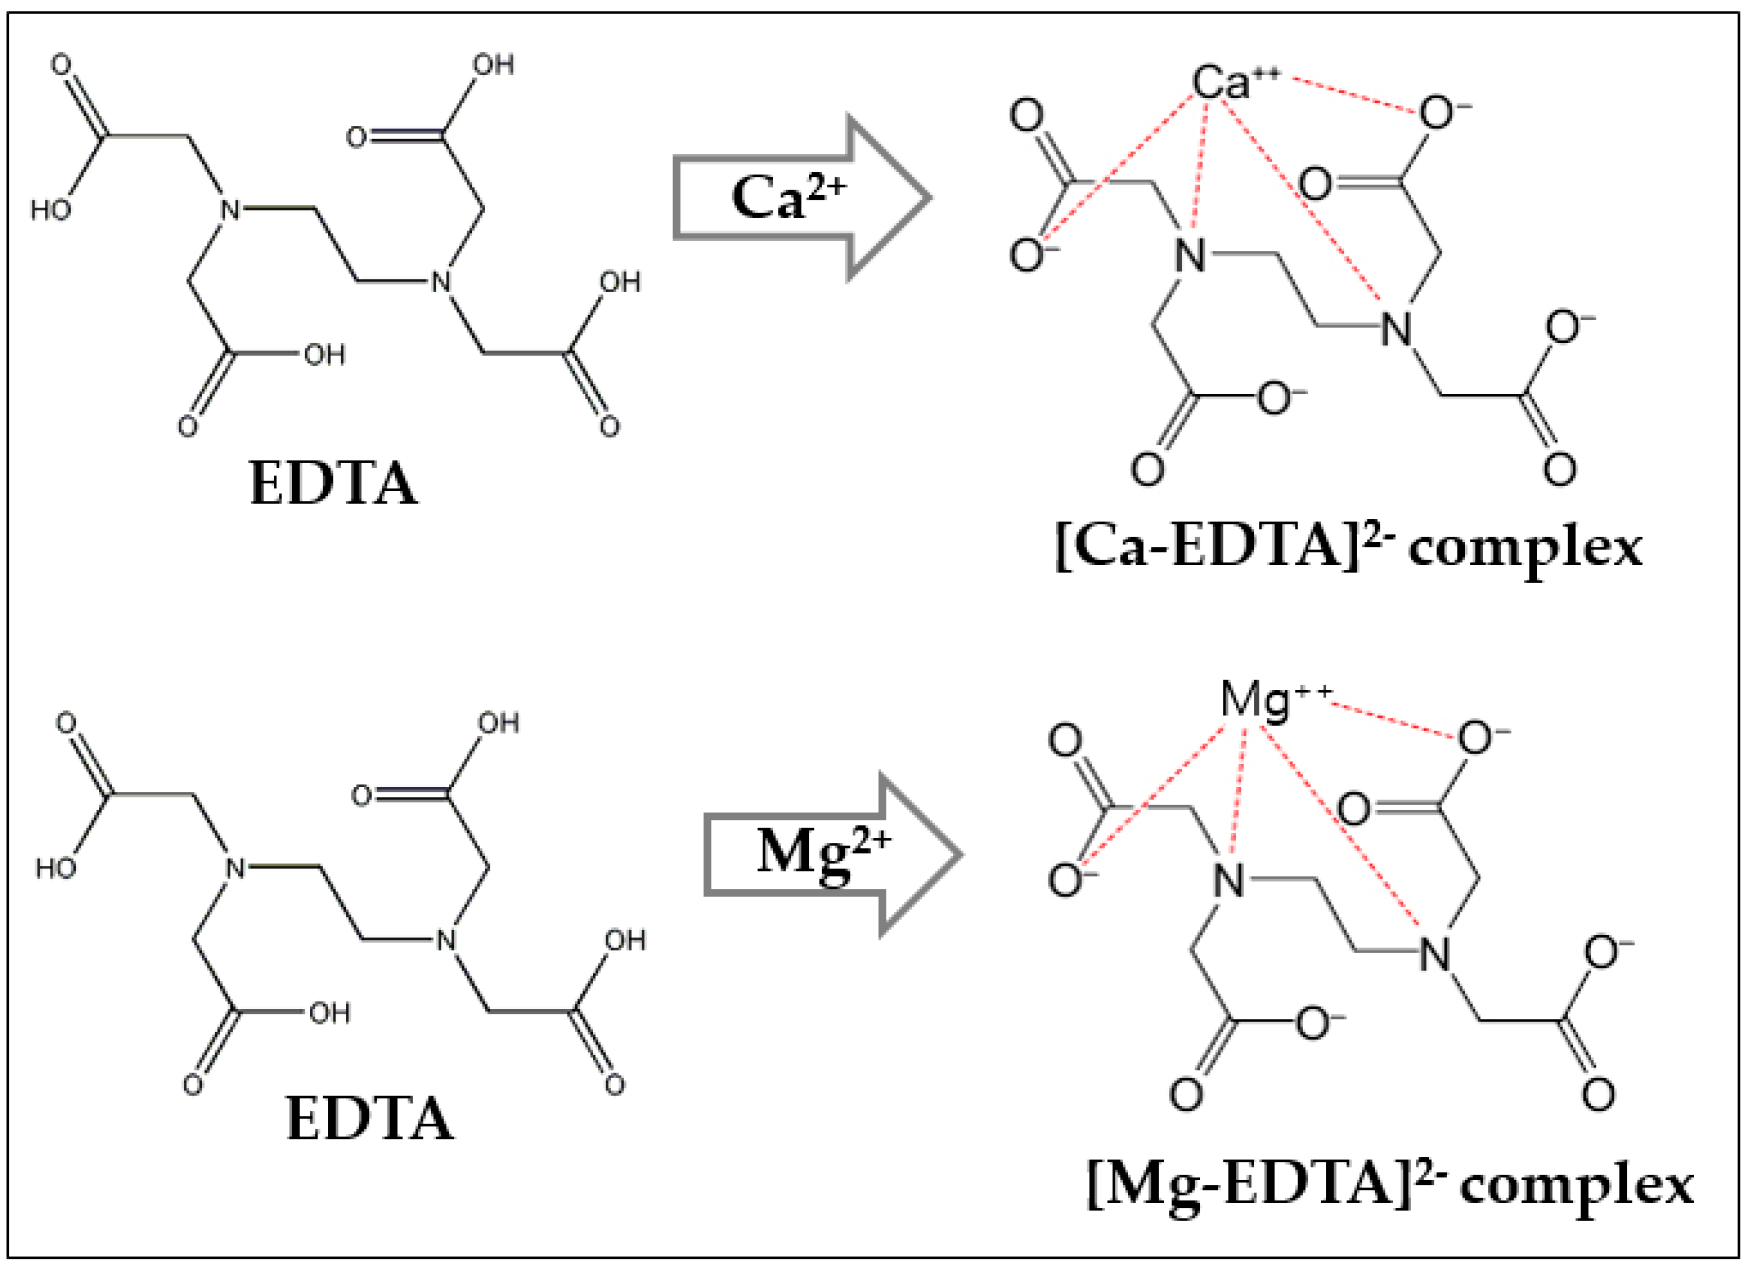
2.2. Water Hardness as Measured by the EDTA Method

Water hardness can be readily determined by titration with the chelating agent EDTA (ethylene diamine tetra acetic acid). In the sample solution containing calcium and magnesium ions, the reaction takes place with an excess of EDTA by a titration process and the indicator added remains as eriochrome black T (EBT)-blue because all of the Ca2+ and Mg2+ ions present are complexed with the EDTA [9]. During this process, the EDTA reacts with the Ca2+ and Mg2+ ions and to form the EDTA-Ca and EDTA-Mg complex (Figure 2), and after the completion of this reaction, the wine red color disappears slowly because the EBT-Ca and EBT-Mg are replaced and form Ca-EDTA stable, colourless complex, while simultaneously a blue color appears due to the effect of the EBT indicator [10].

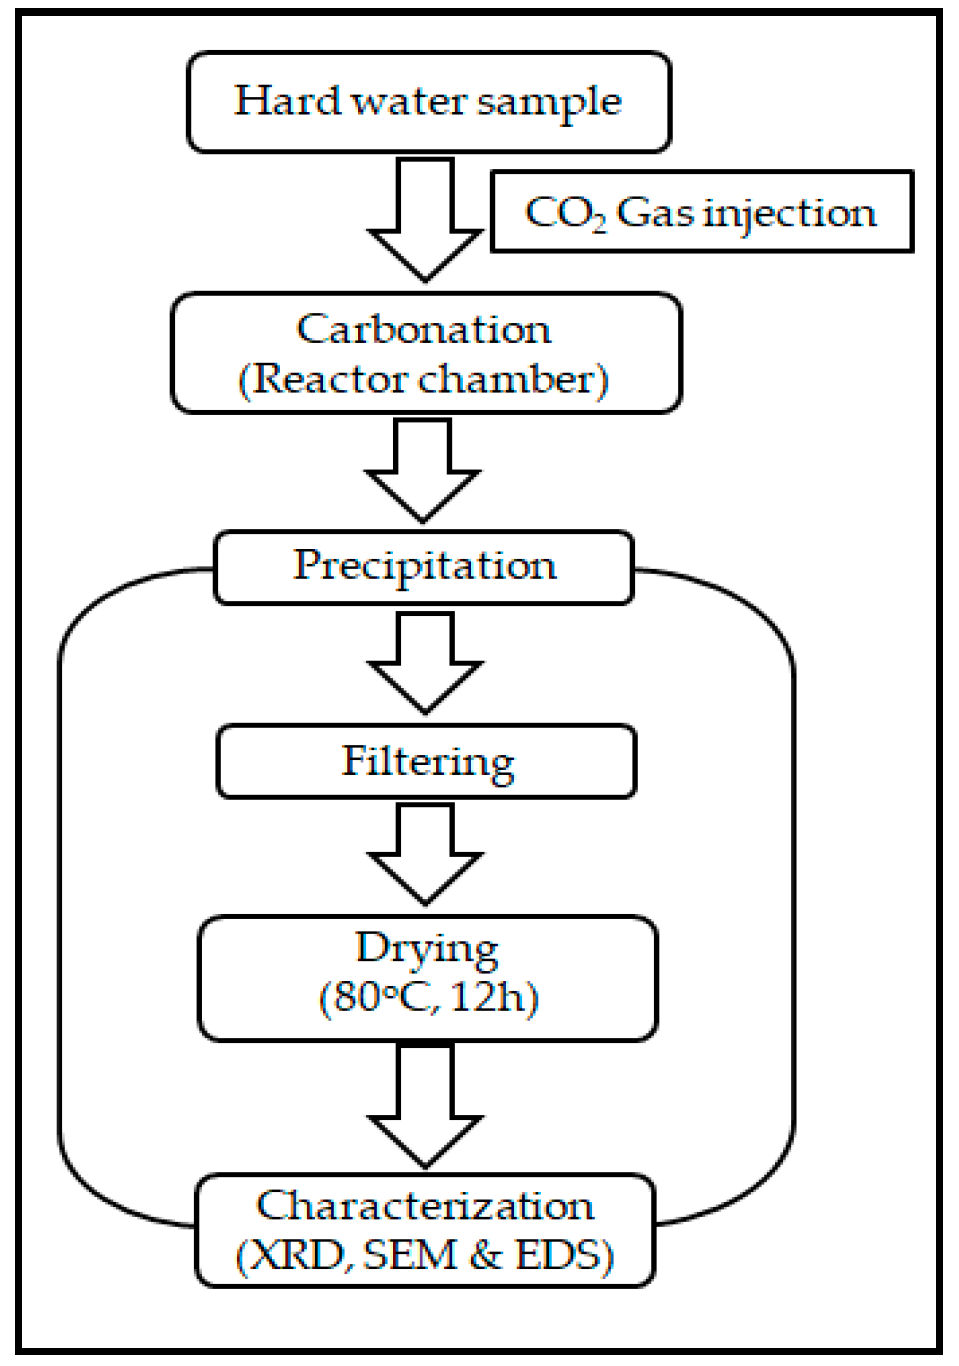
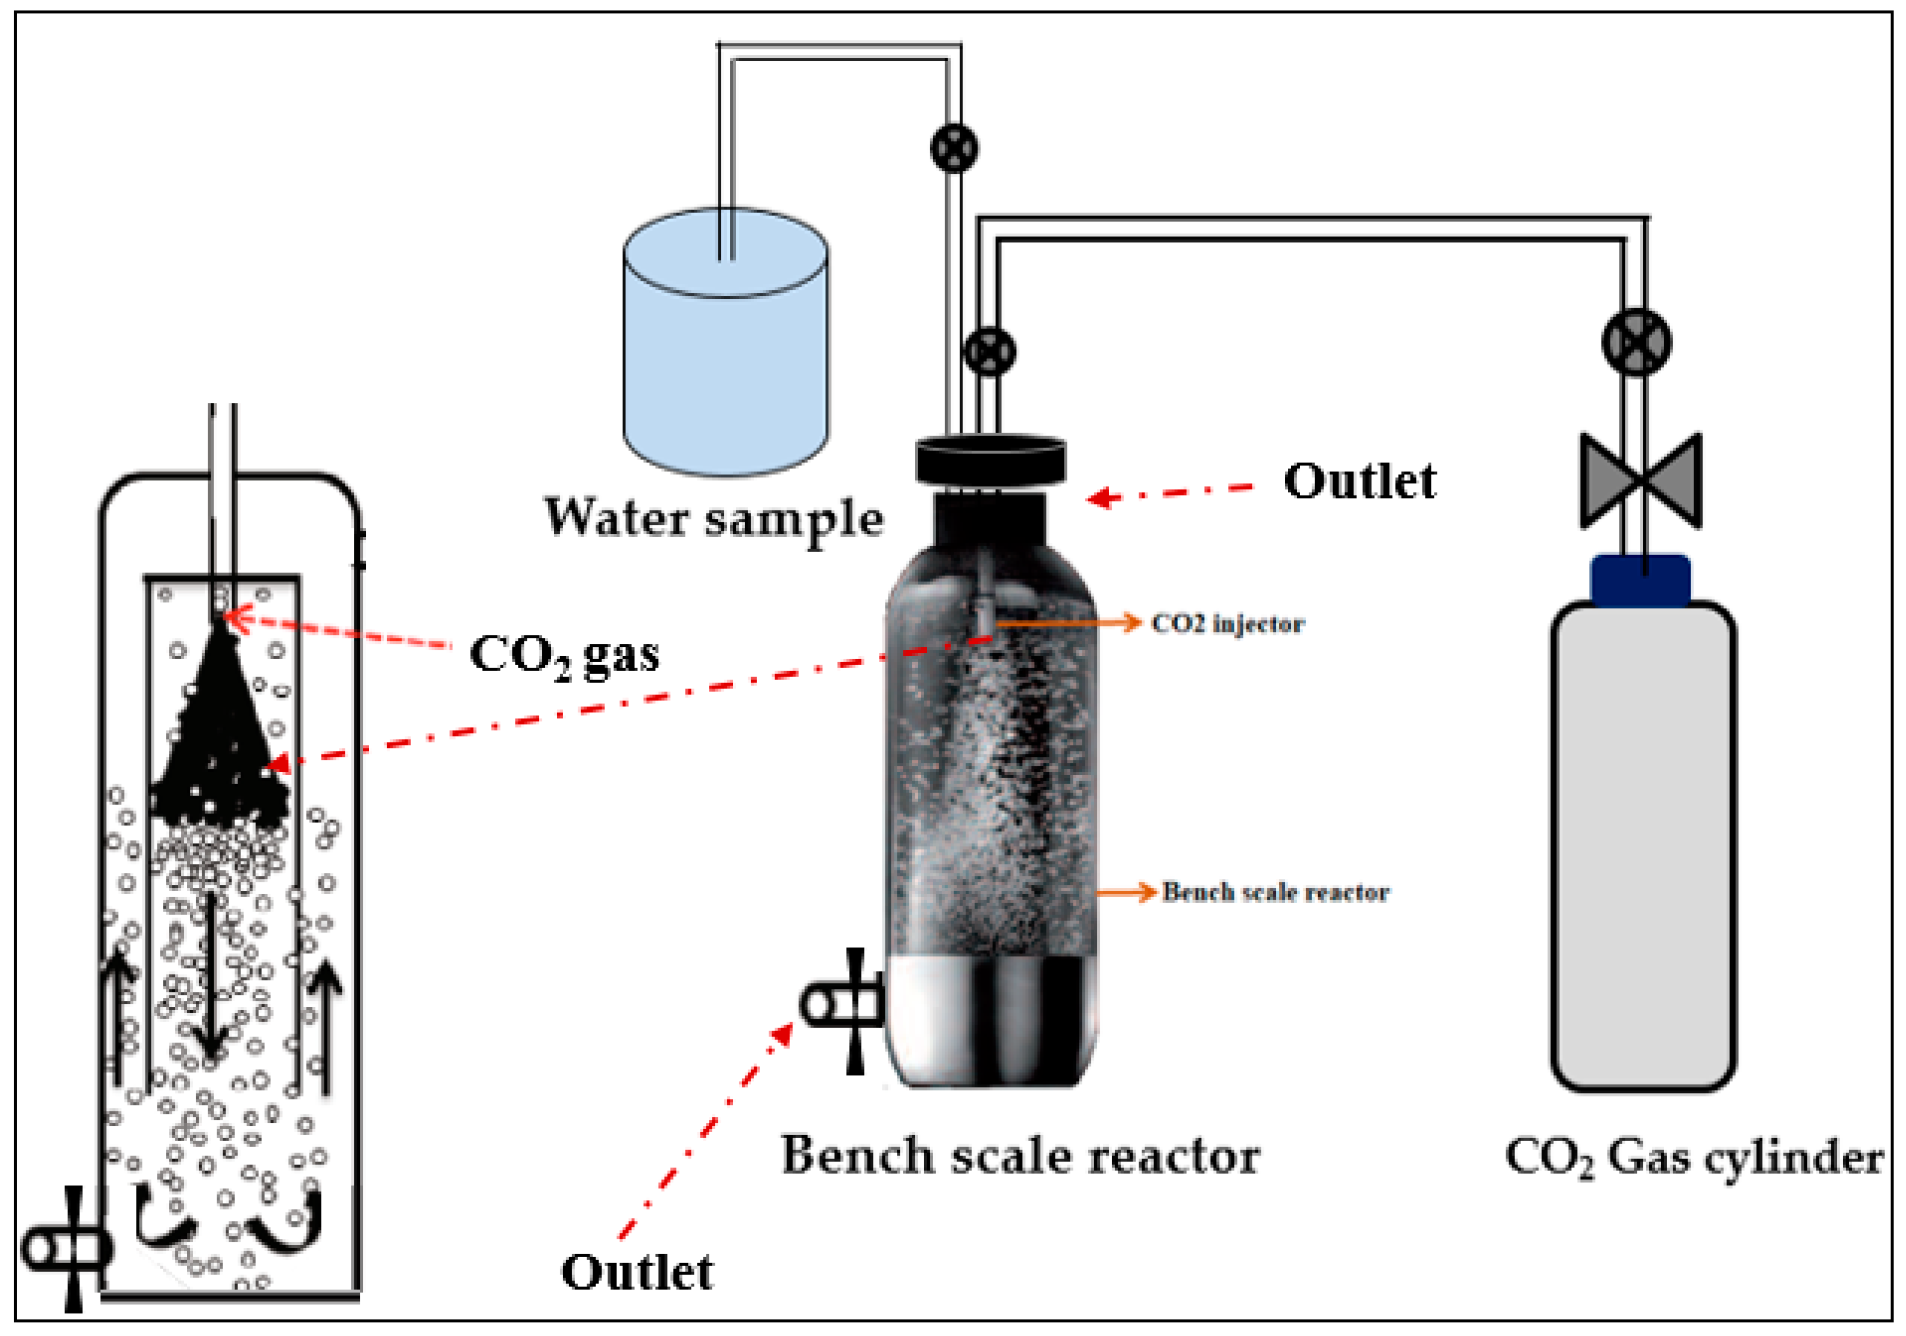
2.3. The KIGAM Closed Pressure Reactor for a Carbonation Process

The Korea Institute of Geosciences and Mineral resources (KIGAM), has introduced a closed pressure reactor for the removal of hardness. This can be accomplished in conjunction with the coagulation of suspended solids, as shown in Figure 3. Here, a 1 L closed pressure reactor, with a maximum working CO2 pressure of 10 bar is used. It is connected with a CO2 cylinder containing 60 L of carbonated water, as shown in Figure 4. This closed pressure reactor, based upon a carbonation process, is used to control the concentrations of calcium and magnesium ions in hard water. In this carbonation process, 1 L of each water sample was brought into the reactor chamber and CO2 gas was injected using a CO2 injector machine. The closed pressure reactor has two alternative outlets for collecting the final precipitated solution. The upper outlet is for the bench scale reactor (1–2 L) and the bottom outlet is for the pilot scale reactor.
During the hard water carbonation process by the closed pressure reactor, three different CO2 flow rates were injected, giving different reaction times. The process involved 7 g/L CO2 for a 3 min reaction, 14 g/L of CO2 gas for a 4 min reaction and 21 g/L of CO2 for a 5 min reaction. The carbonation reaction began with the hydration of carbon dioxide in the water, which reacted with Ca2+ and Mg2+ ions to form calcium carbonate and magnesium carbonate precipitates. The effects of the carbon dioxide flow rate, the temperature at carbonation, and the pH on the precipitation formation were investigated. The pH values of all the samples were measured before carbonation and after the carbonation process with a pH meter (A 214, Orion, Thermo Scientific, Waltham, MA, USA).

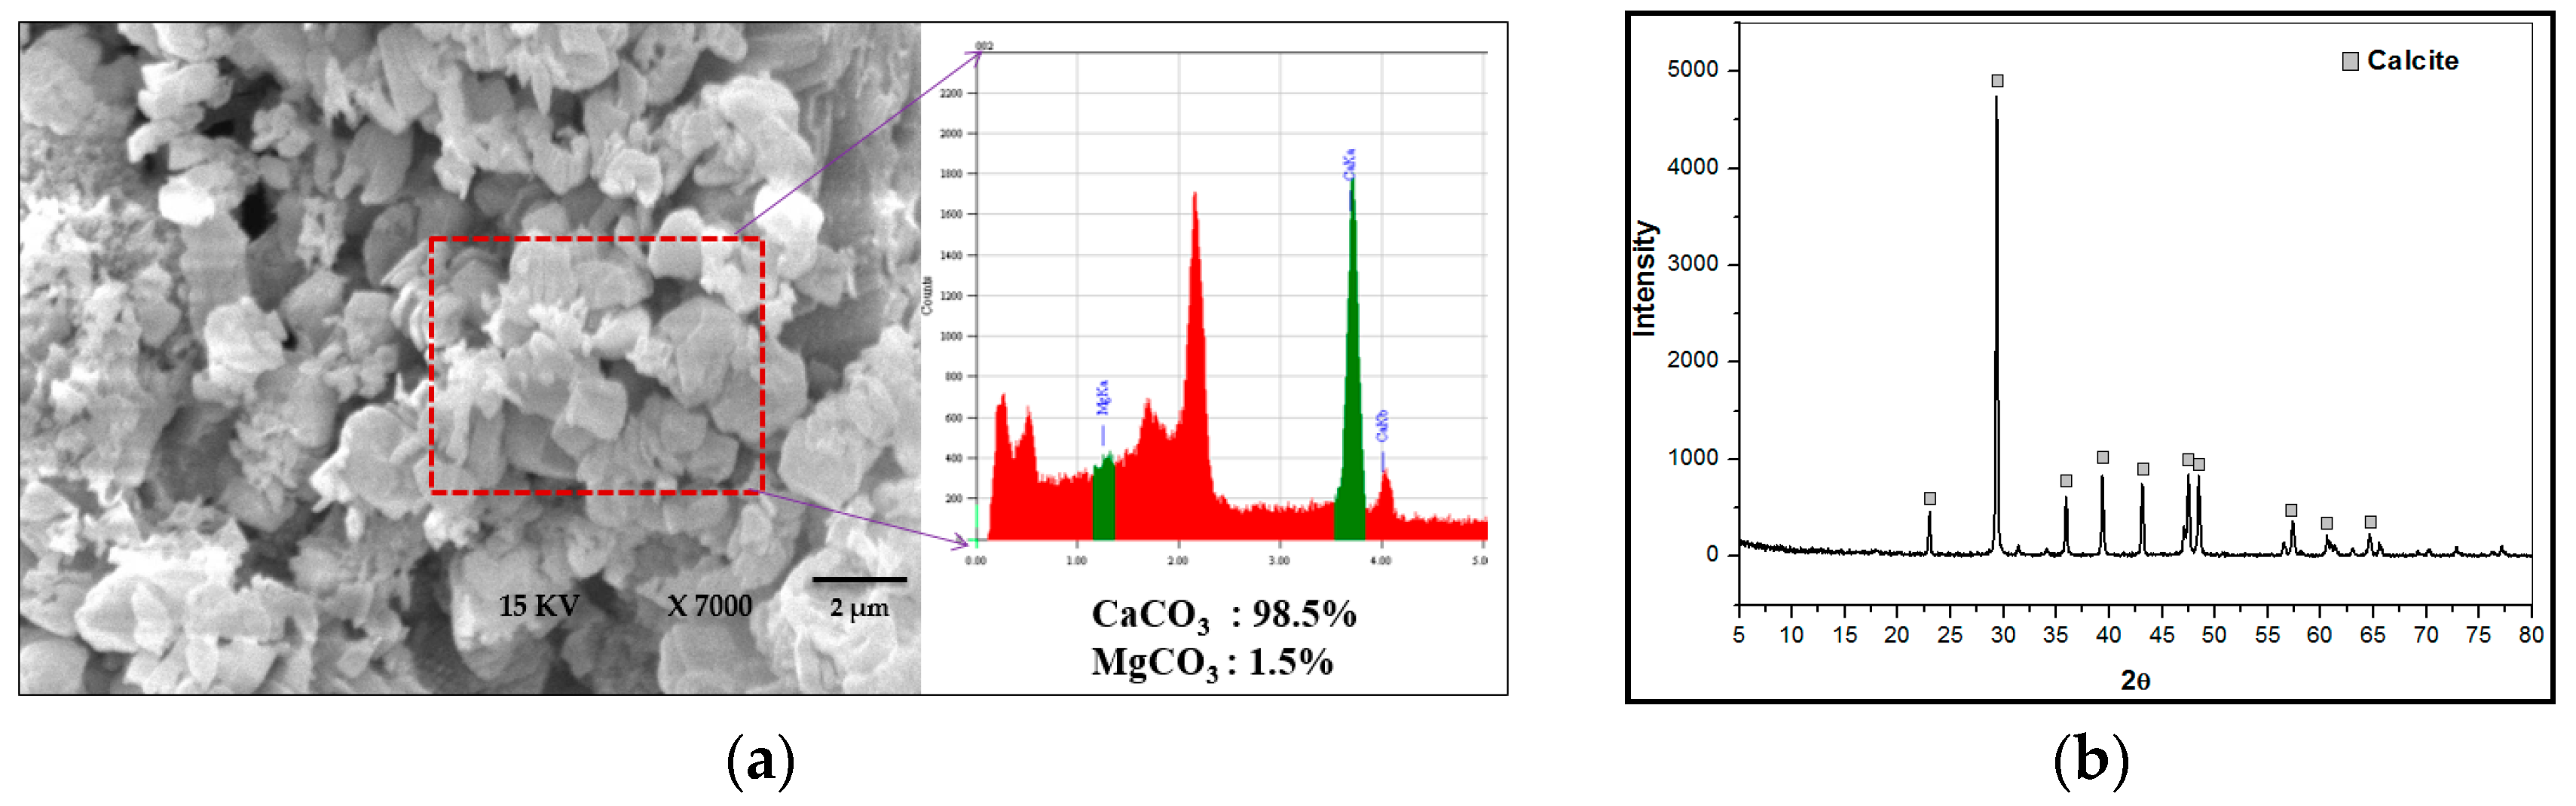
2.4. Characterization of Crystals by SEM, XRD and EDS

The crystallites formed join together to form polycrystalline particles with a rhombohedral shape. Re-crystallization takes place on the surface of the particles to create a very thin single-crystal shell, which then extends inwards, leading to true single crystals. Figure 5a shows the scanning electron microscopy (SEM) (JEOL Company, Seoul, South Korea) results of the rhombohedral calcium carbonate crystals and Figure 5b shows the X-ray diffraction (XRD) (Korea Institute of Geosciences and Mineral Resources (KIGAM), Daejeon, South Korea) analysis, which indicated that pure calcite was formed. The magnesium carbonate peak did not appear in the XRD results due to a low quantity of magnesium, but the energy dispersive x-ray spectroscopy (EDS) (Korea Institute of Geosciences and Mineral Resources (KIGAM), Daejeon, South Korea) results show a negligible quantity of magnesium.

3. Results and Discussion

The water sample hardness levels were measured by the EDTA method and the hardness was reduced by the carbonation process. In addition, the pH levels before and after carbonation were measured in all of the water samples. During the carbonation process the CO2 injection, temperature and pH effect played a key role to precipitate the Ca2+ and Mg2+ carbonates and to reduce the hardness in different water samples. Table 3 shows the hardness of different water samples before and after carbonation.

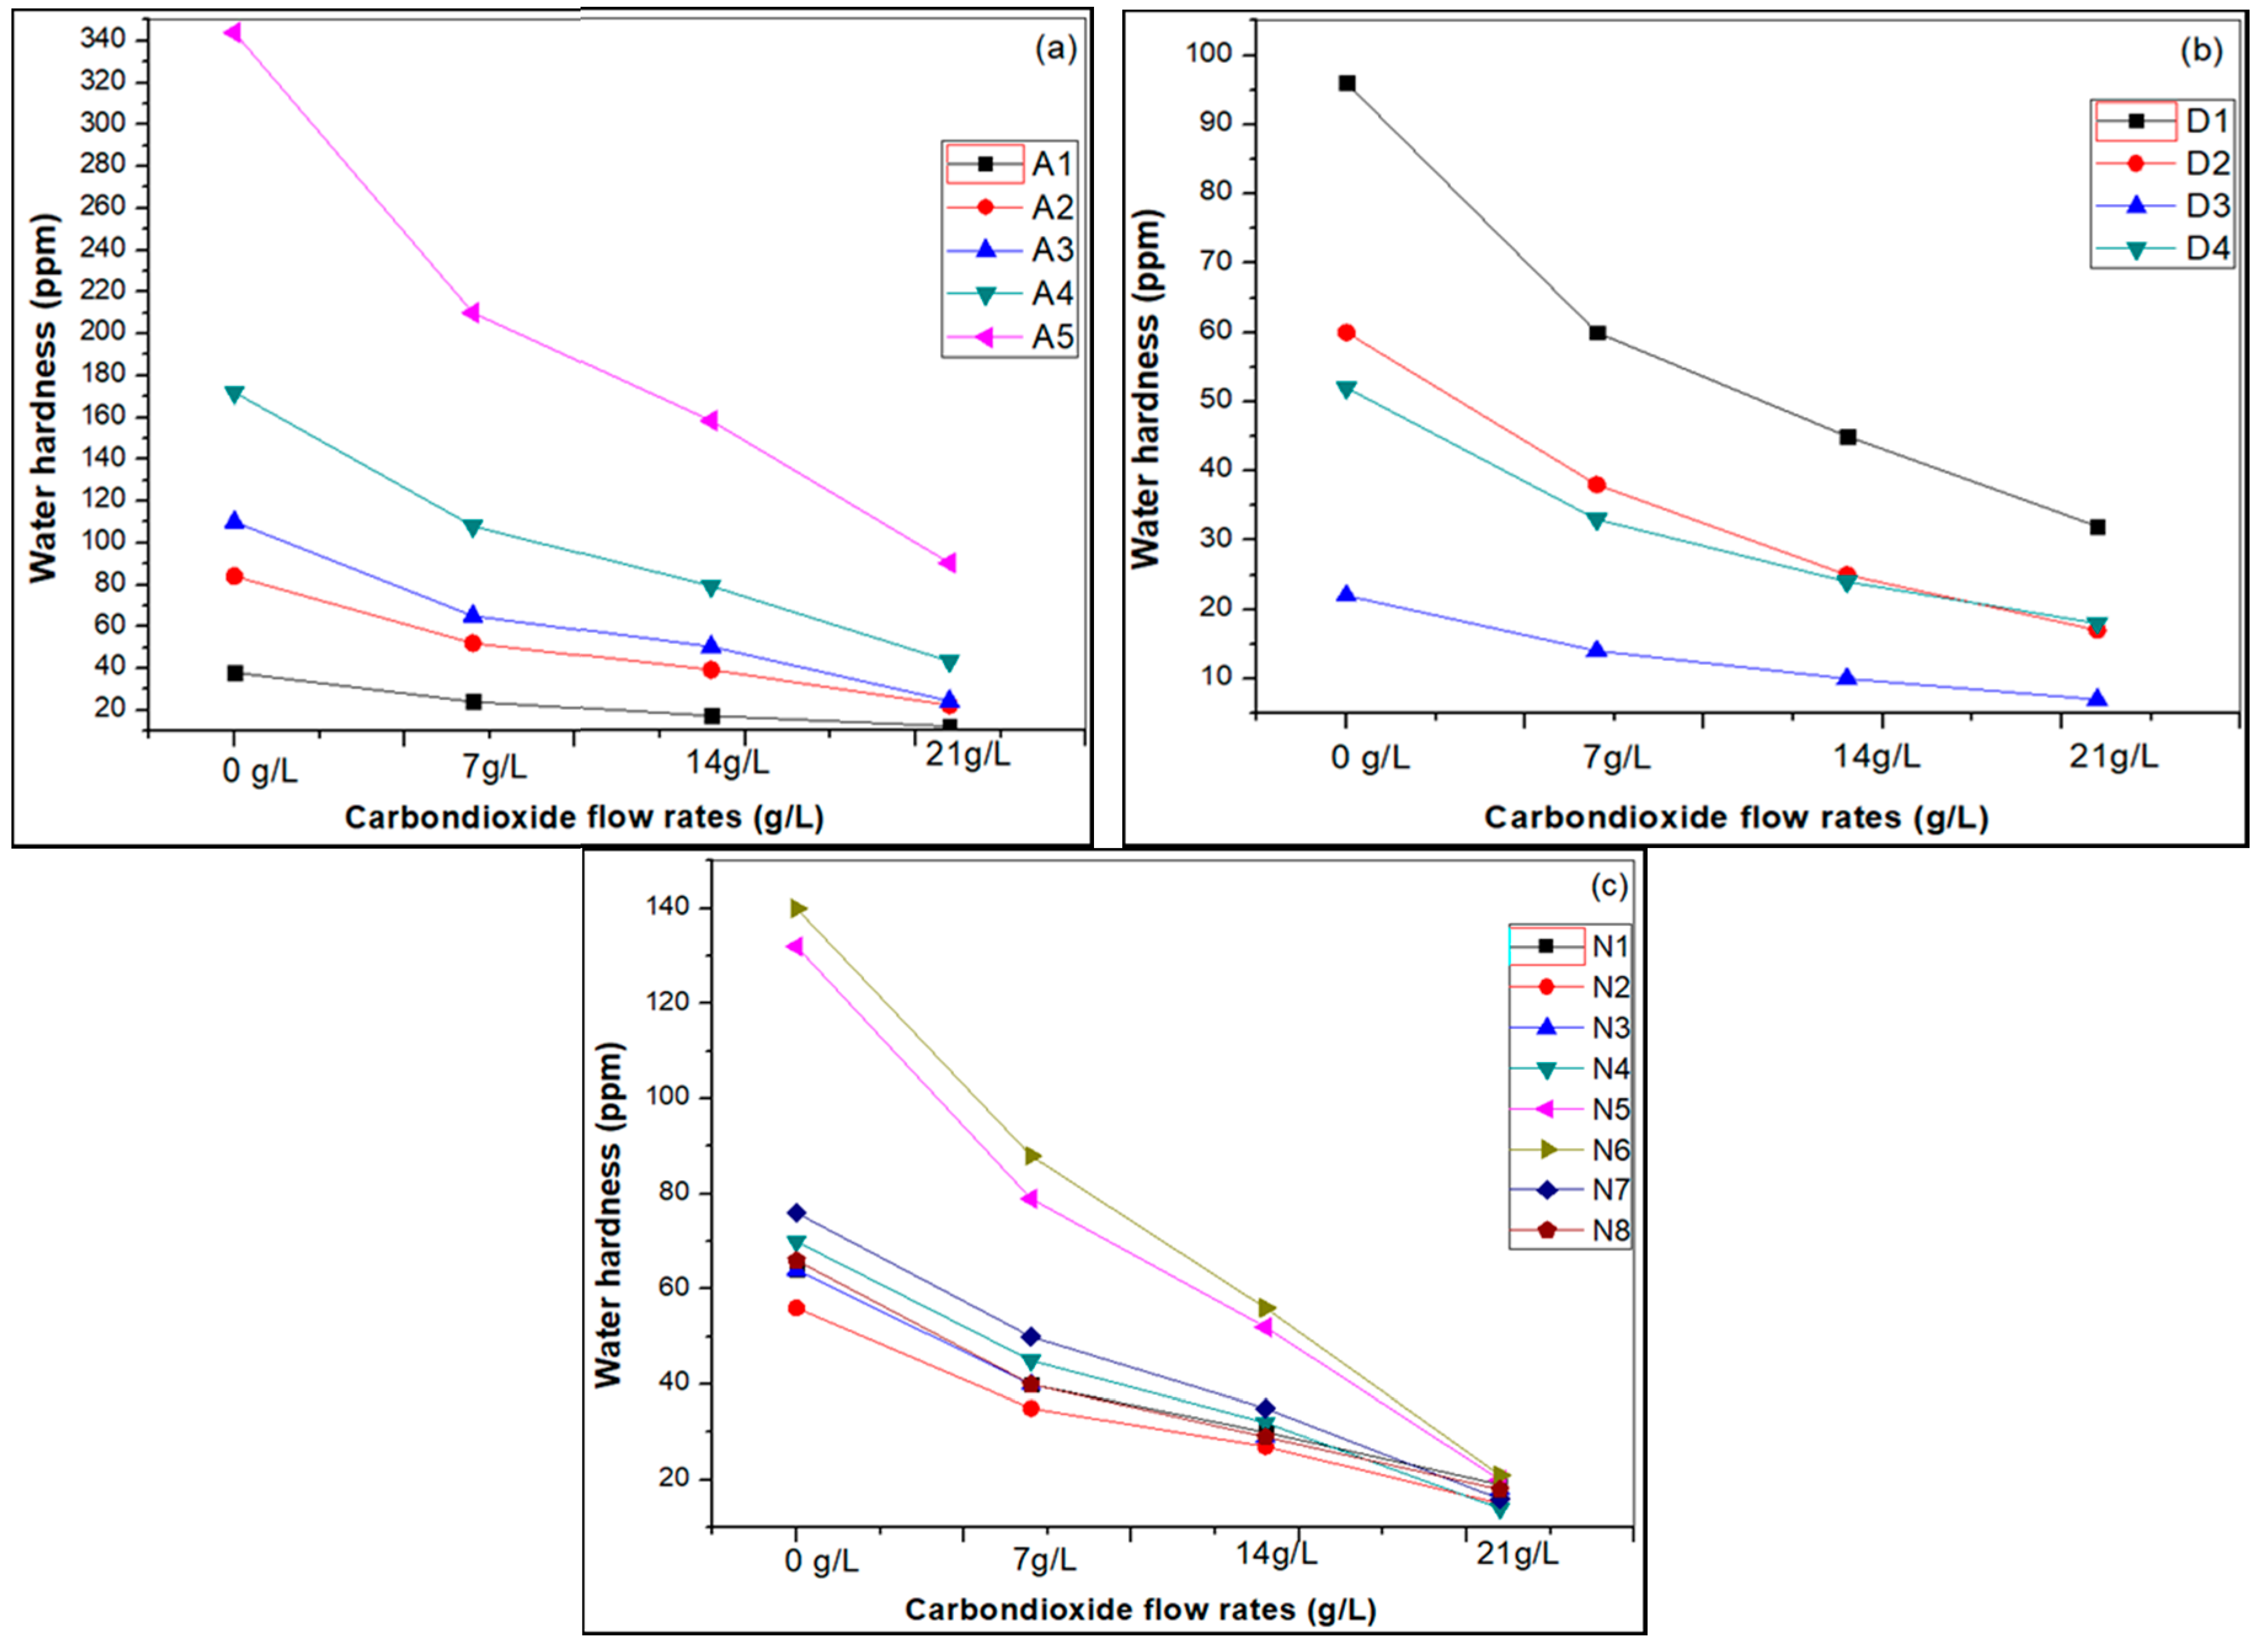
3.1. Effect of Carbon Dioxide Flow Rates

The carbonation process by the closed pressure reactor method was in an aqueous medium. Different amounts of CO2 gas were injected into the reaction bottle for different reaction times, such as 7 g CO2 per liter for 3 min reaction, 14 g CO2 per liter for 4 min reaction and 21 g CO2 per liter for 5 min reaction times. Carbon dioxide was injected into the reaction bottle as shown in Figure 4.
The basic two steps involved in the carbonation reaction are (i) hydration of carbon dioxide as shown in Formulas (1)–(3); (ii) the carbonate ions react with calcium ions to form calcium carbonate precipitates (Formula (4)).
CO2(g) + H2O(l) ↔ H2CO3(aq)
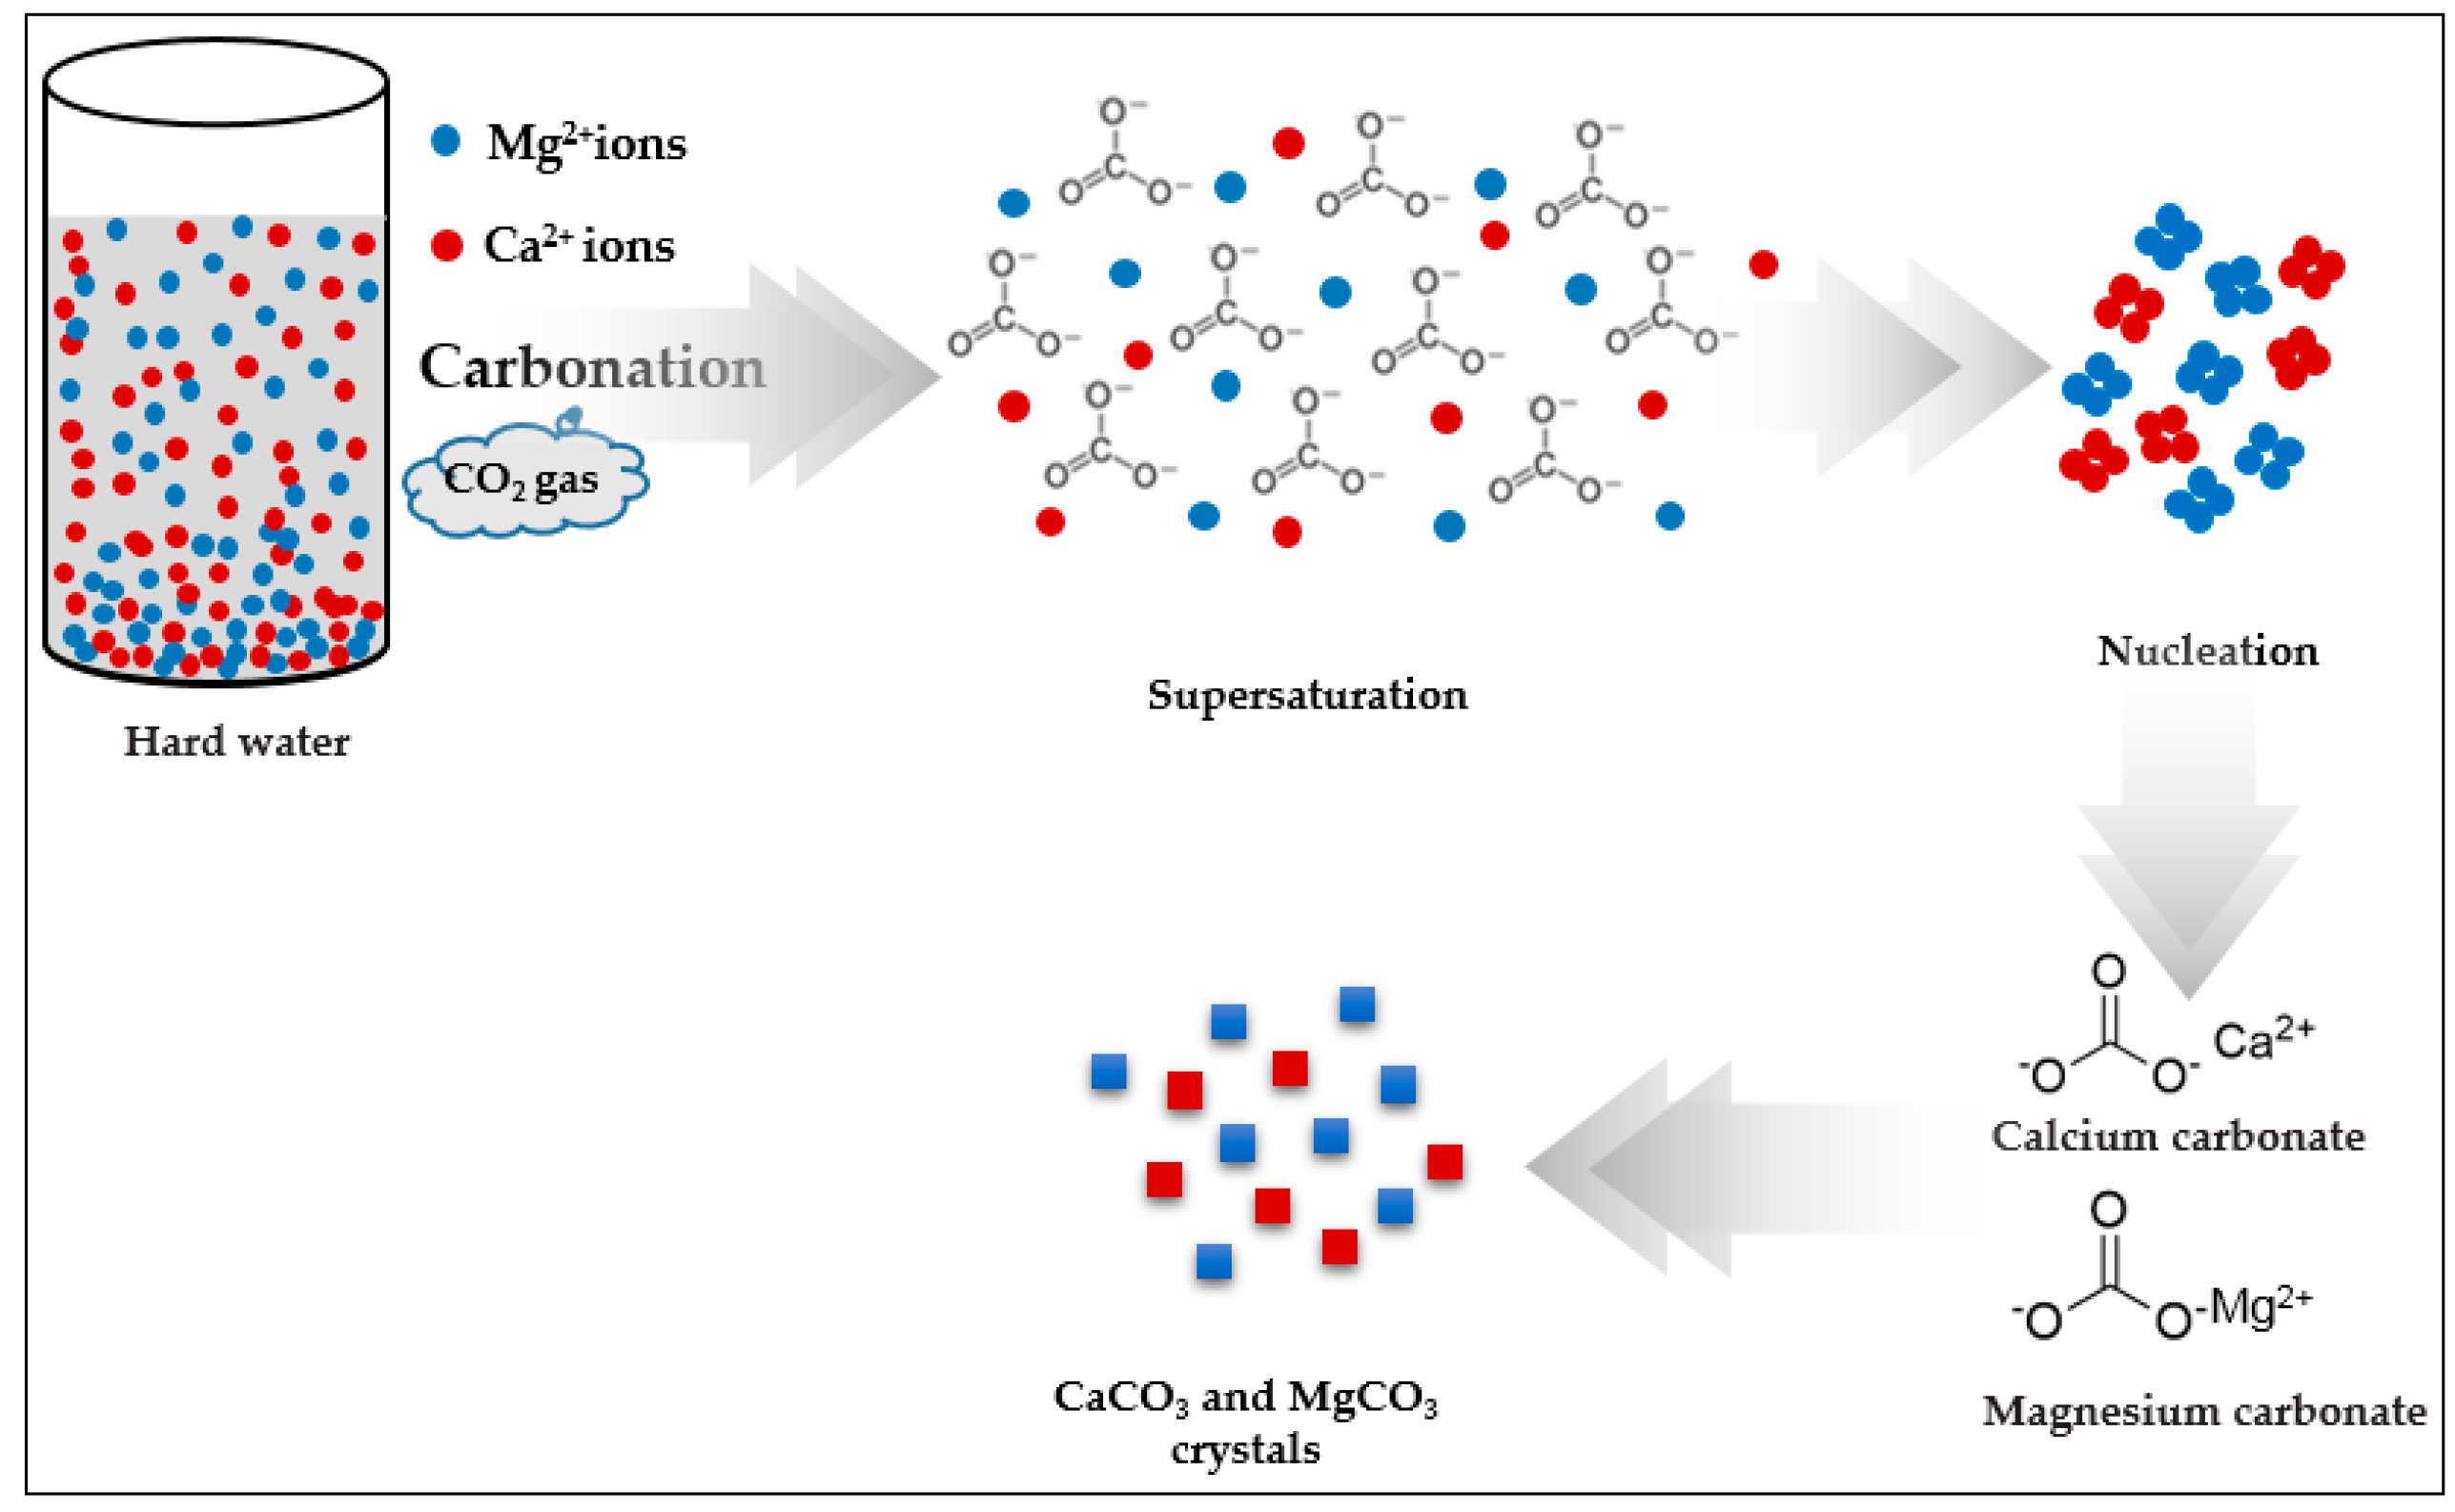
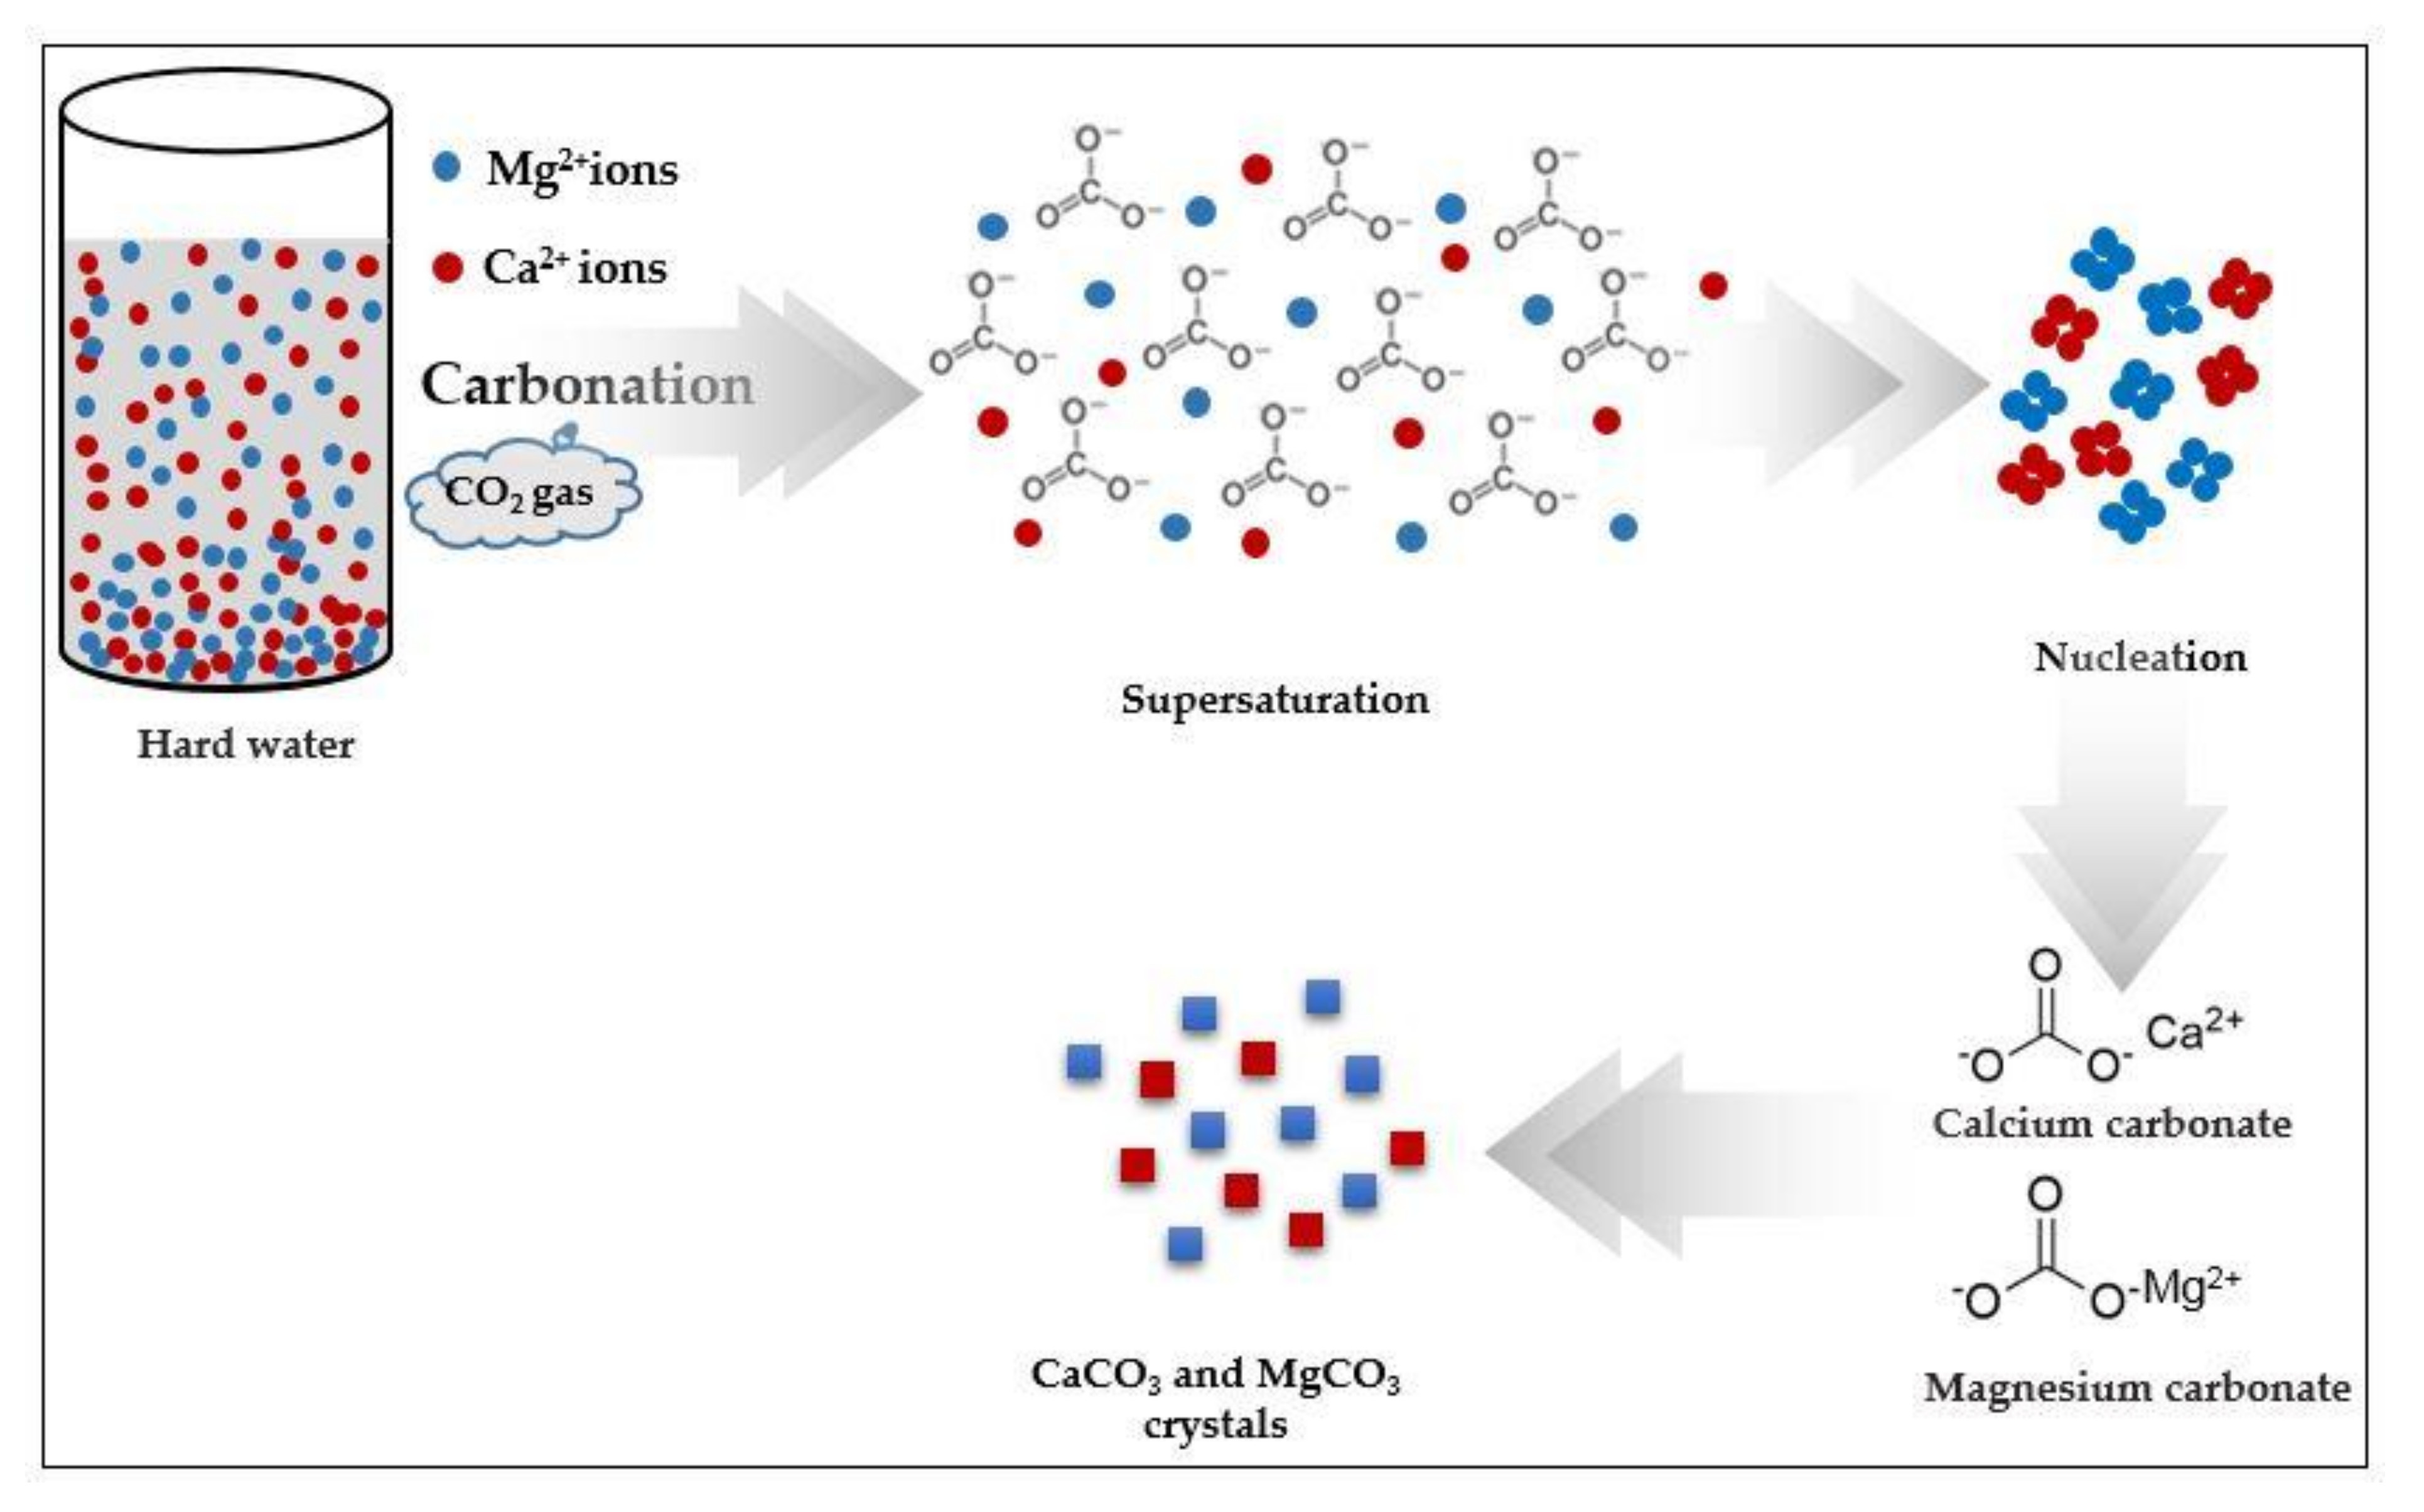
(Dissociation of aqueous CO2 into water)
H2CO3(aq) ↔ H+ + HCO3
HCO3 → H+ + CO32−
( Produces   supersaturation   when ) S 1 = ( Ca 2 + ) ( CO 3 2 ) Ksp > 1
(Formation of nuclei or critical cluster)
Ca2+ + CO32− → CaCO3(nuclei)
(Crystal growth occurs spontaneously)
Ca2+ + CO32− → CaCO3(Calcite)
(Finally, calcite formed)
Carbon dioxide species are important participants in reactions that control the pH of natural waters. Reactions among the alkalinity-related species, aqueous CO2, H2CO3(aq), HCO3, and CO32−, and directly pH related species, OH and H+, are relatively fast and can be evaluated with chemical equilibrium models. Rates of equilibration between solute species and gaseous CO2 across a phase boundary are slower, and water bodies exposed to the atmosphere may not be in equilibrium with it at all times [11].
Here, we have presented the basic theory concept. The theory behind the calcium–carbon-dioxide equilibrium states that when gas carbon dioxide is pressed into the water, this takes place according to Henry’s law. The carbon dioxide combines with water and forms (diprotonic) carbonic acid, which is very difficult to find analytically, and for this reason is presented as aqueous carbon dioxide subsequently split into hydrogen ions and hydrogen carbonate ions. The hydrogen carbonate ion then may release a hydrogen ion and also a carbonate ion.
The carbonate ions thus formed combine with calcium (and similarly magnesium) to form calcium carbonate. This substance is difficult to dissolve in water and precipitates quite easily. The calcium carbonate precipitates easier at increased water temperature. The equilibrium [Ca2+] + [CO32−] = [CaCO3] tells at which concentrations precipitation takes place. The unique character of calcium carbonate is also present, namely that its precipitation increases with temperature instead of the opposite. Normally, it is easier to dissolve substances at increased temperature, but with CaCO3 it is the opposite, which explains the great practical interest paid to hardness on the heating of water in different kinds of boilers in households and industry. Thus, hardness removal increases with temperature.
The equilibrium can be computed by [Ca2+] × [CO32−] = Ks, where Ks is the temperature-dependent solubility product for CaCO3. As the aim is to remove the hardness, the actual Ca content should be decreased. It means that the content of CO32- must increase in order to overcome the solubility product and get a precipitation of CaCO3. From the equilibrium, HCO3 = H+ + CO32− and the connected equation [H+] × [CO32−] = K2 × [HCO3−], where K2 is a temperature-dependent constant, it follows that to increase the content of [CO32−] it is necessary to increase the content of hydrogen carbonate and/or decrease the content of [H+]. As – log [H+] = pH, meaning that an increased pH gives more [CO32−]. Thus, a higher pH is favorable for Ca precipitation.
There is a lowering of pH due to the dissociation of the carbonic acid into hydrogen ions and hydrogen carbonate. However, the increase in hydrogen carbonate concentration also increases the carbonate content, which contradicts the negative effect of a lower pH and creates a larger precipitation of CaCO3. CO2 hydration and complexes are possible with calcium ions and crystal formation.
The carbonation process by the closed pressure reactor method with different amounts of CO2 gas was injected into the reaction bottle for different reaction times, such as 7 g CO2 per liter for 3 min reaction, 14 g CO2 per liter for 4 min reaction and 21 g CO2 per liter for 5 min reaction times, carbon dioxide was injected into the reaction bottle as shown in Figure 4.
In this study, three different water samples were used, including (i) artificial hard water samples, (ii) drinking water samples, and (iii) natural water samples, to reduce hardness by the carbonation process. The results clearly indicated that the hardness of the different water samples was reduced by approximately 30–40% using 7 g CO2/L for 3 min carbonation, reduced by 50–60% using 14 g CO2/L at 4 min carbonation, and reduced by 70–85% using 21 g CO2/L at 5 min carbonation at room temperature.
However, the water hardness gradually decreased in different artificial (A), drinking (D) and natural (N) water samples with increasing CO2 gas flow rates from 7 g/L to 21 g/L at room temperature, as shown in Figure 6.
When the CO2 pressure in the reactor increased, the bicarbonate and carbonate ions increased due to the dissociation of carbonic acid, and these carbonate ions reacted with Ca2+ and Mg2+ ions to increase the hardness removal efficiency. Bicarbonate and carbonate ions was increased due to the dissociation of carbonic acid, and these carbonate ions reacted with Ca2+ and Mg2+ ions and to increase the hardness removal efficiency at a lower pH of 4–6 for 5 min reaction time.

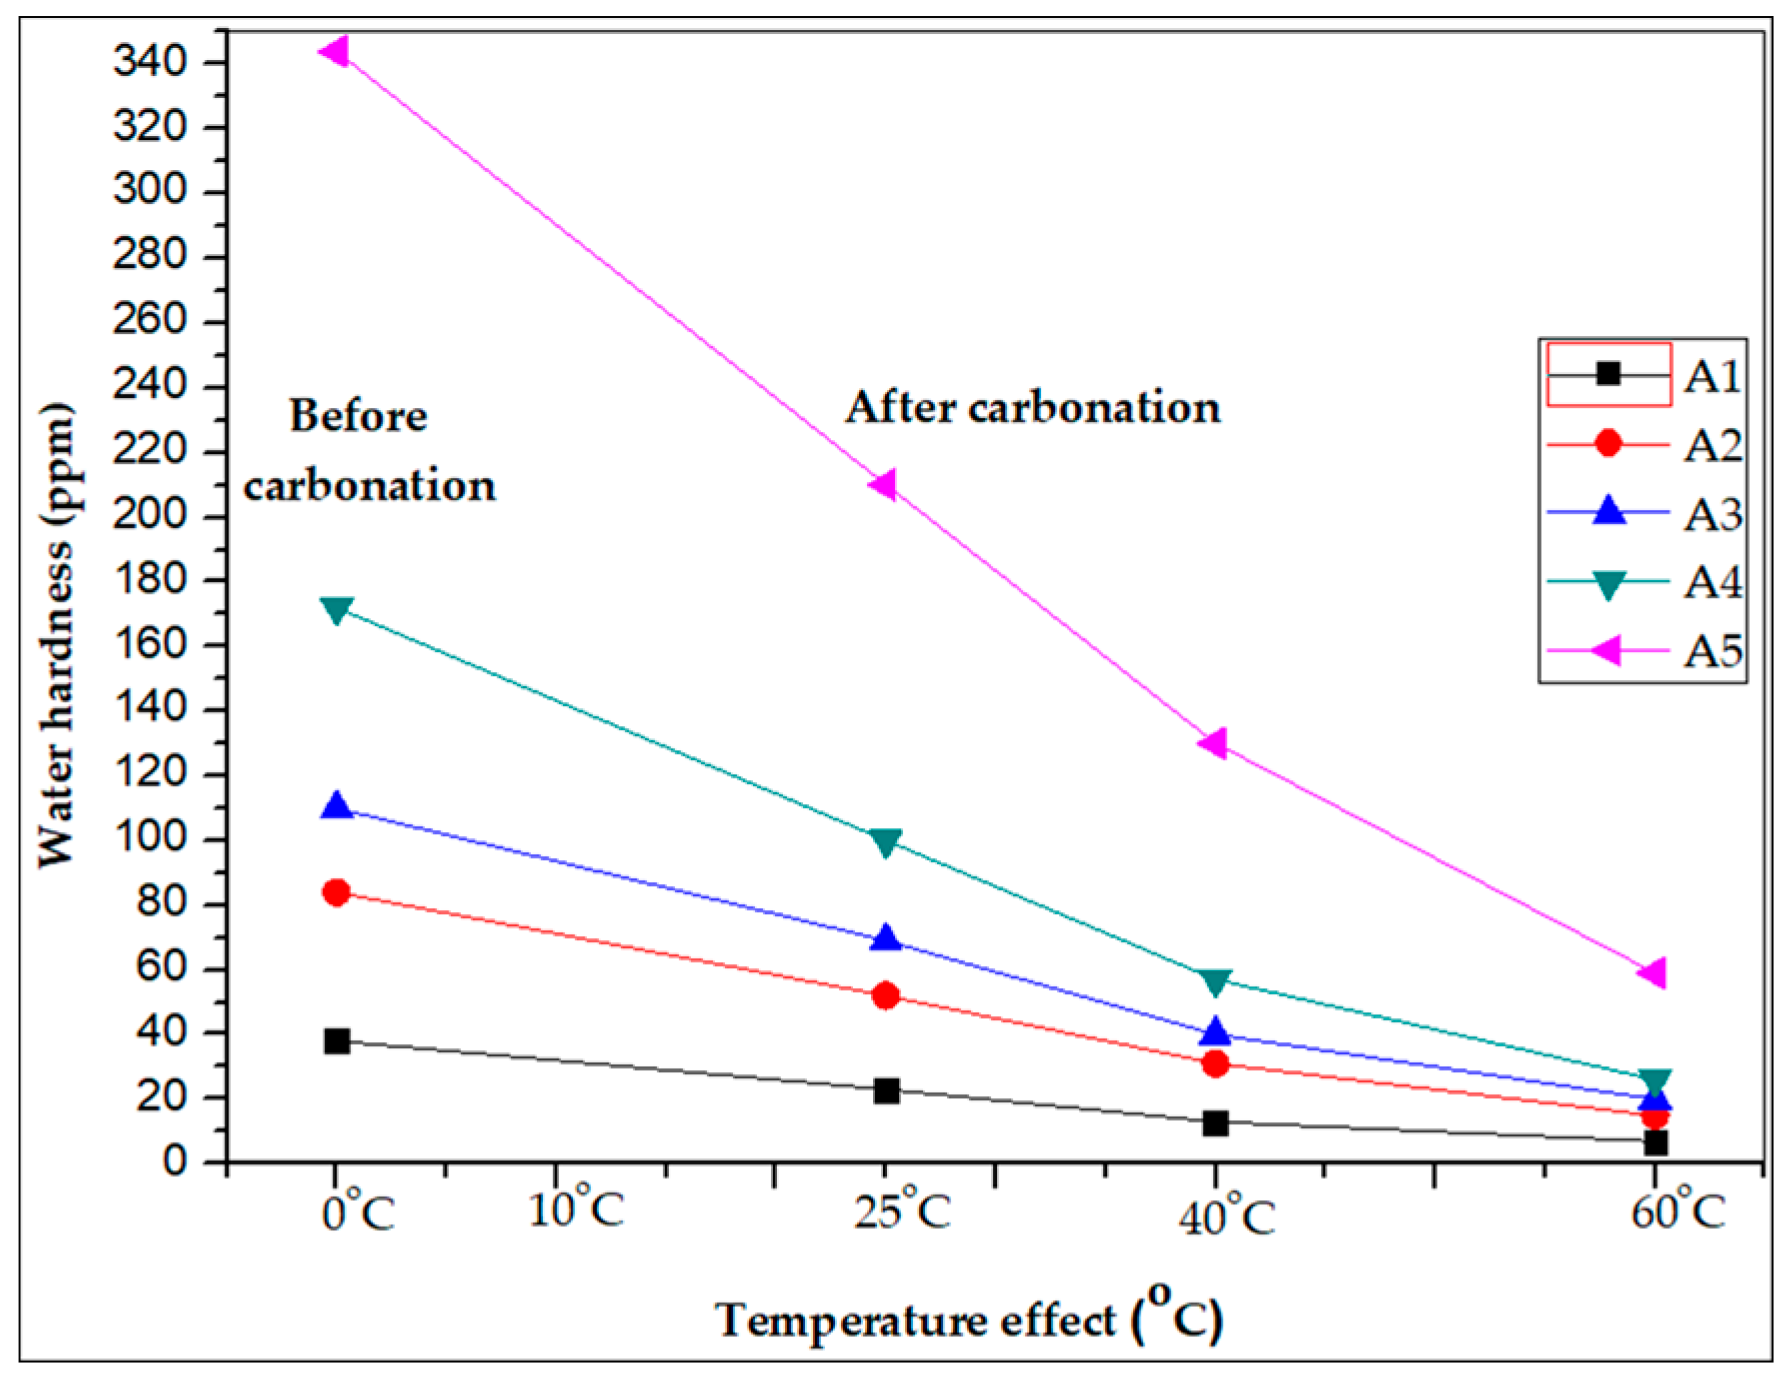
3.2. Effect of Temperature

The five different artificial hard water samples were tested for reducing hardness with different temperatures: 25, 40 and 60 °C. The results clearly indicated that the hardness removal efficiency was enhanced up to 60–70% by the carbonation process with 21 g of CO2/L for 5 min reaction at 40 °C temperature and 80–85% hardness was reduced by carbonation process with 21 g of CO2/L for 5 min reaction at 60 °C temperature. These results clearly indicated that the water hardness gradually decreased with increasing temperature due to the reduction of Ca2+ and Mg2+ ions in the carbonation process, as shown in Figure 7.
The hardness removal studies were conducted at different temperatures of 25, 40, and 60 °C. Temperature plays a major role in the removal of metal ions in the water. Figure 7 reveals that the removal of hardness increases as temperature increases, this may partly be due to the increase in ion mobility for the CO2 gas molecules. Temperature affects the interaction between the CO2 gas molecules and the metal ions, which influences the stability of the metal-CO2 gas complex. The carbonation of calcium ions proceeds at temperatures over 25 °C, while the carbonation of magnesium ions should be possible only at higher temperatures.

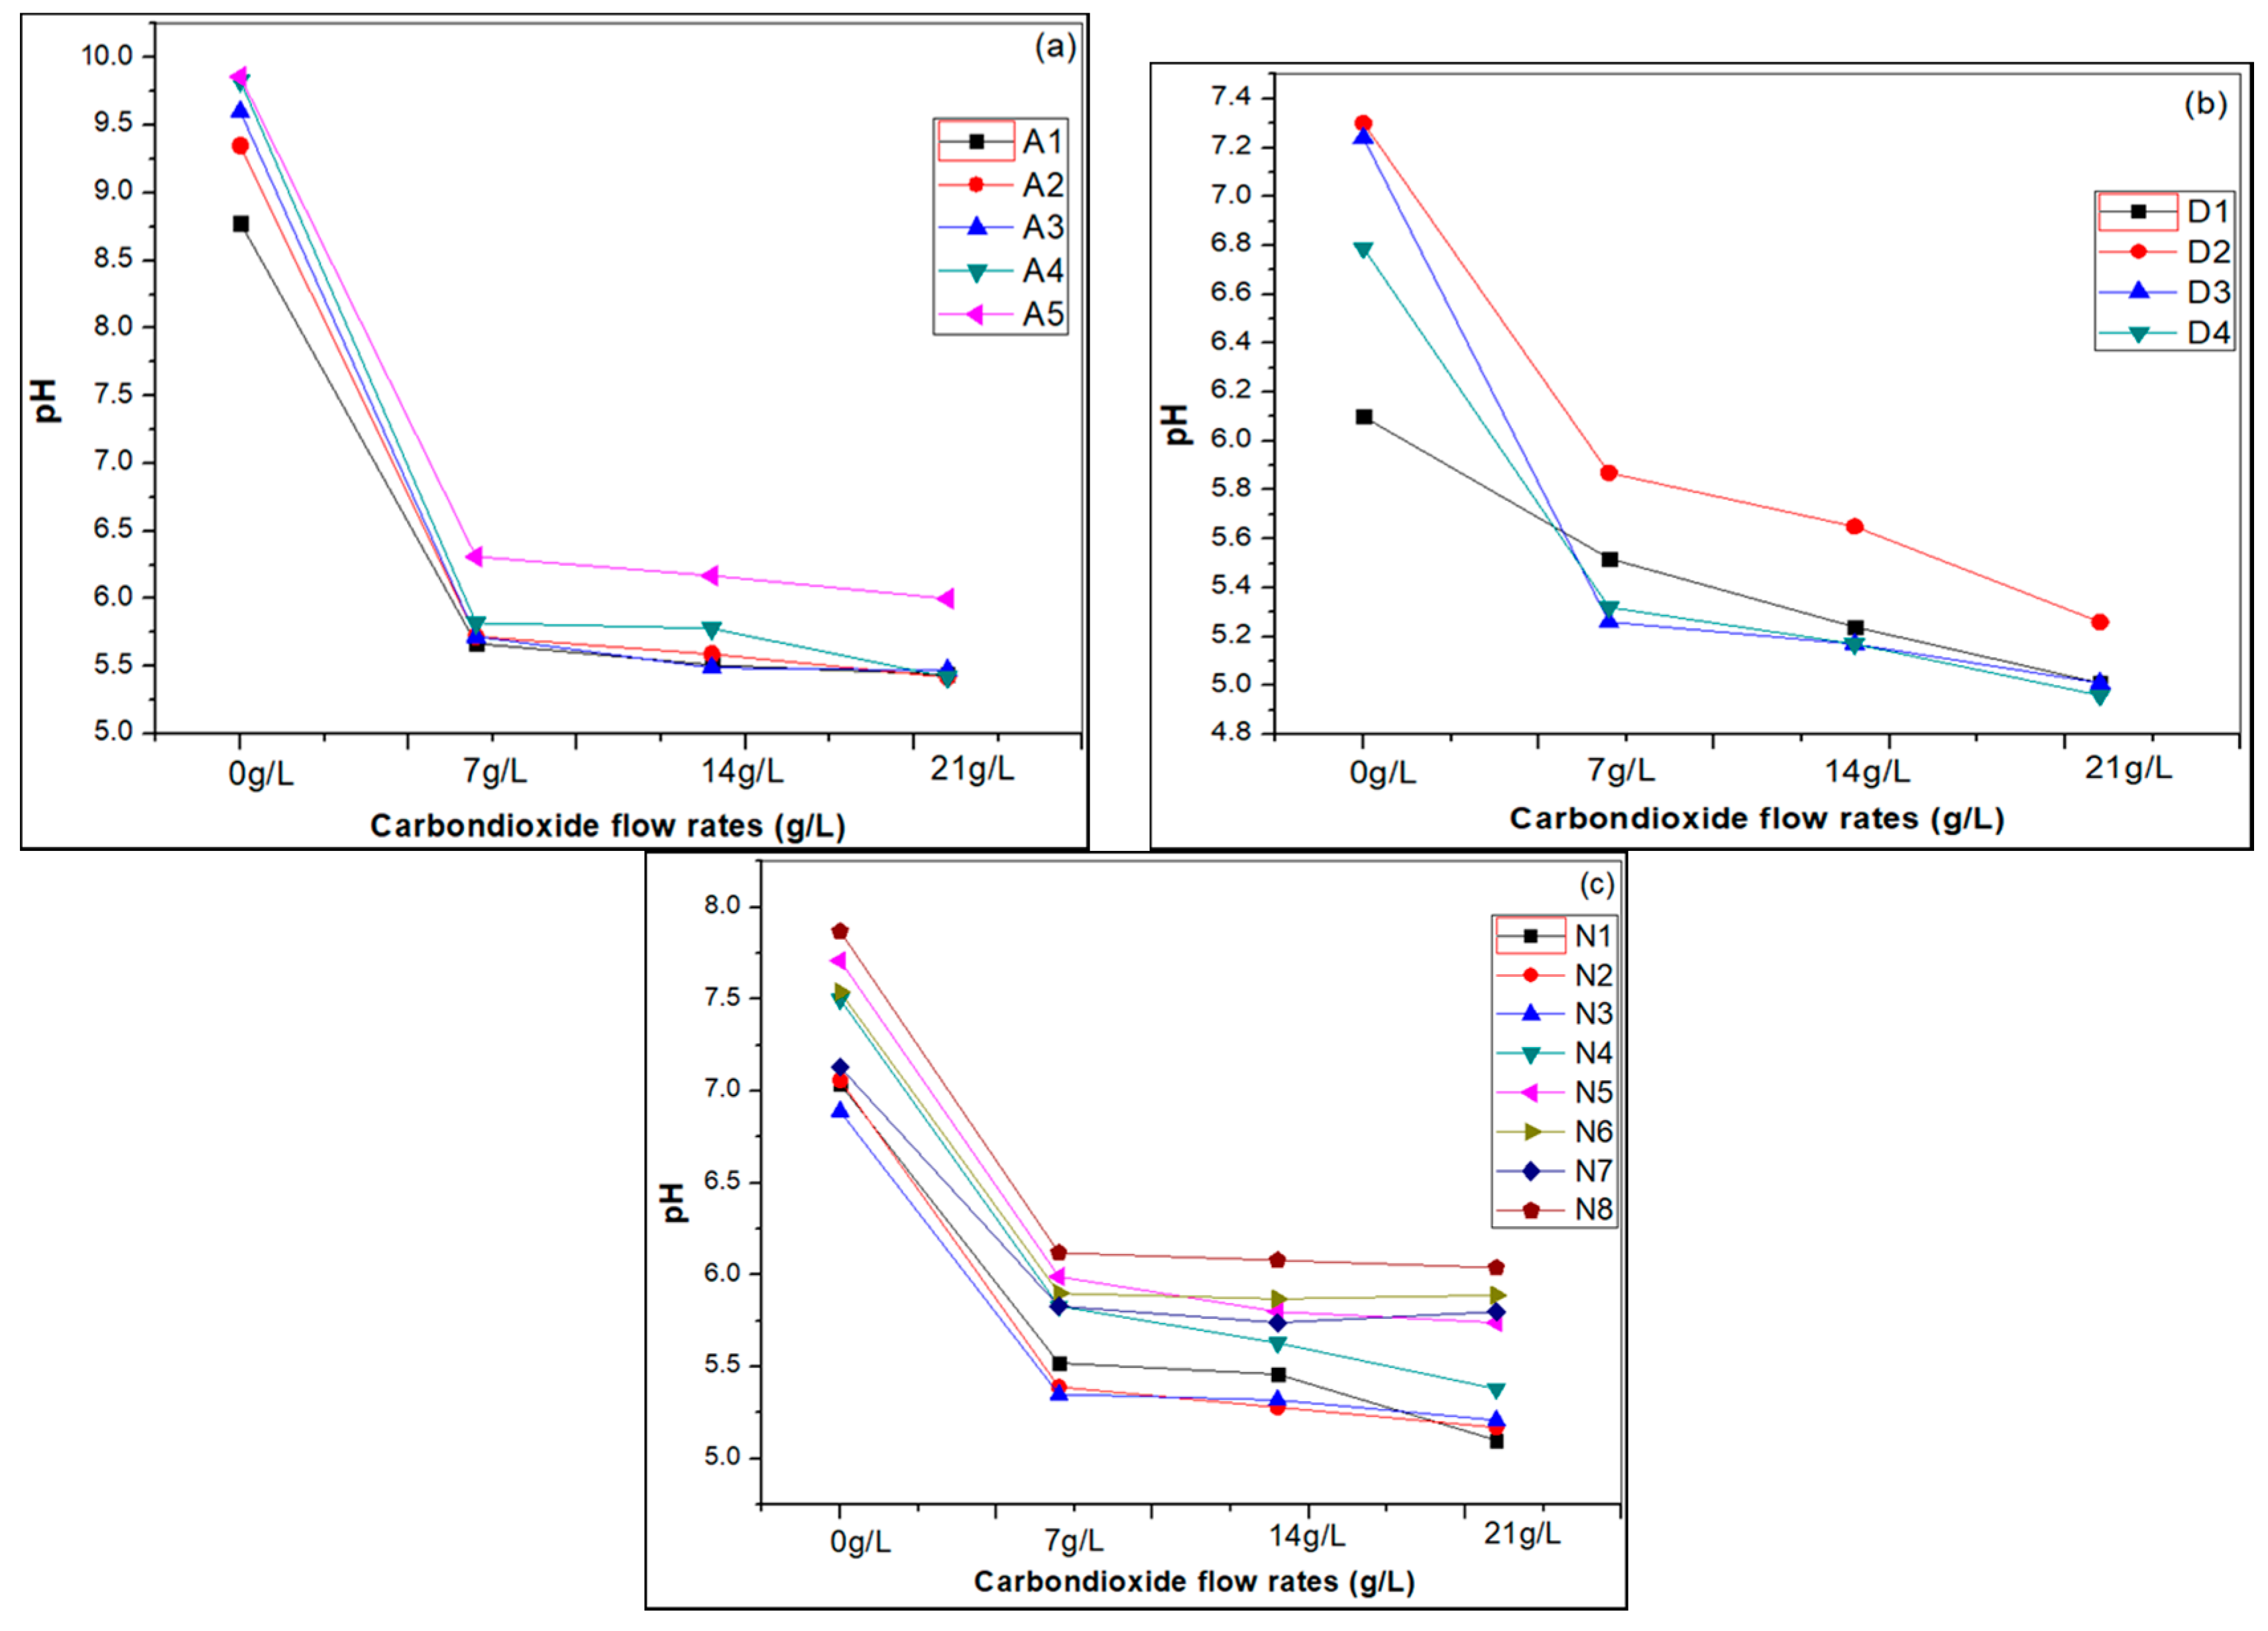
3.3. pH Effects of Carbonation

The pH of all samples was measured before and after carbonation. The CO2 gas molecules react with water-producing carbonic acid and the pH is lowered, see Figure 8, where it also is found that at higher CO2 flow rates the pH becomes lower.

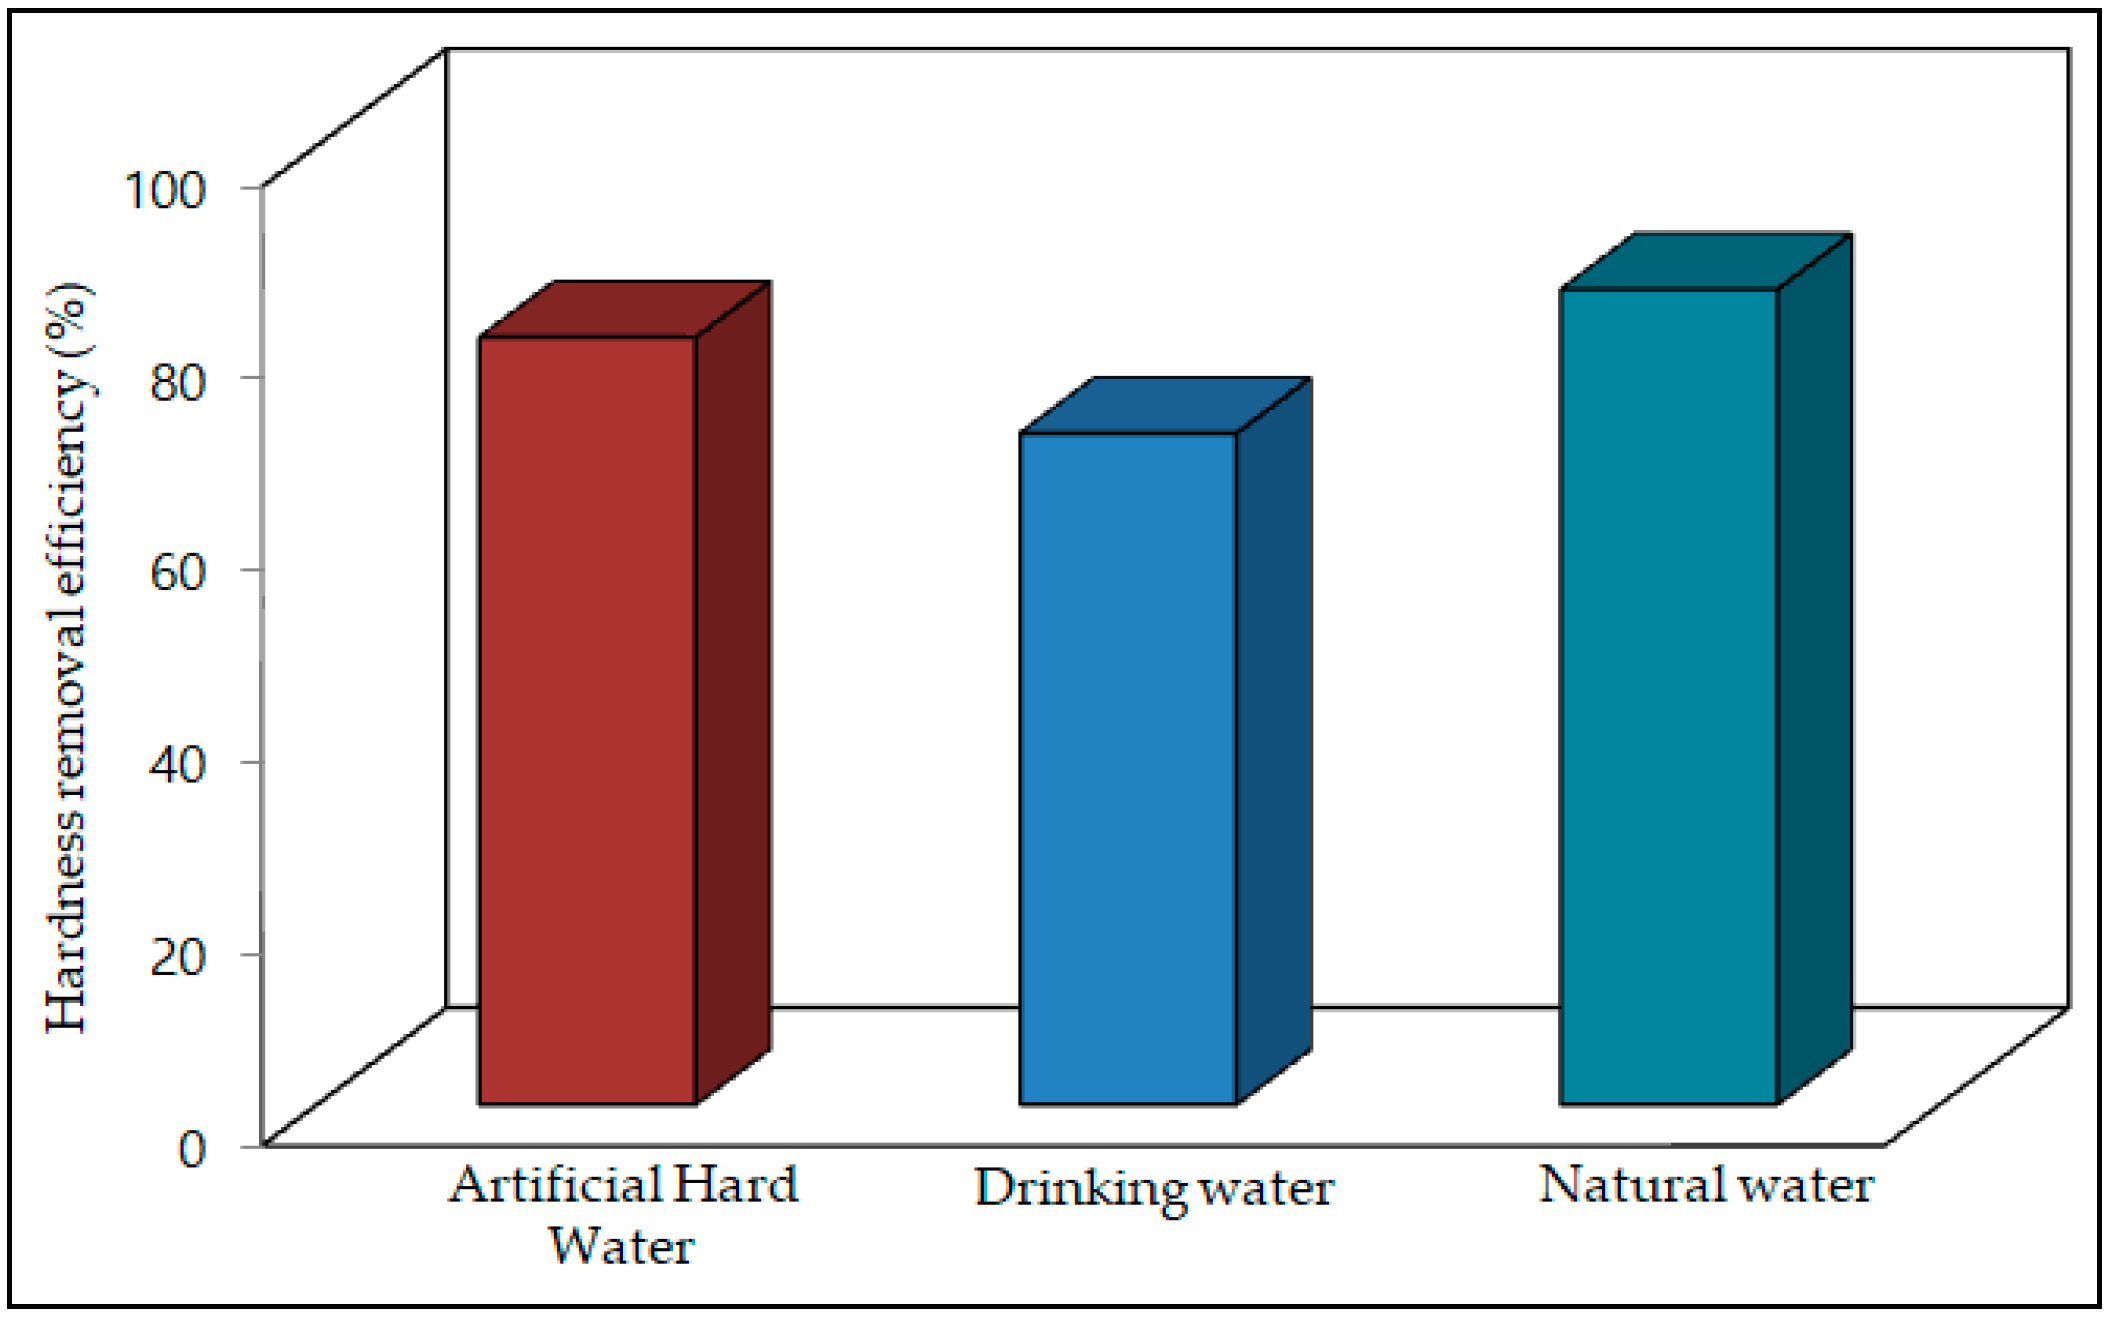
3.4. Water Hardness Removal Efficiency of the Carbonation Process

The hardness removal efficiency was 70–80% for artificial water samples, 60–70% for drinking water samples and 70–85% for natural water samples, respectively. The results are shown in Figure 9.

3.5. Crystal Growth Mechanism

In the carbonation reaction, the CO2 gas was hydrated and formed negatively charged bicarbonate ions. Under super-saturated conditions the Ca2+ and Mg2+ nucleated and formed calcium and magnesium carbonates [12,13]. Consequently, small calcite crystallites appeared on the surface, as shown in Figure 10, which presents the crystal growth mechanism of the carbonation process.

4. Conclusions

The purpose of this experimental study was to determine the hardness of different water samples collected from different areas in South Korea, and to reduce the hardness by a simple carbonation process in a closed pressure reactor.
(i)
The carbonation process effectively reduced the hardness in all artificial water samples by approximately (70–80%). At room temperature, a 21 g/L CO2 flow rate for 5 min was enough to remove most of the Ca2+ and Mg2+ ions from the water. The hardness reduction increased with increasing temperature, because carbon dioxide effectively reacts with Ca2+ and Mg2+ ions with increasing temperature. The results indicated that 85% of the hardness was possible to remove by a simple carbonation method.
(ii)
In drinking water samples the hardness was also reduced effectively using the carbonation process, with 21 g/L CO2 at room temperature for 5 min reaction reducing the water sample hardness by approximately 60 to 70%.
(iii)
For the natural water samples collected from different areas of South Korea, 21 g/L of CO2 carbonation for 5 min at room temperature reduced the hardness by 70 to 85%. The results revealed that the carbonation process in a closed pressure reactor effectively control the water hardness of different kinds of water by relatively simple means.

Acknowledgments

This research was supported by a research grant of the “Research and Education Program”, Chemical Engineering Department, Kwangwoon University, Seoul, Korea.

Author Contributions

Min Kyung Ahn collected the water samples from various places and performed the experiments. Choon Han, Ramakrishna Chilakala and Thriveni Thenepalli conceived and designed the experiments; analyzed the data and wrote the manuscript.

Conflicts of Interest

The authors declare no conflict of interest.

References

  1. Water Review, Consumer Report. A Publication of the Water Quality; The South Korean Research Council: Chungcheongnam-do, Korea, 1990; Volume 5.
  2. Padmapriya, R.; Saranya, T.; Thirunalasundari, T. Phyllanthus emblica-A Biopotential for hard water treatment. Int. J. Pure Appl. Biosci. 2015, 3, 291–295. [Google Scholar]
  3. Neri, L.C.; Johansen, H.L. Water hardness and cardiovascular mortality. N. Y. Acad. Sci. 1978, 304, 203–221. [Google Scholar] [CrossRef]
  4. Sengupta, P. Potential health impacts of Hard Water. Int. J. Prev. Med. 2014, 4, 866–875. [Google Scholar]
  5. Comstock, G.W. Water hardness and cardiovascular disease. Am. J. Epidemiol. 1979, 110, 375–400. [Google Scholar] [CrossRef] [PubMed]
  6. Agostinho, L.C.L.; Nascimento, L.; Cavalcanti, B.F. Water hardness removal for industrial use: Application of the electrolysis process. Open Access Sci. Rep. 2012, 1, 460–465. [Google Scholar]
  7. Smith, E.J.; Davison, W.; Hamilton-Taylor, J. Methods for preparing synthetic freshwaters. Water Res. 2002, 36, 1286–1296. [Google Scholar] [CrossRef]
  8. Marking, L.L.; Dawson, V.K. Methods for assessment of toxicity or efficacy of mixtures of chemicals. In Investigations in Fish Control; Series Number 67; U.S. Fish and Wildlife Service (USFWS): La Crosse, WI, USA, 1975; pp. 1–8. [Google Scholar]
  9. Cash, D. Analysis of Calcium in a Supplement tablet; Analysis of Magnesium in Epsom Salt; Hardness of Water; Mohawk College of Applied Arts and Technology: Hamilton, ON, Canada, 2008. [Google Scholar]
  10. Kakisako, M.; Nishikawa, K.; Nakano, M.; Harada, K.S.; Tatsuoka, T.; Koga, N. Stepwise inquiry into hard water in a high school chemistry laboratory. J. Chem. Educ. 2016, 93, 1923–1928. [Google Scholar] [CrossRef]
  11. Hem, J.D. Study and Interpretation of the Chemical Characteristics of Natural Water. U.S Geological Survey Water Supply Paper 2254, 1-272; United States Government Printing Office, 1985. Available online: https://pubs.usgs.gov/wsp/wsp2254/pdf/wsp2254a.pdf (accessed on 15 August 2017).
  12. Kim, Y.Y.; Schenk, A.S.; Ihli, J.; Kulak, A.N.; Hetherington, N.B.J.; Tang, C.C.; Schmahl, W.W.; Griesshaber, E.; Hyett, G.; Meldrum, F.C. A critical analysis of calcium carbonate mesocrystals. Nat. Commun. 2014, 5, 1–14. [Google Scholar] [CrossRef] [PubMed]
  13. Mahvi, A.H.; Shafiee, F.; Naddafi, K. Feasibility study of crystallization process for water softening in pellet reactor. Int. J. Environ. Sci. Technol. 2005, 1, 301–304. [Google Scholar] [CrossRef]
Figure 1. Major cations and associated anions in water.
Water 10 00054 g001
Figure 2. EDTA complex formation by the reaction with Ca2+ and Mg2+ ions.
Water 10 00054 g002
Figure 3. Carbonation process with the closed pressure reactor.
Water 10 00054 g003
Figure 4. KIGAM bench scale carbonation reactor.
Water 10 00054 g004
Figure 5. (a) SEM and EDS results of calcium and magnesium carbonate crystals formed by carbonation; (b) XRD results of calcite.
Water 10 00054 g005
Figure 6. Reducing water hardness by carbonation in different water (a) artificial water; (b) drinking water; and (c) natural water samples.
Water 10 00054 g006
Figure 7. Water hardness reduced by carbonation at different temperatures in artificial hard water samples.
Water 10 00054 g007
Figure 8. pH changes in different hard water samples, (a) artificial hard water, (b) drinking water and (c) natural water samples by carbonation at different CO2 flow rates.
Water 10 00054 g008
Figure 9. Water hardness removal efficiency of the carbonation process.
Water 10 00054 g009
Figure 10. Crystal growth mechanism of the carbonation process with closed pressure reactor.
Water 10 00054 g010
Table 1. Different water samples names with given numbers.
Artificial Hard WaterDrinking WaterNatural Water
Sample NameNumberSample NameNumberSample NameNumber
Artificial Soft waterA-(1)CHOICE waterD-(1)Softener pass waterN-(1)
Artificial Slightly Hard waterA-(2)ViO waterD-(2)Seoul Arisu waterN-(2)
Artificial Moderately Hard waterA-(3)Sam Da Soo waterD-(3)Seoul Park Tap waterN-(3)
Artificial Very Hard waterA-(4)O-EAU waterD-(4)Seoul Outdoor Swimming pool (1) waterN-(4)
Seoul Outdoor Swimming pool (2) waterN-(5)
Seoul Outdoor Swimming pool Toilet waterN-(6)
(Korea Institute of Geoscience and Mineral Resources(KIGAM)-Waste waterN-(7)
Table 2. Chemical composition for the preparation of hard water.
Water SamplesReagent Added (mg/L)Approximate Final Water Quality
NaHCO3CaSO4·2H2OMgSO4KClpHHardness (mg/L)
Soft12.07.57.50.56.4–6.810–13
Slightly hard48.030.030.02.07.2–7.640–48
Moderately hard96.060.060.04.07.4–7.880–100
Hard192.0120.0120.08.07.6–8.0160–180
Very hard384.0240.0240.016.08.0–8.4280–320
Table 3. Hardness of different water samples before and after carbonation.
Sample NameWater Hardness-before Carbonation (ppm)Water Hardness after Carbonation (mg/L)
7 g/L CO2 for 3 min14 g/L CO2 for 4 min21 g/L CO2 for 5 min
I. Artificial hard water
A-(1)38241712
A-(2)84523922
A-(3)110655024
A-(4)1721087943
A-(5)34421015890
II. Drinking water samples
D-(1)96604532
D-(2)60382517
D-(3)2214107
D-(4)52332418
III. Natural water samples
N-(1)64403019
N-(2)56352715
N-(3)64402918
N-(4)70453214
N-(5)132795220
N-(6)140885621
N-(7)76503516
N-(8)66402918

