The Reducing Effect of Green Spaces with Different Vegetation Structure on Atmospheric Particulate Matter Concentration in BaoJi City, China


College of Landscape Architecture and Art, Northwest A&F University, Shaanxi 712100, China
*
Author to whom correspondence should be addressed.
†
These authors contributed equally to this work.
Atmosphere 2018, 9(9), 332; https://doi.org/10.3390/atmos9090332
Submission received: 6 July 2018
/
Revised: 17 August 2018
/
Accepted: 20 August 2018
/
Published: 22 August 2018
(This article belongs to the Special Issue Air Quality in China: Past, Present and Future)
Abstract
:With the acceleration of urbanisation and industrialisation, atmospheric particulate pollution has become one of the most serious environmental problems in China. In this study, green spaces in Baoji city were classified into different patterns on the basis of vegetation structural parameters, i.e., horizontal structure, vertical structure and vegetation type. Eleven types of green space with different structures were selected for investigating the relationships between atmospheric particulate matter (PM) concentration and green spaces with different vegetation structure, based on the “matrix effect” of environmental factors, i.e., location, time, wind velocity, temperature, humidity and area to the concentration of PM2.5 and PM10 in the green spaces. The results showed that: (1) Location, time, wind velocity, temperature and humidity had highly significant effects on the concentration of PM2.5 and PM10. In sunny and breeze weather conditions, PM2.5 and PM10 concentration increased with the wind velocity and humidity, and decreased with the temperature. The range of PM10 concentration was greater than the range of PM2.5 concentration. (2) Less than 2 hectares of the green space had no significant influence on the concentration of PM2.5 and PM10. (3) The concentration of PM2.5 and PM10 showed no significant difference between all the green spaces and the control group. There was no significant difference in the reduction of PM2.5 concentration between different structural green spaces, but there was a significant difference in the reduction of PM10 concentration. The above results will provide a theoretical basis and practical methods for the optimisation of urban green space structures for improving urban air quality effectively in the future.
1. Introduction
With the rapid development of urbanisation and industry in China and the increase of the per capita holdings of vehicles, the pollution of atmospheric particulate matter has become one of the most serious problems that cannot be neglected in today’s society [1,2]. Particulate matter is usually divided into four categories according to the aerodynamic diameter (Dp), and the effects of particulate matter on health vary with the different size fractions. PM10 is one of the primary pollutants that affect air quality and damages human health through the respiratory tract [3]. Smaller PM2.5 is even more harmful, more easily enriches toxic substances, and can enter the alveolar and the blood circulation system, causing a variety of human systemic diseases [4,5,6]. In the 74 leading cities of China, approximately 32% of the reported deaths, with a mortality rate of 1.9%, were associated with PM2.5 and PM10 in 2013, in which deaths from cardiovascular, respiratory and lung-cancer causes accounted for 20% of the reported deaths, with a mortality rate of 1.2% [3]. Other studies have claimed that PM2.5 has contributed as much as 40.3% to total stroke deaths in China since 2015 [7]. Air pollution control is thus urgently needed in China.
Urban green spaces, as an important part of the city, not only provide people with recreational places [8,9], but also play a great role in regulating the urban ecological environment [10,11], especially in purifying and improving the air quality [12,13]. Many studies have claimed that plants could absorb atmospheric particles due to their special leaf surface structures and physiological and biochemical characteristics [14,15,16]. Vegetation structure is often used to describe the spatial distribution of vegetation in green space. The capacity of different vegetation structures to reduce the concentration of airborne particulates is different. Some studies have shown that the reduction of airborne particulate matter of composite structure of green space was better than the single structure of green space [17,18]. The concentration of particulate matter was lowest in the broadleaf and coniferous mixed-trees type and highest in the grassland type [19]. In addition, the reduction of PM10 of mixed forest was better than the single forest [20]. However, other studies have shown that the ability to reduce the concentration of PM2.5 in the air of lawn and pure coniferous forest was stronger than that of the composite structure [21]. In the study of Yin [22], it was found that when the classification of vegetation structure was based on the overall spatial structure, the percentage of green space purification to TSP was positively correlated with the canopy density of the plant community, and it was negatively correlated with the permeability. Different plant allocation of a green space showed no significant difference in terms of the reducing effect on air particulate matter concentration [23]. It can be explained that there is no uniform vegetation structural classification standard and that ignoring the “background effect” of environmental meteorological factors are the main factors restricting the relationship between green space and airborne particle concentration [24,25,26,27,28]. In addition, the effect of vegetation on urban pollutant concentration has often relied on the location of emission sources, especially for the surrounding environment of urban traffic [14,25].
Therefore, different types of green space with different structures in Baoji city, China were selected on the basis of a biotope mapping scheme for investigating the relationships between atmospheric particulate matter concentration and green spaces with different vegetation structures, based on the “matrix effect” of environmental factors, i.e., location, time, wind velocity, temperature, humidity, area to the concentration of PM2.5 and PM10 in the green spaces. Hopefully, the results will provide a theoretical basis and practical methods for the optimisation of urban green space structures for improving urban air quality effectively in the future.
2. Materials and Methods
2.1. Study Area
Baoji City is located in the western part of the Guanzhong Plain in Northwest China. The terrain and landscape are complex. The city is surrounded on three sides by mountains, and the Weihe River passes through the centre of the city. It belongs to the semi-humid climate in the warm temperate zone. The average annual temperature is 13.0 °C. The lowest temperature is in January, and the average minimum temperature is 3.5 °C. The highest temperature is in July, and the average maximum temperature is 30.9 °C. The average annual rainfall is about 710–1000 mm [29].
In this study, 11 urban green space types with distinctive differences in vegetation structures were selected, with a distribution along both sides of the Weihe River, which is the largest tributary to the Yellow River in the Baoji City, thereby representing the diversity of green space types, i.e., People’s Park (G1), Weihe Ecological Park (G2), Botanical Garden (G3), Weihe Wetland Park (G4), Baoji University of Arts and Sciences (G5), High-tech Square (G6), Affiliated green space of Panlong Bridge (G7), City Mansion (G8), Ronghai Shengshi (G9), Jufeng Botanical Garden Ecological Community (G10) (Figure 1). The environmental conditions around the ten study areas were similar, and there were no obvious sources of pollutant emission such as factories and boilers, but it was inevitable around the urban main roads. To avoid the automobile exhaust gas from having a huge impact on the concentration of airborne particulate matter, the selection of specific research plots in the study area was far away from the surrounding area and maintained a certain distance from the peripheral roads. In each study area, a variety of vegetation types and hard-pavement control groups were selected for monitoring and comparison.
2.2. Classification of Green Space Based on Vegetation Structure
In this study, combined with the local characteristics, the green space classification of Baoji was established based on the National Natural Science Fund Project of China “Construction of urban biodiversity conservation system based on biotope mapping”. The classification was modified and classified into three levels according to the vegetation structure [30] (Table 1): the first level was based on the horizontal structure of vegetation according to the canopy cover ratio of trees and shrubs. However, semi-open green space with a 10–30% canopy of trees and shrubs was excluded due to the limited sample; the second level was based on vegetation type including broad-leaved, coniferous and mixed woodland. The third level was mainly focused on the vertical structure, which refers to the vegetation elements at different heights of the tree layer and shrub layer in the vertical form of the combination [31]. In this study, one-layered structures only contained a tree layer, more-than-one-layered structures referred to double tree layers or tree layer and shrub layer combinations.
2.3. Data Collection
The sample plots were randomly selected for data collection in the ten pre-coded green spaces according to the established classification of vegetation structure. A control group (C) was selected at the hard ground in each of the ten study areas for comparative analysis. The repetition and distribution of each type of green spaces is as follows (Table 2 and Figure 2).
The concentrations of PM2.5 and PM10 and the meteorological factors including wind velocity, temperature and humidity were tested twice in green spaces with typical vegetation structures in each sample plot every two hours, five times a day from 8 a.m. to 6 p.m. in good weather conditions. Monitoring time was from April to May, 2017, as the urban heating period in this quarter has just ended, meaning that the external pollution is reduced. In addition, the monitoring time was when the plants were in the long-leaf stage with a good growth, which can also help reduce the concentration of particulate matter. Data was recorded by a hand-held aerosol mass spectrometer (Metone 831) and a hand-held weather station (FC-36025). All plots were monitored within the same time period and the monitoring sequence was consistent. All the tests were performed at a height of 1.5 m, which is the average height of human respiration. As to the area calculation of each sample plot, it was measured by using a hand-held GPS receiver (Garmin GPS map 629sc) to obtain the latitude and longitude around the sample site and then introducing the plot coordinates into ArcGIS 10.2 software combined with the satellite image to calculate the area accurately.
2.4. Data Analysis
In this study, Microsoft Office Excel 2007 software (Microsoft Corporation, Redmond, WA, USA) was used for all data recording and collection. Paired samples t-test was used to determine whether there were differences in atmospheric particulate matter concentration between the green spaces and control groups. Data were extracted and root transformed to stabilise the variance of individual properties where necessary [32]. Variance analysis was used to determine whether there was a significant relationship between atmospheric particulate matter concentration and green spaces with different vegetation structure, based on the “matrix effect” of environmental factors, e.g., location, time, wind velocity, temperature, humidity and area. Then, generalised regression analysis was applied to analyse the specific effect of a variable on the concentration of PM2.5 and PM10 [33]. The statistical analyses were conducted using the statistical software package Minitab 16 (State College, PA, USA). The accepted significance level was at p < 0.05.
3. Results
3.1. Effects of Factors on PM Concentration
The area of the selected green spaces ranged from 0.01–1.65 hectares. The local temperature varied from 18.6 to 37.3 °C and the relative humidity range was 25.9–71.9%. The varieties of wind velocity ranged from 0–2.8 m·s−1. The statistical results showed that the location, testing-time, wind velocity, temperature and humidity had highly significant influences on particulate matter concentration (p = 0.000), while the area of the site had no significant influence on PM2.5 (p = 0.983) and PM10 (p = 0.126) concentration, and the same for the vegetation structure and PM2.5 (p = 0.500); however, vegetation structure had a highly significant effect on PM10 concentration (p = 0.002) (Table 3).
3.2. Effects of Environmental Factors on PM Concentration
There were significant differences in particulate matter concentrations in 10 different locations (Table 4 and Figure 3). Among them, the generalised regression coefficient of the People’s Park (G1), Weihe River Ecological Park (G2), Botanical Garden (G3) and Jufeng Botanical Garden Ecological Community (G10) were negative, and the other six regional generalised regression coefficients were positive. The reducing effect on the concentration of particulate matter in the study areas G1, G2, G3 and G10 were significantly better than the other six study areas.
The concentrations of particulate matter in the different monitoring time periods were significantly different (Table 5 and Figure 4). From 8:00 a.m. to 6:00 p.m., the concentration showed a downward trend and then gradually increased. It was the lowest in the noon and the highest in the morning.
Meteorological factors such as wind velocity, temperature and humidity had a significant effect on the concentration of particulate matter (Figure 5). In sunny and breezy weather conditions, particulate matter concentration increased with the wind velocity between 0 and 2.8 m·s−1 and humidity between 25.9 and 71.9%, and decreased with the temperature between 18.6 and 37.3 °C. The site area, with a change between 0.01 and 1.65 hectares, had no significant effect on particulate matter concentration (Figure 5).
3.3. Effects of Vegetation Structural Factors on PM Concentration
There were no significant differences between any of the green spaces with different vegetation structures and the control groups after paired samples t-test analysis (p = 0.899 for PM2.5 and p = 0.391 for PM10), indicating that the reducing effect on atmospheric particulate matter concentration by green spaces was very limited under these conditions.
There was no significant difference in the reduction of PM2.5 concentration between different vegetation structural green spaces (Table 6), which could indicate that the role of the 11 vegetation structural green spaces was similar to the reduction of PM2.5 concentration. Meanwhile, there were significant differences in the reduction of PM10 concentration among 11 different vegetation structural green spaces (Table 6). The concentrations of PM10 in the open green spaces with lawns and shrubs (OL and OS) and the double-layered closed broad-leaved forests (C2B) were significantly different from those of the other 9 kinds of vegetation structure in green spaces. The positive and negative coefficients of the generalised regression represent the positive and negative effects of vegetation structure on the concentration of airborne particles. The open green spaces with lawns and shrubs (OL and OS) had a negative effect on PM10 concentration, indicating that the concentrations of PM10 in these types of green space were the lowest. In contrast, the concentration of PM10 was the highest in double-layered closed broad-leaved forests (C2B) due to their positive effect. Meanwhile, the concentrations of PM10 in the other 9 vegetation structures in green spaces were placed in the middle without significant differences.
4. Discussion
4.1. Effects of Environmental Factors on PM Concentration
All the study plots and their repetitions in this study were distributed evenly in ten study areas to reduce the interference caused by different environmental conditions in different study areas and their surroundings. In addition, they were located in the city, with similar surrounding environments and no obvious sources of pollutants and were a long distance from motorways; nevertheless, it was still found that the location had a highly significant impact on the airborne particulate concentrations. The concentration of PM2.5 and PM10 in the People’s Park (G1), Botanical Garden (G3) and Jufeng Botanical Garden Ecological Community (G10), which was close to the botanical garden, were the lowest, because the conservation and management of green spaces in these areas was high, ensuring that the plants were regularly trimmed, watered and fertilised. This result was consistent with a previous study which showed that the level of plant management has a certain impact on its ability of reducing air particles [34]. The higher the degree of plant management, the greater the ability to reduce airborne particulate matter. Through regular pruning and watering, the particles would be removed from the plants’ surface restoring their ability for dust retention. Since the traffic flow around the High-tech Square (G6) and affiliated green space of Panlong Bridge (G7) is higher than other locations, the PM2.5 and PM10 concentrations are higher, due to vehicle exhaust emissions. Leonard et al. [14] showed that vehicle exhaust emissions have a significant impact on airborne particulate concentrations, and tight control of relevant measures can effectively reduce airborne particulate concentrations [35].
This study found that the time of monitoring had a highly significant effect on the concentration of airborne particulates, which could be attributed to the interaction between the surrounding pollution sources and the changes in meteorological factors during the day [19,26]. The concentration of airborne particles during the day showed a slight increase after a decreasing trend. It was high in the morning, declined in the afternoon, and gradually rose in the evening; the lowest value of PM10 concentration was found between 12 a.m. and 2 p.m., while the minimum PM2.5 concentration was between 2 p.m. and 4 p.m. Huge traffic flow, a large number of automobile exhaust emissions, and serious dust may cause airborne particulate matter concentration to increase in the morning and to reach its peak in the evening. At noon, airborne particulate concentration was low due to there being fewer people and less traffic flow and lighter pollution. Atmospheric particulate matter concentration could be positively correlated with pedestrian flow and traffic flow [36,37].
To avoid the great influence of dramatic changes in meteorological factors on the concentration of airborne particulates, the days with sunny and breeze weather conditions were selected for test. However, the results still showed that meteorological factors had a highly significant effect on the concentration of PM2.5 and PM10, and their concentrations increased with wind velocity and humidity, and decreased with temperature. In the same weather conditions, the PM10 concentration range was greater than the range of PM2.5 concentration, which could indicate that the larger the particle size of the particles, the more easily transported or settled, and the more obvious the response to meteorological factors [26,37,38].
Wind velocity affects airflow and the diffusion of airborne particulates. Freer-Smith et al. [39] found that the particulate matter sedimentation rate under gale conditions (9 m·s−1) was higher than under breeze conditions (3 m·s−1). Beckett et al. [40] found that when the wind velocity was less than 8 m·s−1, the particulate matter sedimentation rates increased with the increase of wind velocity, but the increase of wind velocity may lead to a decrease in the particulate matter sedimentation rate. Wang et al. [27] showed that the concentration of airborne particles increased first and then decreased with the increase of wind velocity, and reached its peak at a maximum wind speed of 14 m/s. Wind speed significantly influenced particulate matter capture efficiency of plants, and particulate matter leaf deposition was positively correlated with low wind speed, but it may decrease with wind speed above a certain critical range [39,40]. The resuspension and deposition rates both varied with different sizes even if the wind speed was similar [41], i.e., large particles and coarse particulates were easily blown off, while fine particulate matter distributed in the grooves of leaf surface was not readily blown away [27,42]. That is, in this study, under breeze conditions, the wind velocity in the range of 3 m·s−1 was too small to sufficiently diffuse the air particles, resulting in an increase in the concentration. In addition, the wind direction also has a certain influence on the diffusion of air particles. The wind speed studied in this study was low, so this direction was not explored in detail. In future research, wind direction can be increased, especially in the study of airborne particles in traffic-crowded streets.
With the increase of temperature, the convective effect of the atmosphere in the vertical direction was more frequent. This gas circulation exchange accelerated the transportation of air particles, helping reduce the concentration of air particles. Furthermore, with the temperature increased, plant photosynthesis and adsorption of particulate matter were strengthened, helping adsorb airborne particles [26,43,44].
Within a certain range, fine particles were more easily condensed as coagulation nuclei as the humidity increased, resulting in an increase in air particulate concentration. When the relative humidity increased to a certain extent, the amount of wet deposition increased, and then the particle concentration decreased [26,28]. Additionally, an increase in wettability and relative humidity can trigger certain emission mechanisms of biological particles, such as the active wet ejection of fungal spores or hygroscopic swelling-induced pollen fragmentation, increasing the concentration of atmosphere biological particles around vegetation [45].
In this study, the changes of green space area between 0.01 and 1.65 ha had no significant influence on the concentration of PM2.5 or PM10. There were also no significant differences between green spaces and control groups.
That is, the reducing effect on atmospheric particulate matter concentration by green spaces compared to gray spaces was very limited at this area of scale. Green space area was one of the factors that affected the ability of particulate matter dust retention. Within a certain range, the larger the area is, the better the reduction of particulate matter concentration in green space. Liu et al. [46] found that PM2.5 concentration index was negatively correlated with forest area. Similarly, the concentration of PM10 in the air was also largely influenced by the green space area factor, increasing the green space area helps to reduce the PM10 concentration in the air [47]. Previous studies have shown that the larger the area of green space, such as forests and parks in the city, the greater the reduction in airborne particulates [48]. Urban areas with proportionally higher concentrations of urban forestry may experience better air quality with regard to reduced ambient particulate matter [24]. In urban land use and land cover planning, increasing the coverage of green land can effectively reduce the concentration of air pollutants [49,50]. All the plots involved in this study were less than 2 ha, and our results confirmed the former. The reduction of particulate matter concentration in the air at this area of scale was not significant, so there was no significant difference in particulate matter dust retention capacity. However, determining the critical value of green area that could reduce the concentration of airborne particulates should be the focus further study. In this study, in which the area of green space was no more than 2 ha, the change in area was not sufficient to produce qualitative changes in the concentration of particulate matter in the air. This would be an important implication for the purposes of eco-oriented design of green space planning and design, in that the configuration of different plants at such a small scale could be very limited in terms of purifying the air particulate matter.
4.2. Effects of Vegetation Structural Factors on PM Concentration
There was no significant difference in the reduction of PM2.5 concentration in different vegetation structures in green spaces, while there were significant differences in PM10 concentration. Plants use their special micro-morphological structure to retain particulate matter. The ratio of the mass and volume of PM10 on the leaf surface was much larger than that of PM2.5 [51]; that is, the plant had a stronger reduction effect on the larger particle size, which may cause this difference.
The concentration of PM10 in the open green spaces dominated, with lawns and shrubs being the lowest, while that of double-layered closed broad-leaved forests was the highest. Therefore, green spaces with different vegetation structures can be scientifically chosen for adsorption of particulate matter concentration in air quality-oriented green space planning and design. Some researchers have considered that the concentration of airborne particulate matter in the closed plant communities is higher than that in open plant communities [21,52]. Particulate matter leaf depositions on trees and shrubs with complex structures are higher than those of herbs and liana species [53]. Through the analysis of the vegetation characteristics of different vegetation structures, we found that in double-layered closed broad-leaved forest the structure of the vegetation was complex, causing air turbulence, and the plant species were diverse and varied in quantity, hindering the sedimentation of PM10 [42]. The particles adsorbed on the surface of the broadleaf leaves were only temporarily trapped, prone to bounce back, and were then suspended in the atmosphere, thereby increasing the concentration of air particles [54,55]. In the open green spaces dominated by lawns and shrubs, the sedimentation of PM10 was less obstructed, and the settling process could be completed directly; therefore, the concentration of PM10 in the air was low. Another possible reason was that meteorological factors, especially wind, have a greater influence on the concentration of particulate matter in open vegetation structures, and it was possible to transport the pollutant to a new location, reducing the concentration.
In addition to considering the impact of vegetation structure on airborne particulate matter, tree species therein also have a significant impact on air quality. Trees are a source of air pollutants, and they can produce pollen, spores, some bio-volatile organic compounds, and other biological particles, and increase the concentration of air particles after the chemical reaction with other pollutants in the air and the formation of organic aerosols [56,57,58]. In addition, the particles produced by the plant itself could limit the spread of contaminants and thus increase the concentration of local particulates [59,60]. Therefore, it could also be one of the reasons for increasing the concentration of particulate matter that the large number of plants and their complex layers in double-layered closed broad-leaved forests. In future studies, it is necessary to carry out more detailed classification and to examine whether the difference of specific plant species is significant for the reduction of airborne particle concentration.
5. Conclusions
Based on the detailed classification of the urban green space vegetation structure in Baoji City, combined with meteorological factors and other factors to analyse the PM2.5 and PM10 concentrations, we found that the reduction of PM2.5 and PM10 concentrations of different vegetation structures in urban green spaces have certain differences and are subject to a variety of common constraint factors.
These findings suggest that if controlling pollution sources cannot be entirely relied upon to control air pollution, changing the horizontal and vertical structure of vegetation and vegetation type can contribute to the reduction of PM2.5 and PM10 concentrations to a certain extent. The different combinations of vegetation structure not only consider the plant’s own use of some special structures to block the particulate matter, but also consider its impact on meteorological factors, and thus the concentration of particulate matter. According to the different main functions of urban green space in different regions, different vegetation structures can be selected for planting. However, the reduction effect of urban green space less than 2 ha on the concentration of airborne particles was limited and the effect of green space on a larger area scale is more significant. Changing the fragmentation status of urban green space and increasing the area of green space will help better play its ecological benefits. The above results can be used to provide a theoretical basis and practical methods for the optimisation of urban green space structures for improving urban air quality effectively in the future.
Author Contributions
L.Q., F.L., X.Z. and T.G. conceived and designed the experiment. F.L. and X.Z. performed the experiments. L.Q., F.L. and T.G. performed data analysis and wrote the manuscript.
Funding
This research was funded by the National Natural Science Foundation of China [grant numbers: 31500582 and 31600580].
Acknowledgments
We thank Matthew Paul for language editing for this manuscript. We also thank the 11 volunteers who participated in the study for the measurement.
Conflicts of Interest
The authors declare no competing financial interest.
References
- Ming, L.; Jin, L.; Li, J.; Fu, P.; Yang, W.; Liu, D.; Zhang, G.; Wang, Z.; Li, X. PM2.5 in the Yangtze River delta, China: Chemical compositions, seasonal variations, and regional pollution events. Environ. Pollut. 2017, 223, 200–212. [Google Scholar] [CrossRef] [PubMed]
- Yu, Y.; Schleicher, N.; Norra, S.; Fricker, M.; Dietze, V.; Kaminski, U.; Cen, K.A.; Stuben, D. Dynamics and origin of PM2.5 during a three-year sampling period in Beijing, China. J. Environ. Monit. 2011, 13, 334–346. [Google Scholar] [CrossRef] [PubMed]
- Fang, D. Impact Assessment of Air Pollution on the Population Health in Major Cities of China. Master’s Thesis, Nanjing University, Nanjing, China, May 2014. [Google Scholar]
- Kan, H.D.; Chen, B.H. Particulate air pollution in urban areas of Shanghai, China: Health-based economic assessment. Sci. Total Environ. 2004, 322, 71–79. [Google Scholar] [CrossRef] [PubMed]
- Khreis, H.; Kelly, C.; Tate, J.; Parslow, R.; Lucas, K.; Nieuwenhuijsen, M. Exposure to traffic-related air pollution and risk of development of childhood asthma: A systematic review and meta-analysis. Environ. Int. 2017, 100, 1–31. [Google Scholar] [CrossRef] [PubMed]
- Sosa, B.S.; Porta, A.; Colman Lerner, J.E.; Banda Noriega, R.; Massolo, L. Human health risk due to variations in PM10-PM2.5 and associated PAHs levels. Atmos. Environ. 2017, 160, 27–35. [Google Scholar] [CrossRef]
- Song, C.; He, J.; Wu, L.; Jin, T.; Chen, X.; Li, R.; Ren, P.; Zhang, L.; Mao, H. Health burden attributable to ambient PM2.5 in China. Environ. Pollut. 2017, 223, 575–586. [Google Scholar] [CrossRef] [PubMed]
- Peters, K.; Elands, B.; Buijs, A. Social interactions in urban parks: Stimulating social cohesion? Urban For. Urban Green. 2010, 9, 93–100. [Google Scholar] [CrossRef] [Green Version]
- Richardson, E.A.; Mitchell, R. Gender differences in relationships between urban green space and health in the United Kingdom. Soc. Sci. Med. 2010, 71, 568–575. [Google Scholar] [CrossRef] [PubMed] [Green Version]
- Bowler, D.E.; Buyung-Ali, L.; Knight, T.M.; Pullin, A.S. Urban greening to cool towns and cities: A systematic review of the empirical evidence. Landsc. Urban Plan. 2010, 97, 147–155. [Google Scholar] [CrossRef]
- Nielsen, A.B.; van den Bosch, M.; Maruthaveeran, S.; van den Bosch, C.K. Species richness in urban parks and its drivers: A review of empirical evidence. Urban Ecosyst. 2014, 17, 305–327. [Google Scholar] [CrossRef]
- Janhall, S. Review on urban vegetation and particle air pollution-deposition and dispersion. Atmos. Environ. 2015, 105, 130–137. [Google Scholar] [CrossRef]
- Litschke, T.; Kuttler, W. On the reduction of urban particle concentration by vegetation-a review. Meteorol. Z. 2008, 17, 229–240. [Google Scholar] [CrossRef]
- Leonard, R.J.; McArthur, C.; Hochuli, D.F. Particulate matter deposition on roadside plants and the importance of leaf trait combinations. Urban For. Urban Green. 2016, 20, 249–253. [Google Scholar] [CrossRef]
- Liang, D.; Ma, C.; Wang, Y.-Q.; Wang, Y.-J.; Zhao, C.-X. Quantifying PM2.5 capture capability of greening trees based on leaf factors analyzing. Environ. Sci. Pollut. Res. 2016, 23, 21176–21186. [Google Scholar] [CrossRef] [PubMed] [Green Version]
- Wang, H.X.; Wang, Y.H.; Yang, J.; Xie, B.Z.; Shi, H. Morphological structure of leaves and particulate matter capturing capability of common broad-leaved plant species in Beijing. In Proceedings of the 2015 International Conference on Industrial Technology and Management Science, Tianjin, China, 27–28 March 2015; Volume 34, pp. 581–584. [Google Scholar]
- Luo, M. Study on Air Pollutants Removal Effects of Green Space with Different Community Structures. Master’s Thesis, Huazhong Agricultural University, Wuhan, China, June 2013. [Google Scholar]
- Sun, S.P. Effect of Virescence on Inhalable Particulate Matter (PM10) and Dustfalls in Downtown of Beijing. Master’s Thesis, China Agricultural University, Beijing, China, June 2003. [Google Scholar]
- Gao, G.; Sun, F.; Nguyen Thi Thanh, T.; Lun, X.; Yu, X. Different concentrations of TSP, PM10, PM2.5, and PM1 of several urban forest types in different seasons. Pol. J. Environ. Stud. 2015, 24, 2387–2395. [Google Scholar] [CrossRef]
- Bottalico, F.; Chirici, G.; Giannetti, F.; De Marco, A.; Nocentini, S.; Paoletti, E.; Salbitano, F.; Sanesi, G.; Serenelli, C.; Travaglini, D. Air pollution removal by green infrastructures and urban forests in the city of florence. Agric. Agric. Sci. Procedia 2016, 8, 243–251. [Google Scholar] [CrossRef]
- Li, X.Y.; Zhao, S.T.; Guo, J.; Li, Y.M. Effects of different plant communities on the concentration of PM2.5 in parks. Mod. Landsc. Archit. 2014, 11, 11–13. [Google Scholar]
- Yin, S.; Cai, J.P.; Chen, L.P.; Shen, Z.M.; Zou, X.D.; Wu, D.; Wang, W.H. Effects of vegetation status in urban green spaces on particles removal in a canyon street atmosphere. Acta Ecol. Sin. 2007, 27, 4590–4595. [Google Scholar]
- Qi, F.Y. Distribution Characteristics of Atmospheric Particles from Highways and the Retaining Effect of Greenbelts. Master’s Thesis, Henan Agricultural University, Zhengzhou, China, June 2009. [Google Scholar]
- Irga, P.J.; Burchett, M.D.; Torpy, F.R. Does urban forestry have a quantitative effect on ambient air quality in an urban environment? Atmos. Environ. 2015, 120, 173–181. [Google Scholar] [CrossRef]
- Wang, H.; Shi, H.; Wang, Y. Effects of weather, time, and pollution level on the amount of particulate matter deposited on leaves of ligustrum lucidum. Sci. World J. 2015, 2015. [Google Scholar] [CrossRef] [PubMed]
- Liu, X.H.; Yu, X.X.; Zhang, Z.M.; Liu, M.M.; Ruan, S.Q.C. Pollution characteristics of atmospheric particulates in forest belts and their relationship with meteorological conditions. Chin. J. Ecol. 2014, 33, 1715–1721. [Google Scholar]
- Wang, H.X.; Shi, H.; Wang, Y.H. Dynamics of the captured quantity of particulate matter by plant leaves under typical weather conditions. Acta Ecol. Sin. 2015, 35, 1696–1705. [Google Scholar]
- Zhang, N. Effect of PM2.5 Variation Characteristics for Meteorological Factors in Beijing Winter. Master’s Thesis, Xinjiang University, Wulumuqi, China, May 2016. [Google Scholar]
- Weather China. Available online: http://www.weather.com.cn/cityintro/101110901.shtml (accessed on 28 June 2018).
- Gao, T.; Qiu, L.; Hammer, M.; Gunnarsson, A. The importance of temporal and spatial vegetation structure information in biotope mapping schemes: A case study in Helsingborg, Sweden. Environ. Manag. 2012, 49, 459–472. [Google Scholar] [CrossRef] [PubMed]
- Zehm, A.; Nobis, M.; Schwabe, A. Multiparameter analysis of vertical vegetation structure based on digital image processing. Flora Morphol. Distrib. Funct. Ecol. Plants 2003, 198, 142–160. [Google Scholar] [CrossRef]
- Yli-Pelkonen, V.; Setälä, H.; Viippola, V. Urban forests near roads do not reduce gaseous air pollutant concentrations but have an impact on particles levels. Landsc. Urban Plan. 2017, 158, 39–47. [Google Scholar] [CrossRef]
- Lehmann, A.; Overton, J.M.; Leathwick, J.R. GRASP: Generalized regression analysis and spatial prediction. Ecol. Model. 2002, 160, 165–183. [Google Scholar] [CrossRef]
- Jim, C.Y.; Chen, W.Y. Assessing the ecosystem service of air pollutant removal by urban trees in Guangzhou (China). J. Environ. Manag. 2008, 88, 665–676. [Google Scholar] [CrossRef] [PubMed]
- Zhou, Y.; Wu, Y.; Yang, L.; Fu, L.; He, K.; Wang, S.; Hao, J.; Chen, J.; Li, C. The impact of transportation control measures on emission reductions during the 2008 Olympic Games in Beijing, China. Atmos. Environ. 2010, 44, 285–293. [Google Scholar] [CrossRef]
- Tao, L.; Harley, R.A. Changes in fine particulate matter measurement methods and ambient concentrations in California. Atmos. Environ. 2014, 98, 676–684. [Google Scholar] [CrossRef]
- Wang, S.; Li, G.; Gong, Z.; Du, L.; Zhou, Q.; Meng, X.; Xie, S.; Zhou, L. Spatial distribution, seasonal variation and regionalization of PM2.5 concentrations in China. Sci. China Chem. 2015, 58, 1435–1443. [Google Scholar] [CrossRef]
- Przybysz, A.; Saebo, A.; Hanslin, H.M.; Gawronski, S.W. Accumulation of particulate matter and trace elements on vegetation as affected by pollution level, rainfall and the passage of time. Sci. Total Environ. 2014, 481, 360–369. [Google Scholar] [CrossRef] [PubMed]
- Freer-Smith, P.H.; El-Khatib, A.A.; Taylor, G. Capture of particulate pollution by trees: A comparison of species typical of semi-arid areas (Ficus nitida and Eucalyptus globulus) with European and North American species. Water Air Soil Pollut. 2004, 155, 173–187. [Google Scholar] [CrossRef]
- Beckett, K.P.; Freer-Smith, P.H.; Taylor, G. Particulate pollution capture by urban trees: Effect of species and windspeed. Glob. Chang. Biol. 2000, 6, 995–1003. [Google Scholar] [CrossRef]
- Grantz, D.A.; Garner, J.H.B.; Johnson, D.W. Ecological effects of particulate matter. Environ. Int. 2003, 29, 213–239. [Google Scholar] [CrossRef]
- Prusty, B.A.K.; Mishra, P.C.; Azeez, P.A. Dust accumulation and leaf pigment content in vegetation near the national highway at Sambalpur, Orissa, India. Ecotoxicol. Environ. Saf. 2005, 60, 228–235. [Google Scholar] [CrossRef] [PubMed]
- Dawson, J.P.; Adams, P.J.; Pandis, S.N. Sensitivity of PM2.5 to climate in the Eastern US: A modeling case study. Atmos. Chem. Phys. 2007, 7, 4295–4309. [Google Scholar] [CrossRef]
- Nowak, D.J.; Crane, D.E.; Stevens, J.C. Air pollution removal by urban trees and shrubs in the united states. Urban For. Urban Green. 2006, 4, 115–123. [Google Scholar] [CrossRef]
- Huffman, J.A.; Prenni, A.J.; DeMott, P.J.; Poehlker, C.; Mason, R.H.; Robinson, N.H.; Froehlich-Nowoisky, J.; Tobo, Y.; Despres, V.R.; Garcia, E.; et al. High concentrations of biological aerosol particles and ice nuclei during and after rain. Atmos. Chem. Phys. 2013, 13, 6151–6164. [Google Scholar] [CrossRef]
- Liu, X.; Yu, X.; Zhang, Z. PM2.5 concentration differences between various forest types and its correlation with forest structure. Atmosphere 2015, 6, 1801–1815. [Google Scholar] [CrossRef]
- Li, Q. Study on the Reduction Effects of Green Space Landscape Pattern to PM10 Pollution in Wuhan. Master’s Thesis, Huazhong Agricultural University, Wuhan, China, June 2012. [Google Scholar]
- Selmi, W.; Weber, C.; Riviere, E.; Blond, N.; Mehdi, L.; Nowak, D. Air pollution removal by trees in public green spaces in Strasbourg city, France. Urban For. Urban Green. 2016, 17, 192–201. [Google Scholar] [CrossRef] [Green Version]
- Xu, G.; Jiao, L.; Zhao, S.; Yuan, M.; Li, X.; Han, Y.; Zhang, B.; Dong, T. Examining the impacts of land use on air quality from a spatio-temporal perspective in Wuhan, China. Atmosphere 2016, 7, 62. [Google Scholar] [CrossRef]
- Zheng, S.; Zhou, X.; Singh, R.P.; Wu, Y.; Ye, Y.; Wu, C. The spatiotemporal distribution of air pollutants and their relationship with land-use patterns in Hangzhou city, China. Atmosphere 2017, 8, 110. [Google Scholar] [CrossRef]
- Zhao, S.T.; Li, X.Y.; Li, Y.M. The Characteristics of deposition of airborne particulate matters with different size on certain plants. Ecol. Environ. Sci. 2014, 23, 271–276. [Google Scholar]
- Guo, E.G.; Wang, C.; Qie, G.F.; Cai, Y. Influence of typical weather conditions on the airborne particulate matters in urban forests in northern China. China Environ. Sci. 2013, 33, 1185–1198. [Google Scholar]
- Cai, M.; Xin, Z.; Yu, X. Spatio-temporal variations in PM leaf deposition: A meta-analysis. Environ. Pollut. 2017, 231, 207–218. [Google Scholar] [CrossRef] [PubMed]
- Lv, L.Y.; Li, H.Y.; Yang, J.N. The temporal-spatial variation characteristics and influencing factors of absorbing air particulate matters by plants: A review. Chin. J. Ecol. 2016, 35, 524–533. [Google Scholar]
- Zhao, C.X.; Wang, Y.J.; Wang, Y.Q.; Zhang, H.L. Interactions between fine particulate matter (PM2.5) and vegetation: A review. Chin. J. Ecol. 2013, 32, 2203–2210. [Google Scholar]
- Beckett, K.P.; Freer-Smith, P.H.; Taylor, G. Urban woodlands: Their role in reducing the effects of particulate pollution. Environ. Pollut. 1998, 99, 347–360. [Google Scholar] [CrossRef]
- Rissanen, T.; Hyotylainen, T.; Kallio, M.; Kronholm, J.; Kulmala, M.; Rikkola, M.-L. Characterization of organic compounds in aerosol particles from a coniferous forest by GC-MS. Chemosphere 2006, 64, 1185–1195. [Google Scholar] [CrossRef] [PubMed]
- Yang, J.; McBride, J.; Zhou, J.; Sun, Z. The urban forest in Beijing and its role in air pollution reduction. Urban For. Urban Green. 2005, 3, 65–78. [Google Scholar] [CrossRef]
- Salmond, J.A.; Williams, D.E.; Laing, G.; Kingham, S.; Dirks, K.; Longley, I.; Henshaw, G.S. The influence of vegetation on the horizontal and vertical distribution of pollutants in a street canyon. Sci. Total Environ. 2013, 443, 287–298. [Google Scholar] [CrossRef] [PubMed]
- Wania, A.; Bruse, M.; Blond, N.; Weber, C. Analysing the influence of different street vegetation on traffic-induced particle dispersion using microscale simulations. J. Environ. Manag. 2012, 94, 91–101. [Google Scholar] [CrossRef] [PubMed]
Figure 1.
Location of the ten study areas (G1–G10).
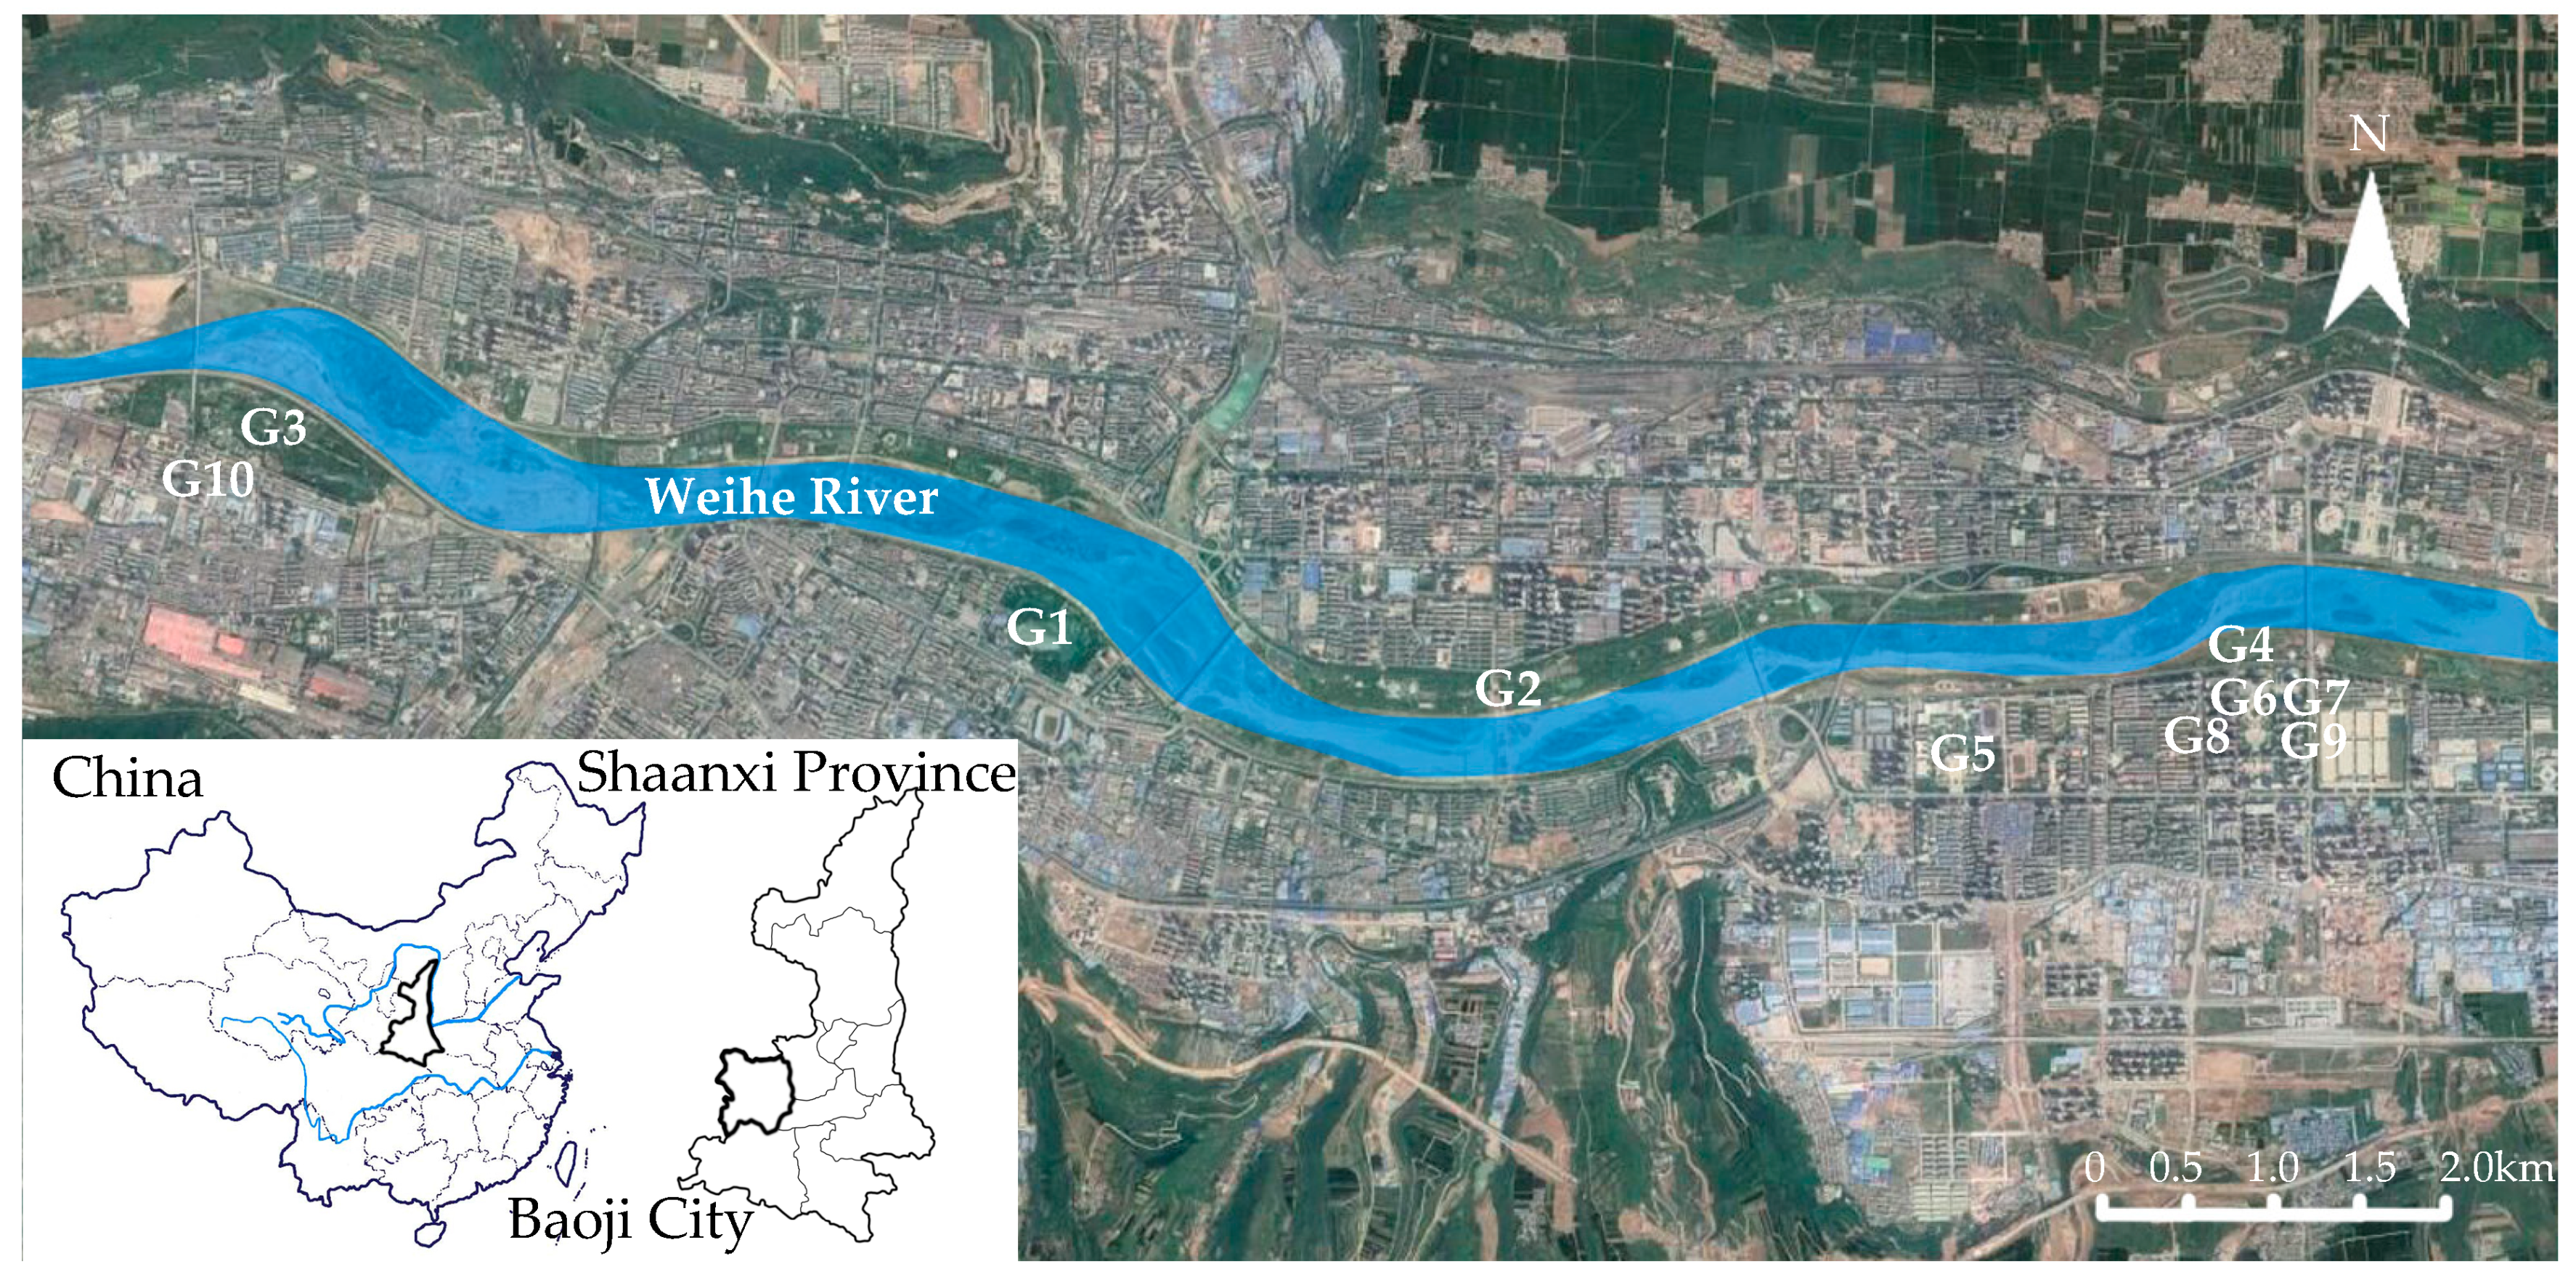
Figure 2.
Distribution of 11 different vegetation structure plots and their repetition.
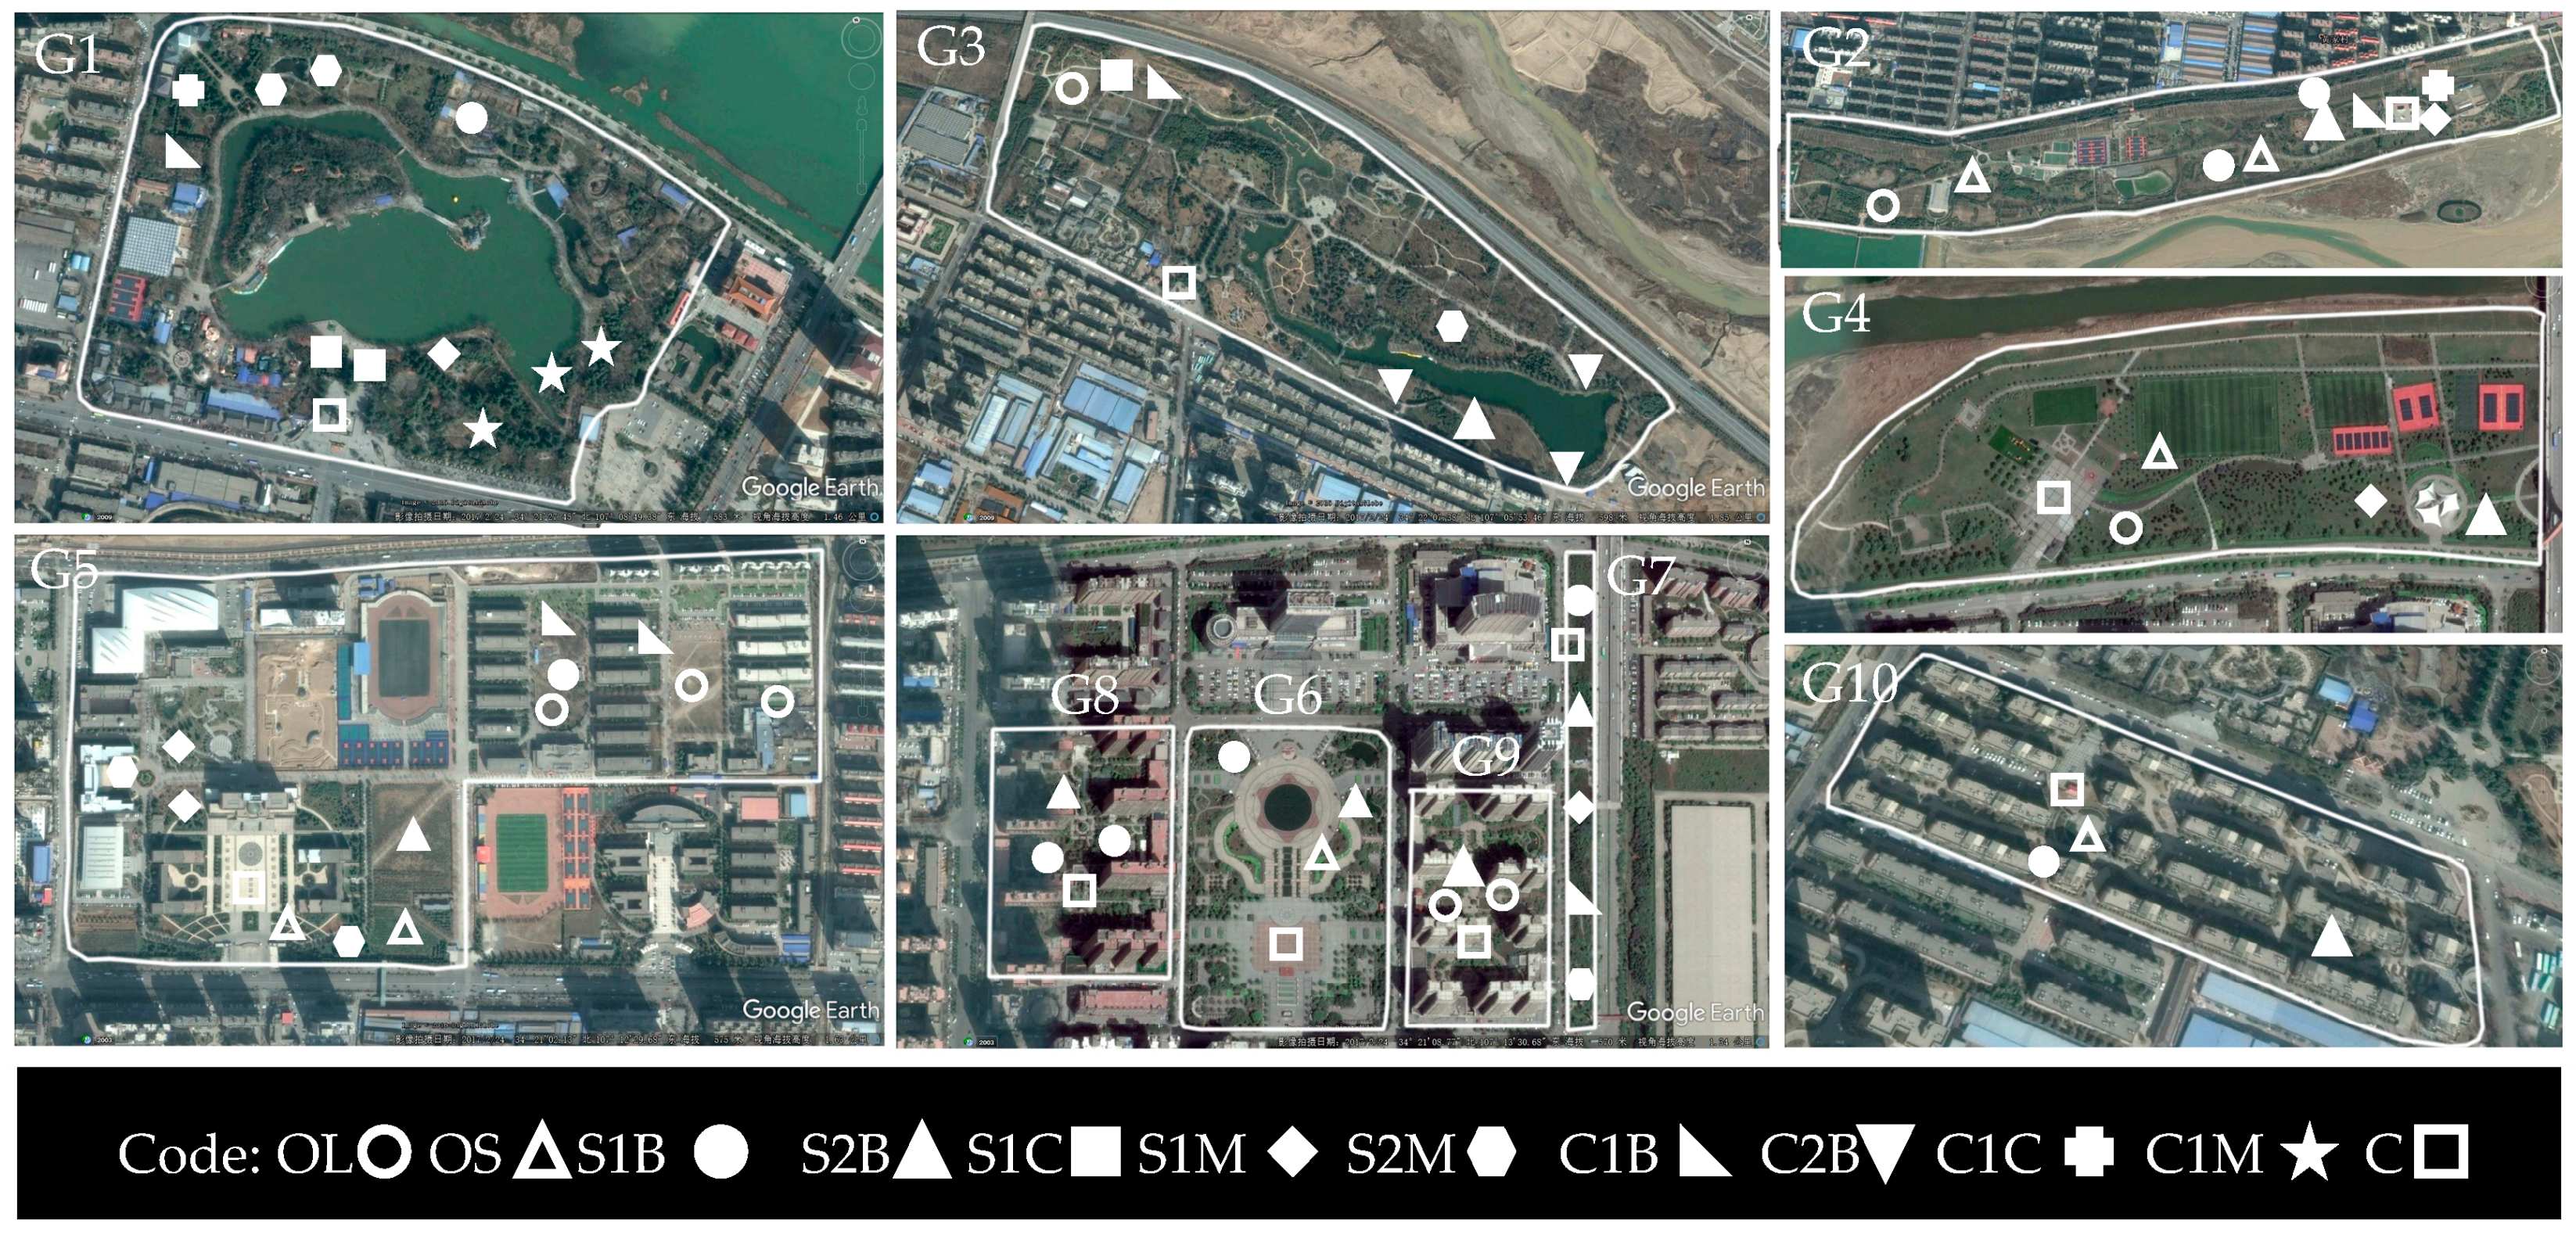
Figure 3.
The relationship between location and PM concentration.

Figure 4.
The relationship between time and PM concentration.

Figure 5.
The relationship between wind velocity (a), temperature (b), humidity (c), area (d) and PM concentration.
Figure 5.
The relationship between wind velocity (a), temperature (b), humidity (c), area (d) and PM concentration.


Table 1.
Green space classification of Baoji City based on a biotope mapping [30].
Table 1.
Green space classification of Baoji City based on a biotope mapping [30].
| Level | Green Space | |||||||||||||||
|---|---|---|---|---|---|---|---|---|---|---|---|---|---|---|---|---|
| Level 1 | Open green space (<10% trees/shrubs) | Semi-closed green space (30%–70% trees/shrubs) | Closed green space (>70% trees/shrubs) | |||||||||||||
| Level 2 | lawn | Shrub | Broadleaved | Coniferous | Mixed | Broadleaved | Coniferous | Mixed | ||||||||
| Level 3 | - | - | 1-layered | >1-layered | 1-layered | >1-layered | ||||||||||
| Code | OL 1 | OS 2 | S1B 3 | S2B 4 | S1C 5 | S1M 6 | S2M 7 | C1B 8 | C2B 9 | C1C 10 | C1M 11 | |||||
1 OL: Open green space dominated with lawn; 2 OS: Open green space dominated with shrubs; 3 S1B: Semi-closed green space of one-layered broad leaved trees; 4 S2B: semi-closed green space of double-layered broad leaved trees; 5 S1C: Semi-closed green space of one-layered coniferous trees; 6 S1M: Semi-closed green space of one-layered mixed trees; 7 S2M: Semi-closed green space of double-layered mixed trees; 8 C1B: Closed green space of one-layered broad leaved trees; 9 C2B: Closed green space of double-layered broad leaved trees; 10 C1C: Closed green space of one-layered coniferous trees; 11 C1M: Closed green space of one-layered mixed trees.
Table 2.
Numbers of 11 different vegetation structure types and hard-pavement control group in 10 study areas.
Table 2.
Numbers of 11 different vegetation structure types and hard-pavement control group in 10 study areas.
| Vegetation Structures | Number of Sampling Plots in Each Study Area | Total | |||||||||
|---|---|---|---|---|---|---|---|---|---|---|---|
| G1 | G2 | G3 | G4 | G5 | G6 | G7 | G8 | G9 | G10 | ||
| OL | 1 | 1 | 1 | 3 | 2 | 8 | |||||
| OS | 2 | 1 | 2 | 1 | 1 | 7 | |||||
| S1B | 1 | 2 | 1 | 1 | 1 | 2 | 1 | 9 | |||
| S2B | 1 | 1 | 1 | 1 | 1 | 1 | 1 | 1 | 1 | 9 | |
| S1C | 2 | 1 | 3 | ||||||||
| S1M | 1 | 1 | 1 | 2 | 1 | 6 | |||||
| S2M | 2 | 1 | 2 | 1 | 6 | ||||||
| C1B | 1 | 1 | 1 | 2 | 1 | 6 | |||||
| C2B | 3 | 3 | |||||||||
| C1C | 1 | 1 | 2 | ||||||||
| C1M | 3 | 3 | |||||||||
| Control Group (C) | 1 | 1 | 1 | 1 | 1 | 1 | 1 | 1 | 1 | 1 | 10 |
| Sum | 12 | 10 | 9 | 5 | 14 | 4 | 6 | 4 | 4 | 4 | 72 |
Table 3.
Analysis of Variance of location, time, wind velocity, temperature, humidity, area and vegetation structure influencing PM concentration.
Table 3.
Analysis of Variance of location, time, wind velocity, temperature, humidity, area and vegetation structure influencing PM concentration.
| PM | Df 1 | PM2.5 | PM10 | |||||||||
|---|---|---|---|---|---|---|---|---|---|---|---|---|
| Factors | Seq SS 2 | Adj SS 3 | Adj MS 4 | F 5 | P 6 | Seq SS 2 | Adj SS 3 | Adj MS 4 | F 5 | P 6 | ||
| Location | 9 | 46.70 | 267.16 | 29.685 | 49.227 | 0.000 | 439.18 | 956.38 | 106.264 | 32.321 | 0.000 | |
| Time | 4 | 384.23 | 31.87 | 7.967 | 13.212 | 0.000 | 1088.55 | 1128.94 | 282.234 | 85.843 | 0.000 | |
| Wind velocity | 1 | 63.87 | 63.87 | 63.868 | 105.914 | 0.000 | 140.70 | 140.70 | 140.703 | 42.795 | 0.000 | |
| Temperature | 1 | 3.84 | 112.82 | 112.825 | 187.098 | 0.000 | 63.00 | 369.94 | 369.939 | 112.518 | 0.000 | |
| Humidity | 1 | 514.45 | 496.89 | 496.888 | 823.996 | 0.000 | 934.76 | 899.86 | 899.863 | 273.697 | 0.000 | |
| Area | 1 | 0.45 | 0.00 | 0.000 | 0.000 | 0.983 | 11.41 | 7.69 | 7.692 | 2.340 | 0.126 | |
| Vegetation structure | 10 | 3.01 | 5.64 | 0.564 | 0.935 | 0.500 | 65.25 | 89.69 | 8.969 | 2.728 | 0.002 | |
1 Df: Degree of freedom; 2 Seq SS: Sequential sum of squares of deviations; 3 Adj SS: Adjusted sum of squares of deviations; 4 Adj MS: Adjusted mean square; 5 F: Variance test volume; 6 P: Significant test of regression equation.
Table 4.
Generalised regression analysis of PM concentration and different study areas.
| PM | PM2.5 | PM10 | |||||||
|---|---|---|---|---|---|---|---|---|---|
| Location | C 1 | SE 2 | T 3 | P 4 | C 1 | SE 2 | T 3 | P 4 | |
| G1 | −0.816 | 0.069 | −11.860 | 0.000 | −1.465 | 0.161 | −9.119 | 0.000 | |
| G2 | −0.205 | 0.052 | −3.972 | 0.000 | −0.498 | 0.121 | −4.124 | 0.000 | |
| G3 | −0.968 | 0.075 | −12.864 | 0.000 | −1.792 | 0.176 | −10.199 | 0.000 | |
| G4 | 0.263 | 0.072 | 3.665 | 0.000 | 0.329 | 0.168 | 1.964 | 0.050 | |
| G5 | 0.226 | 0.051 | 4.437 | 0.000 | 0.220 | 0.119 | 1.847 | 0.065 | |
| G6 | 0.635 | 0.083 | 7.691 | 0.000 | 1.471 | 0.193 | 7.630 | 0.000 | |
| G7 | 0.605 | 0.065 | 9.357 | 0.000 | 1.334 | 0.151 | 8.828 | 0.000 | |
| G8 | 0.492 | 0.085 | 5.775 | 0.000 | 0.683 | 0.199 | 3.430 | 0.001 | |
| G9 | 0.539 | 0.090 | 5.993 | 0.000 | 1.021 | 0.210 | 4.860 | 0.000 | |
| G10 | −0.772 | 0.083 | −9.283 | 0.000 | −1.302 | 0.194 | −6.710 | 0.000 | |
1 C: Coefficient; 2 SE: Coefficient standard error; 3 T: Significant test of regression parameters; 4 P: Significant test of regression equation.
Table 5.
Generalised regression analysis of PM concentration and different time periods.
| PM | PM2.5 | PM10 | |||||||
|---|---|---|---|---|---|---|---|---|---|
| Time | C | SE | T | P | C | SE | T | P | |
| 08:00–10:00 | 0.214 | 0.078 | 2.727 | 0.006 | 0.442 | 0.183 | 2.412 | 0.016 | |
| 10:00–12:00 | 0.230 | 0.038 | 6.017 | 0.000 | 0.101 | 0.089 | 1.132 | 0.258 | |
| 12:00–14:00 | −0.193 | 0.046 | −4.197 | 0.000 | −1.409 | 0.107 | −13.114 | 0.000 | |
| 14:00–16:00 | −0.234 | 0.047 | −4.974 | 0.000 | −0.272 | 0.110 | −2.475 | 0.013 | |
| 16:00–18:00 | −0.016 | 0.044 | −0.374 | 0.708 | 1.139 | 0.102 | 11.149 | 0.000 | |
Table 6.
Generalised regression analysis of PM concentration and vegetation structure.
| PM | PM2.5 | PM10 | |||||||
|---|---|---|---|---|---|---|---|---|---|
| Vegetation Structure | C | SE | T | P | C | SE | T | P | |
| OL | −0.062 | 0.059 | −1.054 | 0.292 | −0.318 | 0.138 | −2.297 | 0.022 | |
| OS | −0.115 | 0.061 | −1.884 | 0.060 | −0.444 | 0.143 | −3.106 | 0.002 | |
| S1B | 0.037 | 0.056 | 0.669 | 0.504 | −0.144 | 0.130 | −1.105 | 0.270 | |
| S2B | −0.062 | 0.056 | −1.113 | 0.266 | 0.053 | 0.130 | 0.403 | 0.687 | |
| S1C | −0.050 | 0.084 | −0.597 | 0.551 | −0.256 | 0.196 | −1.309 | 0.191 | |
| S1M | −0.011 | 0.060 | −0.186 | 0.853 | −0.133 | 0.139 | −0.954 | 0.340 | |
| S2M | −0.002 | 0.058 | −0.034 | 0.973 | 0.155 | 0.136 | 1.143 | 0.253 | |
| C1B | 0.016 | 0.058 | 0.271 | 0.786 | −0.049 | 0.135 | −0.363 | 0.716 | |
| C2B | −0.012 | 0.098 | −0.121 | 0.904 | 0.685 | 0.228 | 3.007 | 0.003 | |
| C1C | 0.183 | 0.098 | 1.868 | 0.062 | 0.246 | 0.228 | 1.080 | 0.280 | |
| C1M | 0.079 | 0.091 | 0.869 | 0.385 | 0.205 | 0.213 | 0.959 | 0.338 | |
© 2018 by the authors. Licensee MDPI, Basel, Switzerland. This article is an open access article distributed under the terms and conditions of the Creative Commons Attribution (CC BY) license (http://creativecommons.org/licenses/by/4.0/).
Share and Cite
MDPI and ACS Style
Qiu, L.; Liu, F.; Zhang, X.; Gao, T. The Reducing Effect of Green Spaces with Different Vegetation Structure on Atmospheric Particulate Matter Concentration in BaoJi City, China. Atmosphere 2018, 9, 332. https://doi.org/10.3390/atmos9090332
AMA Style
Qiu L, Liu F, Zhang X, Gao T. The Reducing Effect of Green Spaces with Different Vegetation Structure on Atmospheric Particulate Matter Concentration in BaoJi City, China. Atmosphere. 2018; 9(9):332. https://doi.org/10.3390/atmos9090332
Chicago/Turabian StyleQiu, Ling, Fang Liu, Xiang Zhang, and Tian Gao. 2018. "The Reducing Effect of Green Spaces with Different Vegetation Structure on Atmospheric Particulate Matter Concentration in BaoJi City, China" Atmosphere 9, no. 9: 332. https://doi.org/10.3390/atmos9090332
Note that from the first issue of 2016, this journal uses article numbers instead of page numbers. See further details here.