Article

Effects of Northern Hemisphere Atmospheric Blocking on Arctic Sea Ice Decline in Winter at Weekly Time Scales

Key Laboratory of Regional Climate-Environment for Temperate East Asia, Institute of Atmospheric Physics, Chinese Academy of Sciences, Beijing 100029, China
*
Author to whom correspondence should be addressed.
Atmosphere 2018, 9(9), 331; https://doi.org/10.3390/atmos9090331
Submission received: 30 July 2018 / Revised: 17 August 2018 / Accepted: 21 August 2018 / Published: 22 August 2018
(This article belongs to the Special Issue Atmospheric Processes Shaping Arctic Climate)

Abstract

:
In this study, the effects of the Northern Hemisphere atmospheric blocking circulation on Arctic sea ice decline at weekly time scales are examined by defining four key regions based on observational data analysis. Given the regression analysis, the frequently occurring atmospheric patterns related to the sea ice decline in four key sea regions (Baffin Bay, Barents-Kara Seas, Okhotsk Sea and Bering Sea) are found to be Greenland blocking (GB), Ural blocking (UB), western Pacific blocking (PB-W) and eastern Pacific blocking (PB-E), respectively. The results show that the regional blocking frequency is higher (lower) in lower (higher) sea ice winters for each key region. Moreover, composite analysis indicates that blocking evolution is usually accompanied by significant sea ice decline at weekly time scales during the blocking life cycle for each key region. In addition, the intensified surface downward infrared radiation (IR) anomaly and the precipitable water for the entire atmosphere (PWA) in each key region are found to make significant contributions to the positive surface air temperature (SAT) anomaly, which is beneficial for the reduction in sea ice. The approximate quantitative analysis of different surface energy fluxes induced by blocking is also applied. Further analysis shows that the blocking event and the associated changes in SAT and radiation anomalies for each key region lead the sea ice decline by approximately 3~6 days. This result indicates that regional blocking can contribute to regional sea ice decline at weekly time scales through surface warming associated with enhanced water vapor and associated IR variations. Further quantitative estimates indicate that regional blocking can reduce regional sea ice cover (SIC) by 49.6%, 49.4%, 52.2% and 49.5% for Baffin Bay, Barents-Kara Seas, Okhotsk Sea and Bering Sea, respectively, during the blocking life cycle. Finally, a physical process diagrammatic sketch is given to illustrate how blocking affects SIC decline.

1. Introduction

The Arctic amplification has attracted many researchers in recent decades [1,2,3,4] and the direct effect of the Arctic amplification is Arctic warming and the rapid melting of Arctic sea ice in all seasons [5,6]. Although the Arctic sea ice cover (SIC) is the least in late September, the significant decrease in winter sea ice and the more frequent extreme cold weather in mid-latitudes in winter make it necessary to focus on the winter Arctic SIC change and associated processes [7,8,9]. Recently, many studies have addressed the mechanism of SIC change in winter [10,11]. The roles of radiation and sensible heat [8,12], moisture transport [13,14], wind-driven sea ice drifting [15,16] and other factors [17] have been examined in many previous studies.
Changes in Arctic SIC occur on multiple temporal and spatial scales [18]. The Arctic sea ice has interdecadal, interannual and interseasonal variabilities. In addition, for different regions, the physical mechanism of SIC decline may be different as proposed by Luo et al. [18]. Many studies have indicated that the atmospheric circulations (blockings) make important contributions to the SIC decline [7,19,20], especially at weekly time scales in winter [8,18,21]. As one of the most important atmospheric processes [22,23], blocking and its role in the SIC decline over the Barents and Kara Seas have been discussed recently, including blocking-induced moisture transport [14], temperature advection [21] and radiation [8]. However, for different key sea regions, as shown in Figure 1a, the role of regional blocking in the regional SIC decline is unclear and needs to be further clarified. At weekly time scales especially, the physical processes by which regional blocking affects SIC variation still need to be addressed. The goals of this study are to examine how the regional blocking circulations affect the regional SIC declines at weekly time scales and to determine the physical processes involved.
This paper is organized as follows: In Section 2, the dataset and method used in this study are introduced. In Section 3, according to the linear trend pattern for the winter SIC across the whole Arctic from 1979–2016, four key sea regions of SIC change are chosen. Regression analyses of the winter (DJF) 500-hPa geopotential height (HGT) and surface air temperature (SAT) anomalies with the time series of the regional averaged SIC further indicate that the sea ice change is closely linked with the regional blocking circulation. In Section 4, composites of the blocking frequency are shown according to the higher and lower sea ice winters to demonstrate the effect of blocking on SIC. In Section 5, composites of four types of regional blocking events are applied to indicate the role of regional blocking on regional SIC decline at weekly time scales. The results and discussion are presented in Section 6.

2. Data and Methodology

The data set used in this study is taken from the European Centre for Medium-Range Weather Forecasts (ECMWF) Re-Analysis (ERA-Interim) data [24], including the 500-hPa HGT fields, SAT, SIC, surface downward infrared radiation (IR), surface sensible and latent heat flux (SLH) and precipitable water for the entire atmosphere (PWA), on a 2.5° × 2.5° grid from December 1979 to February 2017. All the anomaly fields are calculated as the deviation from their long-term (1979–2016) climatology mean for each day of DJF, so that the seasonal cycle can be removed according to [21,25].
The blocking index used here is the one-dimensional index based on examining the meridional gradient reversal of the 500-hPa HGT designed by Tibaldi and Molteni [26] (hereafter TM index). The calculation of the TM index can be described as follows:
GHGS = ( Z ( ϕ 0 ) Z ( ϕ s ) ϕ 0 ϕ s )
GHGN = ( Z ( ϕ n ) Z ( ϕ 0 ) ϕ n ϕ 0 )
GHGS > 0   m · ( deglat ) 1
GHGN < 10   m · ( deglat ) 1
where GHGS (GHGN) denotes the 500-hPa HGT gradient for each given longitude in lower (higher) latitude regions. Z represents the HGT at a certain longitude ( ϕ ), in which ϕ n , ϕ 0 and ϕ s represent high, middle and low latitudes, respectively. Among these, ϕ n = 80 ° N + Δ , ϕ o = 60 ° N + Δ , ϕ s = 40 ° N + Δ . In addition, ∆ = −5°, 0°, 5° are used here due to the data horizontal resolution (2.5° × 2.5°) we used. A single blocking event is defined to have occurred if the above criteria are satisfied for at least three consecutive days within a certain region. Meanwhile, the blocking cycle and intensity (GHGS) can also be identified according to the index. In our study, the applied TM index covers five different regions from the North Atlantic to the North Pacific, which are Greenland: 90° W to 30° W, Greenland Sea: 0°–30° E, Ural Mountains: 30°–90° E, western Pacific: 120° E–180° and eastern Pacific: 180°–120° W. The blocking positive center must be limited to within each region on the peak (lag 0) day to ensure that the main body of the blocking is inside each region.
In this study, the lag 0 day is defined as the day with maximum amplitude for a blocking event, while the lag −n (lag n) day means the nth day before (after) the lag 0 day; this notation has been applied in previous studies [21,27]. The composite analysis used in this study is based on the life cycle of each blocking event. To capture the main processes and features of each blocking event, composite analysis should be carried out according to a primary criterion (lag 0). For a single blocking event, the day with the maximum amplitude (lag 0) is usually accompanied by dramatic changes such as temperature and meridional wind anomalies. Therefore, our composite analysis is applied by using the lag 0 day as the benchmark for each individual event, which can show the common characteristics of the evolution of the blocking life cycle and highlight the characteristics of the peak period during the blocking life cycle.

3. Key Regions of Arctic Sea Ice and Corresponding Atmospheric Patterns

3.1. Arctic Sea Ice Decline and Its Mixed Atmospheric Patterns

The distribution of the Arctic winter SIC linear trend from 1979 to 2016 is shown in Figure 1a. Clearly, almost the entire Arctic SIC shows a distinct (stippled regions above the 95% confidence level) downward linear trend (Figure 1a), while the degree of the trend varies from region to region. Figure 1b shows the regression pattern of the DJF HGT and SAT anomalies against the averaged DJF Arctic SIC time series. As seen from Figure 1b, in the Northern Hemisphere, there is a wide range positive HGT anomaly in the middle and high latitudes, similar to the coupled modes of multiple positive anomaly centers as indicated in Yao et al. [21]. Almost the entire Arctic region exhibits a notable (stippled regions above the 95% confidence level) positive SAT anomaly. According to previous studies [18,21], the changes in Arctic SIC involve complicated and combined processes including oceanic and atmospheric impacts. The physical processes involved in SIC changes in different regions are completely different. The atmospheric pattern corresponds to the SIC change in the five key regions is worth discussing in the following.
According to the spatial distribution of the downward linear trend, the whole Arctic SIC region can be divided into five key regions (Baffin Bay, Greenland Sea, Barents-Kara Seas, Okhotsk Sea and Bering Sea), as shown in Figure 1a. Three regions are located in the North Atlantic, which are Baffin Bay (90°–50° W, 50°–80° N), Greenland Sea (17.5° W–0°, 67.5°–80° N) and Barents-Kara Seas (10°–85° E; 70°–85° N). The two remaining regions are located in the North Pacific, which are Okhotsk Sea (137.5°–157.5° E; 42.5°–60° N) and Bering Sea (175°–195° E; 55°–75° N). The five key regions all exhibit a clear downward linear trend, as shown in Figure 1a, which means that SIC changes are significant in the five regions. However, in this study, we do not intend to focus on the interdecadal linear trend in Arctic sea ice but rather on the possible link between the sea ice variabilities in each key region and the regional atmospheric circulation, especially at the weekly time scale (life cycle of blocking). Since the SIC changes in the five key regions are significant, the next step is to determine what kind of atmospheric patterns the sea ice changes in each region correspond to.

3.2. Four Key Regions for Arctic Sea Ice and Corresponding Blocking Patterns

Five regional mean winter SIC time series (key regions Baffin Bay, Greenland Sea, Barents-Kara Seas, Okhotsk Sea and Bering Sea) can be obtained by averaging the SIC within each region. Regression maps of the DJF HGT and SAT anomalies with the time series of the DJF SIC in each region are shown in Figure 2a–e. Note that all the data was detrended prior to the regression calculation so that the resulting pattern would exclude the effects of linear trends. The results show that the atmospheric circulation patterns corresponding to the five SIC time series are all dipole-like modes, which is the classic atmospheric blocking circulation for each key region (Figure 2). Specifically, for region Baffin Bay, a clear Greenland blocking (GB) pattern can be seen over Greenland and Baffin Bay (Figure 2a), while a marked positive SAT anomaly can be observed over region Baffin Bay and a notable negative SAT anomaly can be seen over Europe (Figure 2a). The SAT anomaly above the 95% confidence level is stippled. Regions Greenland Sea (Figure 2b) and Barents-Kara Seas (Figure 2c) show similar atmospheric patterns, which can be defined as Ural blocking (UB) according to their geographical location. Positive SAT anomalies accompanied by positive HGT anomalies can be seen across regions Greenland Sea and Barents-Kara Seas, as shown in Figure 2b and c, which could accelerate the melting of SIC in each region. Meanwhile, in the upstream area, a weak positive North Atlantic oscillation (NAO) pattern can be observed over the North Atlantic in Figure 2b,c, where the NAO signal in Figure 2b is slightly stronger. This result is consistent with those of previous studies [18,21] that the occurrence of the UB is usually accompanied by the emergence of the positive NAO phase. In addition, the correlation coefficient for the SIC time series in regions Greenland Sea and Barents-Kara Seas is 0.48 (0.37 for the detrended data), which means that the SIC time series in Greenland Sea and Barents-Kara Seas exhibit similar (above the 95% confidence level) interannual variations. Since the atmospheric patterns corresponding to regions Greenland Sea and Barents-Kara Seas are very similar and the geographical locations of Greenland Sea and Barents-Kara Seas are very close, the two regions are merged into a single region and unified as the Barents-Kara Seas in the following analysis. Thus, the key regions are Baffin Bay, Barents-Kara Seas, Okhotsk Sea and Bering Sea. For region Okhotsk Sea, as shown in Figure 2d, a notable dipole mode can be seen over the western Pacific region, which can be called Pacific blocking (PB). A clear positive SAT anomaly center can be seen in region Okhotsk Sea (Figure 2d) which may favor the decline of SIC within region Okhotsk Sea. For region Bering Sea in Figure 2e, a similar PB pattern can be seen over the Pacific region but this pattern has a northward and more concentrated positive center contrast with Figure 2d. A notable positive SAT anomaly center can be seen over region Bering Sea, which has an important impact on the melting of SIC in region Bering Sea. Notably, although the patterns in Figure 2d,e are both PB, their positions and shapes are different. The positive anomaly center in Figure 2d is wider than that in Figure 2e and slightly lower in latitude.
To summarize the results, the DJF SIC changes in each region may be closely related to the atmospheric blocking in the local area because the blocking circulation usually causes the SAT to rise in the high-latitude areas, as shown in Figure 2 and according to previous studies [8,21,27]. The pattern in Figure 1b now looks more like a combination of the blocking pattern in each region (Figure 2). Therefore, dividing the Arctic SIC into different key regions and studying their variations separately are necessary because their corresponding physical processes are very different; thus, using this division is better than studying the Arctic sea ice as a whole [28]. The patterns in Figure 2 indicate that the blockings have close connections with the SIC changes in each region, without the interference of the linear trend. Therefore, as noted earlier, the focus of this paper is on the relationship between blocking and sea ice change, rather than on the long-term climatic linear trend in SIC.

4. The Northern Hemisphere Blocking Frequency and Its Link with SIC

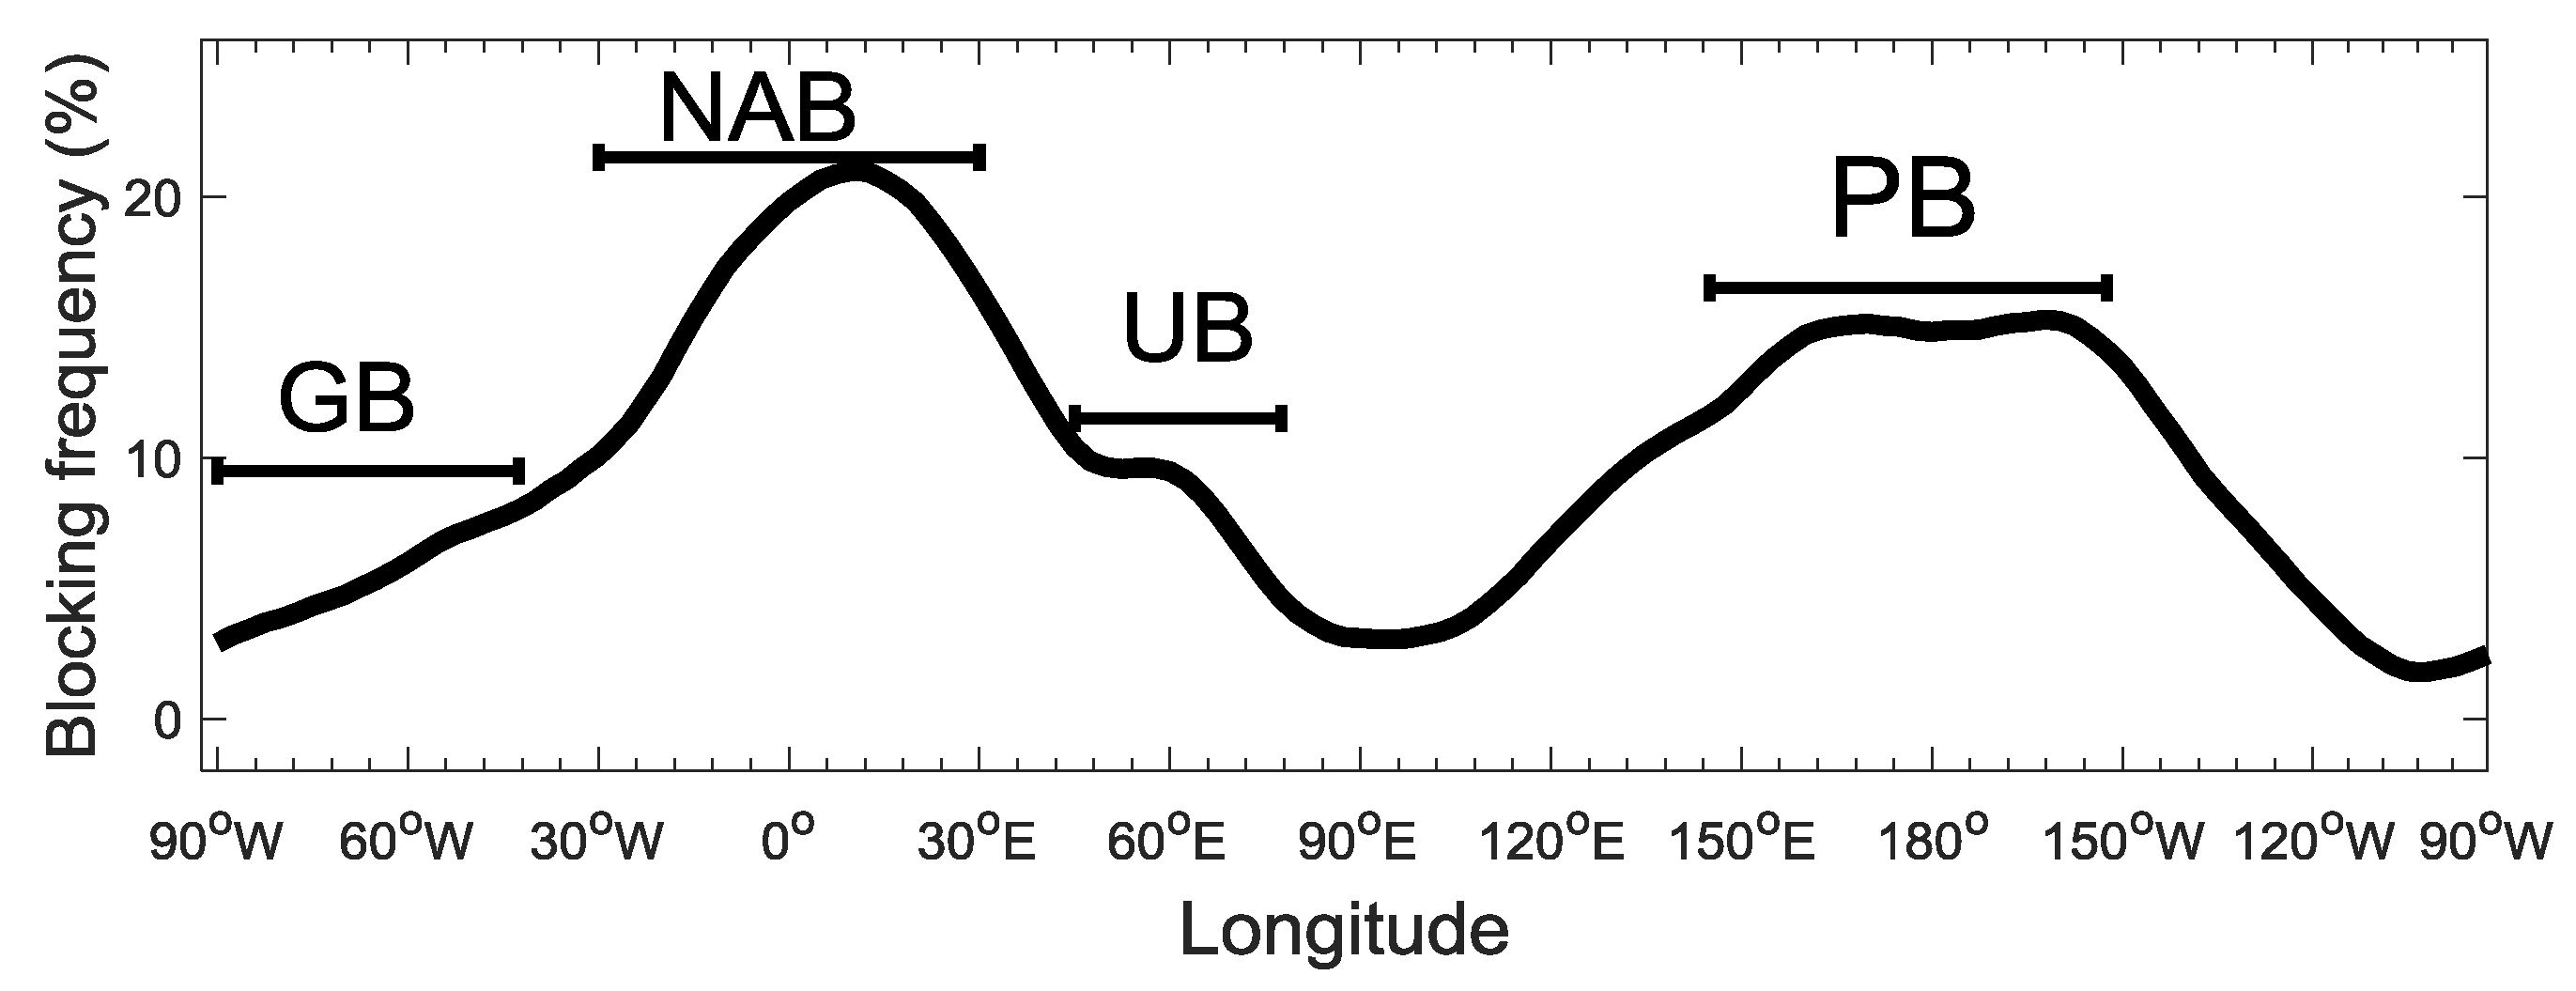
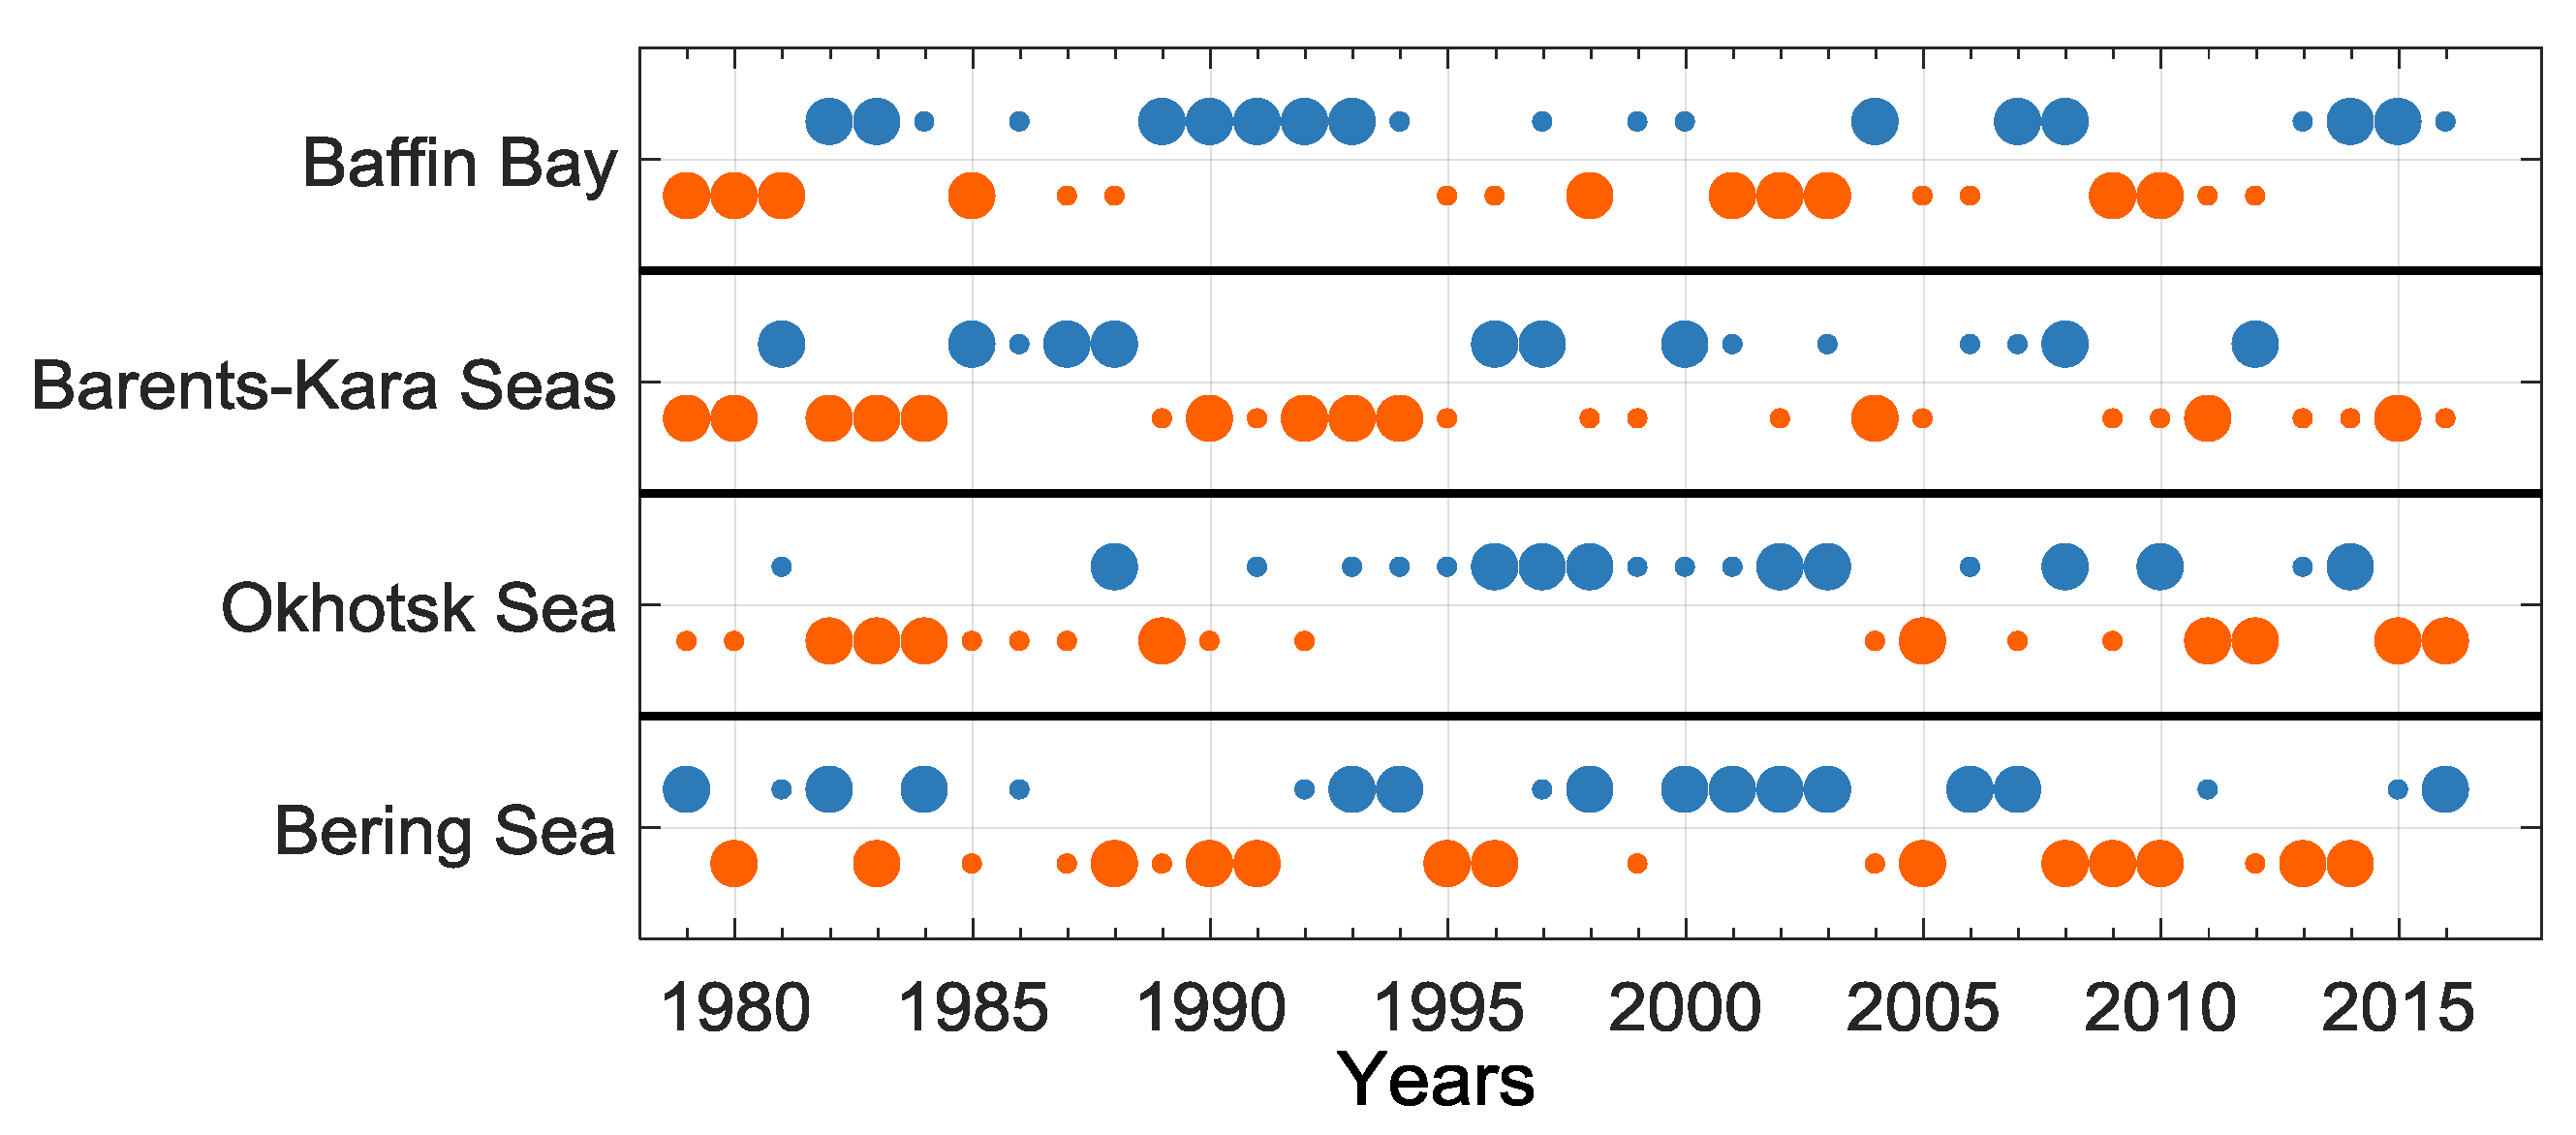
Since the regional blocking circulation in the Northern Hemisphere has a close link with the Arctic SIC changes in local areas, it is necessary to examine the blocking frequency distribution along entire latitudes by using the TM index as noted in Section 2. As shown in Figure 3, the blocking frequency exhibits three peaks over the North Atlantic, the Ural Mountains and the Pacific region, corresponding to North Atlantic blocking (NAB) (Figure 2a), UB (Figure 2b,c) and PB (Figure 2d,e), respectively. However, the Greenland blocking (Figure 2a) is not found to show a very high (a significant peak) frequency near 60° W in Figure 3. The NAB pattern cannot be observed according to the regression patterns in Figure 2, although the frequency of NAB is the highest (Figure 3). This result means that not only the frequency of blocking but also the location of blocking and other factors may affect the variations in sea ice. To further verify the linkage between SIC and blocking frequency, the winters with higher and lower SIC in each key region are selected by averaging the SIC within each key region (Baffin Bay, Barents-Kara Seas, Okhotsk Sea and Bering Sea). In order to remove the effects of long-term climate trends, the linear trends of all the SIC time series are removed. As shown in Figure 4, the larger (smaller) blue circles indicate winters with SIC greater than 0.5 (0) standard deviation, while the larger (smaller) orange circles indicate winter with SIC less than −0.5 (0) standard deviation. Figure 4 illustrates that the higher (lower) SIC winters vary from region to region (Baffin Bay, Barents-Kara Seas, Okhotsk Sea and Bering Sea). However, the decadal variations in regions Barents-Kara Seas, Okhotsk Sea and Bering Sea are similar, with more low-SIC winters during 1979–1995 and 2005–2016 and more high-SIC winters during 1996–2005 (Figure 4).
According to the high SIC winters and low SIC winters in each key region (Figure 4), the composites of the blocking frequency over the Northern Hemisphere are shown in Figure 5. In Figure 5a, the solid (dotted) line represents the composite of the blocking frequency for high (low) SIC winters for region Baffin Bay. Similarly, Figure 5b–d represent the composites for regions Barents-Kara Seas, Okhotsk Sea and Bering Sea. Figure 5a shows that the difference in the blocking frequency between high and low SIC winters for region Baffin Bay from 90° W to 30° W (orange line tagging) is significant (above the 95% confidence level based on a Monte Carlo test). The blocking that occurs from 90° W to 30° W is GB, as shown in Figure 2a. In addition, for region Barents-Kara Seas (Figure 5b), the difference in the blocking frequency between high and low SIC winters from 30° E to 90° E (orange line tagging) is clear (above the 95% confidence level based on a Monte Carlo test), which may correspond to UB, as shown in Figure 2b. For regions Okhotsk Sea (Figure 5c) and Bering Sea (Figure 5d), the difference in the blocking frequency over the Pacific (120° E to 150° W for region Okhotsk Sea and 150° E to 150° W for region Bering Sea) between high and low SIC winters is evident. In addition, the area with significant difference in Figure 5c is wider than that in Figure 5d. This result is consistent with the pattern shown in Figure 2d,e, where the PB pattern in Figure 2d is wider than in Figure 2e. Since the positive center in Figure 2d is more westerly than that in Figure 2e, the PB in Figure 2d and Figure 5c (Figure 2e and Figure 5d) is called the western (eastern) PB or PB-W for short (PB-E). Moreover, it should be pointed out that in each SIC region, the difference in the blocking frequency may occur outside the corresponding region. For example, in Figure 5b, the difference in blocking frequency occurs not only in region Barents-Kara Seas but also in the Pacific region. This difference occurs because for a winter, there may be anomalous SIC in more than one region, which makes the winters of anomalous SIC overlap in each region. However, our results do show that there is a close relationship between the blocking circulation in each region and the changes in the local SIC.

5. Composite of the Blocking Events and Its Impacts on SIC

5.1. Composite of Regional Blocking Patterns and Sea Ice Decline at Weekly Time Scales

As noted above, our study here does not focus on changes in the long-term climate trends of SIC and blocking but rather attempts to analyze the relationship between blocking and SIC on a synoptic scale (blocking life cycle). According to the TM index, each blocking event in each region is identified following the method described in Section 2. As shown in Table 1, the case numbers, frequency (days), mean duration and strength of the blocking events in each region can be obtained. The case (day) numbers for GB, UB, PB-W and PB-E are 55 (252), 56 (278), 43 (167) and 90 (419), respectively. Of these, eastern Pacific has the largest frequency of blocking contrast with the other key regions. The mean duration and strength of blockings in each region have their own characteristics, which are different from each other. However, this study does not emphasize the number of days, periods and intensity of blockings, so no detailed analysis of Table 1 is made here.
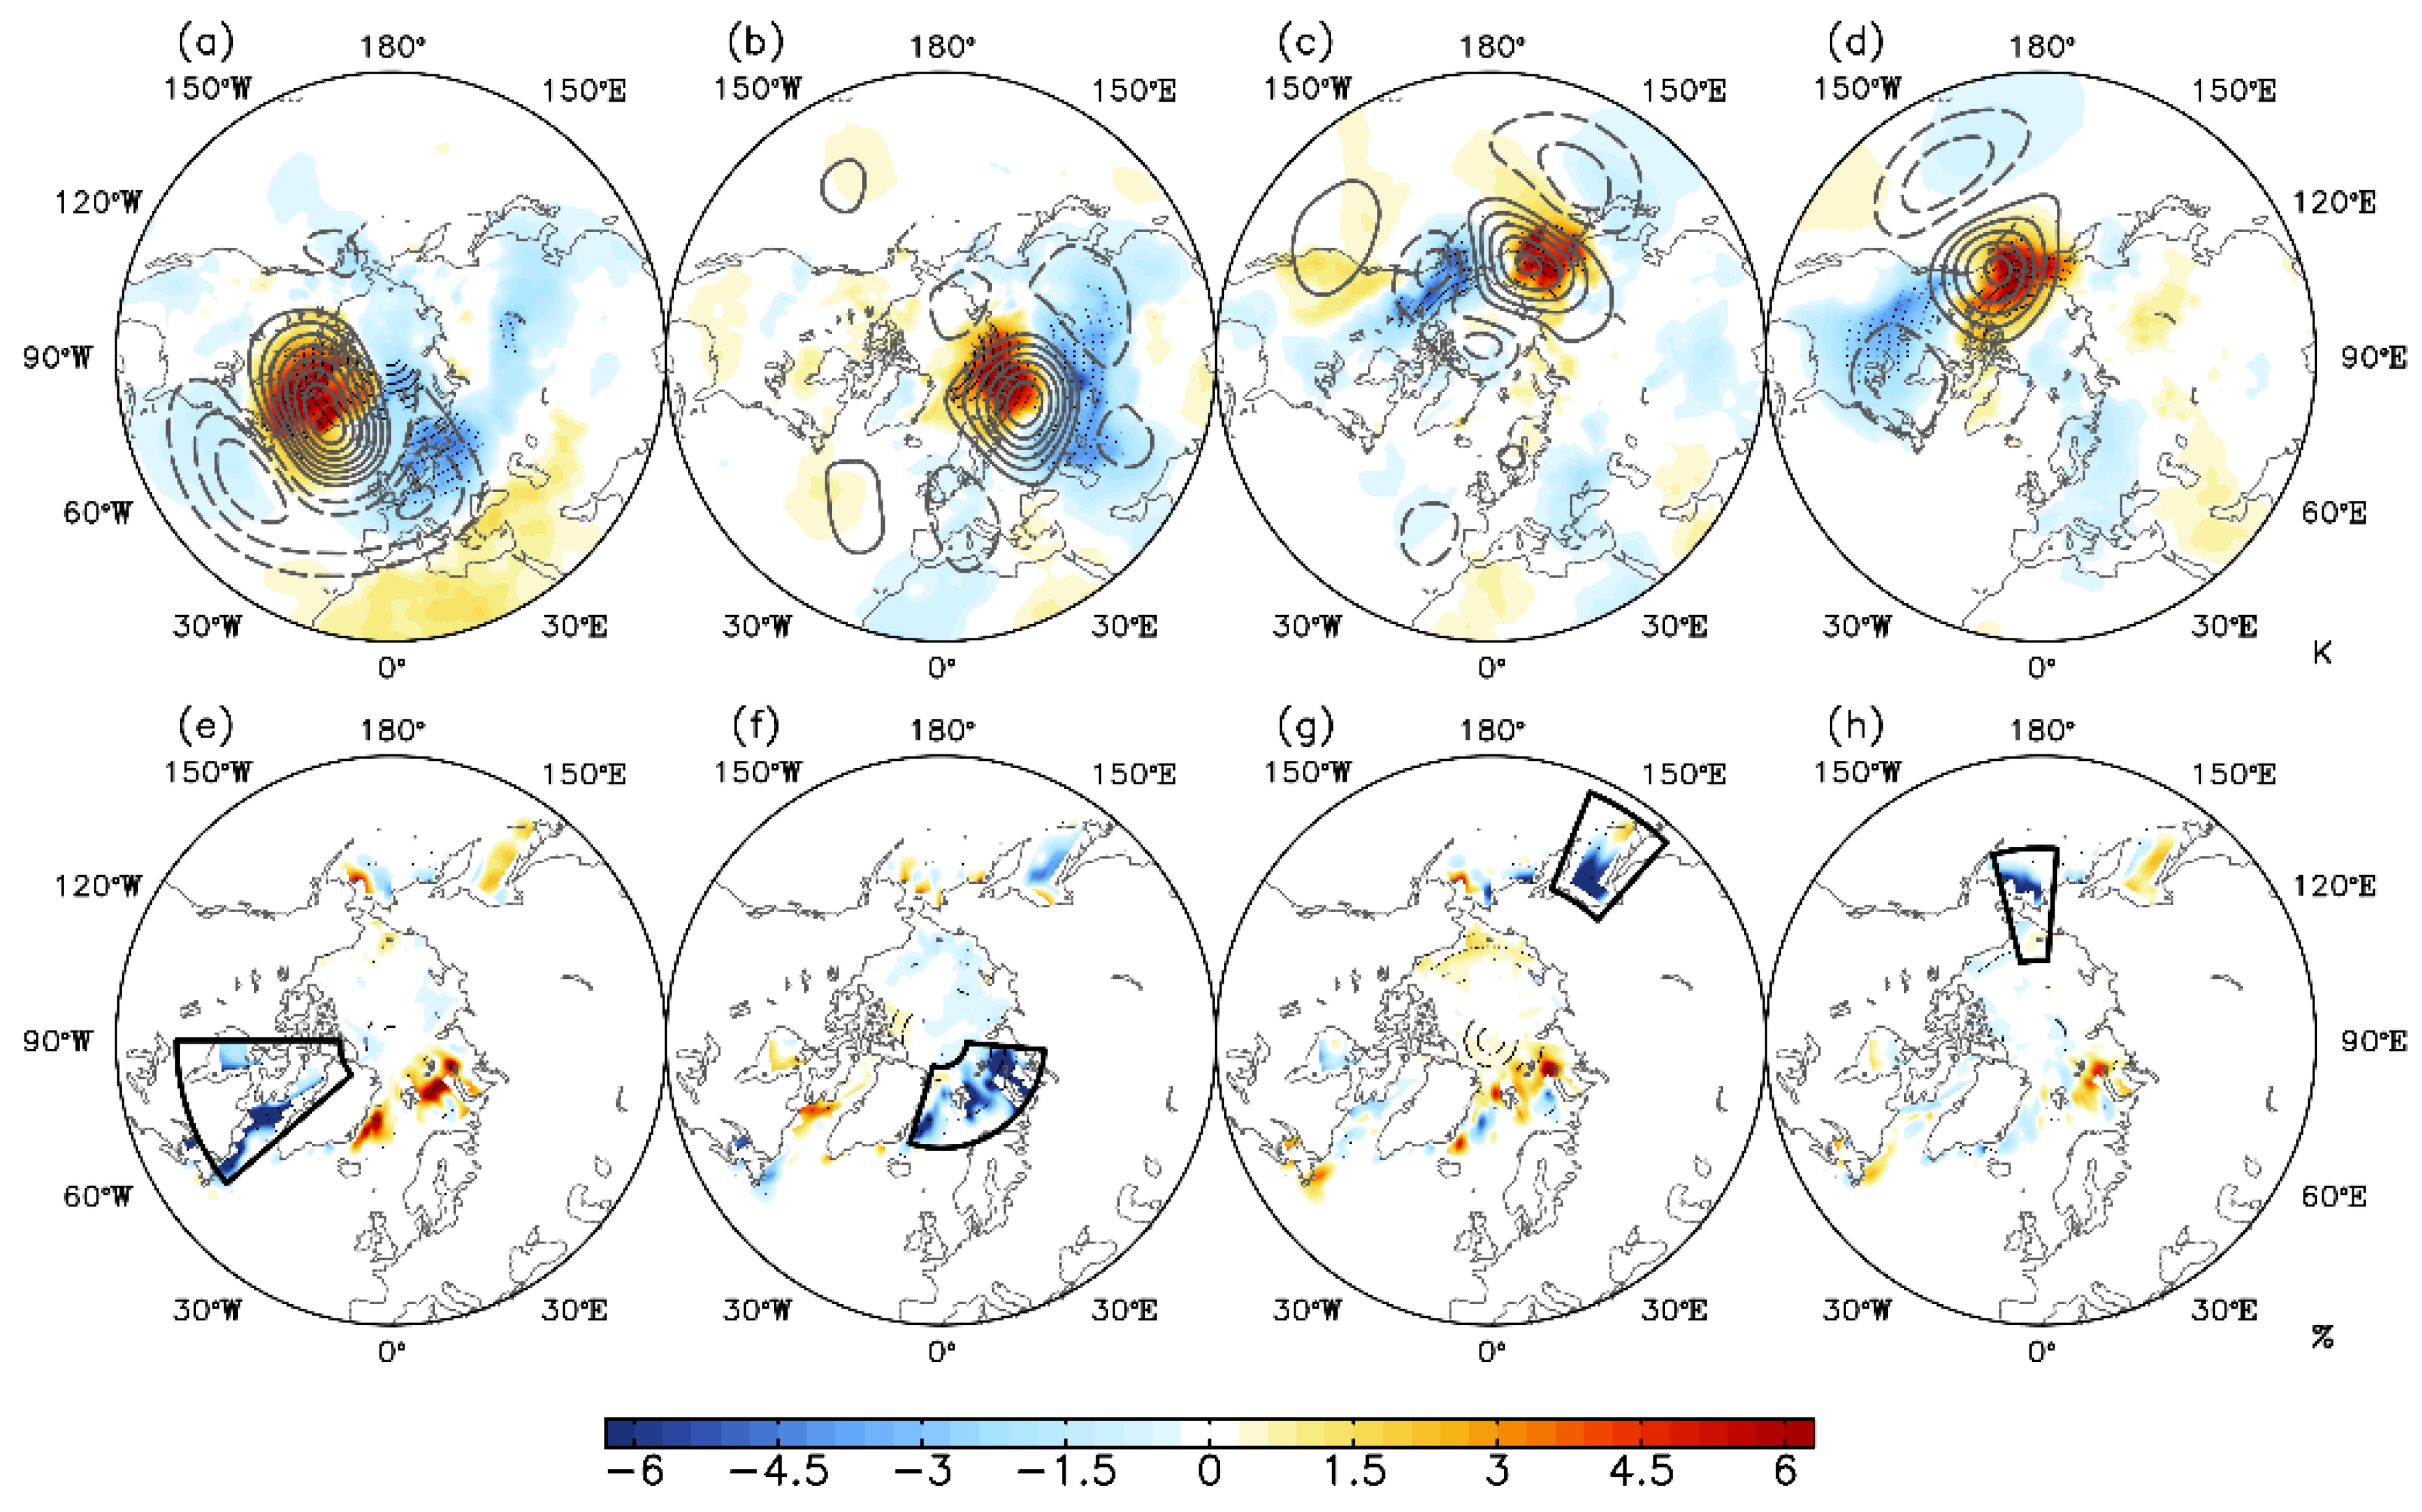
According to the blocking events identified in Table 1 and the composite criterion mentioned in Section 2, composite analysis is applied in the following. Figure 6a–d show the composites of the HGT and SAT anomalies during lag −2 to lag 2 of the blocking life cycle in each blocking region. The HGT dipole modes in four blocking regions are clearly seen, which are GB, UB, PB-W and PB-E, respectively. The positive SAT anomaly mainly located over Baffin Bay and the accompanying negative SAT anomaly downstream from the blocking ridge (stippled regions above the 95% confidence level) are shown in Figure 6a. The positive SAT anomalies in Figure 6b, c and d are mainly located in regions Barents-Kara Seas, Okhotsk Sea and Bering Sea, respectively. These results mean that the SAT increase over each SIC key region is clear during the blocking life cycle, which may affect the changes in SIC. To examine the changes in SIC, the composite SIC anomalies during lag −2 to lag 2 of the blocking life cycle are shown in Figure 6e–h. The negative SIC anomalies within each SIC key region in Figure 6e–h are evident (stippled regions above the 95% confidence level). These results indicate that the negative SIC anomaly is significantly affected by the blocking during the life cycle from lag −2 to lag 2. The positive SAT anomalies in each SIC key region in Figure 6a–d may contribute significantly to the negative SIC anomalies shown in Figure 6e–h.

5.2. Composite of Variables Associated with Blocking

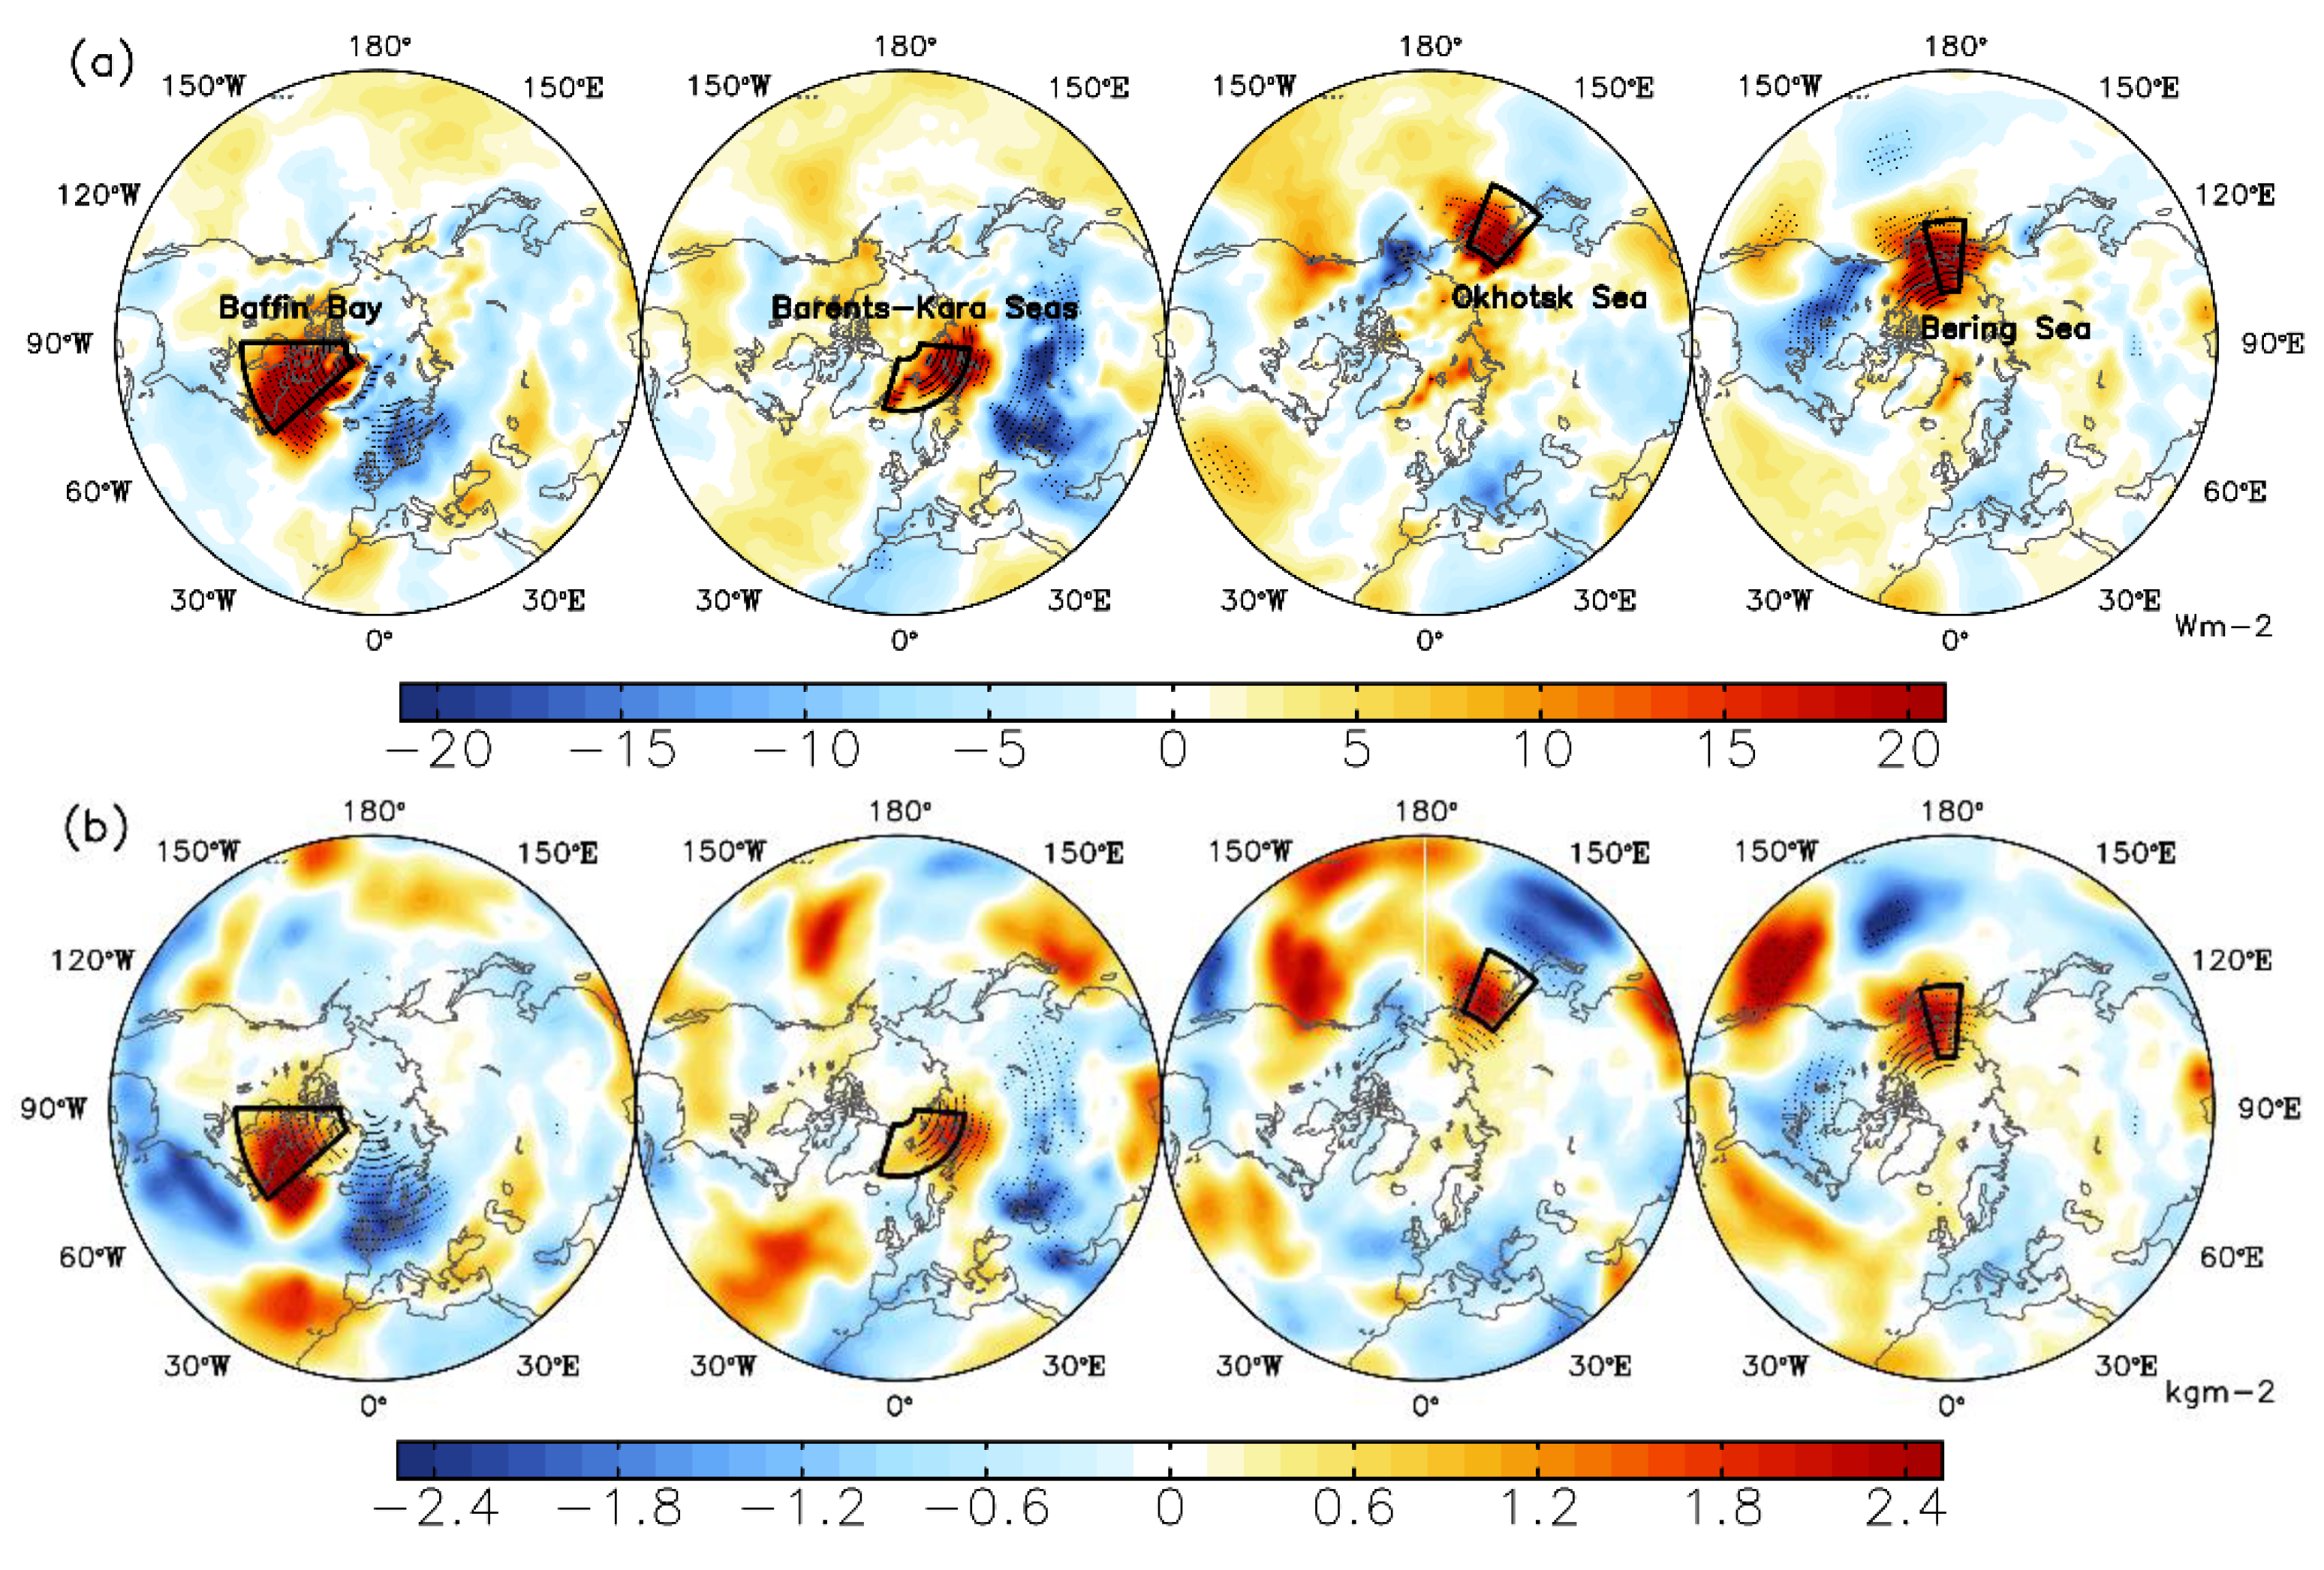
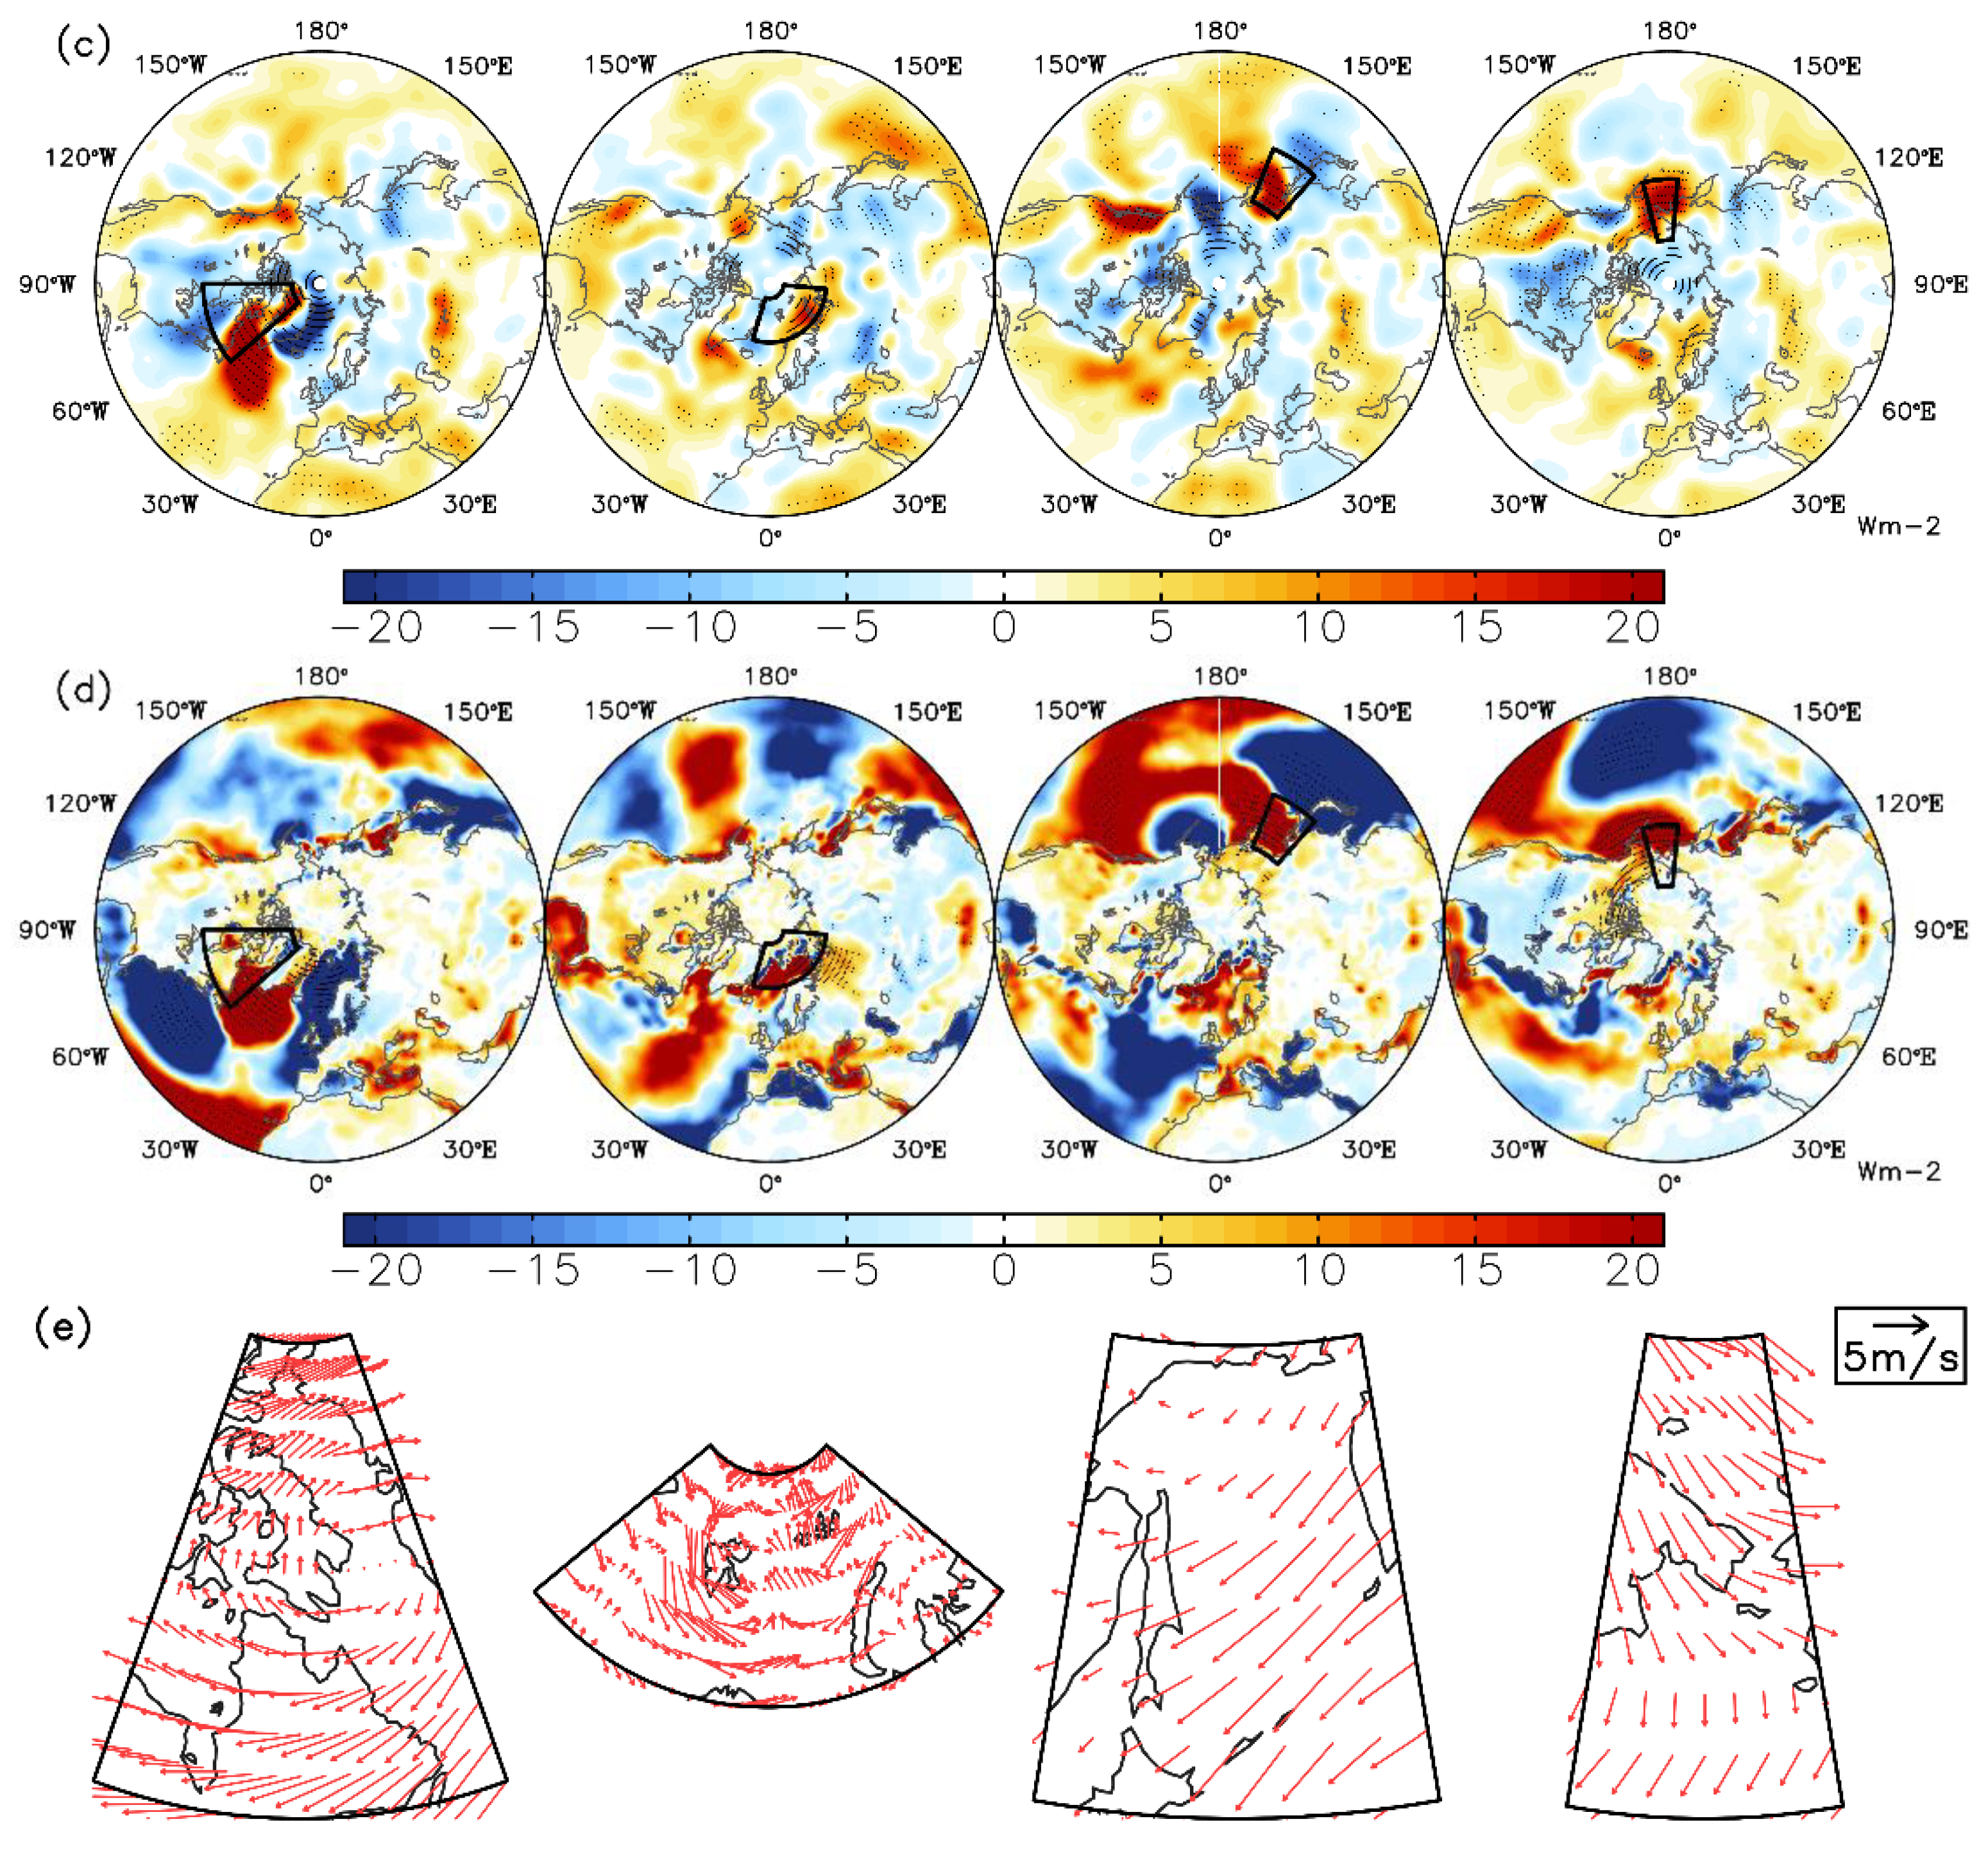
According to many previous studies [8,12], the SAT anomaly over a local region is mainly driven by enhanced downward IR. Meanwhile, the downward IR is closely related to the local PWA driven by the blocking circulation. Thus, the blocking circulation contributes significantly to the intensified SAT anomaly resulting from the enhanced downward IR and then causes sea ice to decrease. However, the previous studies have mainly been confined to the Barents–Kara Seas and the characteristics of the other key SIC regions have still been unclear, especially at the weekly time scale. To further verify the contribution of each variable to the change in the SAT anomaly, the comparison of related variables should be examined. According to previous studies [21,29], the surface downward IR, PWA, 850-hPa horizontal temperature advection, adiabatic heating/cooling induced by vertical velocity, cloud forcing net solar flux at the surface and sum of surface sensible and latent heat flux anomalies are examined. The units of the above variables are all expressed as W m−2 except the PWA (kg m−2), following previous studies [21,29]. Figure 7a shows the composite of the downward IR anomaly for key regions Baffin Bay, Barents-Kara Seas, Okhotsk Sea and Bering Sea (black boxes) during lag −2 to lag 2 of the blocking life cycle, in which the four subpanels from left to right correspond to the composites of GB, UB, PB-W and PB-E events (as indicated in the panels), respectively. The positive surface downward IR anomaly in each key SIC region is clear and notable and the downstream area is accompanied by a significant negative IR anomaly, as shown in Figure 7a. In addition, the anomaly pattern in Figure 7a is very close to the pattern in Figure 6a for each key SIC region. This similarity means that the local surface downward IR can make a significant contribution to the local SAT variation during the blocking life cycle (lag −2 to lag 2). This result is consistent with those of previous studies [8,21] and we further extend the research for different key SIC regions in detail. Figure 7b shows the composite of the PWA during lag −2 to lag 2 of blocking events for each key SIC region. In region Baffin Bay, the GB circulation may clearly bring a notable positive water vapor anomaly. Similarly, the occurrences of the blocking circulations in the other three key SIC regions may bring significant water vapor to these regions, as shown in Figure 7b. The PWA anomaly pattern in Figure 7b is very close to the IR anomaly pattern in Figure 7a and the SAT anomaly pattern Figure 6a for each key SIC region. This similarity means that the variability in the downward IR is closely related to the variation in water vapor in each key SIC region, which can significantly contribute to the SAT change. In addition, the increased regional water vapor is closely related to the evolution of the regional blocking event.
However, many other factors such as the 850-hPa horizontal temperature advection, adiabatic heating/cooling induced by vertical velocity, cloud forcing net solar flux at the surface and sum of surface sensible and latent heat flux anomalies may also make contributions to the SAT variation. Figure 7c shows the composite of the 850-hPa horizontal temperature advection during lag −2 to lag 2 of regional blocking events. The 850-hPa horizontal temperature advection can be seen to exhibit a certain positive anomaly signal during the blocking life cycle within each key SIC region. In addition, the composite of the sum of surface sensible and latent heat flux anomaly is shown in Figure 7d. This figure indicates that the magnitude of the surface sensible and latent heat flux anomaly is greater than that of the other variables in Figure 7, especially over the ocean areas. This difference occurs because the energy and flux interactions between the sea surface and the air are much stronger than those over land. In particular, when the sea ice melts and the ocean surface is exposed, the energy exchange between the sea and the atmosphere becomes very complex. Therefore, changes in SLH are also largely due to the melting of sea ice. Meanwhile, the adiabatic heating/cooling anomaly induced by vertical velocity and the cloud forcing net solar flux anomaly at the surface both exhibit weak anomaly signals (not shown), which means these two factors contribute little to the SAT change. Moreover, some other factors such as wind-driven processes may also affect the sea ice decline [30,31]. For the four key regions, the dynamic wind-driven processes are complicated and different. Figure 7e shows the composite of the 10 m U and V vector anomaly for four key SIC regions. It can be seen that the directions of the wind vector are mainly exhibit anticyclone as shown in Baffin Bay, Barents-Kara Seas and Okhotsk Sea, which may not be favorable for the sea ice drift out of each region. For Bering Sea, the surface northerly wind vector anomaly is dominant, which may be favorable for the sea ice drift out of the Bering area. However, the drift of sea ice is a complicated multi-factor process, including the thickness (edge) of sea ice, the distribution of open water, the continental topography and so on [31]. Anyway, Figure 7e indicates that the position of the anticyclone of the blocking dipole has important contribution to the SIC wind-driven process during the blocking life cycle. Further analysis on wind driving and other factors are not discussed in this study.
The above results reveal that the regional blocking circulation can significantly affect the regional sea ice decline by increasing the local SAT. The intensified water vapor and associated enhanced surface downward IR driven by the blocking circulation make important contributions to the SAT change. Some other variables such as the 850-hPa horizontal temperature advection and sensible/latent heat flux can also affect the SAT change.

5.3. The Lead-Lag Relationship between Blocking and Sea Ice Decline

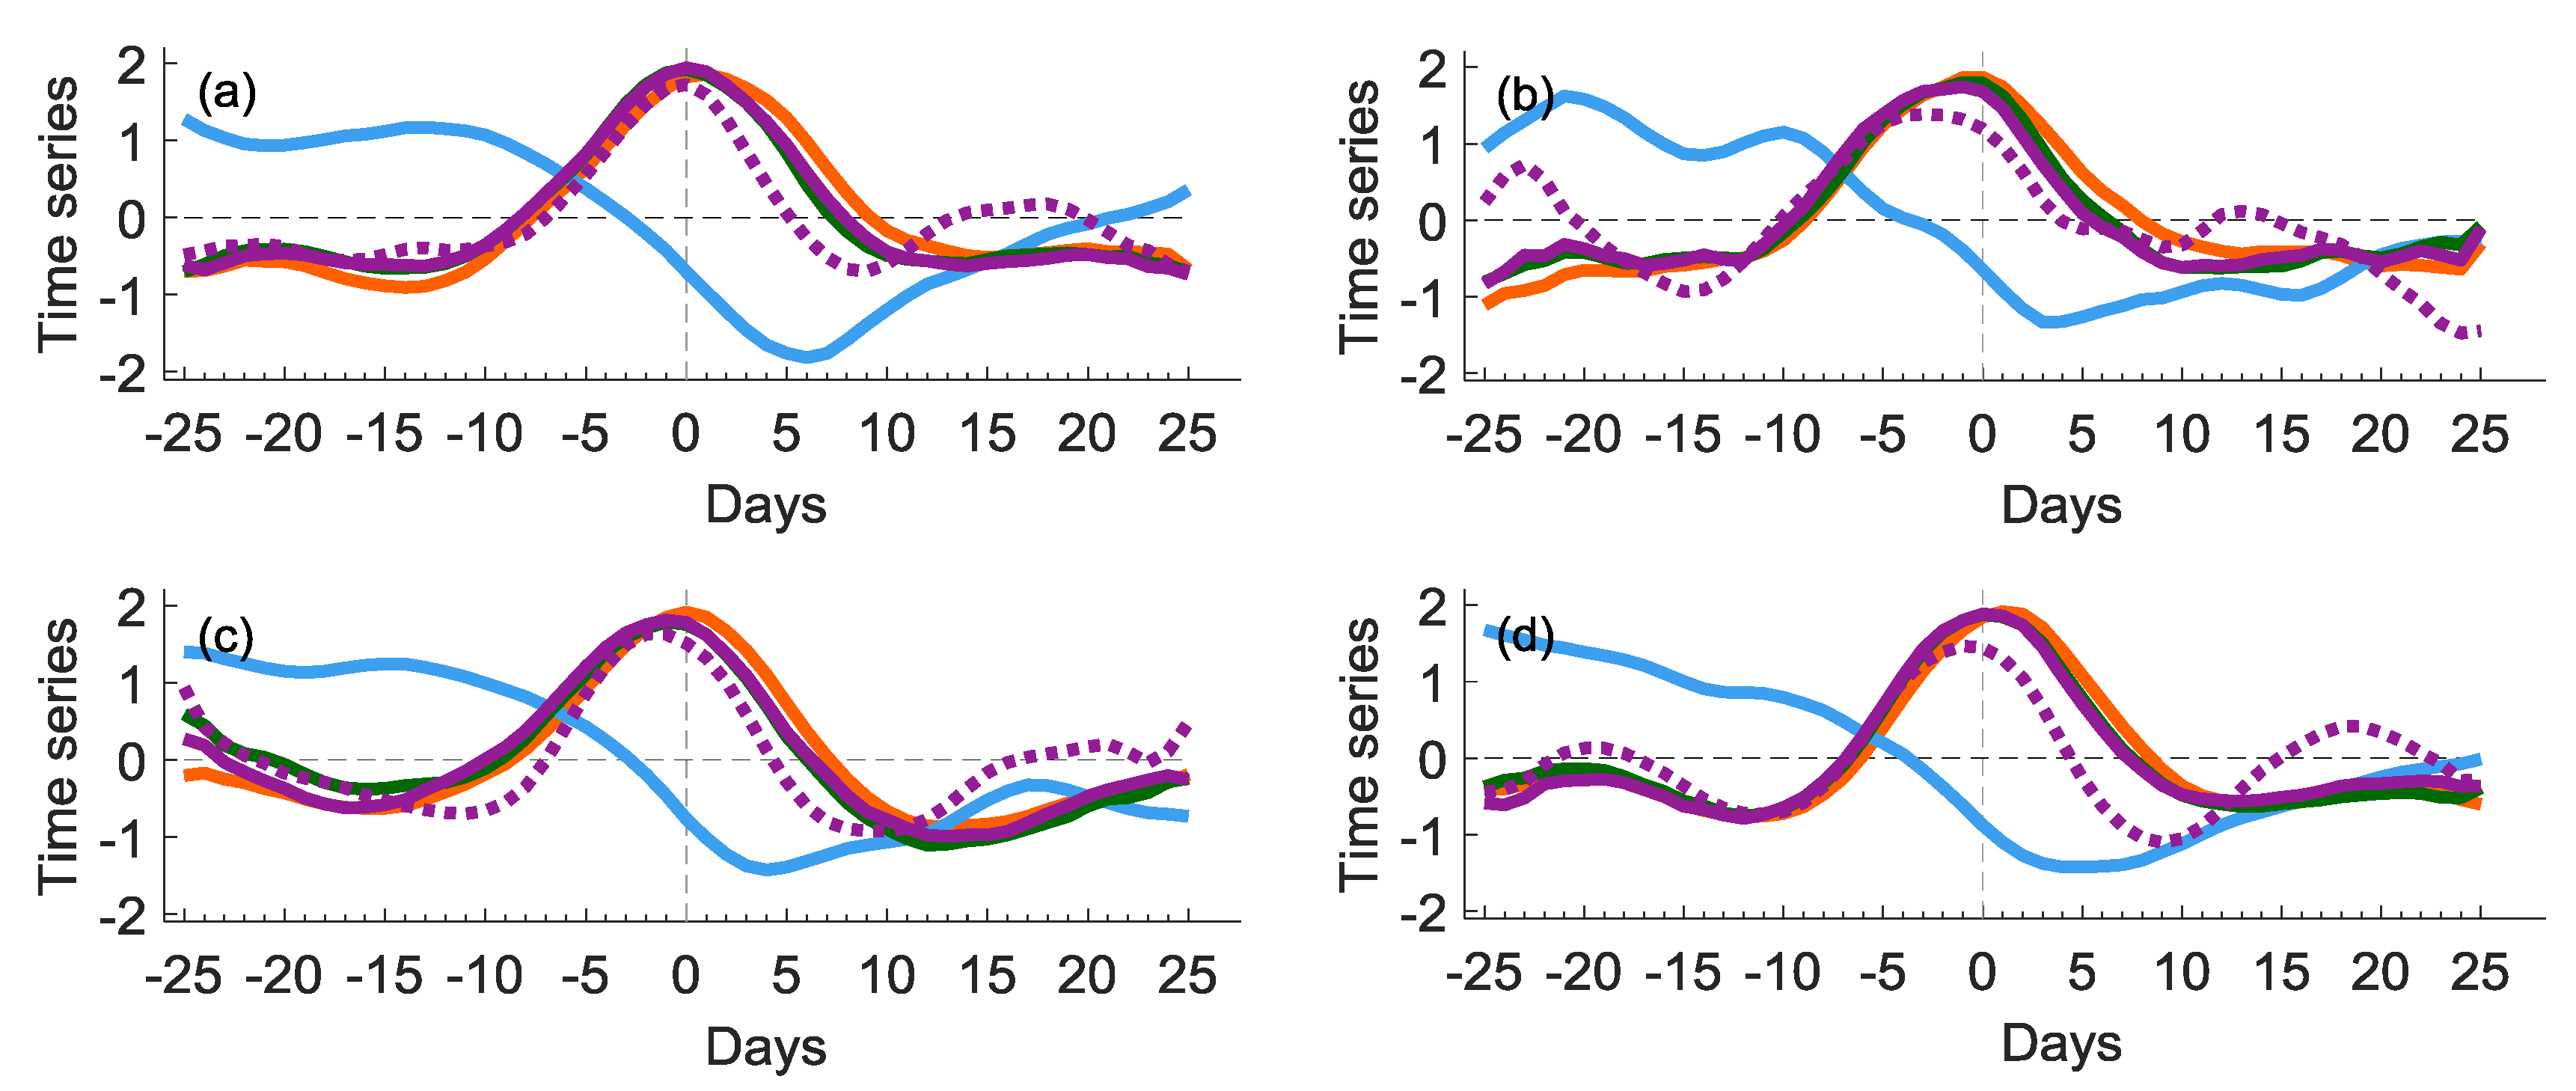
To examine the lead-lag relationship between the blocking circulation and sea ice decline, Figure 8 shows the composite time series of the associated variables during the life cycle of blocking events. Clearly, with the development of the GB circulation (Figure 8a), a growing SAT anomaly over region Baffin Bay can be found during the growth phase of blocking (lag −10 to lag −1). Associated variables in region Baffin Bay, such as surface downward IR, PWA and 850−hPa horizontal temperature advection, are also increasing rapidly and reached their peaks on approximately the lag 0 day. Then, the associated variables decrease with the decay of the GB circulation (lag 1 to lag 10). Meanwhile, as the SAT anomaly increases and the sea ice begins to melt and reaches its minimum value on lag 6 day. This result means that the sea ice change lags the blocking evolution and associated aforementioned atmospheric variables by 6 days relative to the GB peak day (lag 0), as shown in Figure 8a. Therefore, the GB circulation can affect the SAT anomaly by changing the local radiation, water vapor transport and associated variables in key region Baffin Bay, thus promoting the melting of regional sea ice. For key region Barents-Kara Seas, the UB evolution leads the sea ice decline by approximately 3~4 days, which is consistent with the results of previous studies [8,18]. The PB-W and PB-E evolutions lead the sea ice decline by approximately 4 days, as shown in Figure 7c,d, respectively. In addition, the sea ice anomaly (blue lines in Figure 8) is found to maintain a low value (below 0 standard deviation), even after the end of the blocking events (after lag 10). This effect is more obvious in key regions Barents-Kara Seas, Okhotsk Sea and Bering Sea, where the sea ice anomaly remains at lower levels until the lag 25 day. This effect occurs because the increases in the radiation and the SAT anomaly associated with the regional blocking are synchronous with the blocking itself but the process of melting sea ice requires a certain response time and may lag behind blocking. Moreover, once the sea ice melts and the ocean surface begins to emerge, ocean water freezing into sea ice again is a relatively slow process. Although the SAT decreases rapidly at the end of a blocking circulation (lag 5 to lag 10), the sea ice remains at a low level and shows a slow growth process as illustrated in Figure 8 (blue lines). Thus, the regional blocking may promote the decline in regional sea ice at weekly time scales by increasing the SAT anomaly and associated variables (Figure 7 and Figure 8). This result is a supplement to those from a previous study [8].

5.4. The Quantitative Estimation of the Sea Ice Decline and Radiation Variations Associated with the Blocking

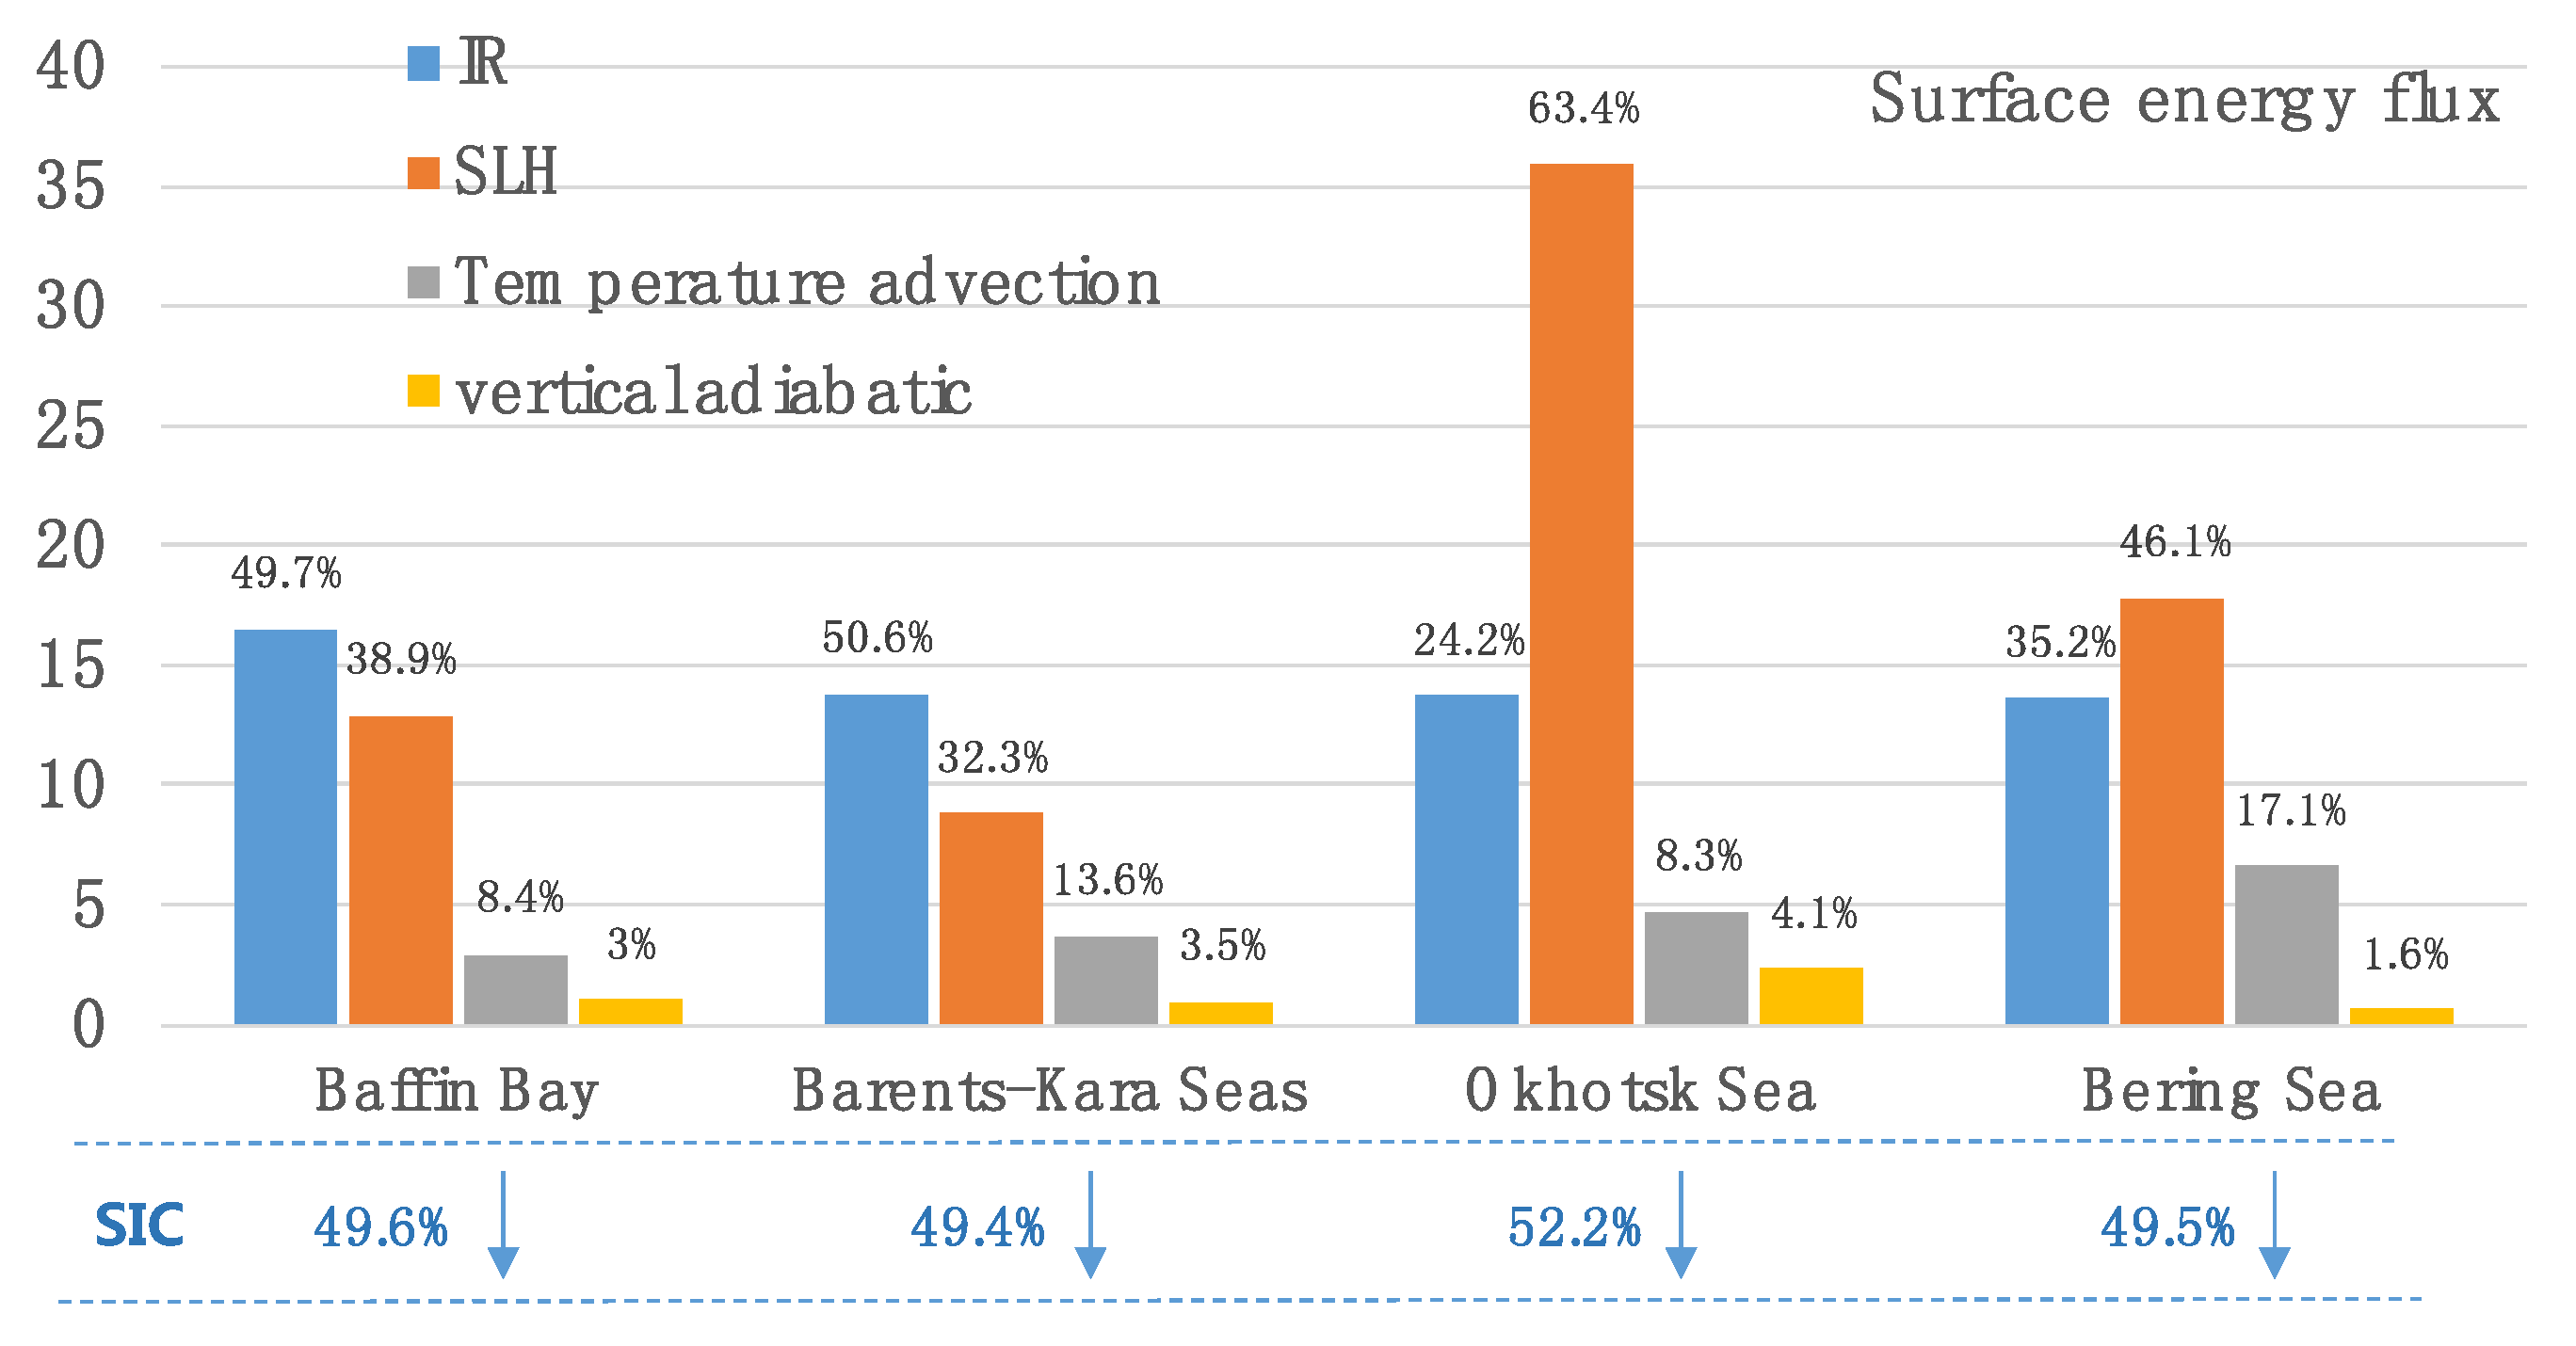
The effects of blocking on sea ice decline and the changes in related radiation variables are discussed above. In this section, it is necessary to quantify the sea ice decline associated with the blocking circulation at weekly time scales. Above all, the contributions of the related variations to the surface energy flux that associated with the blocking should be calculated quantitatively. According to Figure 7, the downward IR, SLH, temperature advection and vertical adiabatic heating/cooling anomaly all make positive contributions to the positive surface energy flux (SAT) but the cloud forcing net solar flux does not. Thus, the regional averaged downward IR, SLH, temperature advection and vertical adiabatic heating/cooling anomaly during lag −5 to lag 5 (life cycle of the blocking) are calculated and each component with respect to the total surface energy flux (sum of the four terms) can be obtained as shown in Figure 9. Note that land regions have been excluded from the regional mean. For regions Baffin Bay and Barents-Kara Seas (Figure 9), the downward IR clearly contributes the most to the surface energy fluxes at 49.7% and 50.6%, respectively. The SLH accounts for the second highest contributions at 38.9% and 32.3%, respectively. The contributions of temperature advection and the vertical adiabatic heating/cooling anomaly are relatively small. However, for regions Okhotsk Sea and Bering Sea (Figure 9), the SLH contributes the most to the surface energy flux at 63.4% and 46.1%, respectively. In addition, the downward IR accounts for the second highest contributions at 24.2% and 35.2%, respectively. These results may due to the more open geographical locations in regions Okhotsk Sea and Bering Sea with more open water; this situation benefits heat exchange between the ocean surface water and the atmosphere. At the same time, the latitudes of regions Okhotsk Sea and Bering Sea are also lower than those of regions Baffin Bay and Barents-Kara Seas and the SIC is lower than those in regions Baffin Bay and Barents-Kara Seas. Therefore, the SLH values generated by ocean-air interactions in regions Okhotsk Sea and Bering Sea are higher than those in regions Baffin Bay and Barents-Kara Seas. However, the warming caused by the downward IR also leads to changes in the SLH. It is difficult to distinguish the change in the SLH induced by change in IR. Due to the complex coupling of the ocean, sea ice and atmosphere system, accurate quantitative estimation may not be obtained and our quantitative calculation here is only an approximation. Moreover, according to previous studies [8,12], the downward IR (positive anomaly) is a direct radiation variation caused by blocking-induced poleward moisture transportation, which can significantly affect the SAT and SIC changes in regional areas.
According to Figure 8, the SIC begins to decrease significantly at approximately the lag −5 day and persists until approximately the lag 20 day. Thus, by integrating the initial SIC (not the SIC anomaly) during lag −5 to lag 20 and contrasting it with the SIC during lag −25 to lag −6 and lag 21 to lag 25, the percentage reduction in SIC associated with the blocking can be approximately obtained for each SIC region. As shown in Figure 9 (bottom line), the percentage reductions in SIC associated with the regional blockings at weekly time scales are 49.6%, 49.4%, 52.2% and 49.5% for regions Baffin Bay, Barents-Kara Seas, Okhotsk Sea and Bering Sea, respectively. We should point out that for monthly and seasonal time scales, the contribution of blocking to SIC decline is much smaller, as the occurrence frequency of blocking is lower than that for days of the whole winter. However, our results show that the regional blocking can obviously accelerate reduction in regional SIC at weekly time scales.

6. Results and Discussion

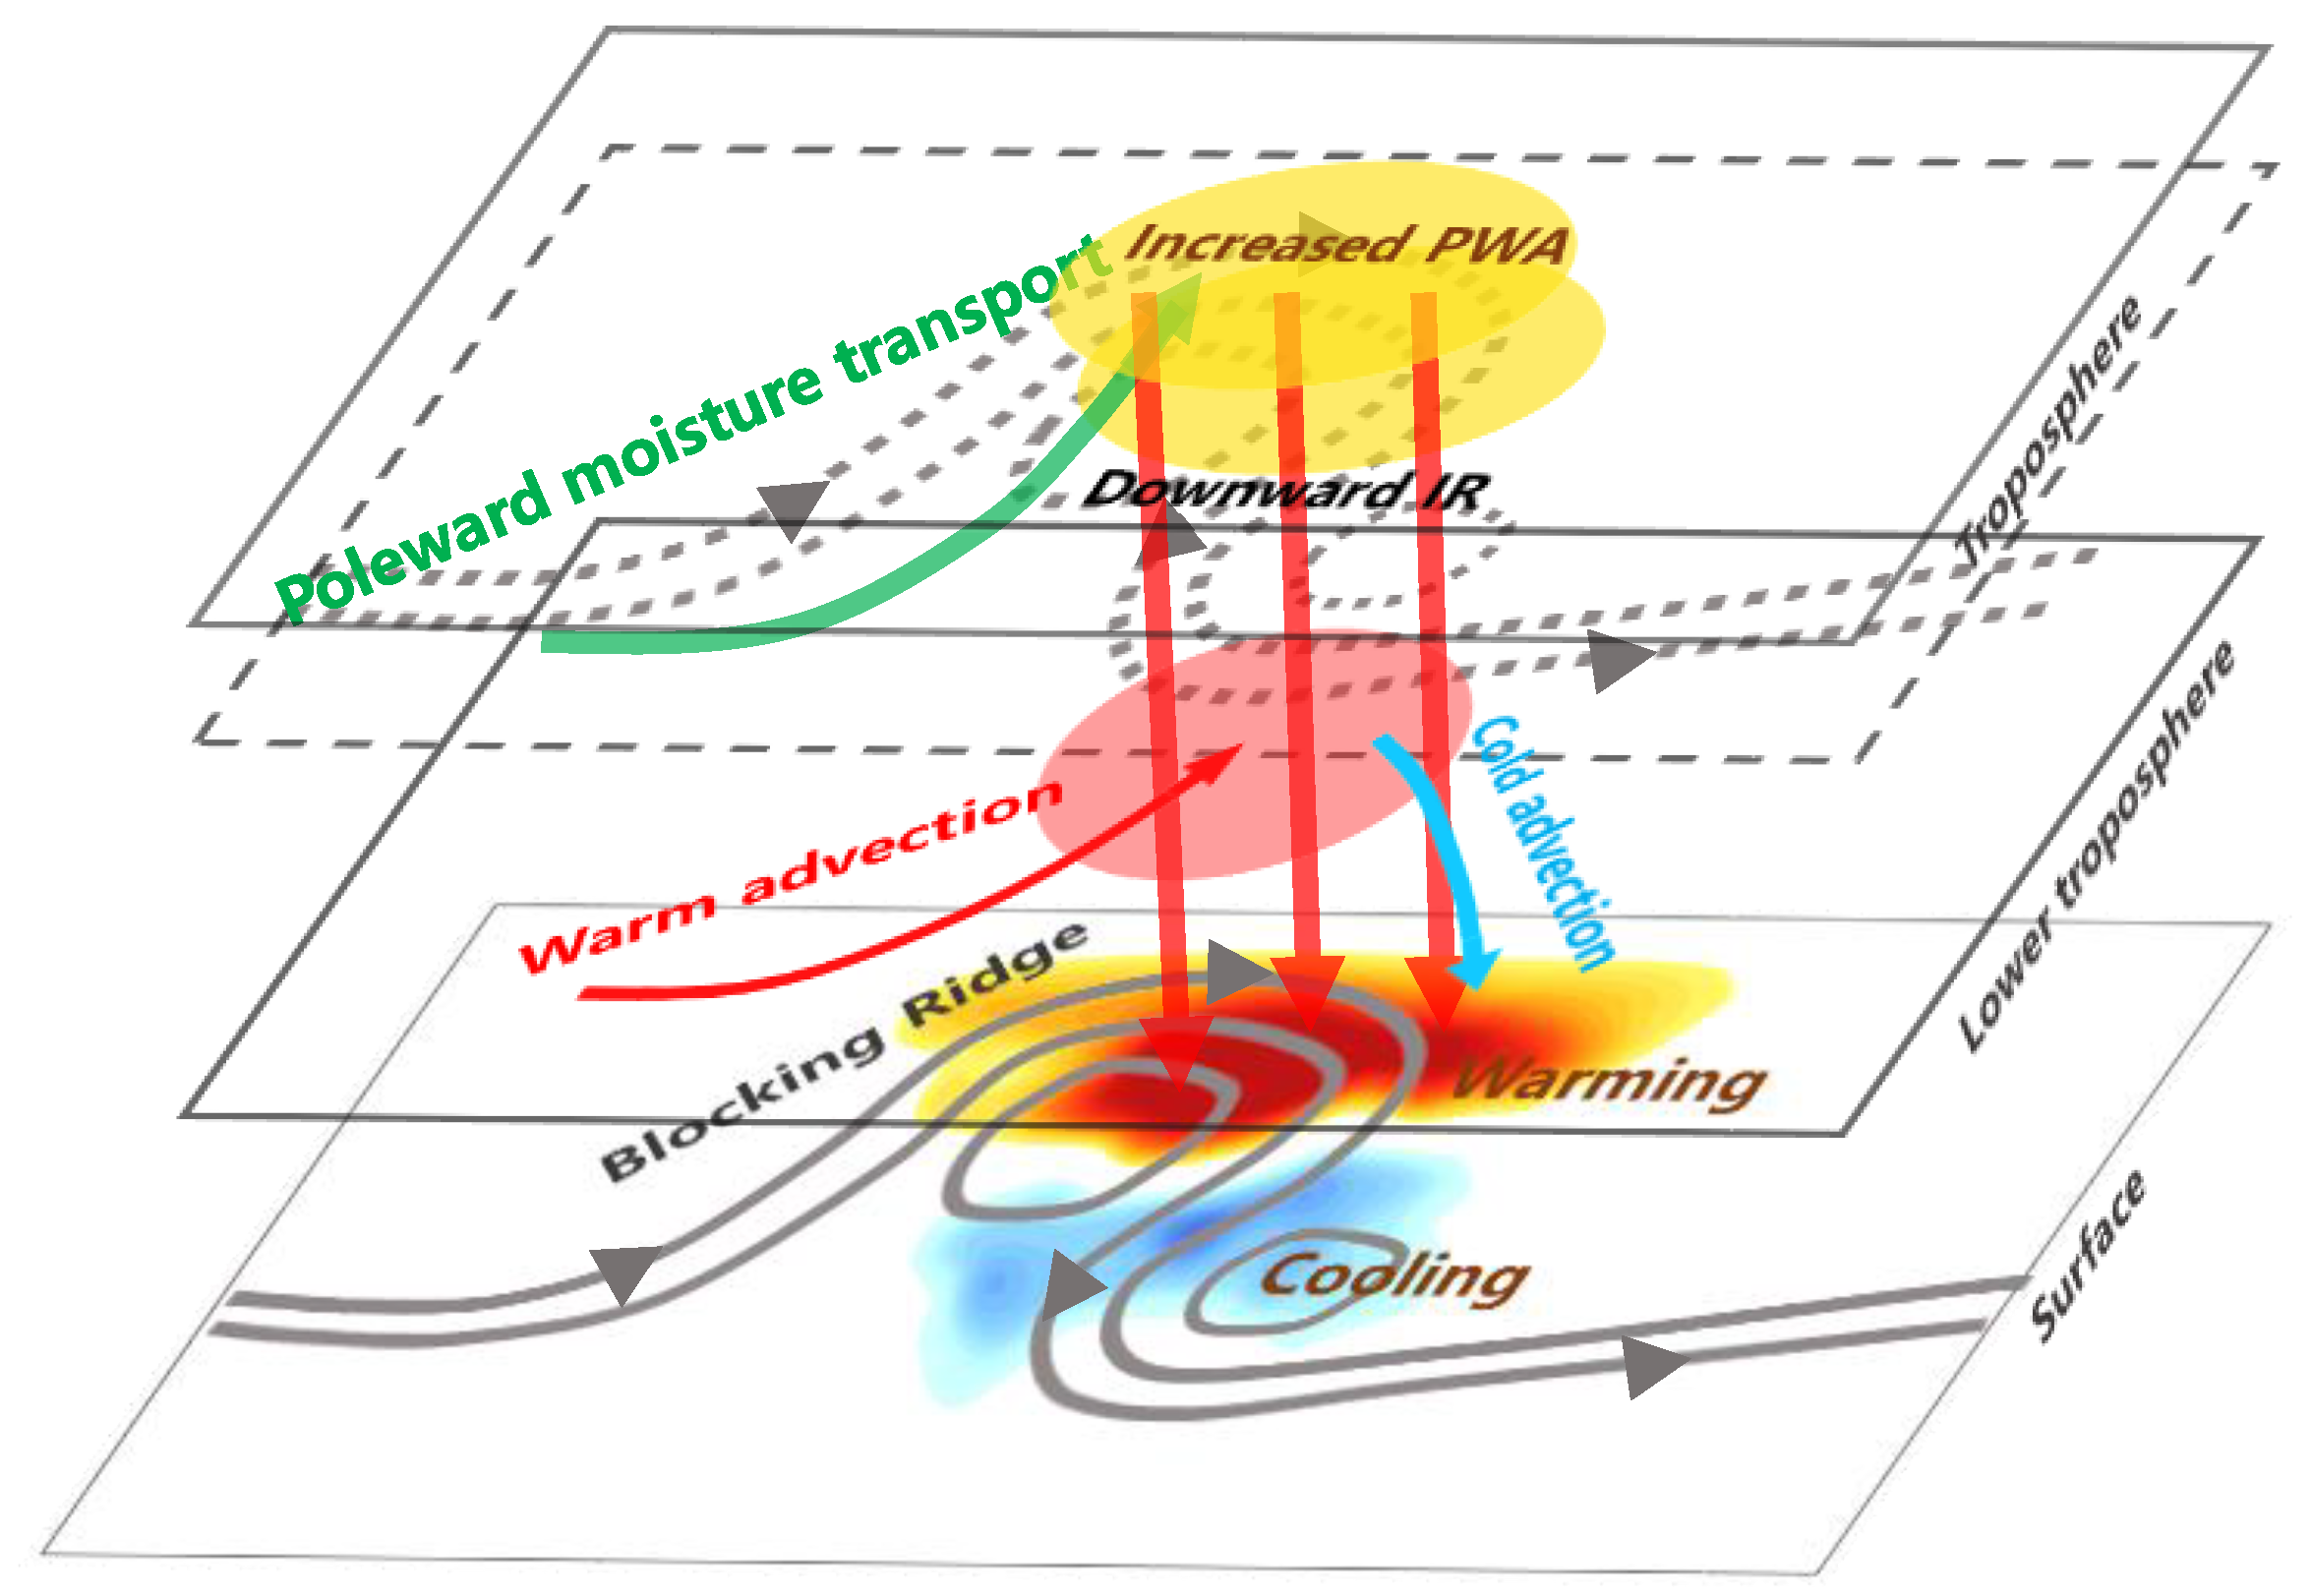
The physical process by which the blocking circulation affects the sea ice decline is outlined in the schematic diagram shown in Figure 10. The blocking circulation is a deep atmospheric system that develops from the surface to the upper level of the troposphere. When the blocking circulation begins to grow and reaches its peak, as shown in Figure 10, the blocking ridge and trough can usually be found in the local region. In the lower troposphere, the air temperature advection (red and blue arrows) associated with the blocking circulation can make certain contributions to warming in the higher latitudes (red shading) and cooling in the lower latitudes and downstream (blue shading) at the surface. More important, the poleward moisture transport (green arrow) that is controlled by the blocking circulation makes water vapor gather in the higher latitudes (orange shading) through the entire troposphere (mainly in the lower troposphere). The positive water vapor produces positive downward IR at the surface and significantly affects the SAT changes at higher latitudes. The increased SAT may promote the melting of the sea ice in the local region. However, because sea ice melting is a slow process, the decline in sea ice may lag the blocking variation by 3~6 days and lower levels may persist for weeks after the end of blocking. Owing to the blockage by the blocking ridge, moisture transport from the west to the east at mid-latitudes is effectively suppressed. Thus, due to the negative downward IR and cold temperature advection, the SAT in the mid-latitudes downstream from the blocking ridge can be significantly decreased (blue shading).
In this study, the sea ice changes associated with the regional atmospheric blocking at weekly time scales in four key SIC regions are examined based on observational data analysis. The whole Arctic sea ice region is divided into four key SIC regions according to the linear trend pattern in the sea ice. The atmospheric pattern obtained by regressing the HGT anomaly onto the whole Arctic sea ice time series is a mixed mode. However, regional atmospheric blocking patterns can be seen by regressing the HGT anomaly onto regional sea ice time series. The results show that the regional blocking frequency has a close link with the regional sea ice variation. Our composite analysis shows that the regional blocking can significantly promote the melting of sea ice by increasing the local SAT through strengthening moisture transport and downward IR. For different key SIC regions, the sea ice changes lag behind the blocking changes by approximately 3~6 days. Although the percentage of the SLH anomaly is larger for regions Okhotsk Sea and Bering Sea, the downward IR may make the most important contribution on the surface energy flux because the change in the SLH is mainly a result of the sea ice phase transition rather than a direct cause of sea ice reduction. In addition, some other factors referred to in Figure 7 can also make contributions to the SAT change. It must be pointed out that the primary feature affecting the sea ice variation is the sea surface temperature (SST) change, especially on decadal time scales. Wind-driven dynamic factors can also affect the sea ice distribution. However, in this study, we focus on only the synoptic impact on the sea ice variation associated with the blocking circulation in four different key SIC regions. Quantitative analysis shows that the blocking process can reduce the SIC by 49.6%, 49.4%, 52.2% and 49.5% during lag −5 to lag 20 days for regions Baffin Bay, Barents-Kara Seas, Okhotsk Sea and Bering Sea, respectively. Thus, at weekly time scales, the sea ice may decrease significantly due to the blocking effect and may lag the blocking change by 3~6 days.
In addition, the decadal variability of the Arctic sea ice is an important issue. The decadal variability of Arctic sea ice varies across the four key SIC regions. However, the relationship between the decadal variability of regional sea ice and the decadal variability of the regional blocking frequency is still unclear and remains to be investigated in the future.

Author Contributions

Y.Y. conceived and carried out the project, and wrote the paper; D.L. and L.Z. constructively reviewed the paper.

Funding

This research was funded by the National Natural Science Foundation of China (Grants 41790473 and 41505075) and the National Key Research and Development Program of China (Grant 2016YFA0601802).

Acknowledgments

The authors acknowledge the anonymous reviewers for their helpful comments to improve this paper.

Conflicts of Interest

The authors declare no conflict of interest.

References

  1. Serreze, M.C.; Barry, R.G. Processes and impacts of Arctic amplification: A research synthesis. Glob. Planet. Chang. 2011, 77, 85–96. [Google Scholar] [CrossRef]
  2. Lesins, G.; Duck, T.J.; Drummond, J.R. Surface energy balance framework for arctic amplification of climate change. J. Clim. 2012, 25, 8277–8288. [Google Scholar] [CrossRef]
  3. Cohen, J.; Screen, J.A.; Furtado, J.C.; Barlow, M.; Whittleston, D.; Coumou, D.; Francis, J.; Dethloff, K.; Entekhabi, D.; Overland, J.; et al. Recent Arctic amplification and extreme mid-latitude weather. Nat. Geosci. 2014, 7, 627–637. [Google Scholar] [CrossRef] [Green Version]
  4. Ghatak, D.; Miller, J. Implications for Arctic amplification of changes in the strength of the water vapor feedback. J. Geophys. Res. Atmos. 2013, 118, 7569–7578. [Google Scholar] [CrossRef] [Green Version]
  5. Simmons, A.J.; Poli, P. Arctic warming in ERA-Interim and other analyses. Q. J. R. Meteorol. Soc. 2015, 141, 1147–1162. [Google Scholar] [CrossRef]
  6. Francis, J.A.; Hunter, E. New insight into the disappearing Arctic sea ice. EOS Trans. Am. Geophys. Union 2006, 87, 509–511. [Google Scholar] [CrossRef]
  7. Overland, J.E.; Wang, M. Large-scale atmospheric circulation changes are associated with the recent loss of Arctic sea ice. Tellus A 2010, 62, 1–9. [Google Scholar] [CrossRef] [Green Version]
  8. Gong, T.; Luo, D. Ural blocking as an amplifier of the Arctic sea ice decline in winter. J. Clim. 2017, 30, 2639–2654. [Google Scholar] [CrossRef]
  9. Francis, J.A.; Vavrus, S.J.; Cohen, J. Amplified arctic warming and mid-latitude weather: New perspectives on emerging connections. Wire. Clim. Chang. 2017, 8, e474. [Google Scholar] [CrossRef]
  10. Francis, J.A. Why are arctic linkages to extreme weather still up in the air? Bull. Am. Meteorol. Soc. 2017, 98, 2551–2557. [Google Scholar] [CrossRef]
  11. Screen, J.A.; Deser, C.; Smith, D.M.; Zhang, X.; Blackport, R.; Kushner, P.J.; Oudar, T.; McCusker, K.E.; Sun, L. Consistency and discrepancy in the atmospheric response to arctic sea-ice loss across climate models. Nat. Geosci. 2018, 11, 155–163. [Google Scholar] [CrossRef]
  12. Park, D.-S.R.; Lee, S.; Feldstein, S.B. Attribution of the recent winter sea ice decline over the Atlantic sector of the Arctic Ocean. J. Clim. 2015, 28, 4027–4033. [Google Scholar] [CrossRef]
  13. Luo, B.; Dehai, L.; Lixin, W.; Linhao, Z.; Ian, S. Atmospheric circulation patterns which promote winter Arctic sea ice decline. Environ. Res. Lett. 2017, 12, 054017. [Google Scholar] [CrossRef] [Green Version]
  14. Zhong, L.; Hua, L.; Luo, D. Local and external moisture sources for the Arctic warming over the Barents–Kara seas. J. Clim. 2018, 31, 1963–1982. [Google Scholar] [CrossRef]
  15. Lien, V.S.; Schlichtholz, P.; Skagseth, Ø.; Vikebø, F.B. Wind-driven Atlantic water flow as a direct mode for reduced Barents Sea ice cover. J. Clim. 2017, 30, 803–812. [Google Scholar] [CrossRef]
  16. Saenko, O.A.; Schmittner, A.; Weaver, A.J. On the role of wind-driven sea ice motion on ocean ventilation. J. Phys. Oceanogr. 2002, 32, 3376–3395. [Google Scholar] [CrossRef]
  17. Screen, J.A.; Simmonds, I. Increasing fall-winter energy loss from the Arctic Ocean and its role in Arctic temperature amplification. Geophys. Res. Lett. 2010, 37, L16707. [Google Scholar] [CrossRef]
  18. Luo, D.; Xiao, Y.; Yao, Y.; Dai, A.; Simmonds, I.; Franzke, C.L.E. Impact of Ural blocking on winter warm Arctic–cold Eurasian anomalies. Part I: Blocking-induced amplification. J. Clim. 2016, 29, 3925–3947. [Google Scholar] [CrossRef]
  19. Overland, J.; Francis, J.A.; Hall, R.; Hanna, E.; Kim, S.-J.; Vihma, T. The melting Arctic and midlatitude weather patterns: Are they connected? J. Clim. 2015, 28, 7917–7932. [Google Scholar] [CrossRef]
  20. Crasemann, B.; Handorf, D.; Jaiser, R.; Dethloff, K.; Nakamura, T.; Ukita, J.; Yamazaki, K. Can preferred atmospheric circulation patterns over the North-Atlantic-Eurasian region be associated with arctic sea ice loss? Polar Sci. 2017, 14, 9–20. [Google Scholar] [CrossRef]
  21. Yao, Y.; Luo, D.; Dai, A.; Simmonds, I. Increased quasi stationarity and persistence of winter Ural blocking and Eurasian extreme cold events in response to Arctic warming. Part I: Insights from observational analyses. J. Clim. 2017, 30, 3549–3568. [Google Scholar] [CrossRef]
  22. Berggren, R.; Bolin, B.; Rossby, C.G. An aerological study of zonal motion, its perturbations and break-down. Tellus 1949, 1, 1–37. [Google Scholar] [CrossRef]
  23. Rex, D.F. Blocking action in the middle troposphere and its effect upon regional climate: I. An acrological study of blocking action. Tellus 1950, 2, 196–211. [Google Scholar]
  24. Dee, D.P.; Uppala, S.M.; Simmons, A.J.; Berrisford, P.; Poli, P.; Kobayashi, S.; Andrae, U. The ERA-Interim reanalysis: Configuration and performance of the data assimilation system. Q. J. R. Meteorol. Soc. 2011, 137, 553–597. [Google Scholar] [CrossRef]
  25. Yao, Y.; Luo, D.H. An asymmetric spatiotemporal connection between the Euro-Atlantic blocking within the NAO life cycle and European climates. Adv. Atmos. Sci. 2018, 35, 796–812. [Google Scholar] [CrossRef]
  26. Tibaldi, S.; Molteni, F. On the operational predictability of blocking. Tellus 1990, 42A, 343–365. [Google Scholar] [CrossRef]
  27. Luo, D.; Yao, Y.; Dai, A.; Simmonds, I.; Zhong, L. Increased quasi stationarity and persistence of winter Ural blocking and Eurasian extreme cold events in response to Arctic warming. Part II: A theoretical explanation. J. Clim. 2017, 30, 3569–3587. [Google Scholar] [CrossRef]
  28. Honda, M.; Inoue, J.; Yamane, S. Influence of low Arctic sea-ice minima on anomalously cold Eurasian winters. Geophys. Res. Lett. 2009, 36, 262–275. [Google Scholar] [CrossRef]
  29. Alexander, L.V.; Zhang, X.; Peterson, T.C.; Caesar, J.; Gleason, B.; Tank, A.M.G.K.; Haylock, M.; Collins, D.; Trewin, B.; Rahimzadeh, F.; et al. Global observed changes in daily climate extremes of temperature and precipitation. J. Geophys. Res. Atmos. 2006, 111, D05109. [Google Scholar] [CrossRef]
  30. Kwok, R. Recent changes in Arctic Ocean sea ice motion associated with the North Atlantic oscillation. Geophys. Res. Lett. 2000, 27, 775–778. [Google Scholar] [CrossRef]
  31. Rigor, I.G.; Wallace, J.M.; Colony, R.L. Response of sea ice to the Arctic oscillation. J. Clim. 2002, 15, 2648–2663. [Google Scholar] [CrossRef]
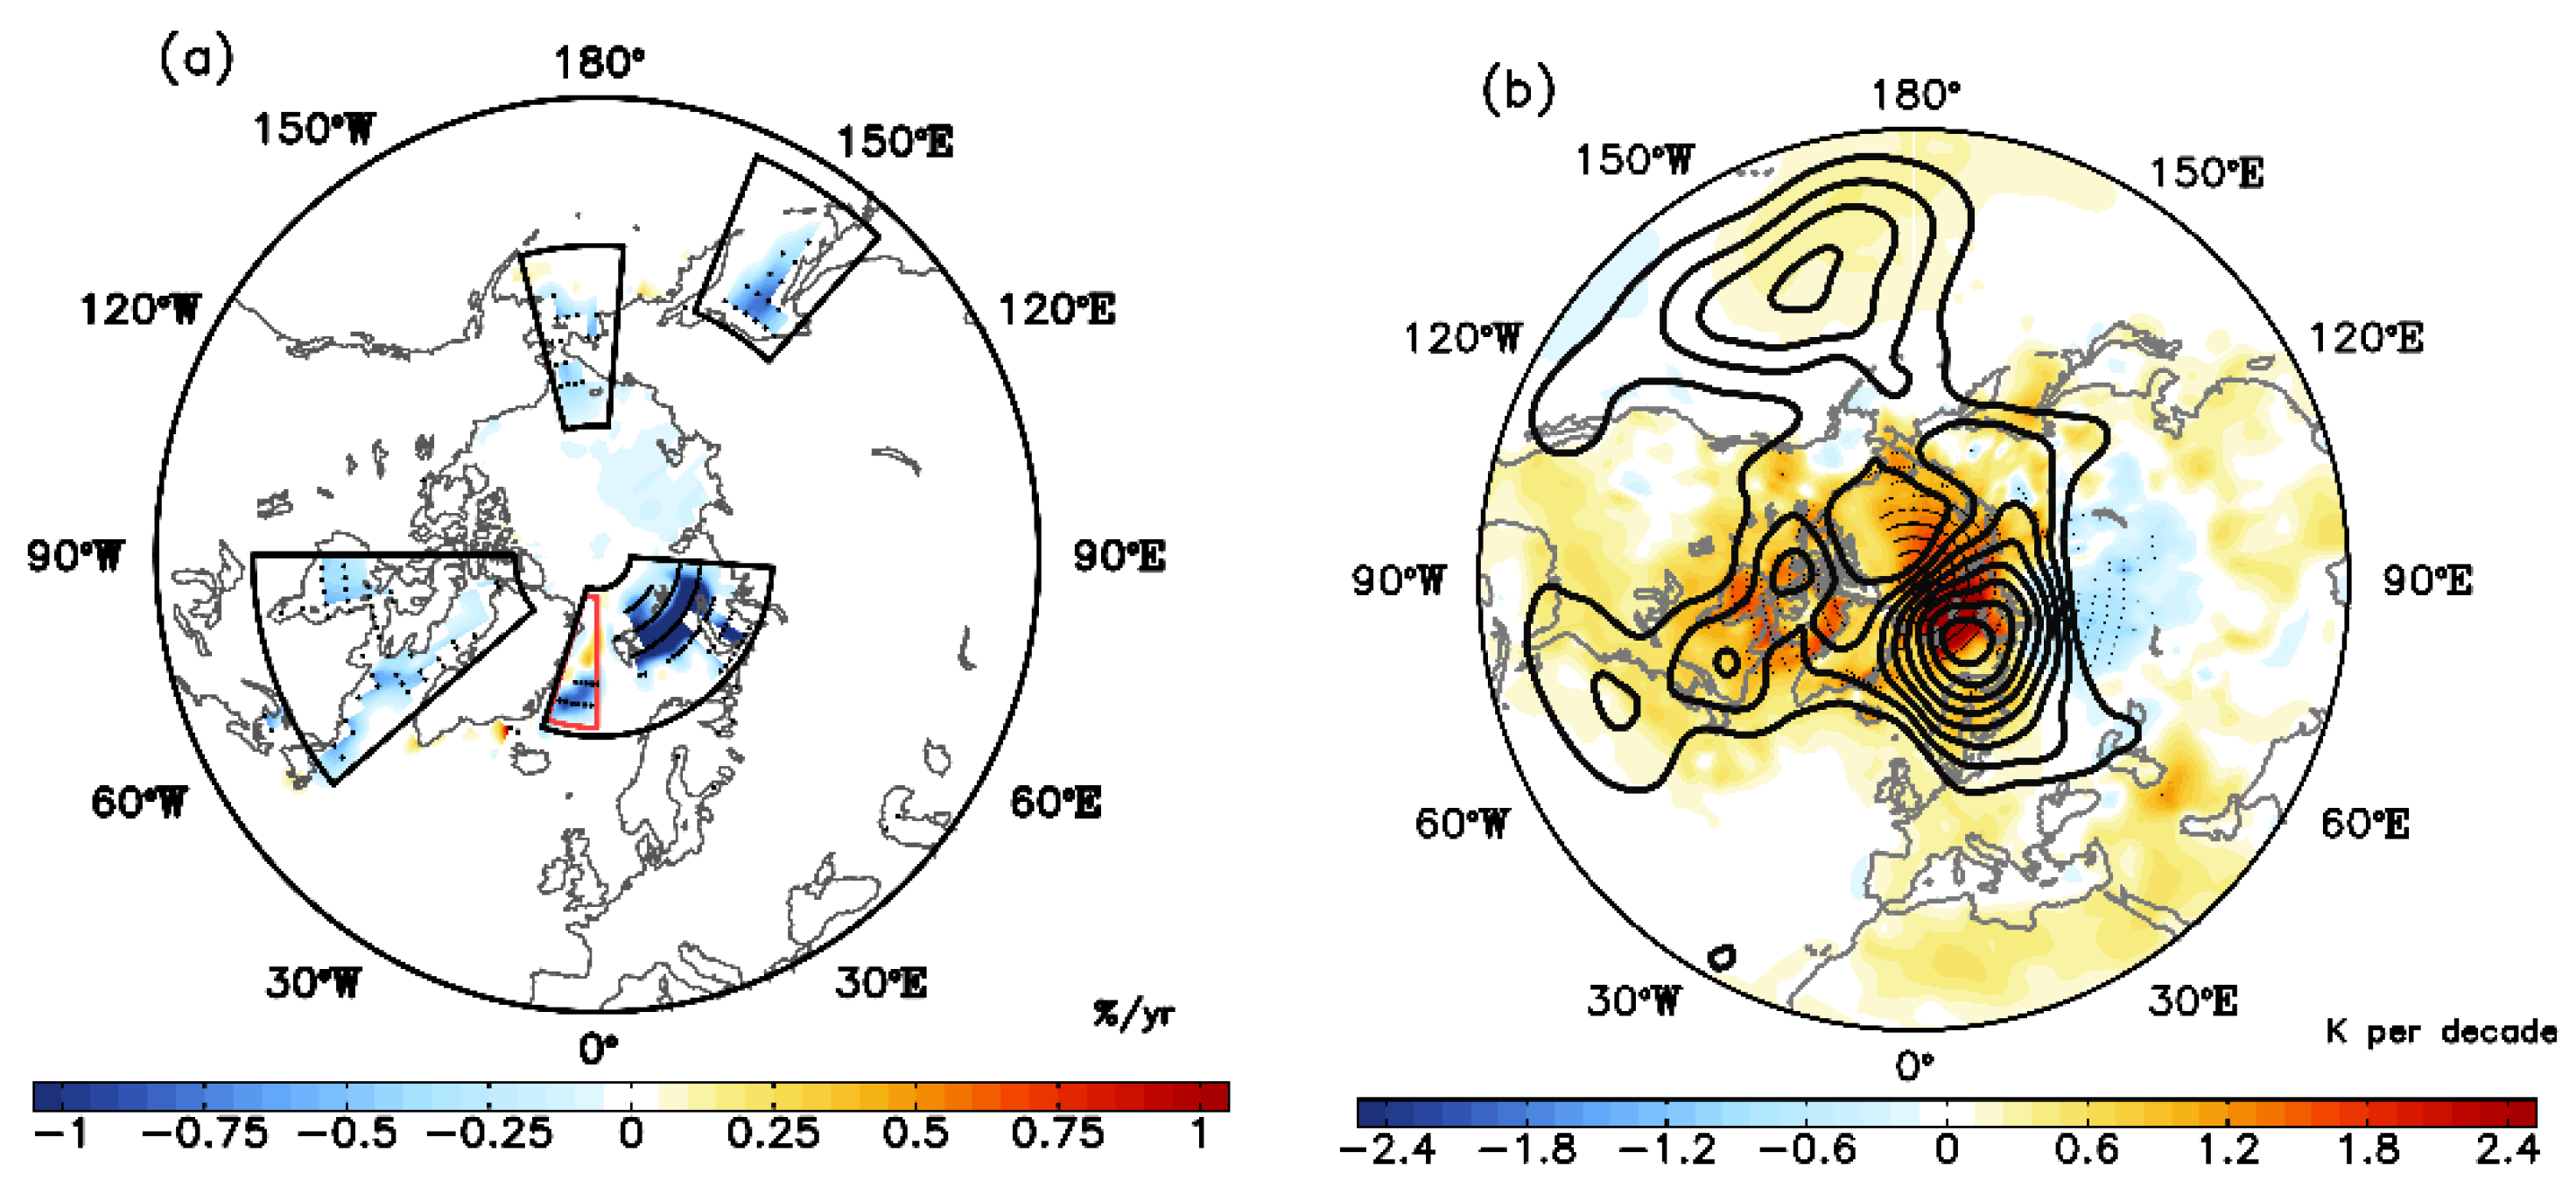
Figure 1. (a) Linear trend distribution of the Arctic sea ice cover (SIC) for winters (DJF) from 1979–2016. Four key sea regions (black boxes) are Baffin Bay, Barents-Kara Seas, Okhotsk Sea and Bering Sea. The small region in red box is Greenland Sea. (b) Regression pattern of the detrended winter 500-hPa geopotential height (contours) and surface atmosphere temperature (SAT: shading) anomaly against the detrended DJF mean SIC anomaly across the whole Arctic during 1979–2016. The dotted areas represent values that are above the 95% confidence level based on a two-sided Student’s t test.
Atmosphere 09 00331 g001
Figure 2. Regression patterns of the detrended winter 500-hPa geopotential height (contours, unit: gpm) and surface atmosphere temperature (SAT, shading, unit: K) anomaly against the detrended DJF mean SIC anomaly (multiplied by −1) over region (a) Baffin Bay, (b) Greenland Sea, (c) Barents-Kara Seas, (d) Okhotsk Sea and (e) Bering Sea during 1979–2016. The dotted areas represent values that are above the 95% confidence level based on a two-sided Student’s t test.
Atmosphere 09 00331 g002
Figure 3. Percentage frequency of blocking as a function of longitude for winters from 1979–2016. GB, NAB, UB and PB represent Greenland blocking, North Atlantic blocking, Ural blocking and Pacific blocking, respectively.
Atmosphere 09 00331 g003
Figure 4. High (blue circles) and low (orange circles) regional averaged winter SIC for regions Baffin Bay, Barents-Kara Seas, Okhotsk Sea and Bering Sea. The regional mean SIC time series are all detrended and normalized. Large (small) blue circles represent the winters with SIC higher than 0.5 (0.0) standard deviation. Large (small) orange circles represent the winters with SIC lower than −0.5 (0.0) standard deviation.
Atmosphere 09 00331 g004
Figure 5. Composite of the frequency percentage of blocking as a function of longitude for high and low SIC in regions (a) Baffin Bay, (b) Barents-Kara Seas, (c) Okhotsk Sea and (d) Bering Sea. Solid (dashed) lines represent winters with SIC higher (lower) than 0.5 (−0.5) standard deviation during 1979–2016. GB, UB and PB-W and PB-E represent Greenland blocking, Ural blocking, Western Pacific blocking and Eastern Pacific blocking, respectively. Orange lines mark the regions with a significant difference for blocking frequency between high and low SIC winters. Dashed lines outside the gray shading indicate that the blocking frequency differences in this area between high and low SIC winters are statistically significant at the 95% confidence level in a Monte Carlo test.
Atmosphere 09 00331 g005
Figure 6. Composite of the blocking events from lag −2 to lag 2 for (a,e) GB, (b,f) UB, (c,g) PB-W and (d,h) PB-E. (ad) represent the composites of the 500-hPa geopotential height (contours, unit: gpm) and surface atmosphere temperature (SAT, shading, unit: K) anomaly; (eh) represent the composites of the SIC anomaly distribution. The dotted areas represent values that are above the 95% confidence level based on a two-sided Student’s t test. The lag 0 day represents the peak day (maximum amplitude) during the life cycle of a blocking event.
Atmosphere 09 00331 g006
Figure 7. Composites of the regional blocking events from lag −2 to lag 2 days for (a) surface downward IR anomaly, (b) precipitable water anomaly, (c) 850-hPa horizontal temperature advection anomaly, (d) sum of surface sensible and latent heat flux anomaly and (e) 10 m wind vector. The dotted areas represent values that are above the 95% confidence level based on a two-sided Student’s t test. Black boxes represent four key SIC regions. In (e), only regions within black boxes are plotted. The units are W m−2 in (a,cf) and kg m−2 in (b).
Atmosphere 09 00331 g007aAtmosphere 09 00331 g007b
Figure 8. Standardized time series of the composite regional averaged SIC (blue lines), SAT (orange lines), PWA (green lines), downward IR (purple lines) and 850−hPa horizontal temperature advection (dashed purple lines) anomaly from lag −25 to lag 25 of blocking events for (a) GB, (b) UB, (c) PB−W and (d) PB−E events. The averaged regions are Baffin Bay, Barents-Kara Seas, Okhotsk Sea and Bering Sea for (ad), respectively.
Atmosphere 09 00331 g008
Figure 9. Regional averaged surface energy flux for regions Baffin Bay, Barents-Kara Seas, Okhotsk Sea and Bering Sea during the blocking life cycle from lag −5 to lag 5. The blue box denotes the surface downward IR, the orange box denotes sensible and latent heat (SLH) flux, the gray box denotes the 850-hPa horizontal temperature advection flux and the yellow box denotes the adiabatic heating/cooling induced by vertical velocity. The value at the top of each box indicates the percentage of its component with respect to the total surface energy flux. The number in the bottom line for each region means the percentage of the cumulative decline in sea ice during the lag −5 to lag 20 days with respect to the lag −25 to lag 25 days according to Figure 8 (blue line).
Atmosphere 09 00331 g009
Figure 10. Schematic diagram of the physical process by which the blocking circulation affects the regional sea ice decline. At the surface (bottom layer), the red (blue) shading represents a positive (negative) SAT anomaly. The streamlines represent the blocking circulation, which is a deep system from the surface to the top of the troposphere. Other processes are indicated in the figure.
Atmosphere 09 00331 g010
Table 1. Blocking events in each region for winters from 1979–2016 associated with their total blocking days, mean duration (days) and strength (m (deg lat)−1).
RegionBlockingEvent NumberTotal DaysDurationStrength
GreenlandGB552524.68.6
Ural MountainsUB5627854.2
Western PacificPB-W431673.99.6
Eastern PacificPB-E904194.76.8