Article

Separation of Upslope Flow over a Plateau

1
Faculty of Civil and Environmental Engineering, Technion—Israel Institute of Technology, Haifa 32000, Israel
2
Department of Civil and Environmental Engineering and Earth Sciences, University of Notre Dame, Notre Dame, IN 46530, USA
3
Department of Applied Physics, Eindhoven University of Technology, Eindhoven, 5612, The Netherlands
4
US Army Research Laboratory, Battlefield Environment Division, White Sands Missile Range, NM 88002, USA
5
College of Water Resources & Civil Engineering, China Agricultural University, Beijing 100083, China
6
Beijing Engineering Research Center of Safety and Energy Saving Technology for Water Supply Network System, Beijing 100083, China
7
Department of Aerospace and Mechanical Engineering, University of Notre Dame, Notre Dame, IN 46530, USA
*
Author to whom correspondence should be addressed.
Atmosphere 2018, 9(5), 165; https://doi.org/10.3390/atmos9050165
Submission received: 5 February 2018 / Revised: 15 April 2018 / Accepted: 27 April 2018 / Published: 30 April 2018
(This article belongs to the Special Issue Atmospheric Processes over Complex Terrain)

Abstract

:
A laboratory study was conducted in order to gain an understanding of thermal convection in a complex terrain that is characterized by a plateaued mountain. In particular, the separation of upslope (anabatic) flow over a two-dimensional uniform smooth slope, topped by a plateau, was considered. The working fluid was homogeneous water (neutral stratification). The topographic model was immersed in a large water tank with no mean flow. The entire topographic model was uniformly heated, and the width of the plateau, the slope angle, and the heating rate were varied. The upslope velocity field was measured by the Particle Tracking Velocimetry, aided by Feature Tracking Visualizations in order to detect the flow separation location. An analysis of the resulting flow showed a quantitative similarity to separating the upslope flow over steeper slopes, in the absence of a plateau when an effective angle that incorporates the normalized plateau width, the slope length, and the geometric slope angle, was used. Predictions for the dependence of the separation location and velocity on the geometry and heat flux were presented and compared with the existing data.

1. Introduction

Complex terrain, which includes slopes, valleys, canyons, escarpments, gullies, and buttes covers about 70% of Earth’s land surface [1]. Many of the urban areas have been built in complex terrain because of its association with water resources. Slope and valley flows are important characteristics of complex terrain in the absence of synoptic effects, with downslope (katabatic) and down valley flows occurring at night, and upslope (anabatic) and up valley flows occurring during the day [2,3]. During the night, the downslope winds blow through the gaps and canyons [4], which separate out from the slope as intrusions [5], and collide with each other. During the morning transition, when the nocturnal stable boundary layer breaks down and the daytime convective boundary layer is developed, the downslope flow reverses to form an upslope flow, as a result of the heating of the slope. The vorticity of the upslope flow is countered by the baroclinic generation of vorticity (baroclinic torque), which facilitates flow separation [6]. In the case of flow separation, a thermal plume is formed, and deep convective clouds can often be observed directly over the mountain peak [7,8].
In complex terrain weather prediction, the excessive precipitation over steep and high mountains, in both mesoscale and climate models, has been attributed to the difficulties of parameterizing flow separation over sloping boundaries, in particular the sub-grid heat ventilation that is separated by upslope flows [9]. The combination of an overestimated heat flux and excessive moisture transport leads to false precipitation predictions. In the context of urban fluid mechanics, the presence or absence of flow separation appears to determine the fate of pollution. The meteorological and chemical measurements that were made during the 1997 Azteca experiment over the southern mountain range of Mexico City, the largest metropolitan area in North America, with a population of about 20 million [10,11,12,13], indicated that the upslope flows transported pollutants out of the city to higher elevations during the day, and the downslope flows transported a portion of the pollutants back towards the city at night [14,15]. Further investigation showed that the pollutants had lofted to regional flow or formed elevated recirculating flows within the convective boundary layer when the flow separated from the slope [3,5,16,17,18,19,20], and when it did not, the pollutants typically returned to the urban valley at night [3,21]. The complex terrain therein can be approximated by a truncated structure with a slope and a plateau [10,11,12,13].
Despite its importance, research on the upslope flow separation over sloping boundaries has received little attention [19,22]. Though laboratory studies are advantageous, as they allow repetitive and well controlled measurements of high accuracy in order to deduce the important relations, only a few studies have been performed in such a controlled environment [16,17,23]. Recently, Hocut et al. [7] conducted laboratory experiments on flow separation over smooth, heated slopes. The study was performed without background stratification, which represents the case of the upslope flow after the morning transition. Three flow regimes were identified in their study. In the first regime, at slope angles β larger than a critical value of β c 20 ° , the separated flow generated a plume—a warmer bulk of fluid, rising inside colder surrounding fluid—that was completely fed by the upslope flow. For this regime, the location of the separation point was successfully predicted by a model, which was based on the balance between the opposing vorticities of baroclinicity and shear. The second regime occurred when   10 ° < β β c , in which case the rising plume was fed by both the upslope flow and the entrainment of ambient fluid. In the third regime, β 10 ° , the plume had almost entirely covered the slope, like a buoyant plume emanating from a source of finite dimensions.
Hocut et al. [7] focused on the flow over a uniform smooth slope. Terrain in nature, however, is more complex, as the natural topography includes breaking slopes, convex/concave slopes, roughness gradients because of the varying vegetation density, slopes topped with a plateau, and more. Hence, the next logical step would be to moderately increase the complexity of the terrain that was used by Hocut et al. [7], toward a representation of a more realistic case. To this end, this paper considers the case of a uniformly smooth slope with a plateau at the top, as observed in the natural settings [10]. The focus of this study is on the separation location and the mean upslope velocity at the point of separation. Section 2 describes the details of the experiments. Section 3 presents the results of the separation length and separated velocity as a function of the plateau width, slope angle, and buoyancy flux. Section 4 summarizes the major findings.

2. Experiments

The experiments were carried out using a model of the slope and plateau setup, which was situated in a water tank. Both the slope and the plateau surface were heated using electrical heaters, which simulated the natural solar heating of the slope and plateau land surface on a clear sky day. The same glass tank that was used by Hocut et al. [7], with a rectangular cross-section (125 cm × 30 cm), was used here. It was filled with deionized water to a depth of 35 cm. To ensure the two-dimensionality (2D) of the flow, the heat leakage to ambient air was minimized using water at room temperature and by encasing the tank with 5 cm thick Styrofoam thermal insulation, and by adopting long circulation stabilization times. A removable window in the insulation provided optical access to the flow. Two custom manufactured 15.6 cm × 30 cm heating elements were used to heat the slope and plateau. Both units consisted of densely packed heating wires that were embedded in silicon rubber, which constituted a smooth upper surface. The units were fully insulated on the bottom. Constant DC current was used in order to heat up the heating units, which provided heat fluxes of up to 9.6   kW   m 2 . The heat flux was estimated as Q = I V / A , with V being the applied voltage, I being the applied DC current, and A being the surface area of a single heating unit. The calibration techniques that were described in Hunt et al. [22] were used to verify this estimate.
A schematic representation of the experimental design is shown in Figure 1. The slope–plateau configuration was placed abutting the wall of the tank. A vertically placed acrylic glass (Polymethyl Methacrylate [PMMA]) plate, which isolated the flow in the cavity between the plate and end wall, was used to vary the plateau width. As in Hocut et al. [7], the no-slip condition at the wall played a lesser role in the overall plume dynamics, and hence, the flow separation was assumed to be unaffected by the vertical wall.
Prior to each experiment, the water tank was allowed to settle for two hours in order to allow the residual motion to decay, after which a prescribed current was applied to the two heating units. Four slope angles, β = 15 ° ,   25 ° ,   35 ° , and 45 ° , and five plateau widths, D = L 0 , 3 4 L 0 , 1 2 L 0 , 1 4 L 0 , and 0 , were used, where L 0 = 15.6 cm was the full width of the heating unit and hence the width of the slope. The heat flux was varied between 0.50   W   m 2 and 9.6   kW   m 2 .
As in the work of Hocut et al. [7], the flow velocities were measured using the Particle Tracking Velocimetry (PTV). A vertical cross-section of the flow in the middle of the tank was illuminated by a 3   mm thick argon laser sheet (wavelength ~532 nm) through a vertical slit in the insulation. Orange polyethylene microspheres, which were 90–106 μm in diameter and had a density of ρ 1 g cm−3, were used to seed the flow. The particle motion was recorded at 5 frames per second (fps), using a 2 Megapixel CCD camera, that was positioned in front of the observation window. The recorded videos were converted into individual frames and processed by in-house-developed PTV software. In post processing, the image quality was first improved by applying an image enhancement and a spatial filter. The image enhancements included adjusting the contrast and filtering the possible noise, while the spatial band-pass filter was applied to filter out any features of the dimensions below and above those of the used particles. As a result, the PTV algorithm was fed with images of a high contrast, of low noise level, and that included only the seeded particles on a black background; this process was used to ease the identification of each particle in the frame and to prevent false detections. Next, the individual particles were detected, which facilitated the reconstruction of 2D particle tracks. Afterwards, the velocity components were calculated using the track information. Additional PTV algorithm details can be found in Hocut et al. [7] and Liberzon and Shemer [24].
Similar to Hocut et al. [7], the separation distance, L s , was determined by visually examining the PTV particle tracks and identifying the locations of the first visible separating track. In addition, the Feature Tracking Visualizations (FTV) that provided a time history of the flow, by color mapping and animating the particle tracks according to the track length and/or velocity, were used to verify, and if necessary, correct the determined separation point location. In unison, this method allowed for the detection of L s with confidence, which will be discussed further in Section 3.1. The mean along the slope velocity at the point of separation, U s , was then obtained by ensemble averaging the velocities that were near the separation point. The measurement uncertainties were estimated using the technique of Kline and McClintock [25].

3. Results

3.1. Separation Length

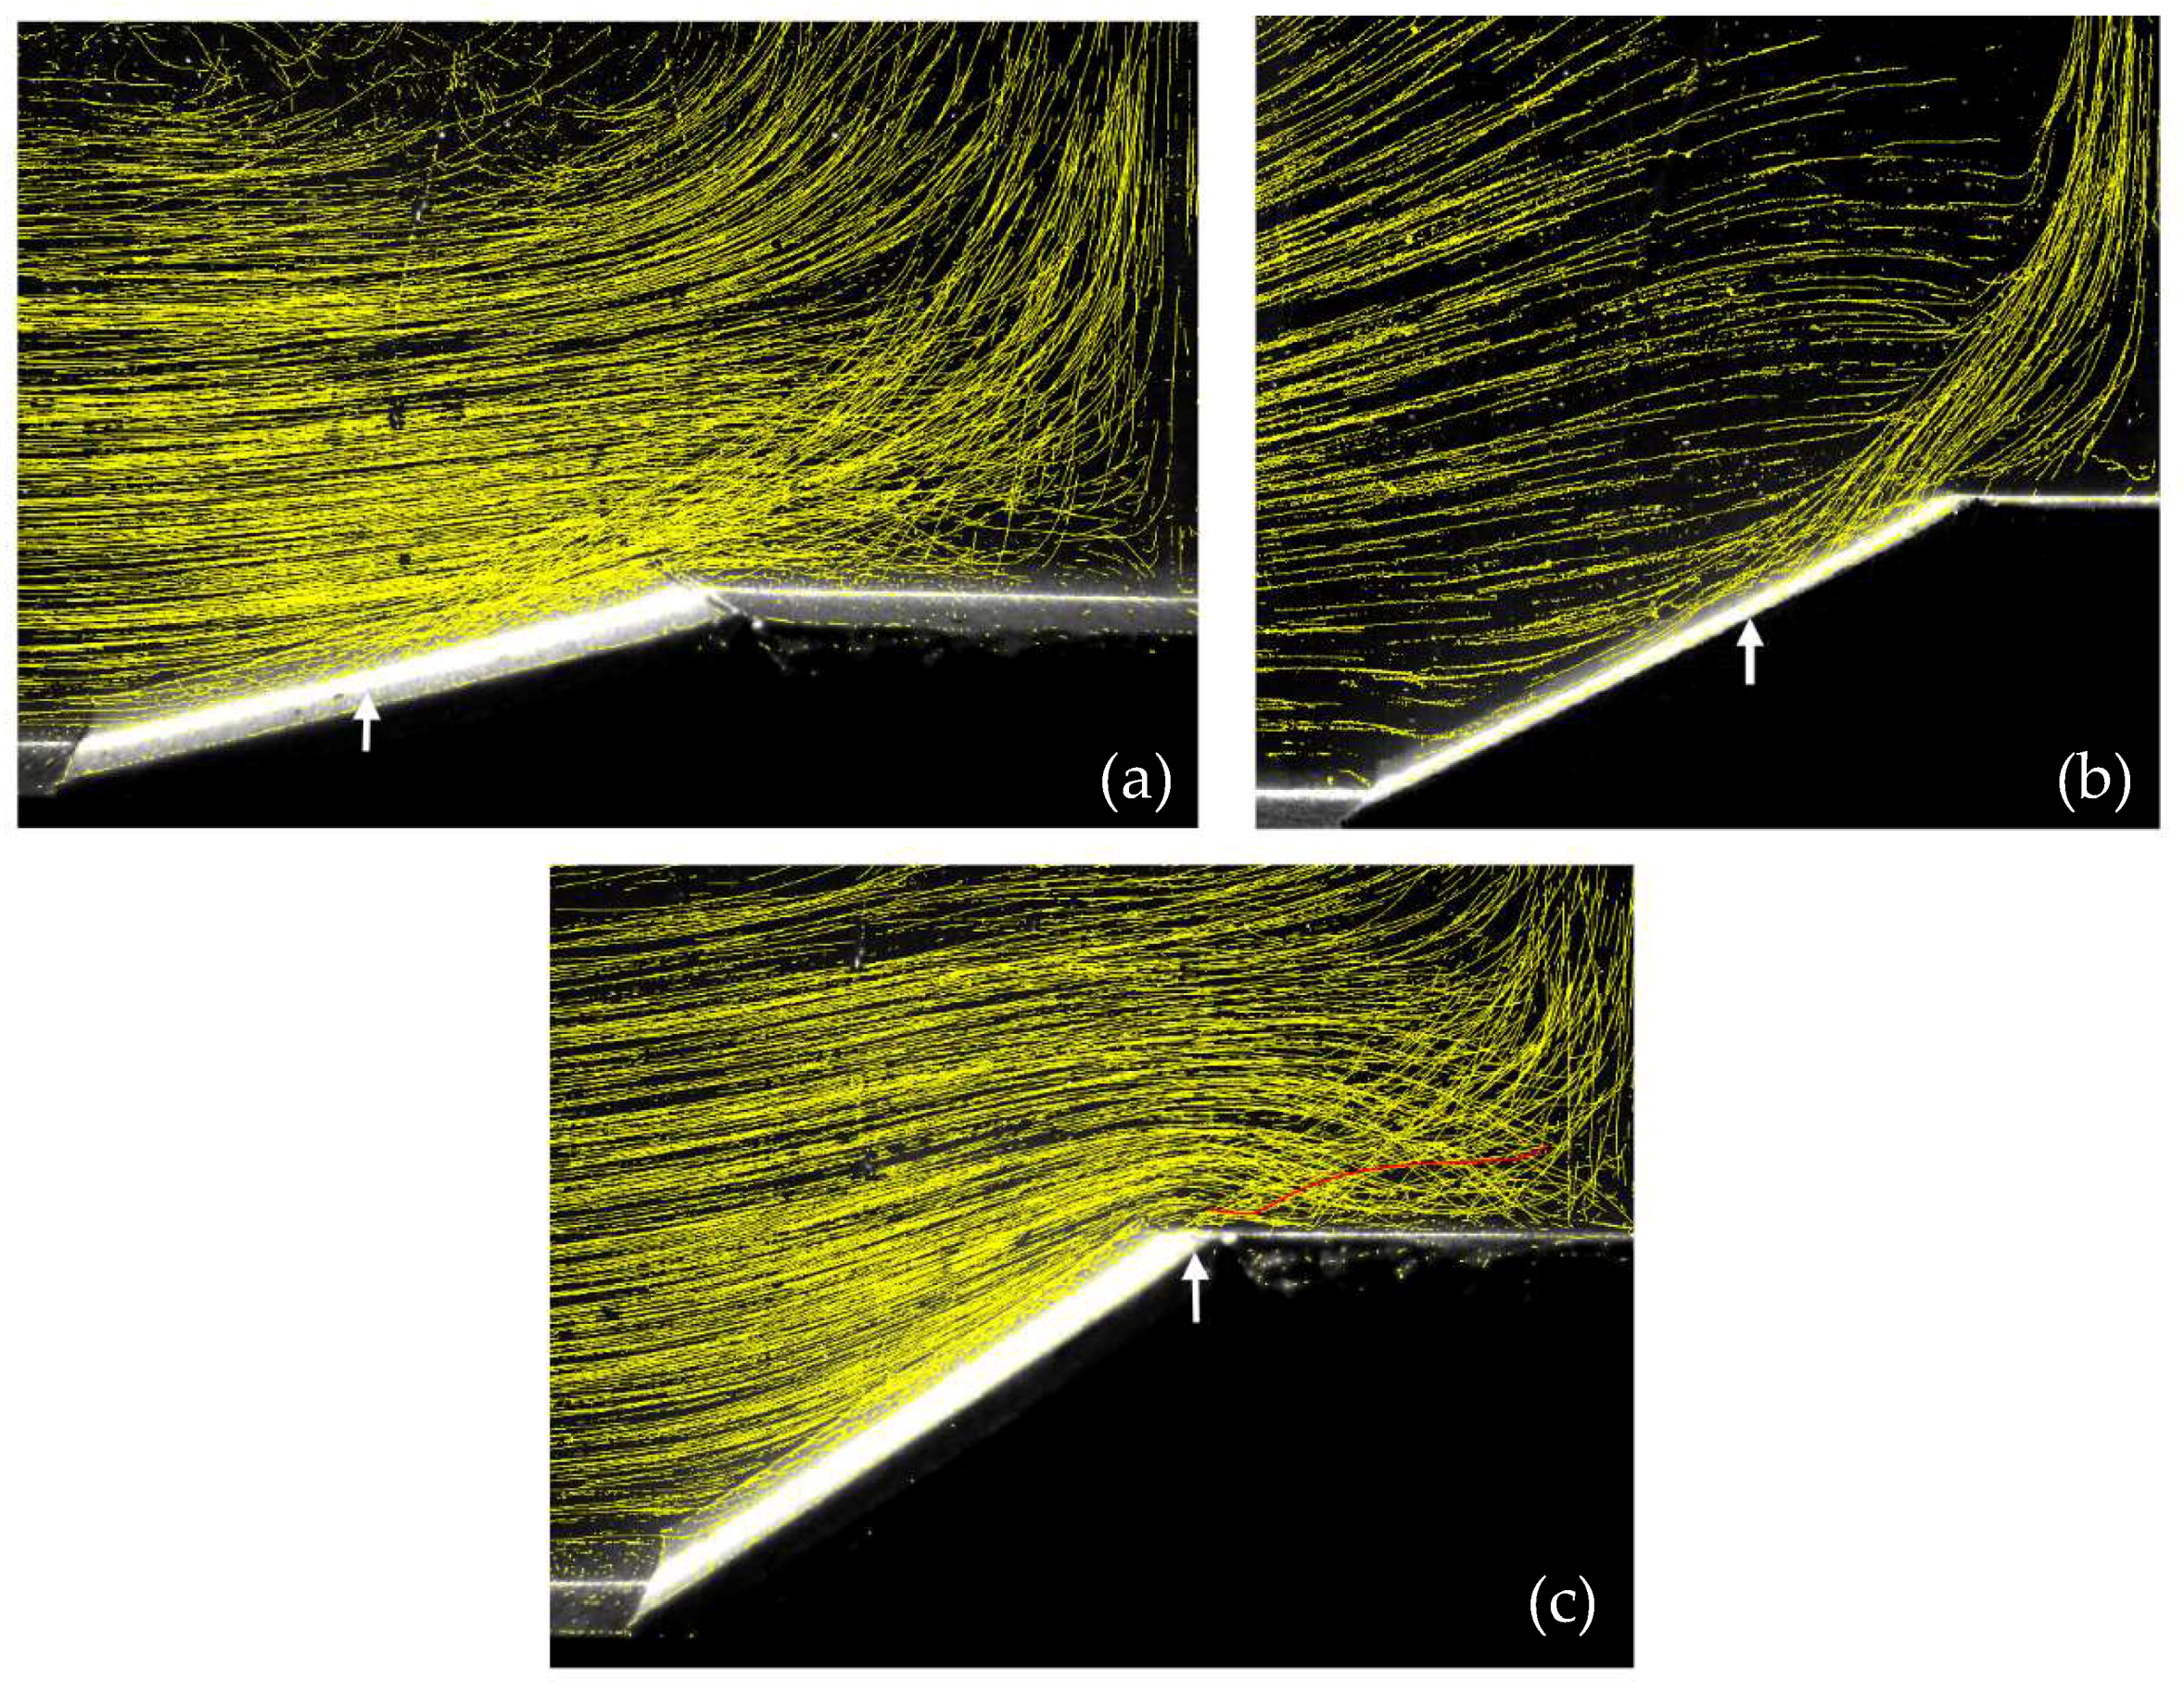
After the initiation of heating, small-scale convective roll structures appeared on the slope and breakdown, to form a well-defined upslope flow that eventually separated and rose vertically to the water surface as a plume. Upon reaching the upper boundary (i.e., the water surface), the plume was deflected and propagated horizontally as an intrusion towards the distant end wall. This transient period had a maximum duration of about 200   s and varied based on the experimental parameters, (i.e., longer for the lower buoyancy fluxes). The transition period was followed by a quasi-steady period of 80–130 s, depending on the set buoyancy flux and slope angle values, during which the upslope flow and the rising plume experienced minimal end wall influence, as the intrusion was propagated. The typical quasi-steady period lasted for about five minutes, with small variations based on the prescribed buoyancy flux and plateau width feeding the plume after the detachment of the upslope flow. The higher values of the buoyancy flux and plateau width formed larger plumes, which resulted in shorter quasi-steady periods. The measurements were performed for 80–120 s (ts) during this quasi-steady period and were concluded when the plume intrusion reached the end wall. The quasi-steady upslope flow was achieved at a range of buoyancy fluxes, q 0 = g α Q / ρ 0 C p , which are elaborated in Table 1. Here, ρ 0 was a reference density, α was the thermal expansion coefficient, and C p was the specific heat capacity. As observed by Hocut et al. [7], below this range of q 0 , the flow either developed eddies that rolled up the slope (similar to laminar convection on slopes [26]) or formed a counterclockwise rotating single stationary eddy, of a size that was approximately equal to the depth of the tank. When it was quasi-steady, the upslope flow was parallel to the slope, with the entrainment at the top of the upslope boundary layer, and the flow was separated at a distance, L s , from the bottom. Important experimental parameters, including the buoyancy flux and the quasi-steady period length, are listed in Table 1.
The separation length, L s , was detected by the method that was described in the previous section. Figure 2 shows the PTV track maps of three example experiments, with white arrows marking the separation point. The error of the separation distance detection was estimated as the distance that was travelled by a particle during three consecutive frames, described by Hocut et al. [7], that is, Δ L s = ± 3 Δ t U s , Δ t being the time between two frames, which was the reciprocal of the frame rate (5 fps).
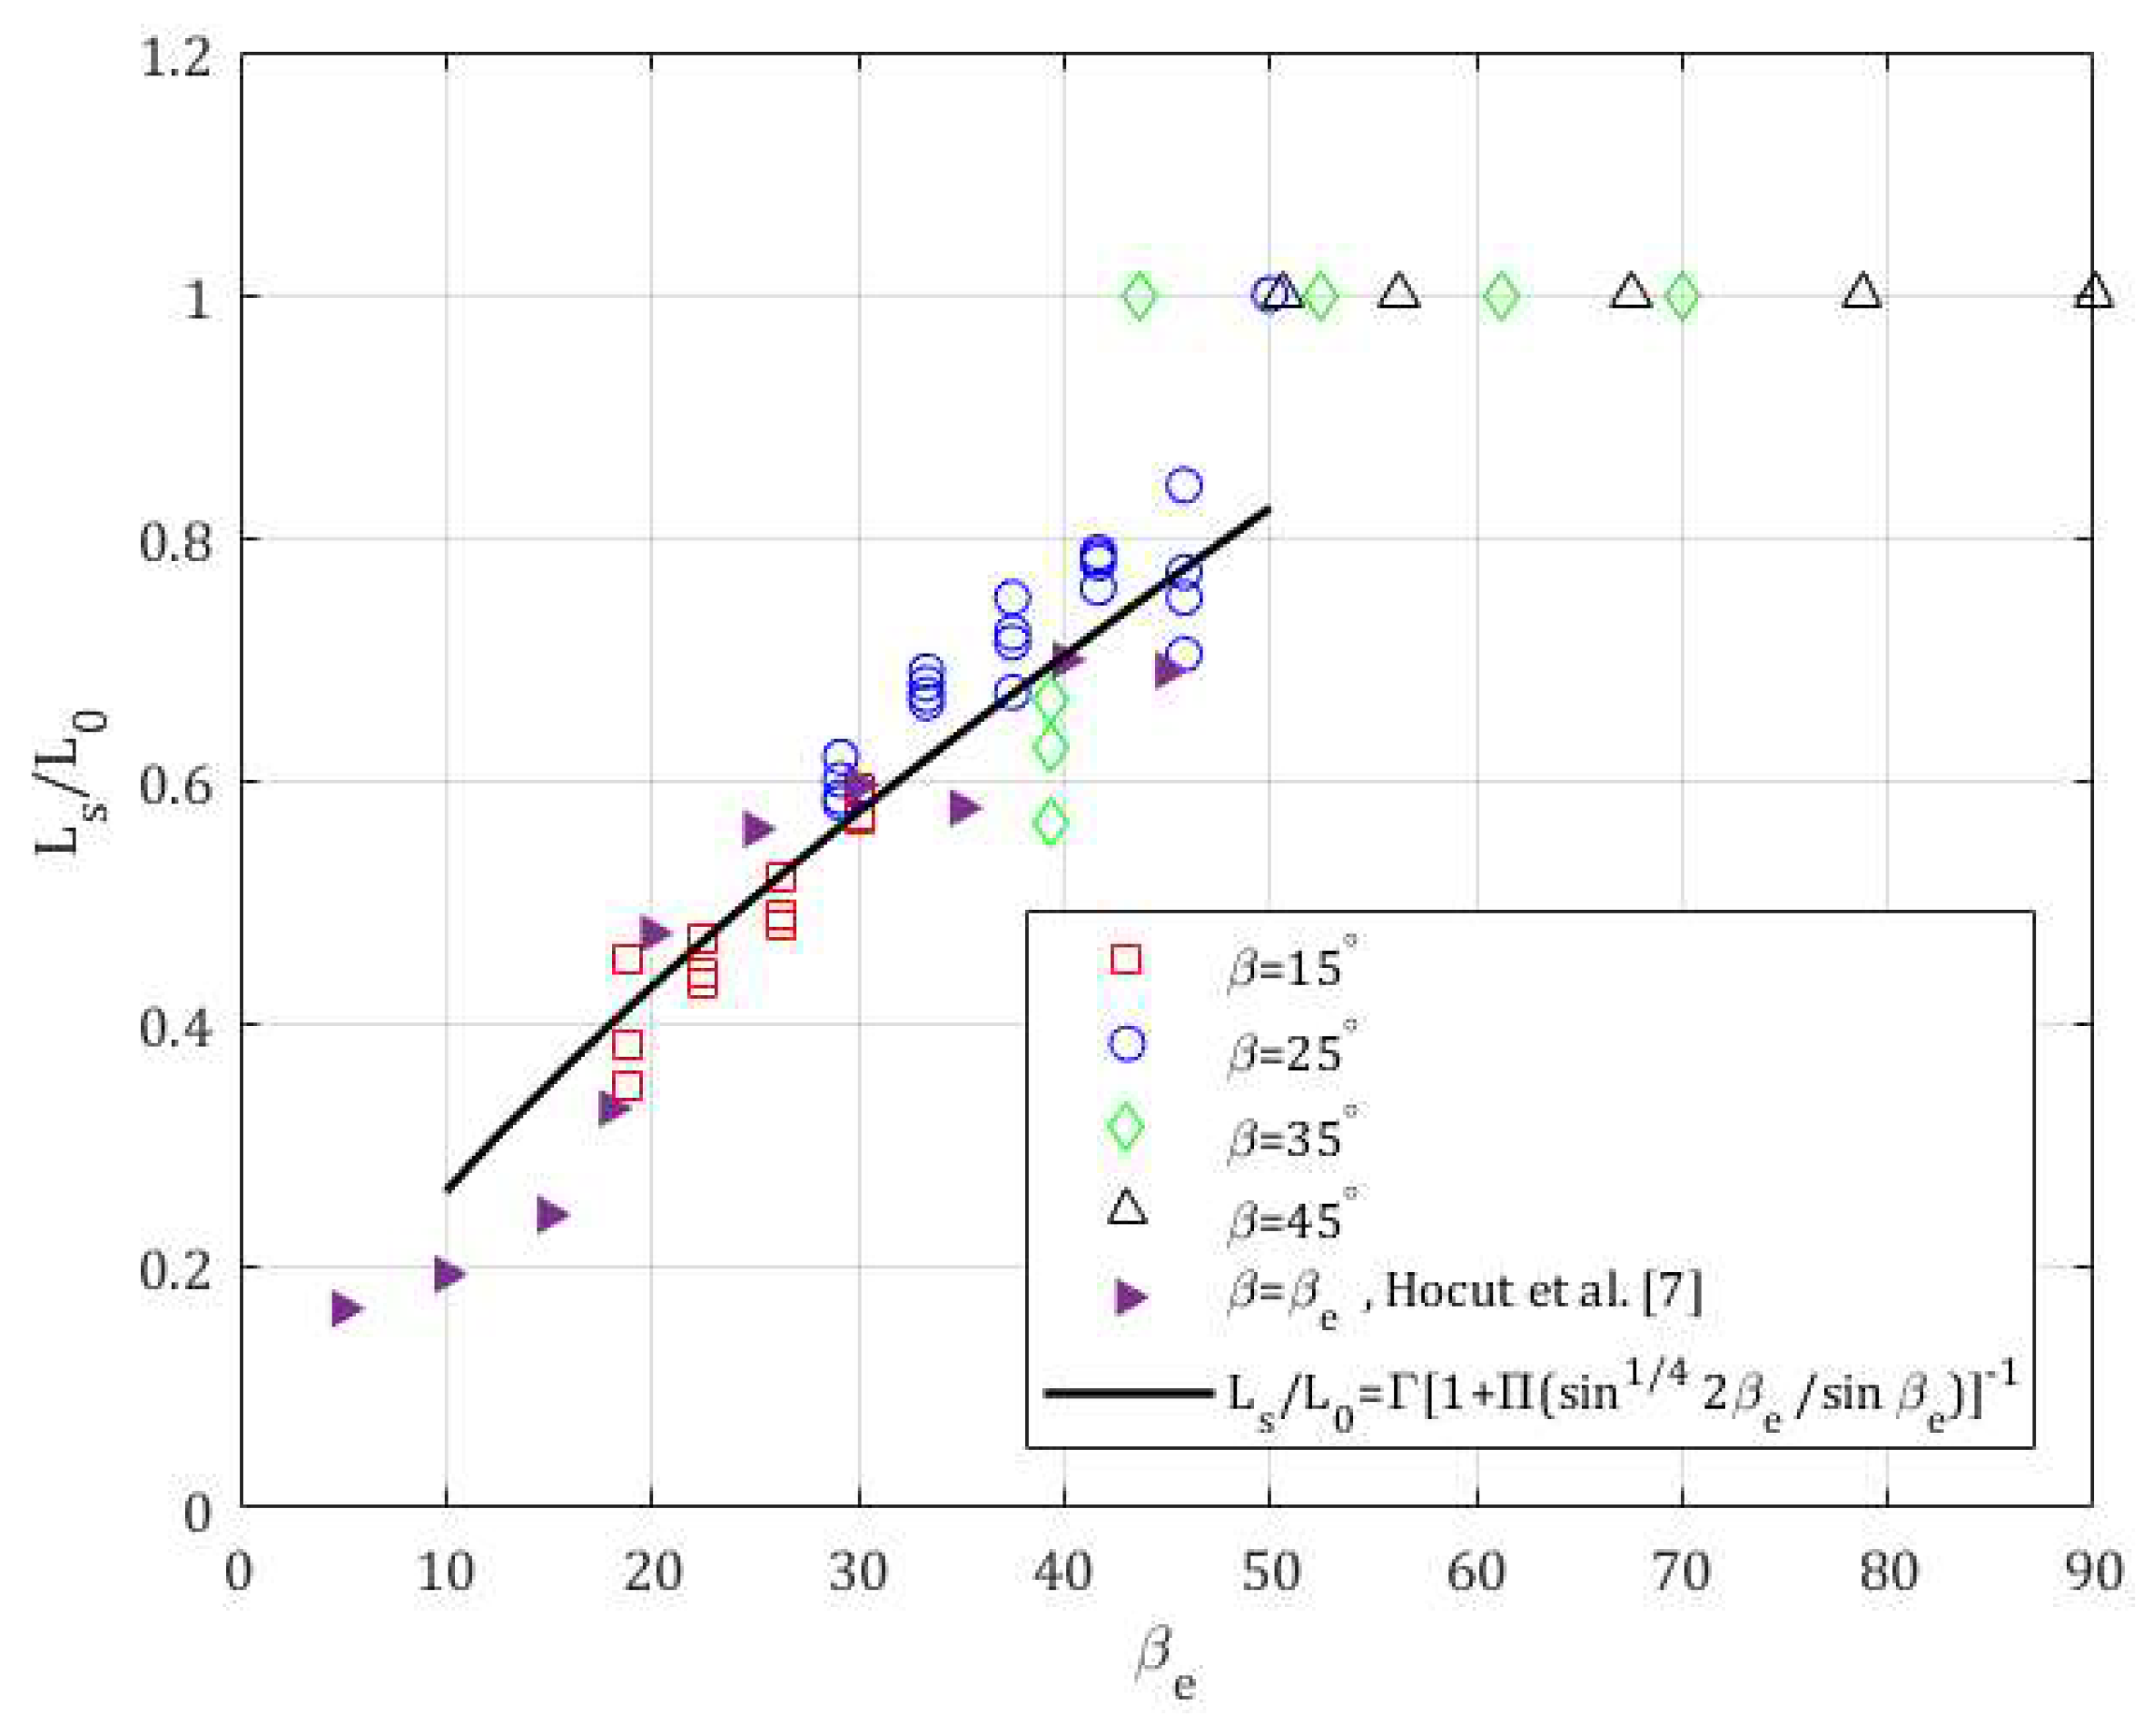
Hocut et al. [7] found that the normalized separation length L s / L 0   was independent of the buoyancy flux. They then proposed, using scaling arguments, its dependence on the geometric angle, β (see Equation. 5.8), which took the form of L s / L 0 = [ 1 + Π · ( sin 1 4 2 β / sin β ) ] 1 , where L 0   is the slope length and Π is an empirical constant. In the present work, however, it was observed that for a given slope angle, the presence of a plateau resulted in an increased separation length, compared with the case without the plateau present. Moreover, the separation length had increased with the increasing width of the plateau, mimicking the behavior of steeper slopes. Hence, an empirical effective slope angle β e = β · ( 1 + D / L 0 ) was developed in order to represent the effects of the plateau presence and width. In other words, using the effective angle, we represented the influence of a plateau that was analogous to a slope without plateau. This allowed a direct comparison of the results with the previous work of Hocut et al. [7].
Figure 3 shows the dimensionless separation distance, L s / L 0 , as a function of β e . The estimated errors of the L s / L 0 were ~ 3 5.5 % , with the error bars omitted from the figure for the sake of clarity. At least three different buoyancy fluxes were used for each prescribed angle and plateau width, and Figure 3 shows that the L s / L 0   varies only slightly for different buoyancy fluxes when the flow is quasi-steady; which indicated the Reynolds number independence, as observed in Hocut et al. [7] (see their Figure 5). The data for D = 0 was taken from Hocut et al. [7]. Therefore, L s / L 0 was taken as a constant for a given effective angle (i.e., for a combination of the geometric angle and normalized plateau width) within the experimental error. The exceptions were data obtained at the β = 35 ° slope angle, where a larger scatter was observed with variations in both the plateau width and buoyancy flux.
Next, we compared the fit of Hocut et al. [7] with the present data, in order to estimate the expected dimensionless separation length as a function of β e in the range 10 ° < β e < 45 ° . That fit was derived for the cases of no plateau, with a significant upslope flow and separation, here β was replaced by β e , as follows:
L s L 0 = Γ · [ 1 + Π · sin 1 4 2 β e sin β e ] 1 ,
where the modification of the Hocut et al. parameterization accounts for the plateau effects. After introducing an additional constant Γ , so as to allow for an extra degree of freedom for the fitting algorithm, an excellent fit was obtained using the least squares that were fitted for the tightly collapsed data ( Π = 7.4 and Γ = 8.8 ) in the range 17 ° < β e < 45 ° , which included the data taken from Hocut et al. [7] in this range. In the range 17 ° < β e < 45 ° , as was expected from dimensional considerations, the separation length L s was dependent on β e but independent on the heat flux. For β e 45 ° , the flow separation was generally suppressed and occurred at the slope apex. The fit curve was also plotted down to β e = 10 ° , as in the previous work of Hocut et al. [7]. A different behavior was observed for the slope angles that were less than 20 ° , and the comparison was less favorable for these slope angle values.
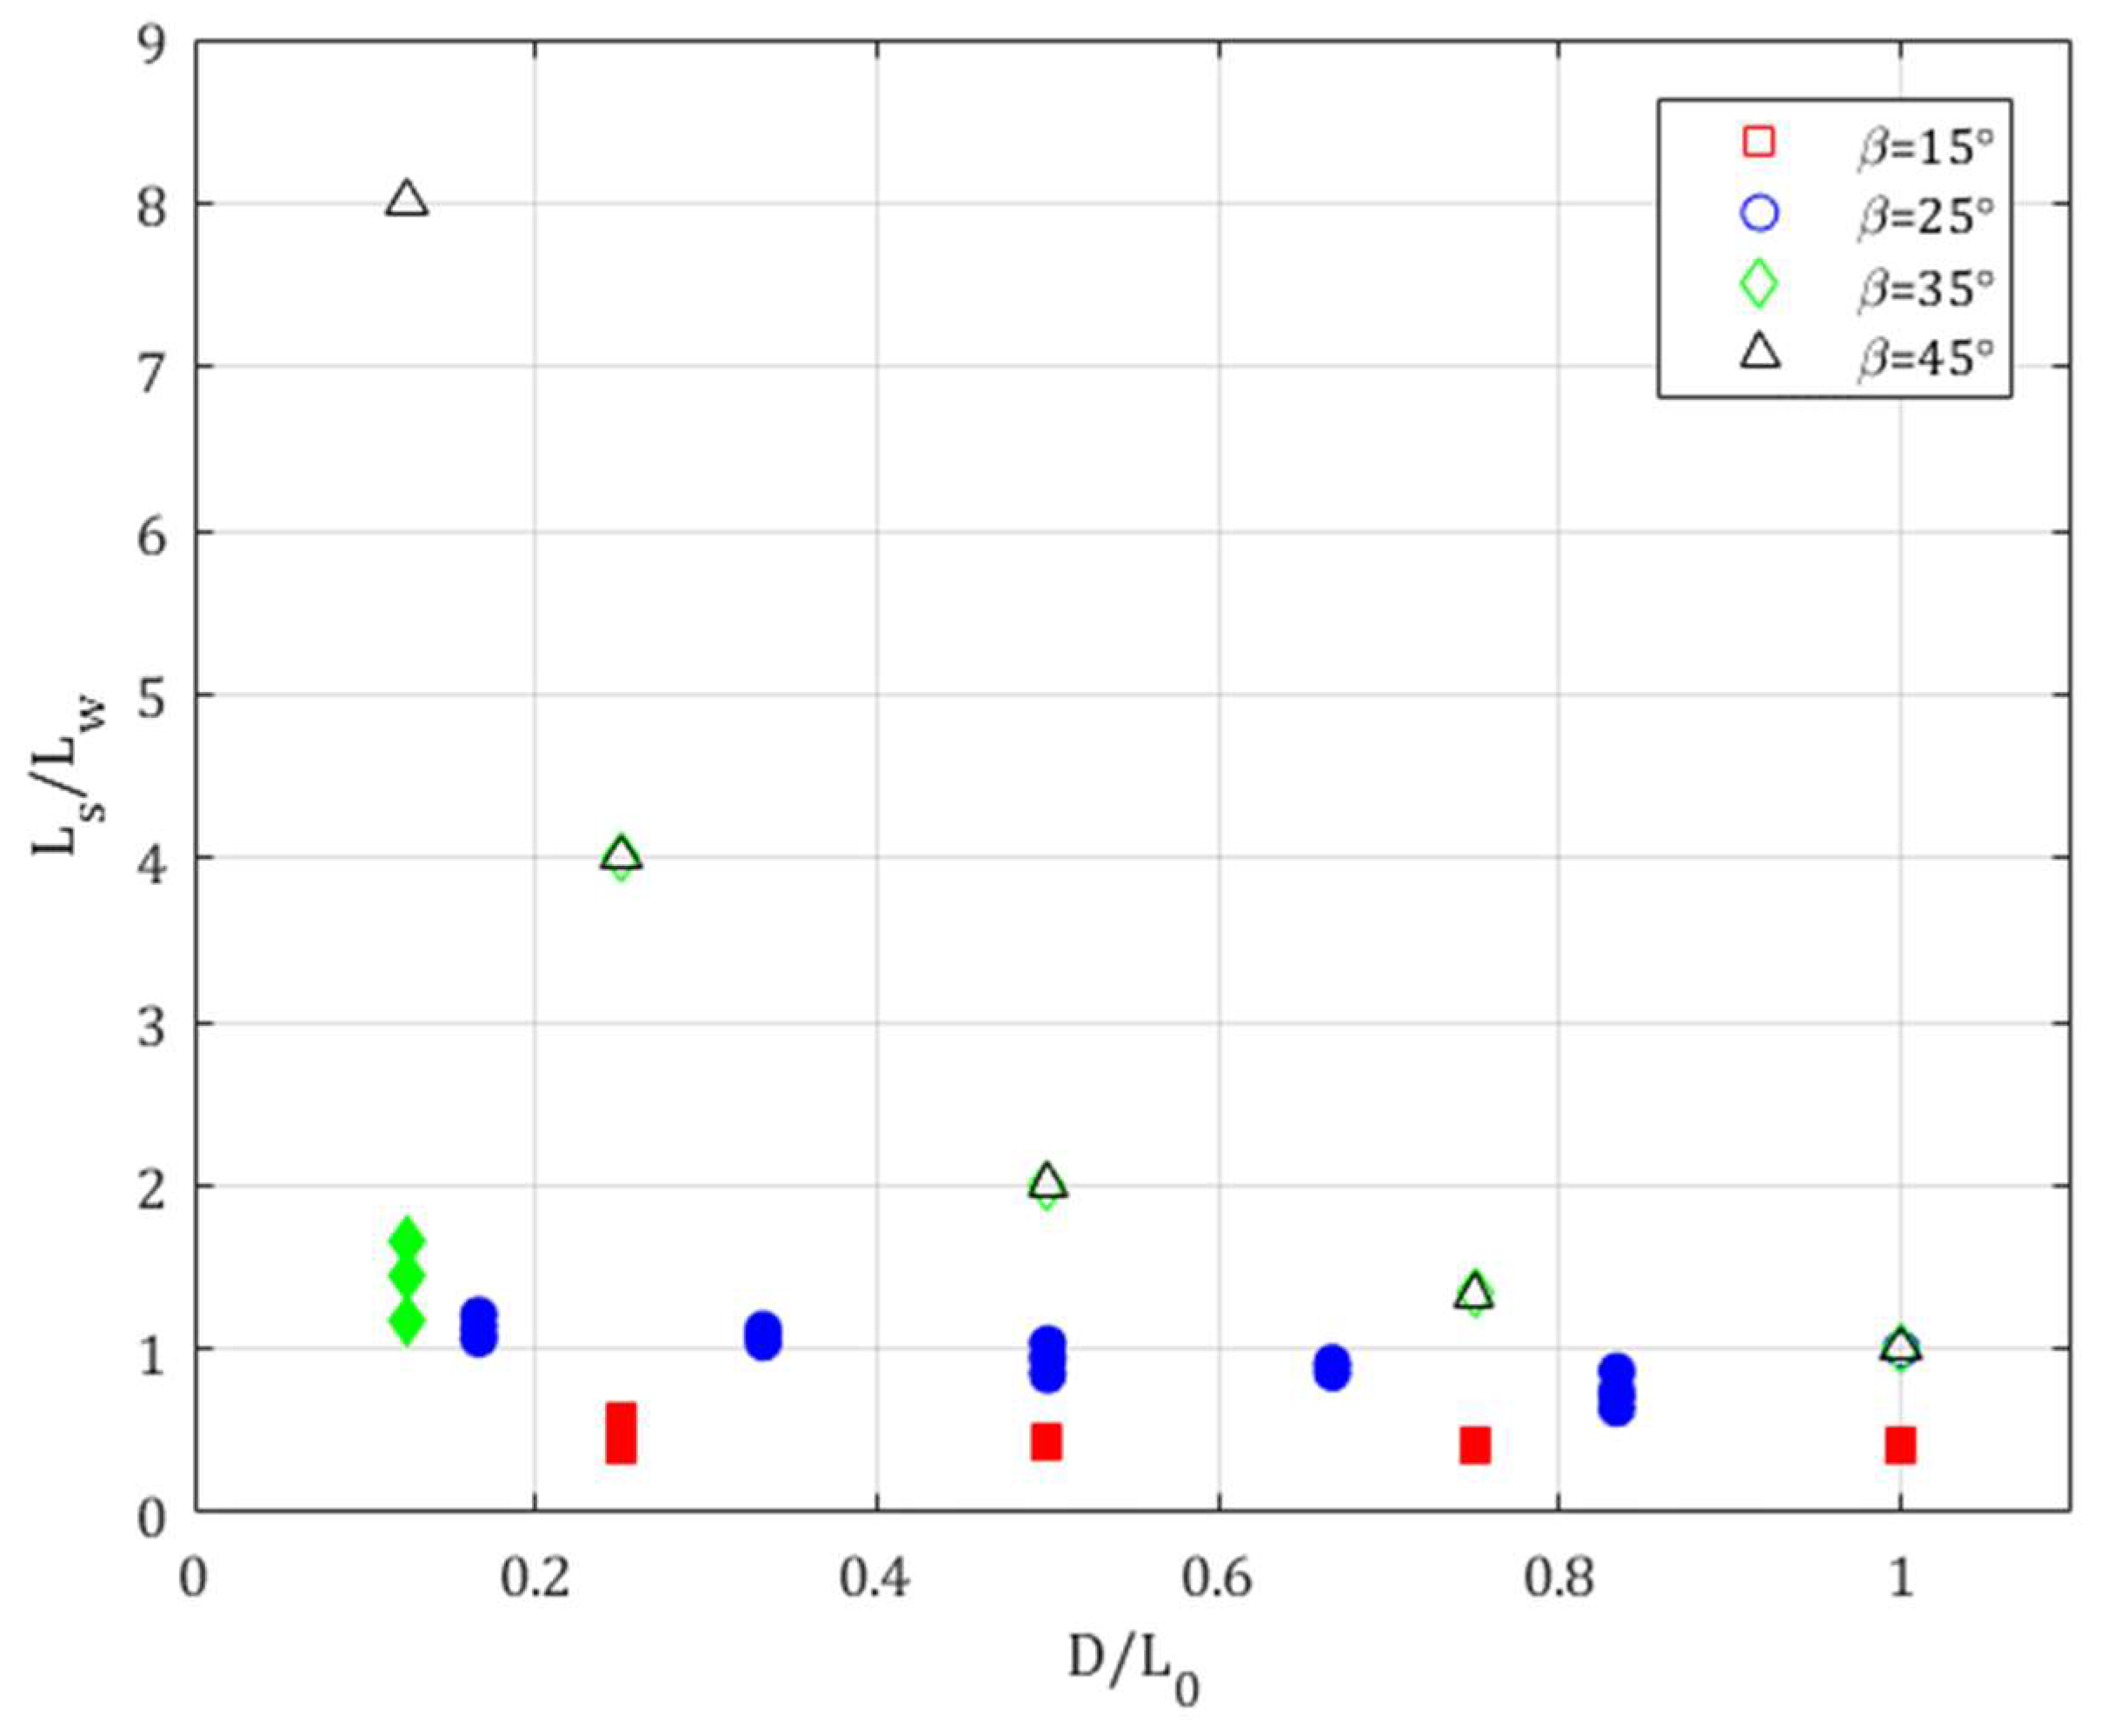
It was also interesting to note there was a sub-regime for the slope angle β   ~   15 ° , in which the fluid parcels penetrated the plume near the separation point (Figure 2c). This was very similar to the case β 10 ° without a plateau, as observed in Hocut et al. [7], where there was a substantial lateral penetration as the flow approached the case of a plume from a uniformly heated source with an finite width of L w . The scaling for the buoyancy b , vertical velocity w , and near-field entrainment velocity u e for the horizontal plume source of finite dimensions L w , driven by a buoyancy flux q 0 , were proposed by Colomer et al. [27]. For 2D horizontal sources of finite source dimensions, the analogous 2D near-field scaling becomes the following:
b ~ ( q 0 L w ) 2 / 3 L w , w ~ ( q 0 L w ) 1 / 3 and u e ~ ( q 0 L w ) 1 / 3 .
The separation distance L s can be estimated using the vertical momentum equation, by considering a balance of the buoyancy forces due to heating of the entrainment flow and the vertical inertia forces, as follows:
b   ~   D w D t   ~   u w x   ~   u e w L s   ~   α 1 w 2 L s ,
where w is the vertical velocity outside the thermal boundary layer and α 1 is the entrainment coefficient for 2D plumes (according to Rouse et al. [28], for 2D line-source plumes, α 1 0.25 ). Together, Equations (2) and (3) give the following:
L s   ~   α 1 L w ,
that should be valid for slope angles of β < 20 ° . In our case, the width of the plume was given by L w = D + ( L 0 L s ) cos β . Figure 4 shows the L s / L w ratio as a function of D / L 0 . For β = 15 ° the ratio of L s / L w is approximately constant attaining value of 0.29 , independent on the width of the plateau, and with the entrainment value α 1 0.25 . For slope angles larger than 15 ° the ratio is not constant and changes with the plateau width.

3.2. Mean Separation Velocity

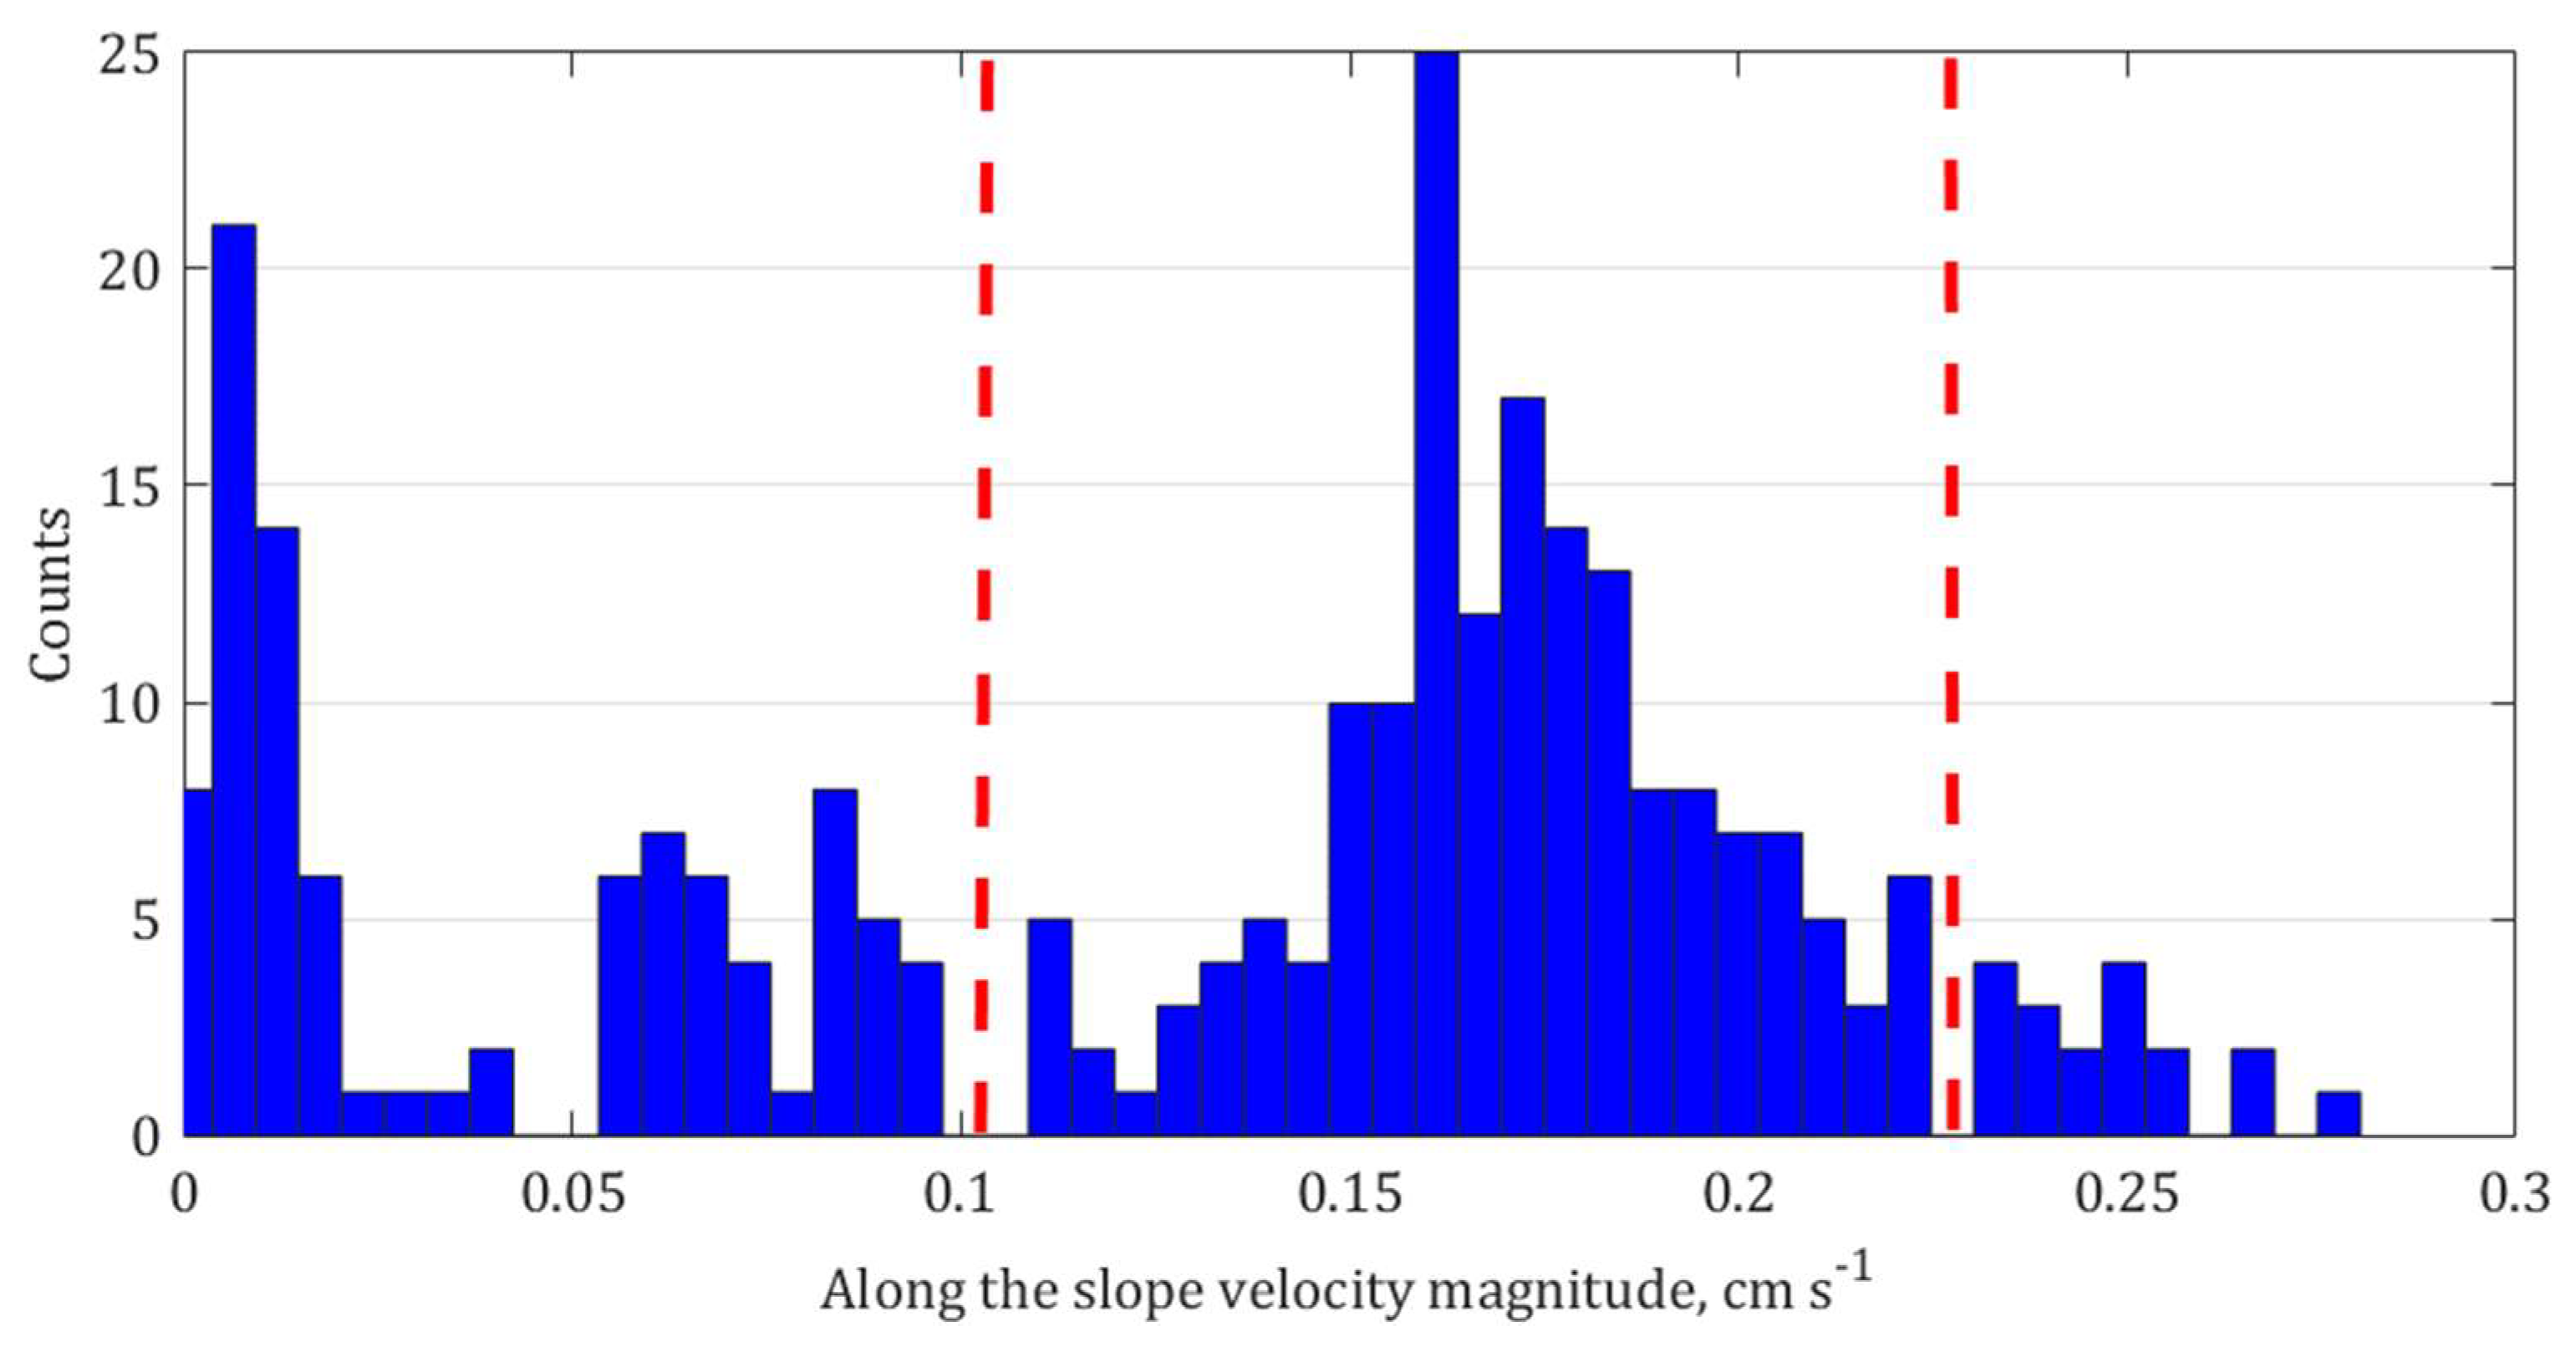
For each of the examined cases, the PTV data were used to determine the local mean upslope velocity at the separation point U s . This was done by selecting a small rectangular interrogation area ( ~ 1 × 1   cm 2 ) around the detected separation point. The area dimensions were chosen by examining the upslope velocity magnitude values distribution, and eventually the dimensions at which the distribution best resembled a normal distribution were chosen. The particle velocities were calculated in this interrogation area by dividing the digitized track lengths between two consecutive frames by Δ t . The rectangular interrogation area was placed, such that it included a small portion of the slope itself, in order to ensure that the near-slope boundary layer was included. Out of all of the velocity magnitude values that were detected in the area, only those that oriented along the slope were considered, and their distribution histograms were plotted and examined. The values that were outside of the main distribution range, low values contributed by on slope particles high values contributed by outside the BL or the erroneous detections particles, were taken out of the ensemble. A representative histogram of the calculated velocity magnitudes at the point of separation from the case β = 25 ° and D = 1 3 L 0 , is shown in Figure 5.
The local mean upslope velocity magnitude U s was then determined by averaging the remaining ensemble. The error of the mean velocity was determined by considering a particle position detection accuracy of ± 0.5 pixels, spatial resolution of 32 51 pixel cm−1, and a frame rate of 5 fps.
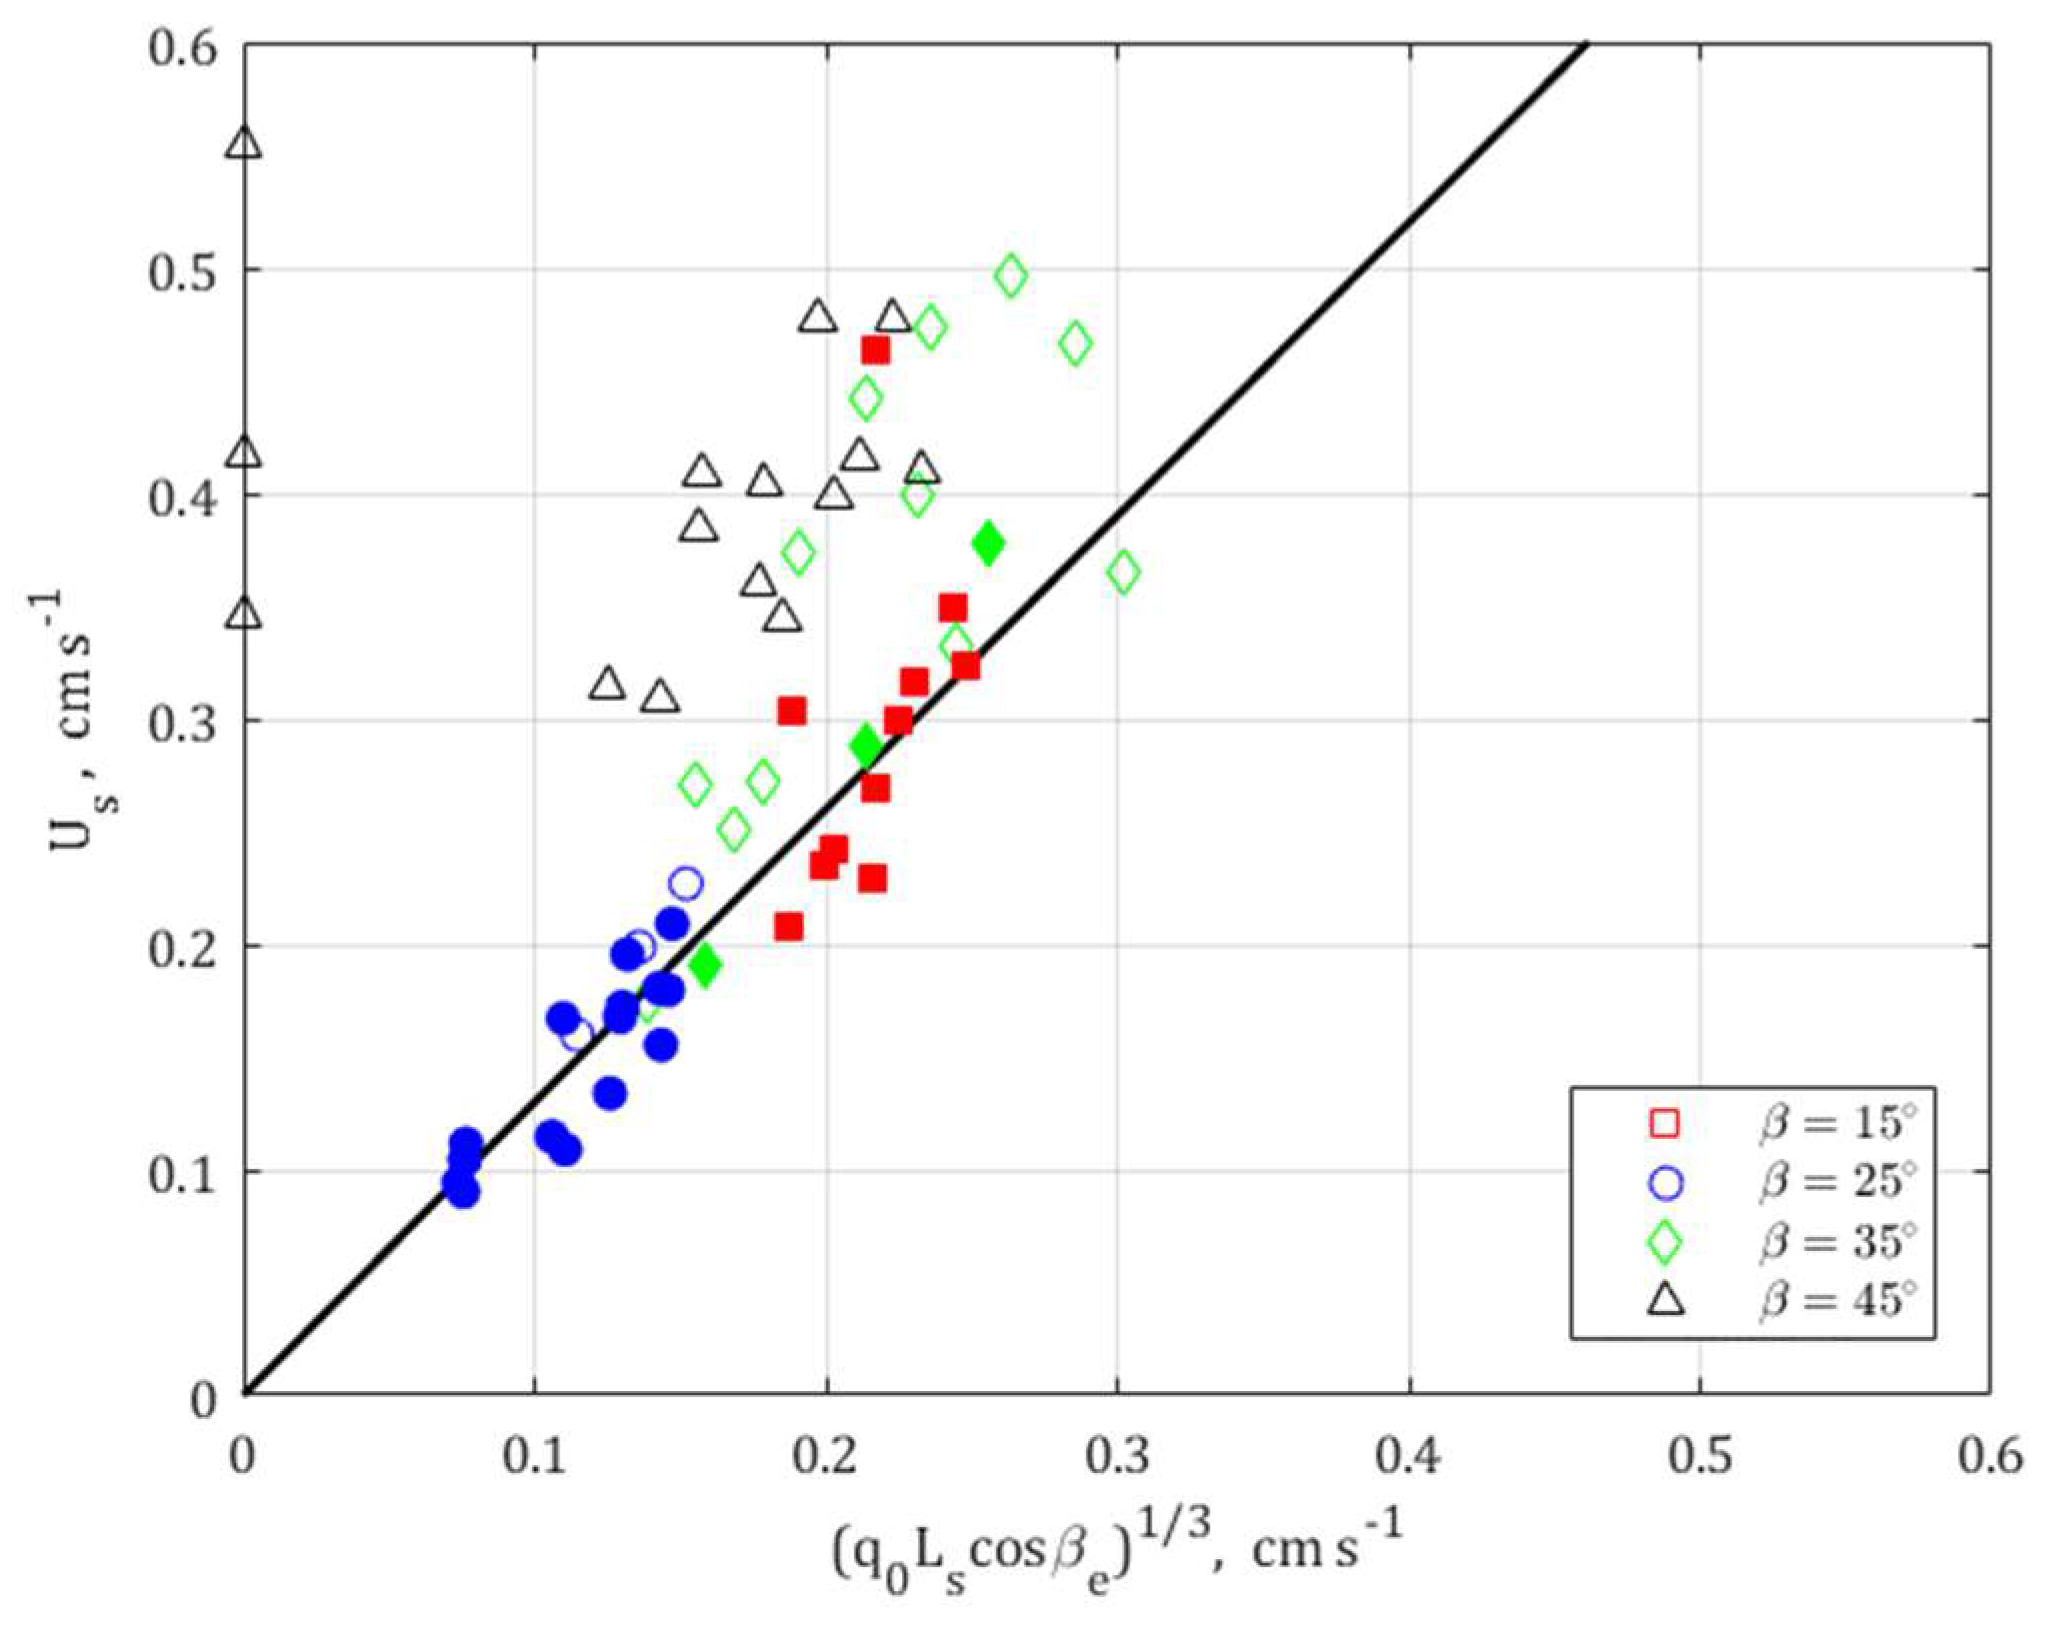
Figure 6 shows the local mean upslope velocity, U s , at the separation point. Hocut et al. [7] derived a velocity scale for the upslope velocity at the flow separation, given by the following:
U s = γ · ( q 0 L s cos β ) 1 / 3 ,
where γ is a proportionality constant. This was derived by balancing the vorticities of the baroclinic torque and the shear flow, which was estimated from the vorticity equation, and it was expected to be valid up to the flow separation point on the slope. In the present study, using the effective angle β e , a proportionality constant γ = 1.3 was found, as shown by the black line in Figure 6. The data for cases with separation before the apex followed the line accurately, while there was an evident larger scatter for cases with separation at the apex (see these cases in Figure 3).
When it was combined with the analysis in Section 3.1, the separation length L s was dependent on the geometric parameters only, while U s also depended on buoyancy flux q 0 .

4. Conclusions

The thermally driven upslope flow in the presence of a plateau was studied; more specifically, the possible separation of the upslope flow from the slope and the associated upslope velocity at the point of separation was studied. The behavior of the upslope flows, developing over natural slopes, depends on numerous topography features. Natural slopes come in a variety of shapes, such as concave, convex, varied slope angle, and more. Another factor that is present in nature is the roughness of the slope: it can be relatively uniform, moderately vary in magnitude, or exhibit a significant gradient along the slope (e.g., a forest canopy often becomes sparse with increasing altitude). Another important factor is the presence of a plateau at the apex of the slope. The diurnal heating/cooling cycle of the slope and of the plateau surface then influence the thermal circulations along the slope that form (up- and down-slope flows that are developing correspondingly during the day and night hours) under clear sky quiescent conditions. These are of significance for climate studies, local and meso-scale weather prediction models, and studies of pollution transport and prevention. This study is an extension of the previous work that was reported in Hocut et al. [7], where only the flows over smooth slopes were examined. It represents a step toward increasing the complexity of the laboratory model, in order to better represent the natural complex terrain with the addition of a heated plateau. Laboratory experiments were conducted to study the separation of the thermally driven upslope flow on a 2D slope that was topped by a plateau, which resembled the shape of a truncated pyramid. The topographical model was uniformly heated to mimic the solar heating during daytime hours. Water was used as a model fluid, and a neutrally stratified water tank provided quiescent neutral background conditions. A range of slope angles, plateau widths, and buoyancy fluxes were used for the experiments. Particle Tracking Velocimetry (PTV) and Feature Tracking Visualization (FTV) were employed in order to determine the upslope flow separation point and mean upslope velocity at the point of separation. The measurements were conducted under quasi-steady conditions with minimal end wall influence. During the experiments, the rising warmer fluid deflected at the top of the water level and was propagated away from the slope region, while the upslope flow and the separated plume were quasi-steady. Major findings are summarized below.
(1)
Given that the slope is topped by a plateau of finite width ( D ), the influence of the plateau on the upslope flow could be expressed in terms of an effective slope angle β e = β · ( 1 + D L 0 ) , where L 0 is the slope length and β is the physical slope angle. For effective angles of 17 ° < β e < 45°, the separation length L s increases with β e . When β e 45 °, the upslope flow reached the apex and did not separate, which is independent of the plateau width. In this configuration, the upslope flow is insufficient to feed the plume that has formed on the plateau, thus requiring additional horizontal entrainment of the ambient fluid to the plume.
(2)
When β   ~   15 ° , there exists a sub-regime, in which the fluid parcels horizontally penetrate the plume near the separation point. The flow approaches that of a plume that is emanating from a uniformly heated horizontal source of finite width. The relationship between the separation length and the width of the plume for this case is observed to be L s L w 0.29 .
(3)
The mean upslope velocity at the separation point is dependent on the buoyancy flux, the effective slope angle, and the separation length. The upslope flow velocity scale that was proposed by Hocut et al. [7], was shown to also be valid in the present study, if the effects that are induced by the plateau are incorporated, using the effective angle definition.
This research incorporated the influence of a heated plateau to a previously introduced model of thermally driven upslope flow separation. The introduction of the effective slope angle β e , which encompasses the plateau influence in terms of the slope angle shows a direct similarity to the previously examined cases in the absence of a plateau. The results included the upslope flow separation location and the upslope velocity at the point of separation. Together, the upslope velocity scaling and the separation length parametrization could quantify similar complex topography flows. The next logical step is the examination of slope roughness and its variation along the slope to mimic realistic natural flows.

Author Contributions

H.J.S.F., D.L. and C.M.H. conceptualized the research; D.L., C.M.H., Q.Z. and S.L.B. conceived and designed the experiments; S.L.B. and Q.Z. performed the experiments; R.H.G., S.L.B. and D.L. analyzed the data; C.M.H., D.L., S.L.B., and R.H.G. contributed to data collection and analysis tools and software; H.J.S.F. and D.L. were responsible for funding acquisition and project administration; original draft was prepared by S.L.B.; writing-review and editing was performed by R.H.G, S.L.B., C.M.H., Q.Z., D.L. and H.J.S.F; anonymous reviewers and editors gave scientific comments.

Acknowledgments

The authors gratefully acknowledge the support of this study by the United States–Israel Binational Science Foundation, under Grant 2014075.

Conflicts of Interest

The authors declare no conflicts of interest.

References

  1. Strobach, K. Unser Planet Erde: Ursprung und Dynamik; Brontraeger: Berlin, Germany, 1991; p. 253. [Google Scholar]
  2. Whiteman, C.D. Mountain Meteorology: Fundamentals and Applications; Oxford University Press: Oxford, UK, 2000. [Google Scholar]
  3. Fernando, H.J.S. Fluid dynamics of urban atmospheres in complex terrain. Annu. Rev. Fluid Mech. 2010, 42, 365–389. [Google Scholar] [CrossRef]
  4. Mayr, G.J.; Armi, L.; Gohm, A.; Zängl, G.; Durran, D.R.; Flamant, C.; Gaberšek, S.; Mobbs, S.; Ross, A.; Weissmann, M. Gap flows: Results from the Mesoscale Alpine Programme. Q. J. Royal Meteorol. Soc. 2007, 133, 881–896. [Google Scholar] [CrossRef] [Green Version]
  5. Lu, R.; Turco, R.P. Air pollutant transport in a coastal environment. Part I: Two-dimensional simulations of sea-breeze and mountain effects. J. Atmos. Sci. 1994, 51, 2285–2308. [Google Scholar] [CrossRef]
  6. Crook, N.A.; Tucker, D.F. Flow over heated terrain. Part I: Linear theory and idealized numerical simulations. Mon. Weather Rev. 2005, 133, 2552–2564. [Google Scholar] [CrossRef]
  7. Hocut, C.M.; Liberzon, D.; Fernando, H.J.S. Separation of upslope flow over a uniform slope. J. Fluid Mech. 2015, 775, 266–287. [Google Scholar] [CrossRef]
  8. Banta, R.M. Daytime Boundary-layer evolution over mountainous terrain. Part I: Observations of the dry circulations. Mon. Weather Rev. 1984, 112, 340–356. [Google Scholar] [CrossRef]
  9. Chao, W.C. Correction of excessive precipitation over steep and high mountains in a GCM. J. Atmos. Sci. 2012, 69, 1547–1561. [Google Scholar] [CrossRef]
  10. Fast, J.D.; de Foy, B.; Rosas, F.A.; Caetano, E.; Carmichael, G.; Emmons, L.; McKenna, D.; Mena, M.; Skamarock, W.; Tie, X.; et al. A meteorological overview of the MILAGRO field campaigns. Atmos. Chem. Phys. 2007, 7, 2233–2257. [Google Scholar] [CrossRef]
  11. Whiteman, C.D.; Zhong, S.; Bian, J.D.; Doran, J.C. Boundary layer evolution and regional-scale diurnal circulations over the Mexico Basin and Mexican plateau. J. Geophys. Res. 2000, 105, 10081–10102. [Google Scholar] [CrossRef]
  12. Kleinman, L.I.; Springston, S.R.; Daum, P.H.; Lee, Y.N.; Nunnermacker, L.J.; Senum, G.I.; Wang, J.; Weinstein-Lloyd, J.; Alexander, M.L.; Hubbe, J.; et al. The time evolution of aerosol composition over the Mexico City plateau. Atmos. Chem. Phys. 2008, 8, 1559–1575. [Google Scholar] [CrossRef]
  13. De Foy, B.; Caetano, E.; Magana, V.; Zitacuaro, A.; Cardenas, B.; Retama, A.; Ramos, R.; Molina, L.T.; Molina, M.J. Mexico City basin wind circulation during the MCMA-2003 field campaign. Atmos. Chem. Phys. 2005, 5, 2267–2288. [Google Scholar] [CrossRef]
  14. Raga, G.B.; Baumgardner, D.; Kok, G.; Rosas, I. Some aspects of boundary layer evolution in Mexico City. Atmos. Environ. 1999, 33, 5013–5021. [Google Scholar] [CrossRef]
  15. Baumgardner, D.; Raga, G.B.; Kok, G.; Ogren, J.; Rosas, I.; Baez, A.; Novakov, T. On the evolution of aerosol properties at a mountain site above Mexico City. J. Geophys. Res. 2000, 105, 22243–22253. [Google Scholar] [CrossRef]
  16. Reuten, C.; Steyn, D.G.; Strawbridge, K.B.; Bovis, P. Observations of the relation between upslope flows, the convective boundary layer in steep terrain. Bound.-Layer Meteorol. 2005, 116, 37–61. [Google Scholar] [CrossRef]
  17. Reuten, C.; Steyn, D.G.; Allen, S.E. Water tank studies of atmospheric boundary layer structure and air pollution transport in upslope flow systems. J. Geophys. Res. 2007, 112, 2156–2202. [Google Scholar] [CrossRef]
  18. De Wekker, S.F. Observational and numerical evidence of depressed convective boundary layer height near a mountain base. J. Appl. Meteorol. Climatol. 2008, 65, 323–355. [Google Scholar] [CrossRef]
  19. Serafin, S.; Zardi, D. Structure of the atmospheric boundary layer in the vicinity of a developing upslope flow system: A numerical model study. J. Atmos. Sci. 2010, 67, 1171–1185. [Google Scholar] [CrossRef]
  20. Serafin, S.; Zardi, D. Daytime heat transfer processes related to slope flows and turbulent convection in an idealized mountain valley. J. Atmos. Sci. 2010, 67, 3739–3756. [Google Scholar] [CrossRef]
  21. Fernando, H.J.S.; Lee, S.M.; Anderson, J.; Princevac, M.; Pardyjak, E.; Grossman-Clarke, S. Urban fluid mechanics: Air circulation and contaminant dispersion in cities. Environ. Fluid. Mech. 2001, 1, 107–164. [Google Scholar] [CrossRef]
  22. Hunt, J.C.R.; Fernando, H.J.S.; Princevac, M. Unsteady thermally driven flows on gentle slopes. J. Atmos. Sci. 2003, 60, 2169–2182. [Google Scholar] [CrossRef]
  23. Princevac, M.; Fernando, H.J.S. A criterion for the generation of turbulent anabatic flows. Phys. Fluids 2007, 19, 105102. [Google Scholar] [CrossRef]
  24. Liberzon, D.; Shemer, L. Experimental study of the initial stages of wind waves’ spatial evolution. J. Fluid Mech. 2011, 681, 462–498. [Google Scholar] [CrossRef]
  25. Kline, S.J.; McClintock, F.A. Describing uncertainties in single-sample experiments. Mech. Eng. 1953, 75, 3–8. [Google Scholar]
  26. Chen, C.C.; Labhabi, A.; Chang, H.C.; Kelly, R.E. Spanwise paring of finite-amplitude longitudinal vortex rolls in inclined free-convection boundary layers. J. Fluid Mech. 1991, 231, 73–111. [Google Scholar] [CrossRef]
  27. Colomer, J.; Boubnov, B.M.; Fernando, H.J.S. Turbulent convection from isolated sources. Dyn. Atmos. Oceans 1999, 30, 125–148. [Google Scholar] [CrossRef]
  28. Rouse, H.; Yih, C.S.; Humphreys, H.W. Gravitational convection from a boundary source. Tellus 1952, 4, 201–210. [Google Scholar] [CrossRef]
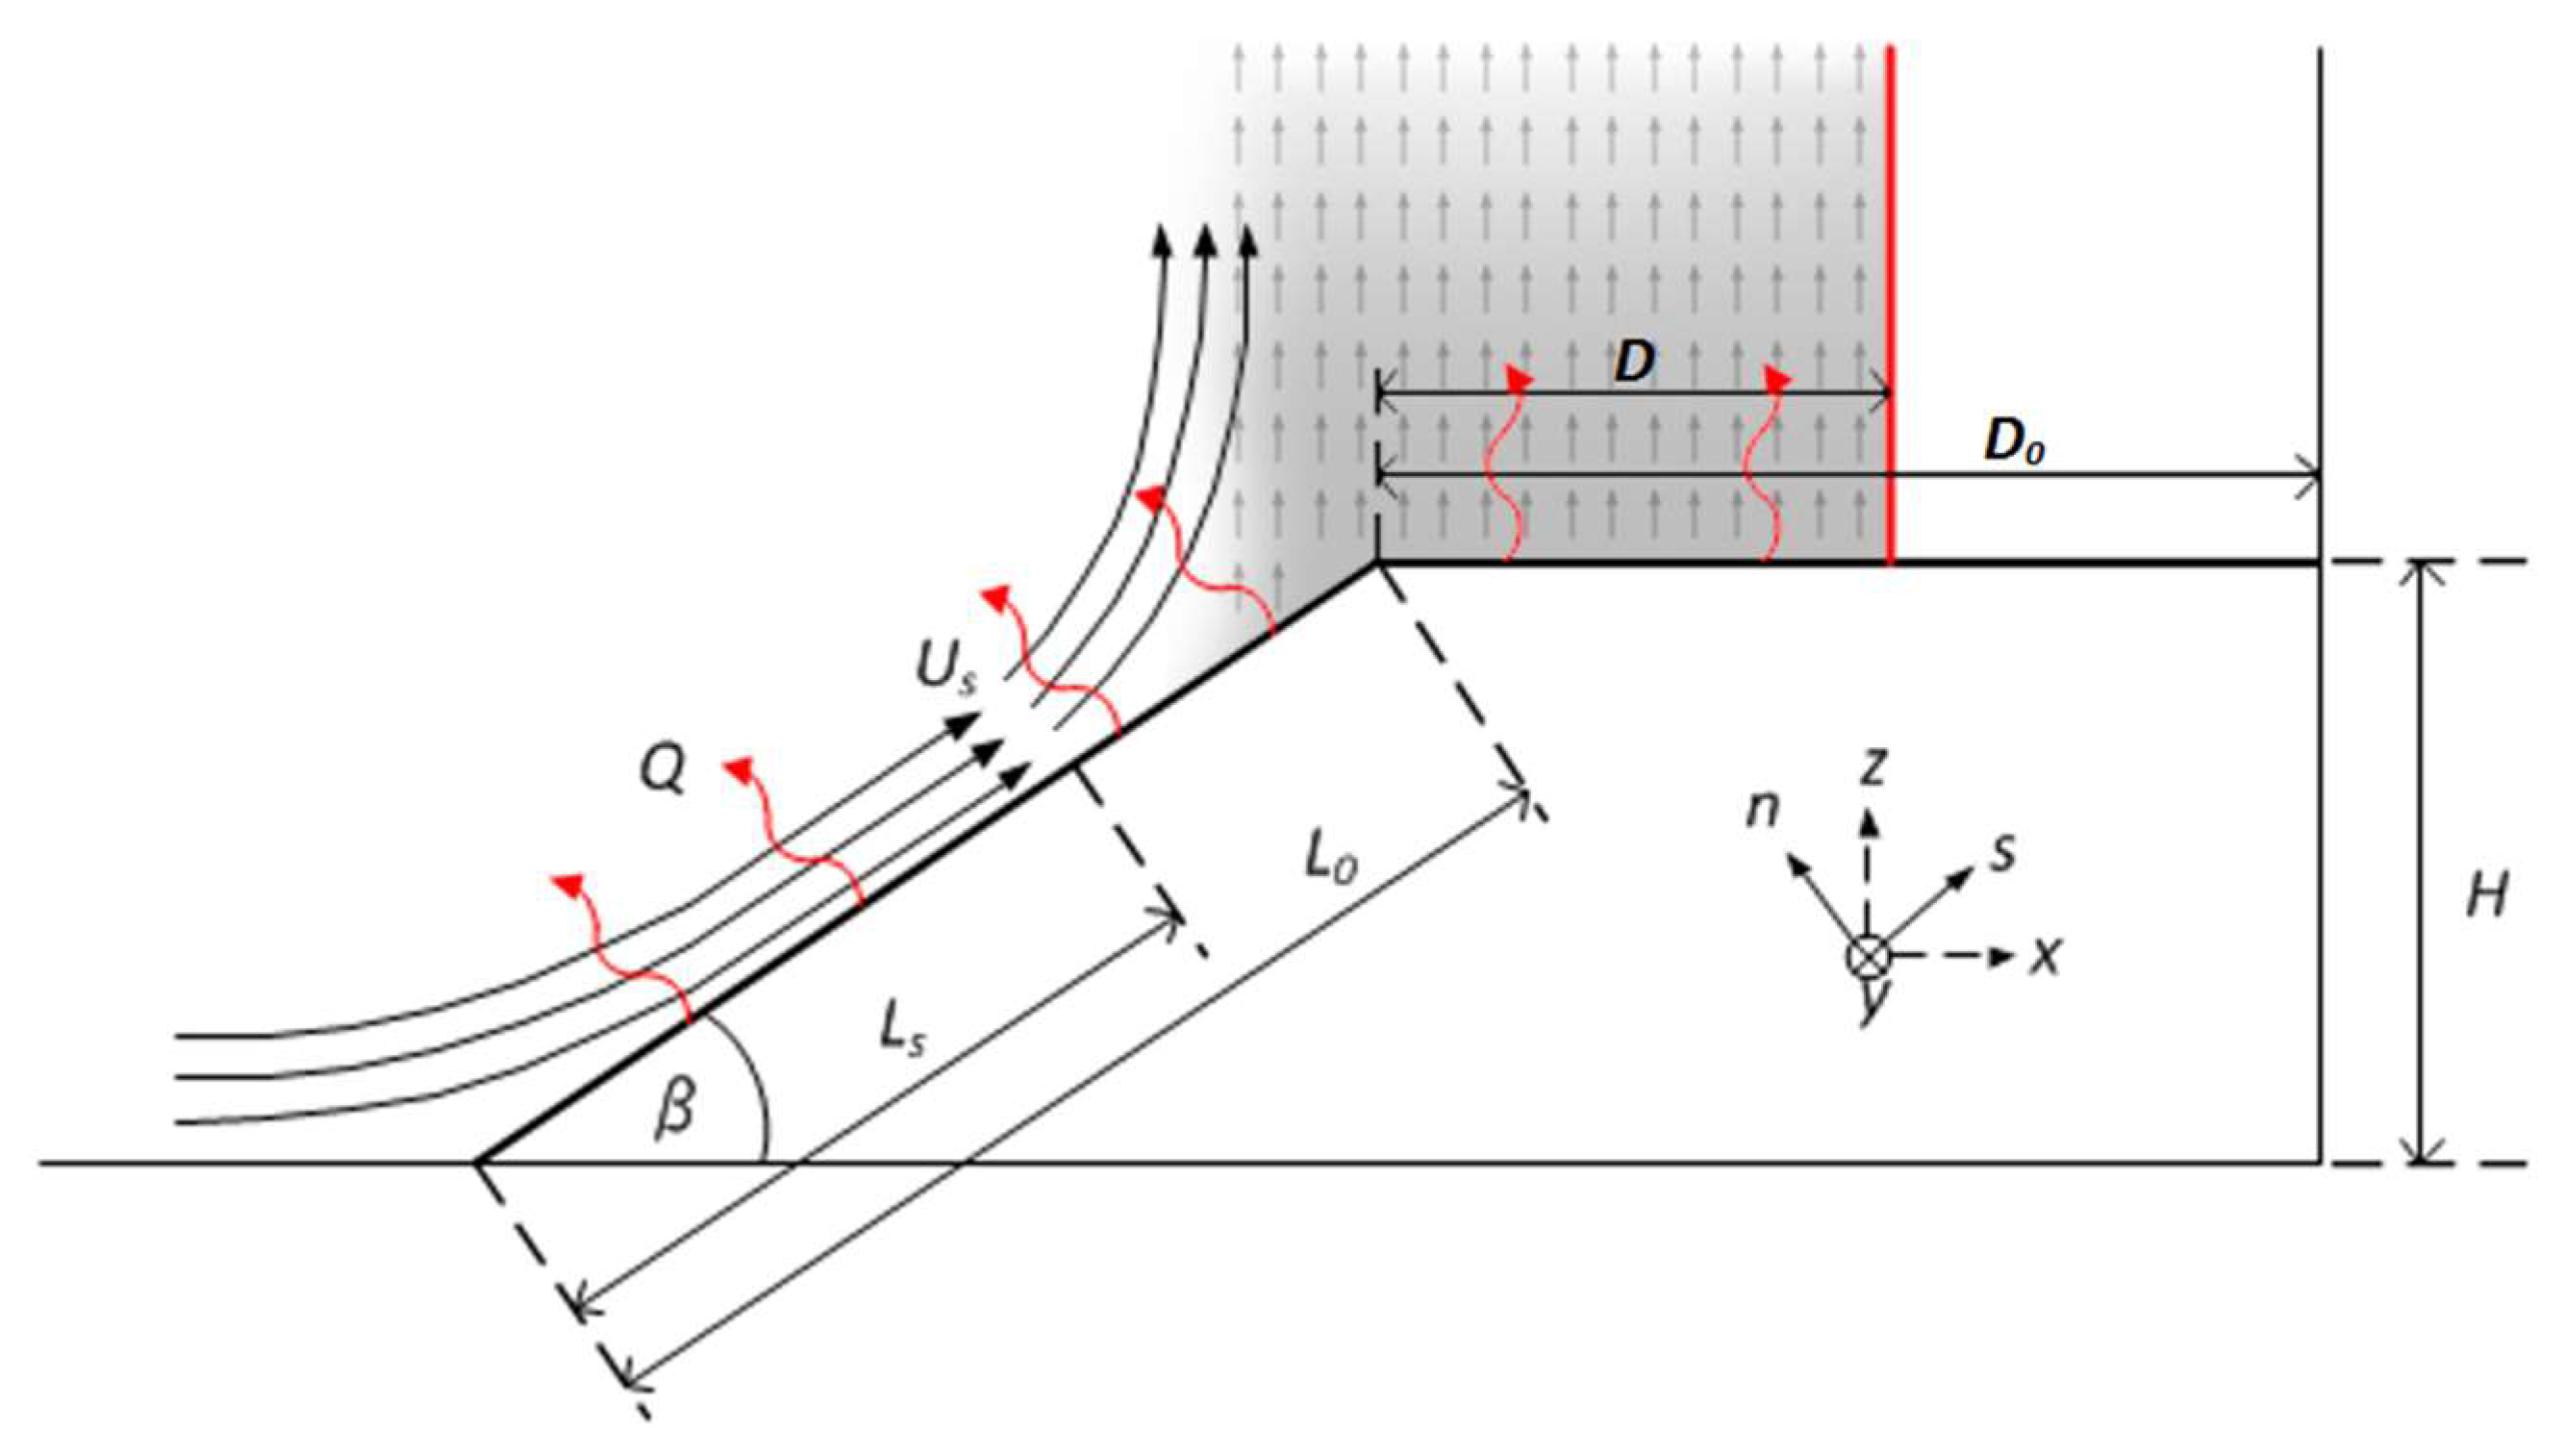
Figure 1. A schematic of the experimental configuration. The width of the plateau ( D )   was varied by moving the vertical wall indicated in red.
Atmosphere 09 00165 g001
Figure 2. Three Particle Tracking Velocimetry (PTV) track maps: (a) β = 15 ° and D = 3 4 L 0 , (b) β = 25 ° and D = 1 3 L 0 , and (c) β = 35 ° and D = 3 4 L 0 , illustrating the path lines of the fluid parcels over the slope and plateau. The separation locations are marked by white arrows. In (a,c), where the plateau is large, there are many fluid parcels from the slope penetrating the plume over the plateau, which is illustrated by the red particle track in (c). In (b) there is much less penetration into the plume core.
Atmosphere 09 00165 g002
Figure 3. The dimensionless flow separation distance L s / L 0 as a function of the effective angle β e , which incorporates the plateau with Π = 7.4 and Γ = 8.8 . The data of no plateau D = 0 , is taken from Hocut et al. [7].
Atmosphere 09 00165 g003
Figure 4. The ratio L s / L w , where L s is the separation length and L w the width of the plume. For β = 15 ° , the ratio has the constant value of 0.29 , while for β = 25 ° , the ratio is of O ( 1 ) . The filled in markers represent data with separation L s / L 0 < 1 , and empty markers represent cases with separation at the apex.
Atmosphere 09 00165 g004
Figure 5. The distribution of magnitudes of the upslope oriented velocity at the flow separation point ( β = 25 ° and D = 1 3 L 0 ). The red dashed lines mark the limits of the ensemble taken for averaging.
Atmosphere 09 00165 g005
Figure 6. Local mean upslope velocity, U s , at the flow separation point. The filled in markers represent data with separation along the slope, L s / L 0 < 1 , and empty markers represent cases with separation at the apex. The solid line is a linear fit of Equation (5) for the cases with separation before the apex where the proportionality constant γ = U s / ( q 0 L s cos β e ) 1 / 3 = 1.3, using the effective slope angle.
Atmosphere 09 00165 g006
Table 1. Experimental parameters.
β (degrees) D / L 0 (-) β e (degrees) q 0 (m2/s3) t s (s)
150, 1/4, 1/2, 3/4, 115, 18.75, 22.5, 309.94 × 10⁻⁸, 1.49 × 10⁻⁷, 1.98 × 10−750, 80, 120
250, 1/6, 1/3, 1/2, 2/3, 5/6, 125, 29.17, 33.33, 37.5, 41.67, 45.83, 504.93 × 10⁻⁹, 1.5 × 10⁻⁸, 2.5 × 10⁻⁸, 3.5 × 10−8100
350, 1/8, 1/4, 1/2, 3/4, 135, 39.38, 43.75, 52.5, 61.25, 705 × 10−8, 2.45 × 10⁻⁷, 1.3 × 10−750
450, 1/8, 1/4, 1/2, 3/4, 145, 50.63, 56.25, 67.5, 78.75, 906.4 × 10⁻⁸, 9.6 × 10⁻⁸, 1.28 × 10−750, 80