1. Introduction
In the coming decades, the effects of climate change will be reflected around the world in rainfall irregularity, increased maximum temperatures [
1], and evapotranspiration, which could cause extreme wet [
2] and dry [
3] events.
According to [
4], Mexico has historically been affected by a number of extreme events of both types as well as by fires associated with extreme dry events; most notably in the states of Chihuahua, Coahuila, Durango, Chiapas, Mexico City, Tabasco, Baja California Sur, Baja California, Sonora and Sinaloa [
5,
6,
7]. In the northern states of Mexico (Chihuahua, Baja California, Durango, Baja California Sur, Sinaloa and Sonora), summer precipitation (June–September) represents around 60% of total annual precipitation; however, in recent decades, significant meteorological irregularities have been recorded in various different climatic classifications [
8,
9,
10] which predict that Mexico will become dryer as a consequence of global warming and that this drying may already be underway [
11]. Of the meteorological indices in the literature, the standardized precipitation and evapotranspiration index (SPEI) is the most efficient for identifying extreme wet and dry events, due to the fact that it incorporates evapotranspiration, which can identify prolonged drought periods [
12] and is indispensable in hydrological balance studies [
13,
14,
15]. According to [
16], the choice of time scale for the SPEI must be based specifically on the type of event to be identified or analyzed.
Given this, in this study for the identification of extreme wet events, the three-month scale (SPEI-3) was applied as it reflects short and medium term seasonal soil moisture conditions with higher resolution [
17]. Specifically for the identification of extreme dry events, the 24-month scale (SPEI-24) was applied, since the bi-annual period is essential for capturing low frequency variability, avoiding the explicit annual cycle [
13,
14]. Two of the most important factors that induce extreme precipitation events globally [
18,
19,
20] are the Pacific decadal oscillation (PDO) and the oceanic El Niño index (ONI) [
13,
21,
22]. Northern Mexico is no exception, due to the fact that PDO and ONI are associated with precipitation variability in this region [
9,
23,
24,
25,
26]. Extreme precipitation events in northern Mexico are also related to anomalies of the sea surface temperature (SST) in the equatorial and eastern Pacific Ocean [
27]. Given the association between PDO and ONI, it can be inferred that sea surface temperature has a strong influence on the existence of dry and wet events in northern Mexico, and the goal of the present study was therefore to generate a method to examine seasonal variability by climatic classification and seasonal factors of the Pacific for extreme wet and dry events in northern Mexico for the period 1952–2013.
The results obtained in one of the most important agricultural regions in Mexico, which also has the largest number of Ramsar wetlands in the country, can serve to give an insight into future wet and dry events, which could put at risk the sustainability of food, the environment and life for the region’s inhabitants [
28,
29,
30]. This study also determines for the first time the influence of the PDO and the ONI on seasonal variability of extreme wet and dry events by climatic classification through the SPEI index in northern Mexico.
4. Discussion
The results shown in
Table 4 are similar to those of [
9,
21], who report that the events with the highest extreme rainfall associated with tropical cyclones in the eastern Pacific Ocean occurred in the periods 1982–1984 and the late 1990s. The findings of this study are also similar to the timing of the wet events for northern Mexico noted by [
9], who indicate that 1984 was one of the wettest years in the period 1961–2000, which was caused by excess water and deficient or excess evapotranspiration [
45]. As shown in
Table 4, the results for the Baja California sub-humid temperate climate are similar to those of [
46], who report that the most intense extreme wet events were recorded in the period 2003–2005, with a magnitude of standardized precipitation index on a three-month scale (SPI-3) ranging from 4.07 to 2.51.
The literature results for Durango reported magnitudes of SPI-3 = 4.07 for 1984 [
46] and an SPI-3 = 2.47 for 1992 [
47]; our results for Durango-very dry show an average of SPEI-3 = 2.46 for 1976 and 1984, which is consistent with the wet extreme events registered for northern Mexico according to the criteria of [
31]. In the case of Chihuahua, in the literature (graphics) they registered magnitudes of SPI-3 = 2.8 and SPI-3 = 3.05 for 1984 at the Batopilas and Bocatoma weather stations [
48], respectively, which is in agreement with this study; in
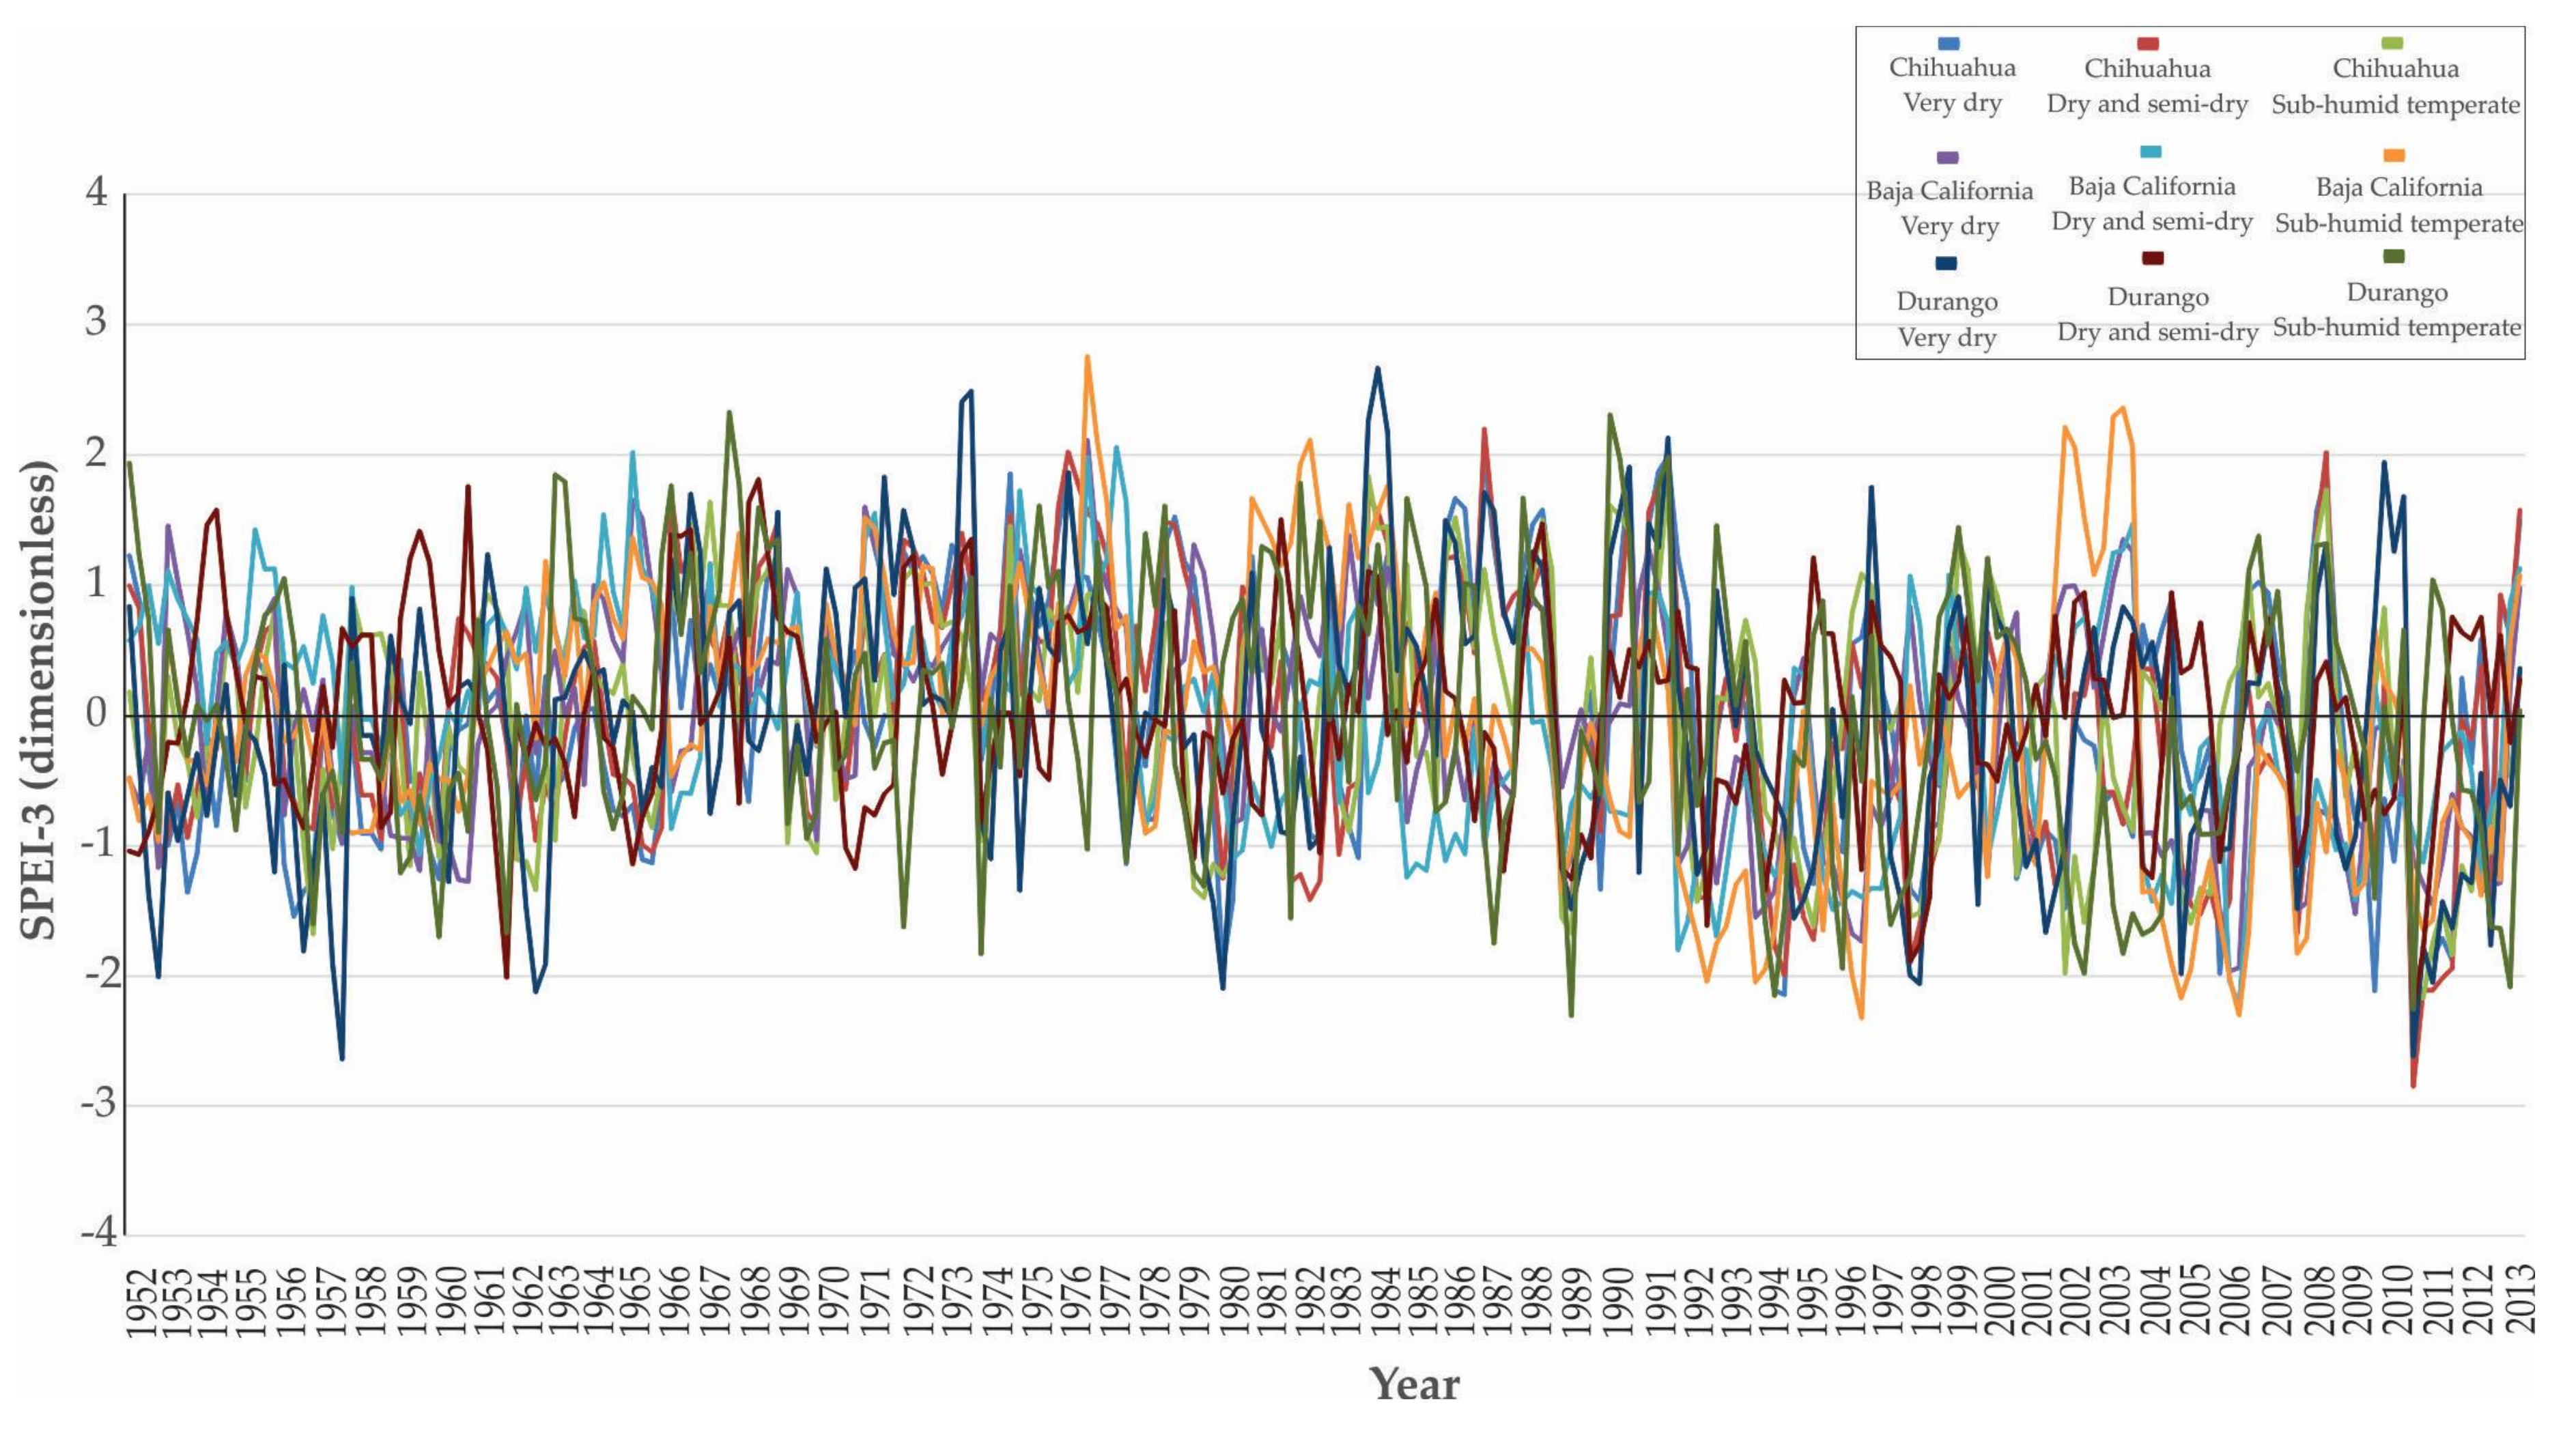
Figure 2 they showed an SPEI-3 = 20.02 and SPEI-3 = 2.20 in Chihuahua with a climate classification of very dry and dry and semi-dry, respectively. For Sinaloa, it was reported in the literature [
49] that 1984 was the year with the highest precipitation in the period 1960–2010, which is in agreement with the results of this study because the highest wet extreme events occurred in Sinaloa-very dry and dry and semi-dry in 1984, with magnitudes of SPEI-3 = 3.11 and SPEI-3 = 2.42, respectively.
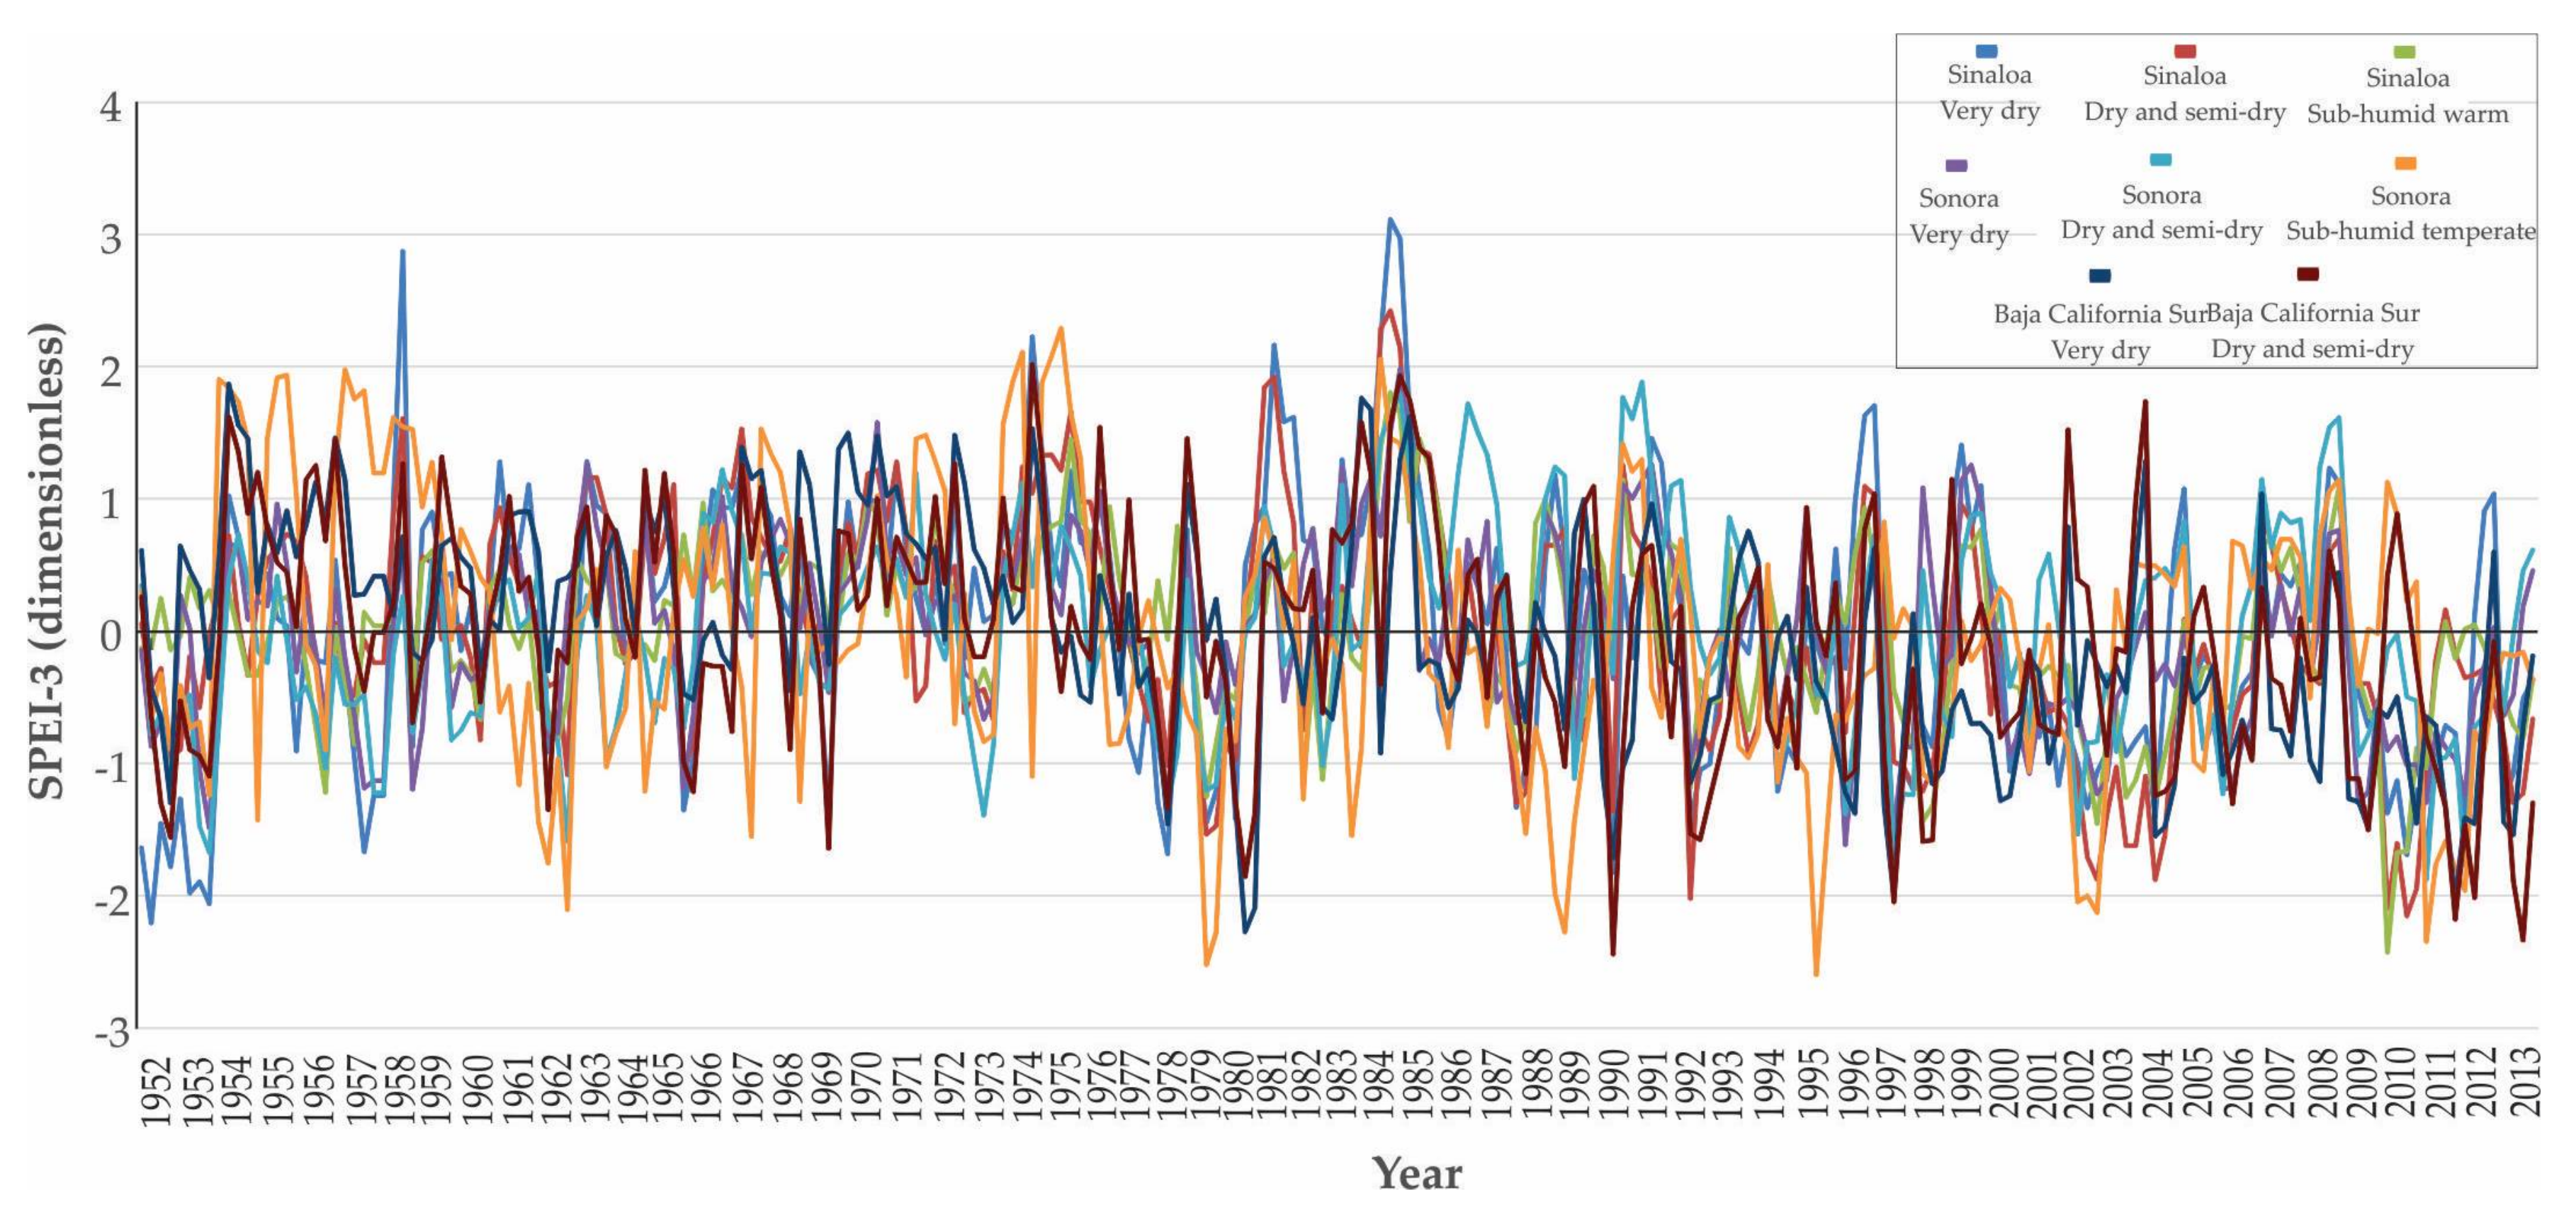
The results shown in
Figure 3 also agree with one of the few studies found in the bibliography; [
48], who note that an extreme wet event with SPEI-3 = 2.2 was recorded in 1984 in the northern basin of Sinaloa (
Figure 3). The results for Sonora-sub-humid temperate and Baja California Sur-dry and semi-dry, with magnitudes of SPEI-3 from 1.93 to 2.06 for 1984, are similar to [
46], who report that the wettest period was 1982–1984, with SPI-3 values from 4.07 to 2.90. The results of this study are consistent with those of [
45], who state that 2011 was the driest year in northern Mexico, caused by a precipitation deficit and evapotranspiration [
13]. In this study, the results of the SPEI-24 for Chihuahua-very dry, dry and semi-dry, and sub-humid temperate and Durango-very dry and sub-humid temperate (
Table 5 and
Figure 4) are similar to those of [
46], who report that in the period of most intense drought (2010–2013), SPI-24 ranged from −0.45 to −2.89 (
Table 5). The results of this study are also similar to those of [
31], who report a drought event for Chihuahua (from 1953 to 1957) with SPI-24 magnitudes ranging from −0.5 to −2.2 (
Table 5 and
Figure 4). In this study, for Baja California-very dry, dry and semi-dry and sub-humid temperate, the SPEI-24 results also coincide with [
31], who state that the period 1996–2002 was the driest for Baja California.
The results of the SPEI-24 for Chihuahua-very dry are similar to those of [
31], who state that in the period 1953–1957 there were extreme drought events (SPEI-24 < −2.0). For Baja California-very dry, dry and semi-dry and sub-humid temperate, the results are similar to those of [
46] and [
31], who report that the most intense droughts were recorded in the period 1995–2003, with SPI-24 ranging from −0.45 to −2.59. In
Table 5, the results of the SPEI-24 for Sinaloa-very dry are similar to those of [
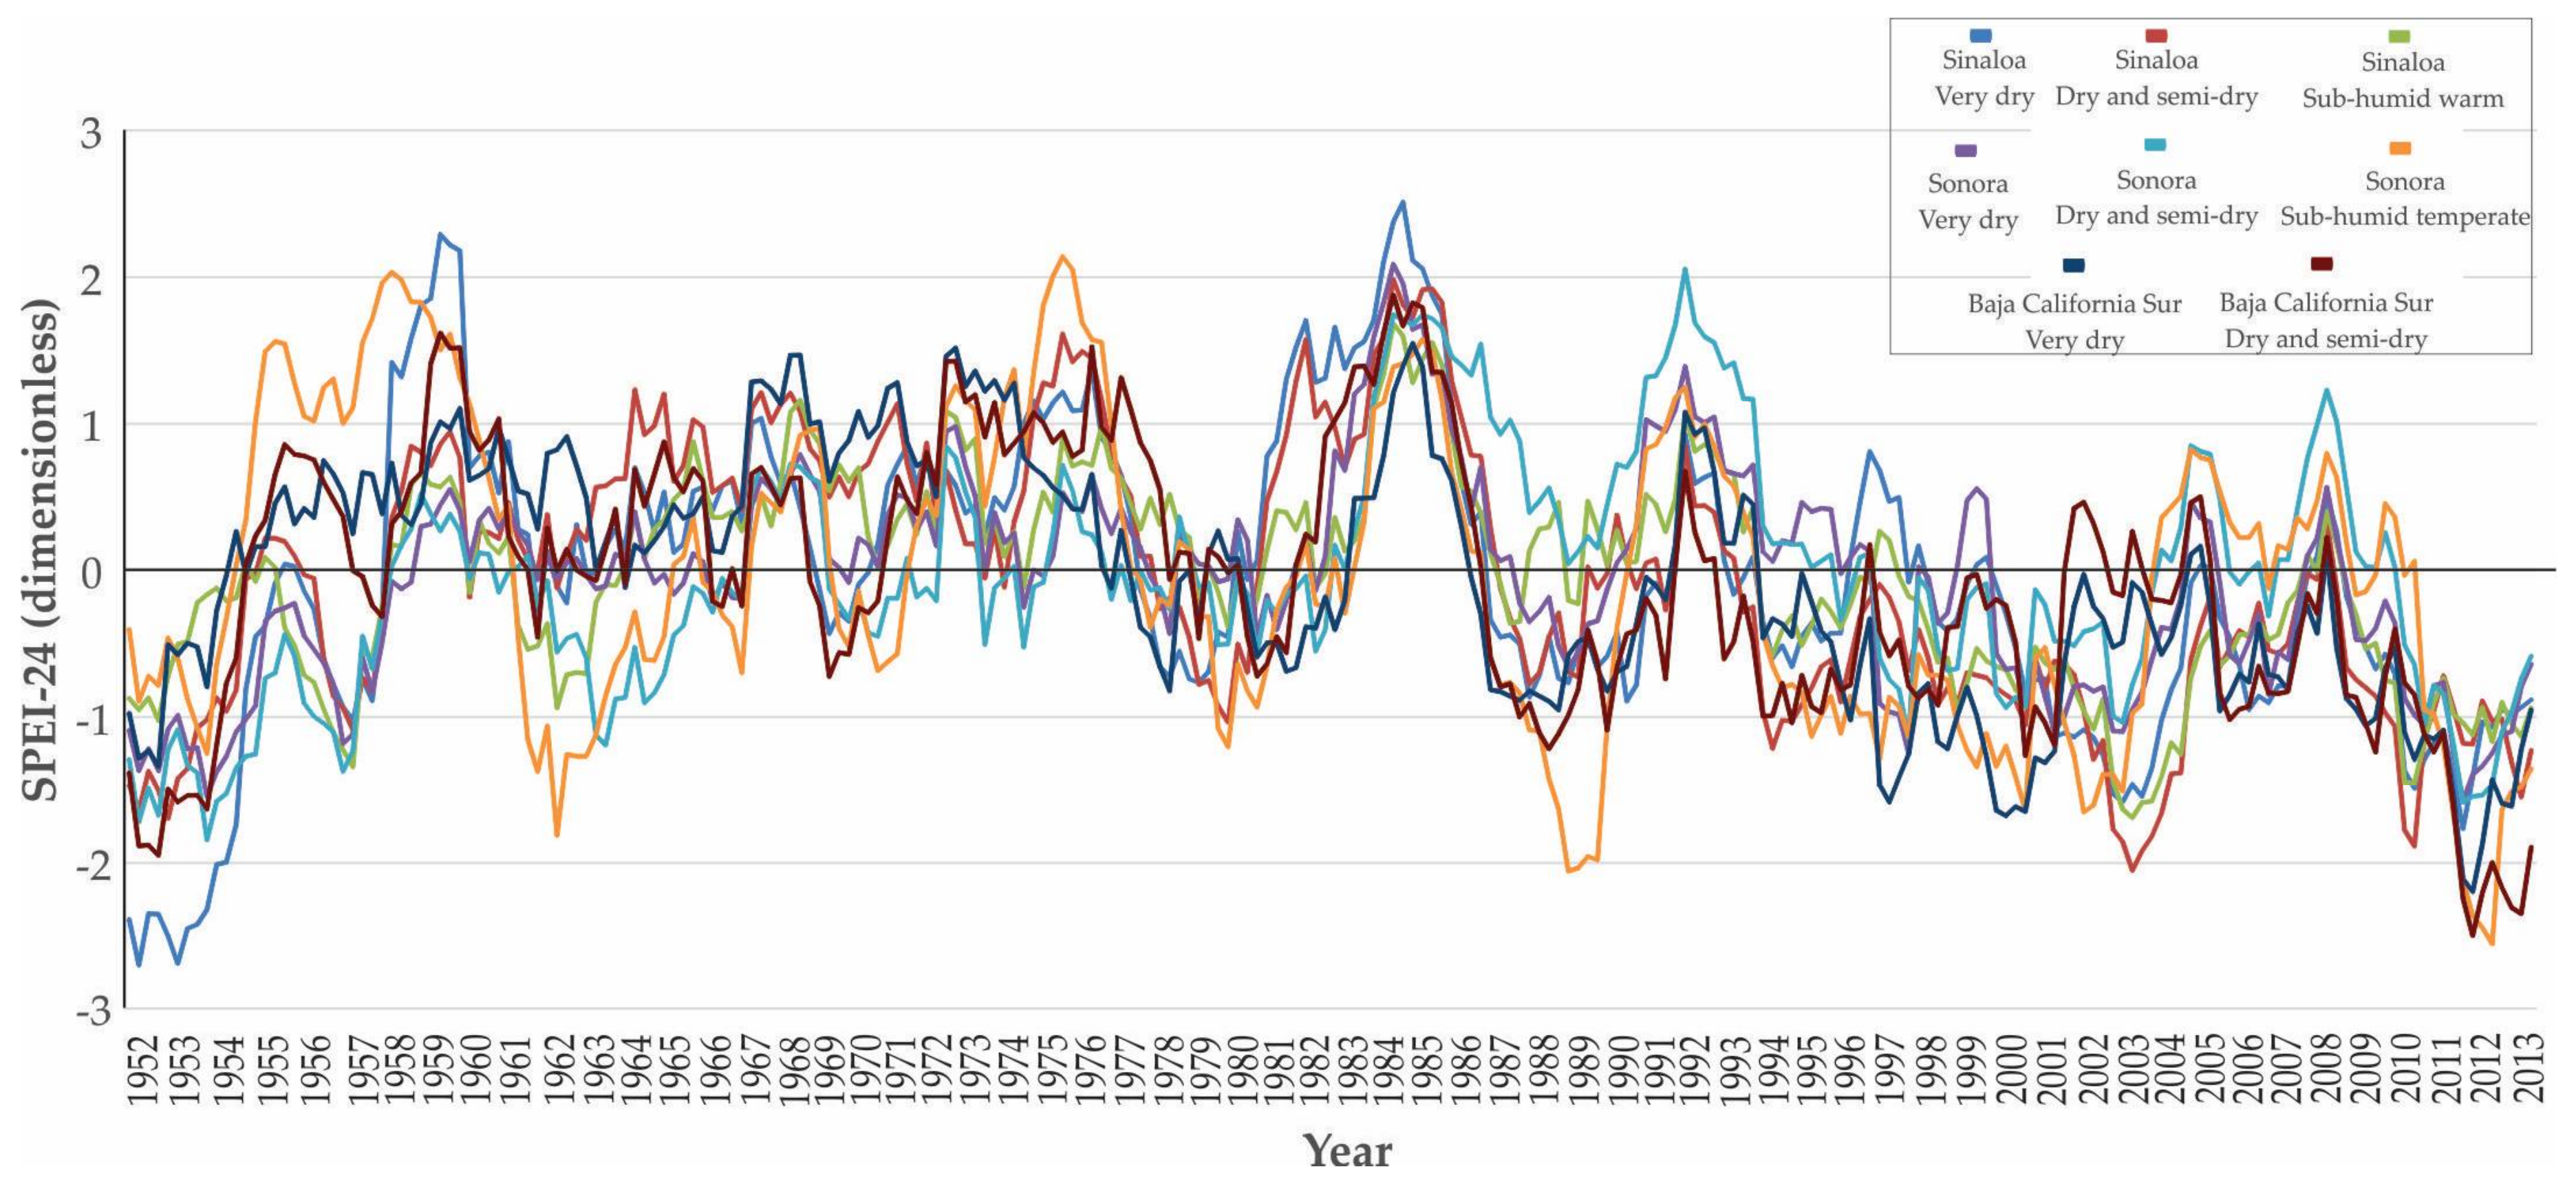
46], who report that the most intense period of drought was 1951–1955, with SPI-24 values from −0.72 to −2.72 (
Figure 5). Also, for Sonora-sub-humid temperate, the results are similar to those of [
46], who report that the most intense period of drought was 2011–2013 with SPI-24 values from −1.02 to −1.63. In Baja California Sur-dry and semi-dry, the results are similar to those of [
46], who report that the period with the most drought was 2008–2013, with SPI-24 from −0.42 to −2.48.
The results of
Figure 6a,b are similar to those of [
46], who report that the wettest period was 1982–1984 with SPI-3 values that ranged from 4.07 to 2.90. These results are also similar to those of [
9,
21,
47,
48,
49,
50], who report that in 1954, 1976–1977, 1981–1983, 1986 and 1992, there were a significant number of extreme precipitation events in northern Mexico and that 1984 and 1992 were the most extreme year, with SPI-3 = 4.07 and SPI-3 = 2.47, respectively.
Z anomalies of extreme wet events coincide with +PDO phase anomalies, which are indicators of extreme rainfall in northern Mexico [
9,
50]. The results shown in
Figure 6c,d are similar to those of [
31,
46], who report that the periods 1953–1957, 1996–2003 and 2011–2013 presented the most intense droughts in the north of Mexico, with SPI-24 ranging from −2.10 to −2.79. The values of
Figure 6e are associated with La Niña events and are indicators of scarce to null precipitation in the north of Mexico [
9]. The results shown in
Figure 6f and for ONI indicate the very limited influence of ENSO on the occurrence of extreme wet and dry events in northern Mexico [
13].
The results in
Table 6 are consistent with those of [
31], who say that when there are negative anomalies of the summer PDO, wet extreme events also occur for the dry and semi-dry climate classification of Baja California and vice versa, and when there are negative anomalies of the ONI, extreme wet events also occur for the very dry climatic classification of Sinaloa and vice versa (
Table 6).
The significant correlations between SPEI-3 and SPEI-4 and PDO and ONI (
Table 6 and
Table 7) are similar to those of [
51], who report that for the southern Polish Baltic coast in the period 1951–2010, the Spearman correlations between SPEI and North Atlantic Oscillation (NAO) indices were −0.290 for February and −0.327 for September from the Szczecin weather station. The correlations were −0.338 for February and −0.259 for August from the Ustka weather station, and and −0.299 for January, −0.401 for February and −0.268 for March from the Elblag weather station. The correlations between SPEI-3 and SPEI-24 and ONI are similar to those reported by [
52] who state that in Romania for the period 1902–2014, the average correlations between SPEI-6 and SPEI-12 and NAO were −0.34 and −0.31, respectively.
In the results shown in
Figure 7a, it can be seen that the presence of −SST phase anomalies in the equatorial and eastern Pacific is an important factor for the occurrence of extreme precipitation in the north of Mexico [
27,
53,
54]. The presence of +SST phase anomalies in
Figure 7b is an indicator of extreme dry events in northern Mexico. These results are consistent with those of [
27,
49,
55], who point out that the +SST anomalies in eastern tropical Pacific near the equator are indicators of extreme dry events.
When the magnitudes of SPEI-3 ≥ 2.0 during three or more consecutive months in northern Mexico, the study area will be susceptible to floods and significant economic losses due to soil water saturation. When the magnitudes of SPEI-24 ≤ −2.0 during 24 or more consecutive months in northern Mexico, the study area will be susceptible to severe droughts and significant economic losses due to low agricultural yields.
5. Conclusions
Extreme wet events in northern Mexico in the period 1952–2013 were recorded in 1954, 1968, 1976–1977, 1981, 1984, 1986 and 2003, and the greatest magnitude was recorded in 1984 for Sinaloa-very dry. Extreme dry events were recorded in 1952–1953, 1990, 1997, 2003 and 2011–2013, and the greatest magnitude was recorded in 1997 for Baja California-very dry, dry and semi-dry and sub-humid temperate.
The Z anomalies of wet extreme events coincide with anomalies of the +PDO phase. In 1952 and 2011–2013, −PDO phases were recorded, which are associated with La Niña events and are indicators for scarce to null precipitation in northern Mexico. +ONI phase anomalies were recorded in 1968, 1976–1977, 1986 and 2003, and −ONI phase anomalies occurred in 2011 and 2013, which indicates the low influence of ENSO in extreme wet and dry events for northern Mexico. When −PDO phase anomalies are present, extreme wet events also occur for the dry and semi-dry climate region of Baja California and vice versa and when −ONI phase anomalies occur, extreme wet events also occur for the very dry climate region of Sinaloa and vice versa. The ONI anomalies have greater influence than the PDO anomalies on the occurrence of extreme wet summers in Durango-sub-humid temperate, Sinaloa-dry and semi-dry and Sonora-dry and semi-dry. When −PDO phases occur, dry extreme events also occur in Chihuahua-very dry and sub-humid temperate and Sonora-dry and semi-dry. The PDO anomalies have greater influence than ONI anomalies on the occurrence of extreme dry summers for Chihuahua-dry and semi-dry, Durango-very dry and dry and semi-dry and Sonora-very dry.
The presence of −SST seasonal phase anomalies in the equatorial and eastern Pacific is an important factor for the occurrence of extreme wet events in northern Mexico, and also the occurrence of +SST seasonal phase anomalies in these same regions of the Pacific is an indicator of extreme dry events in northern Mexico.
This study presents a new method for identifying the seasonal variability of extreme wet and dry events by climatic classification associated with the influence of the PDO and ONI factors in the most important agricultural regions of Mexico.


 . Bold and boxed = Significant correlation.
 . Bold and boxed = Significant correlation.


