Article

Characteristics of Carbonaceous Aerosol in PM2.5 at Wanzhou in the Southwest of China

1
Key Laboratory of Water Environment Evolution and Pollution Control in Three Gorges Reservoir, Chongqing Three Gorges University, Wanzhou 404100, China
2
CAS Key Laboratory of Reservoir Environment, Chongqing Institute of Green and Intelligent Technology, Chinese Academy of Sciences, Chongqing 400714, China
*
Author to whom correspondence should be addressed.
Atmosphere 2018, 9(2), 37; https://doi.org/10.3390/atmos9020037
Submission received: 1 December 2017 / Revised: 18 January 2018 / Accepted: 20 January 2018 / Published: 24 January 2018
(This article belongs to the Special Issue Carbonaceous Aerosols in Atmosphere)

Abstract

:
Hourly organic carbon (OC) and elemental carbon (EC) concentrations in PM2.5 were measured from June 2013 to May 2014 in Wanzhou, the second largest city in the Chongqing Municipality, in the southwest of China. Results show that the annual average concentrations of OC and EC were 13.16 ± 7.98 and 3.12 ± 1.51 μgC·m−3, respectively. Clear seasonal variations of OC and EC concentrations were observed, with their concentrations at minima in summer and maxima in winter. The diel concentration profile of OC and EC presented a bimodal pattern, which was attributed to the cooperative effects of local meteorological conditions and source emissions. The daily average OC/EC ratio ranged from 2.05 to 8.17 with an average of 4.15 for the whole study period. Strong correlations between OC and EC were found in winter and spring, indicating their common sources, while their correlations were poorer in summer and autumn, indicating that the influence of biogenic emissions and secondary organic carbon (SOC) were significant during those seasons. The estimated SOC concentrations were 2.19 ± 1.55, 7.66 ± 5.89, 5.79 ± 3.51, and 3.43 ± 2.26 μgC·m−3, accounting for 29.2%, 52.7%, 27.4%, and 30.5% of total organic carbon in summer, autumn, winter, and spring, respectively. The analysis of back trajectories suggested that high PM2.5, OC, and EC concentrations were associated with air masses originating from or passing over several industrial centers and urban areas in western and northwestern China. Air trajectories from the southeast with short pathways were the dominant trajectories arriving at Wanzhou, indicating that local sources had a big influence on PM2.5, OC, and EC concentrations.

1. Introduction

Carbonaceous aerosol—which contributes 20–60% to PM2.5 mass in urban settings [1,2,3,4]—has been found to have a large impact on environmental conditions, such as visibility and climate change [5,6,7,8]. Carbonaceous aerosol is usually separated into elemental carbon (EC) and organic carbon (OC). EC has a graphitic-like structure and comes mainly from incomplete combustion processes. EC has a strong absorptivity of solar radiation and plays an important role in visibility reduction and aerosol radiative forcing [5,9,10]. EC-containing particles are also associated with adverse health effects [11,12]. OC consists of thousands of organic compounds, containing polycyclic aromatic hydrocarbons, polychlorinated biphenyls, and other hazardous components, which have possible mutagenic and carcinogenic effects. OC can be directly emitted from sources (primary OC, POC) or produced from the gas-to-particle conversion of volatile organic compounds (secondary OC, SOC) [13]. OC aerosols can impact climate directly by scattering solar radiation, and they can also absorb light which cause visibility degradation [7].
As the basic components of carbonaceous aerosol, temporal and spatial variations of OC and EC concentrations in PM2.5 have been presented in several studies [14,15,16,17]. Some studies focused on the emission factors and emission inventories of carbonaceous aerosol, and also on applying them to numerical models and comparing the results with observations [18,19,20,21]. The concentration of SOC was also estimated in several studies using the carbon isotopic composition [22,23]; chemical transport models [24,25], and the EC tracer method [17,26]. China has drawn significant attention worldwide due to its rapid industrialization and increased consumption of fossil fuels and biofuels, which result in increased primary sources of carbonaceous aerosol [27,28]. Several studies on carbonaceous aerosol have been conducted in megacities and coastal cities in China, such as Beijing, Tianjin, and Shijiazhuang in the Jing-Jin-Ji Region [29,30,31]; Guangzhou, Xiamen in the Pearl River Delta Region (PRDR) [13,32,33]; Fuzhou, and Quanzhou in the Western Taiwan Strait Region (WTSR) [3]; Shanghai [34,35]; and Xi’an [36]. However, spatial and temporal distributions of carbonaceous aerosol in China overall require more attention.
Wanzhou is a mountainous city in southeastern China, with an area of 3457 km2 and a population of approximately 1.8 million. Along with other small cities in China in recent years, Wanzhou has experienced especially rapid urbanization and industrialization, with the annual growth rates of GDP and amount of automobiles (0.21 million vehicles by the end of 2014) increasing by more than 10% in the last five years (http://www.cqtj.gov.cn/tjnj/2014/indexch.htm). However, carbonaceous aerosol exposure has been investigated only in the urban district in Chongqing. The EC and OC concentrations in Wanzhou have been studied much less, for instance, Zhang et al. [37] and Peng et al. [38]. In those studies, the sampling dates were limited to only a few months of data; the diurnal variation and source evaluation were not adequately discussed. This work presents the results of a year-long measurement of the hourly EC and OC concentrations at a Wanzhou urban site. The purposes of this study are: (1) to investigate the diurnal and seasonal characteristics of PM2.5-associated OC and EC in Wanzhou; (2) to estimate the concentrations of secondary OC and its contributions to total OC in four seasons; (3) to identify the sources and factors affecting carbonaceous aerosols in Wanzhou.

2. Measurements and Methodology

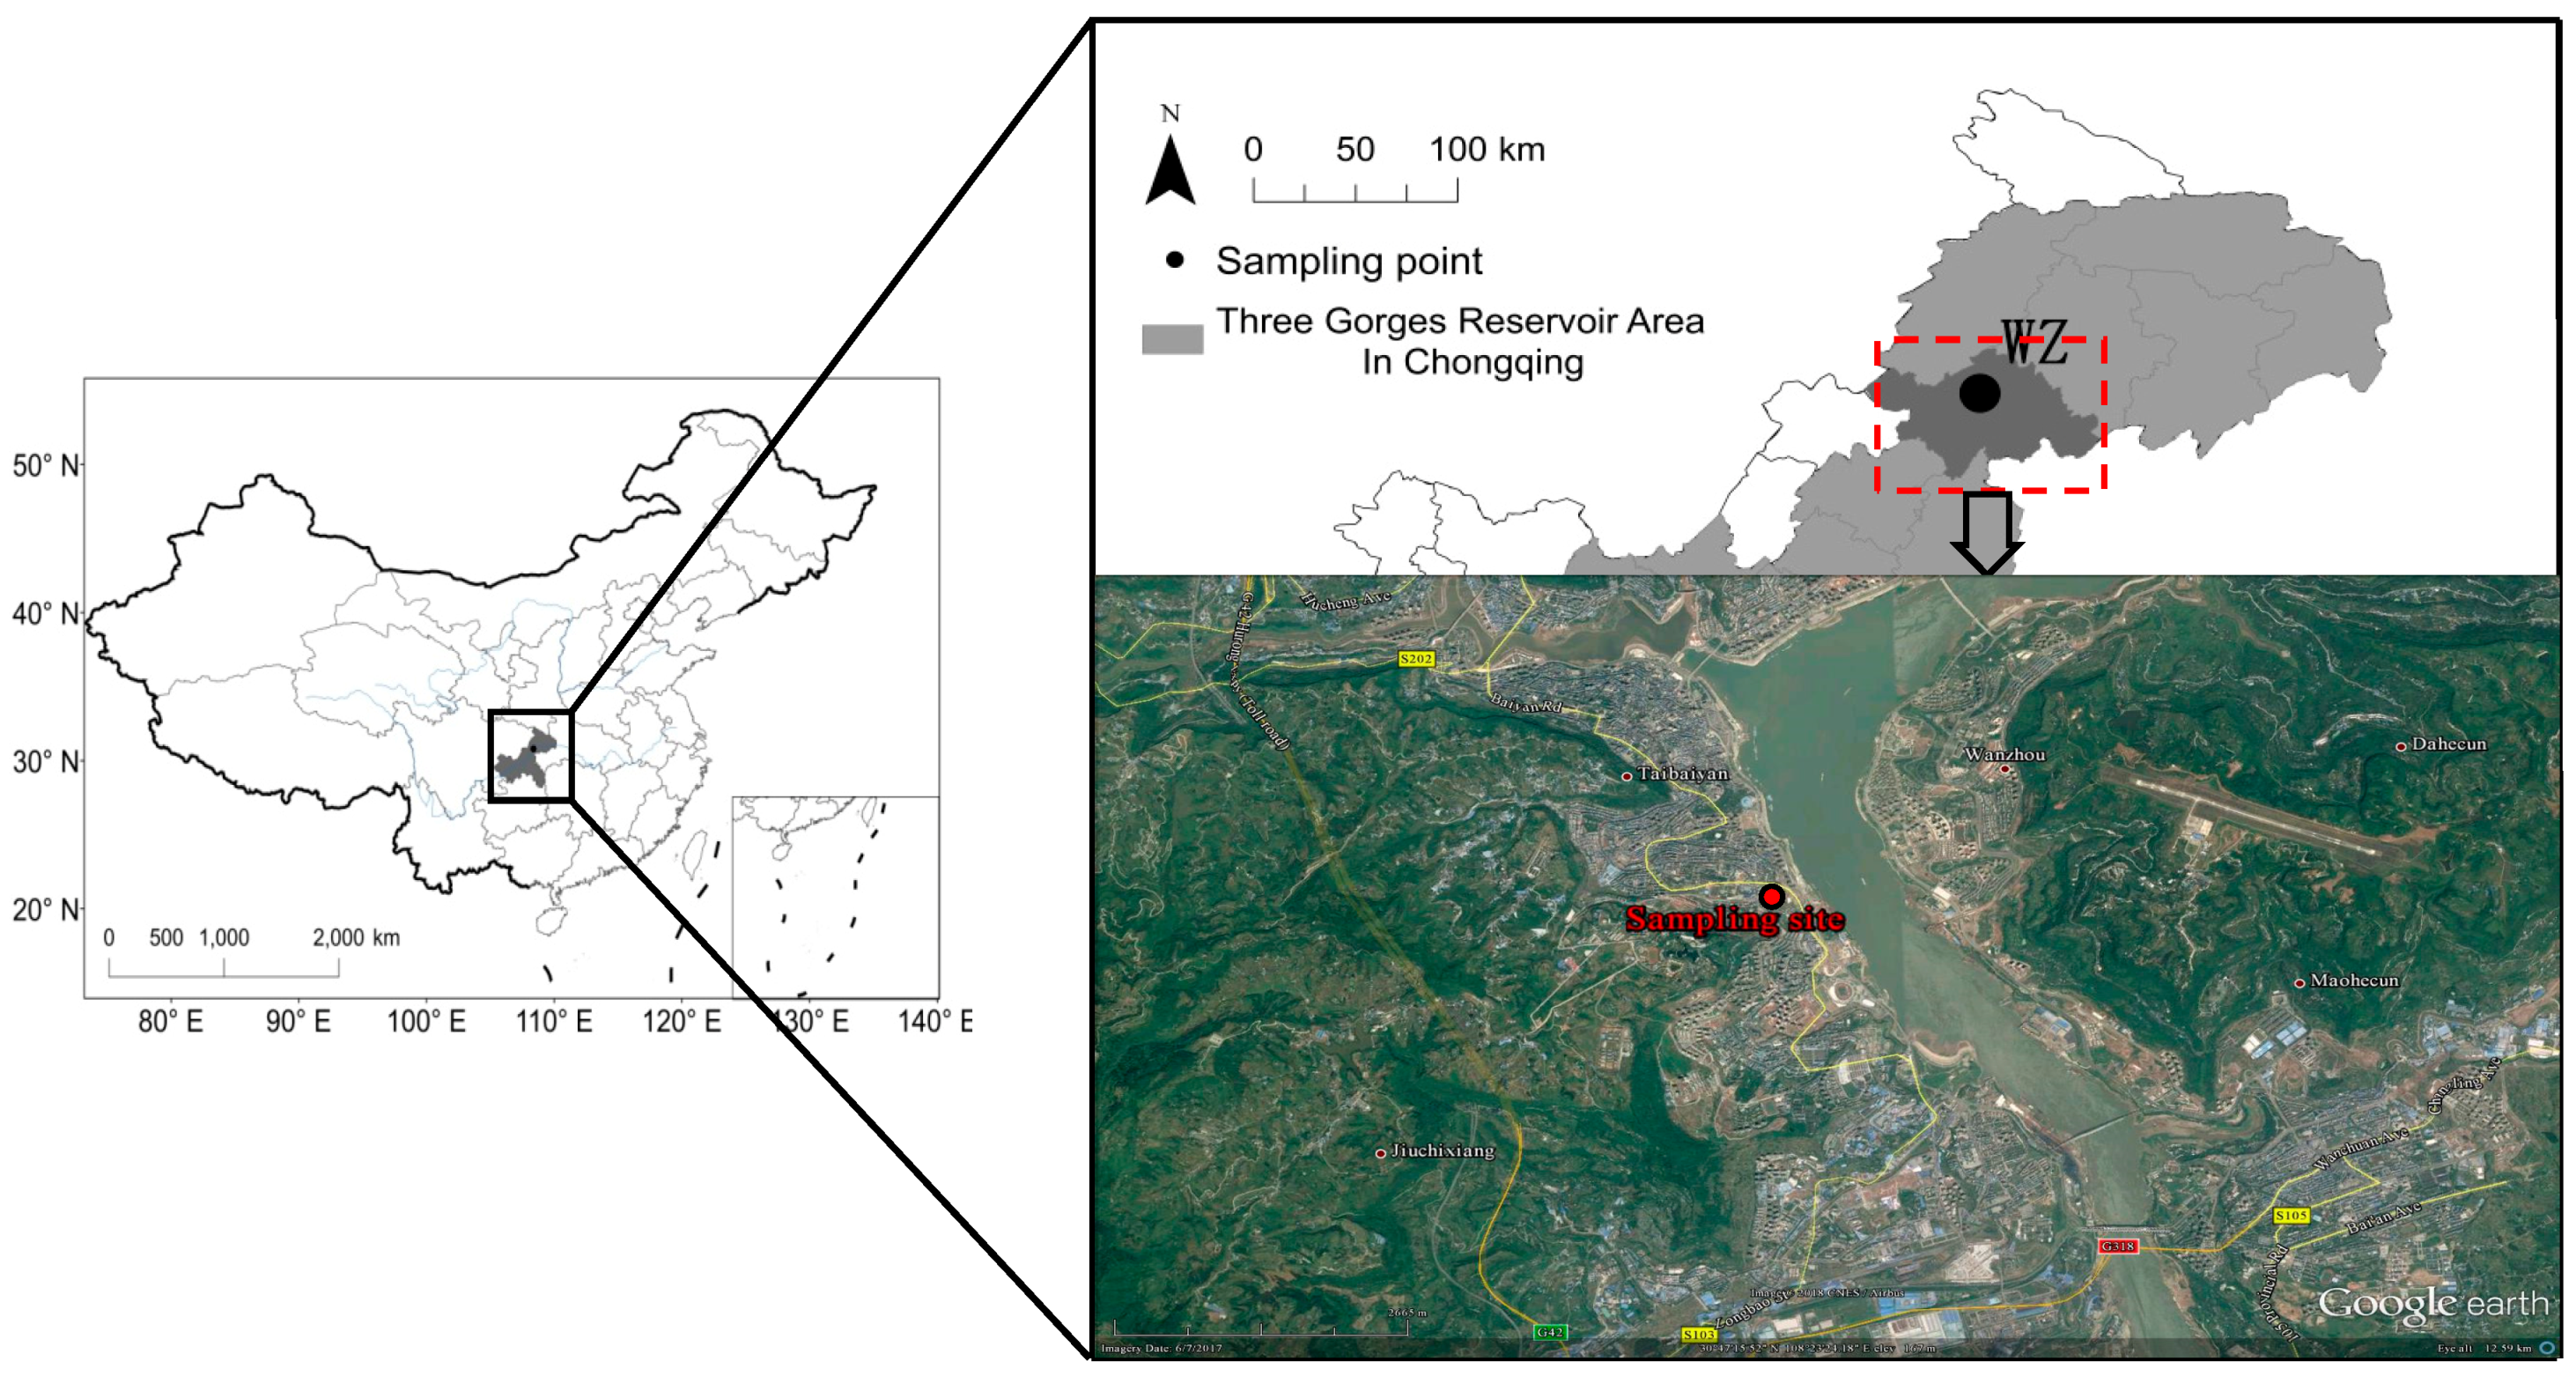
2.1. Experimental Site

Wanzhou is a district of Chongqing Municipality in southwestern China, about 228 km away from downtown Chongqing, located in the hinterland of the Three Gorges Reservoir (TGR) on the Yangtze River. Wanzhou experiences a sub-tropical monsoon climate, with sufficient annual rainfall and abundant sunshine. Influenced by the valley–mountain topographic conditions, the wind speed is very low, frequently less than 1.0 m∙s−1 all the year.
All measurements were conducted on the roof of the experimental building about 27 m above the ground (30.79° N, 108.37° E) within the Chongqing Three Georges University (Figure 1). The site is surrounded by busy streets, schools, residential buildings, shops and restaurants and so represents an urban area of Wanzhou.

2.2. Experimental Methods

Particulate carbonaceous aerosol was measured using a Sunset Laboratory semi-continuous OC/EC analyzer (Model 4, Sunset Laboratory Inc., Forest Grove, OR, USA) with a thermal-optical transmittance (TOT) protocol for pyrolysis correction. The ambient air was first sampled into a PM2.5 cyclone inlet with a flow rate of 8 L∙min−1, and then passed through a carbon parallel-plate diffusion denuder (from Sunset Lab.) to remove volatile organic compounds that may cause a positive bias in the OC concentrations measured [39]. The OC and EC were collected on a quartz fiber filter with an effective collection area of 1.13 cm2. The analyzer was programmed to collect aerosol for 45 min at the start of each hour, followed by the analysis of carbonaceous species during the remainder of the hour.
After sampling, the instrument oven was first purged with helium, and then the filter was heated according to a NIOSH-type temperature protocol [40], with a slight modification to the heating temperature according to previous studies [1,26]. The oven temperature was first increased to a maximum of 870 °C, thermally desorbing OC and pyrolysis carbon (PC) into a manganese dioxide (MnO2) oxidizing oven. Then the temperature was reduced to 550 °C; the carrier gas was switched to 10% oxygen in helium. A second temperature ramp was then initiated in the oxidizing gas stream and EC was oxidized off the filter and into the oxidizing oven. As the carbon components flowed through the MnO2 oven they were converted to CO2 and detected by a Non-Dispersive Infrared Absorption (NDIR) CO2 sensor. OC and EC were automatically quantified by dividing their peak areas by the internal calibration peak made by methane gas (5% CH4 in helium). The correction for the PC converted from OC to EC was performed by monitoring the transmittance of a pulsed He-Ne diode laser beam at 670 nm through the quartz filter during the sample analysis. Control calibrations by sucrose were conducted regularly and instrumental blanks (measured by an automatic reanalysis of the just analyzed filter) were determined once per day at 0:00 o’clock with the following average values: OC = 0.20 ± 0.10 μg; EC = 0.00 μg (the midnight sample collection were 15 min shorter). Dynamic blanks were also measured by adding a quartz fiber filter that was not prefired upstream of the denuder and using the same sampling time as during the measurement (in total 60 dynamic blank samples were collected) with the following averages: OC = 0.43 ± 0.25 μgC·m−3; EC = 0.01 μgC·m−3. The uncertainty of this system is reported to be 5% [41].
The sampling period was chosen to represent the four seasons, as follows: summer, 18 June 2013 to 31 August 2013; autumn, 1 September 2013 to 30 November 2013; winter, 1 December 2013 to 28 February 2014; and spring, 1 March 2014 to 31 May 2014. Due to instrument malfunction, data from 12 January to 7 February 2014 was excluded from our results. A total of ~300 days of data was collected on the instrument during this study. The meteorological parameters were also collected by an automatic weather station (WS500-UMB, GER) during the sampling period. As the sampling interval was set at 5 minutes, data for temperature, relative humidity (RH), and wind speed were averaged in the same periods as OC and EC.

3. Results and Discussion

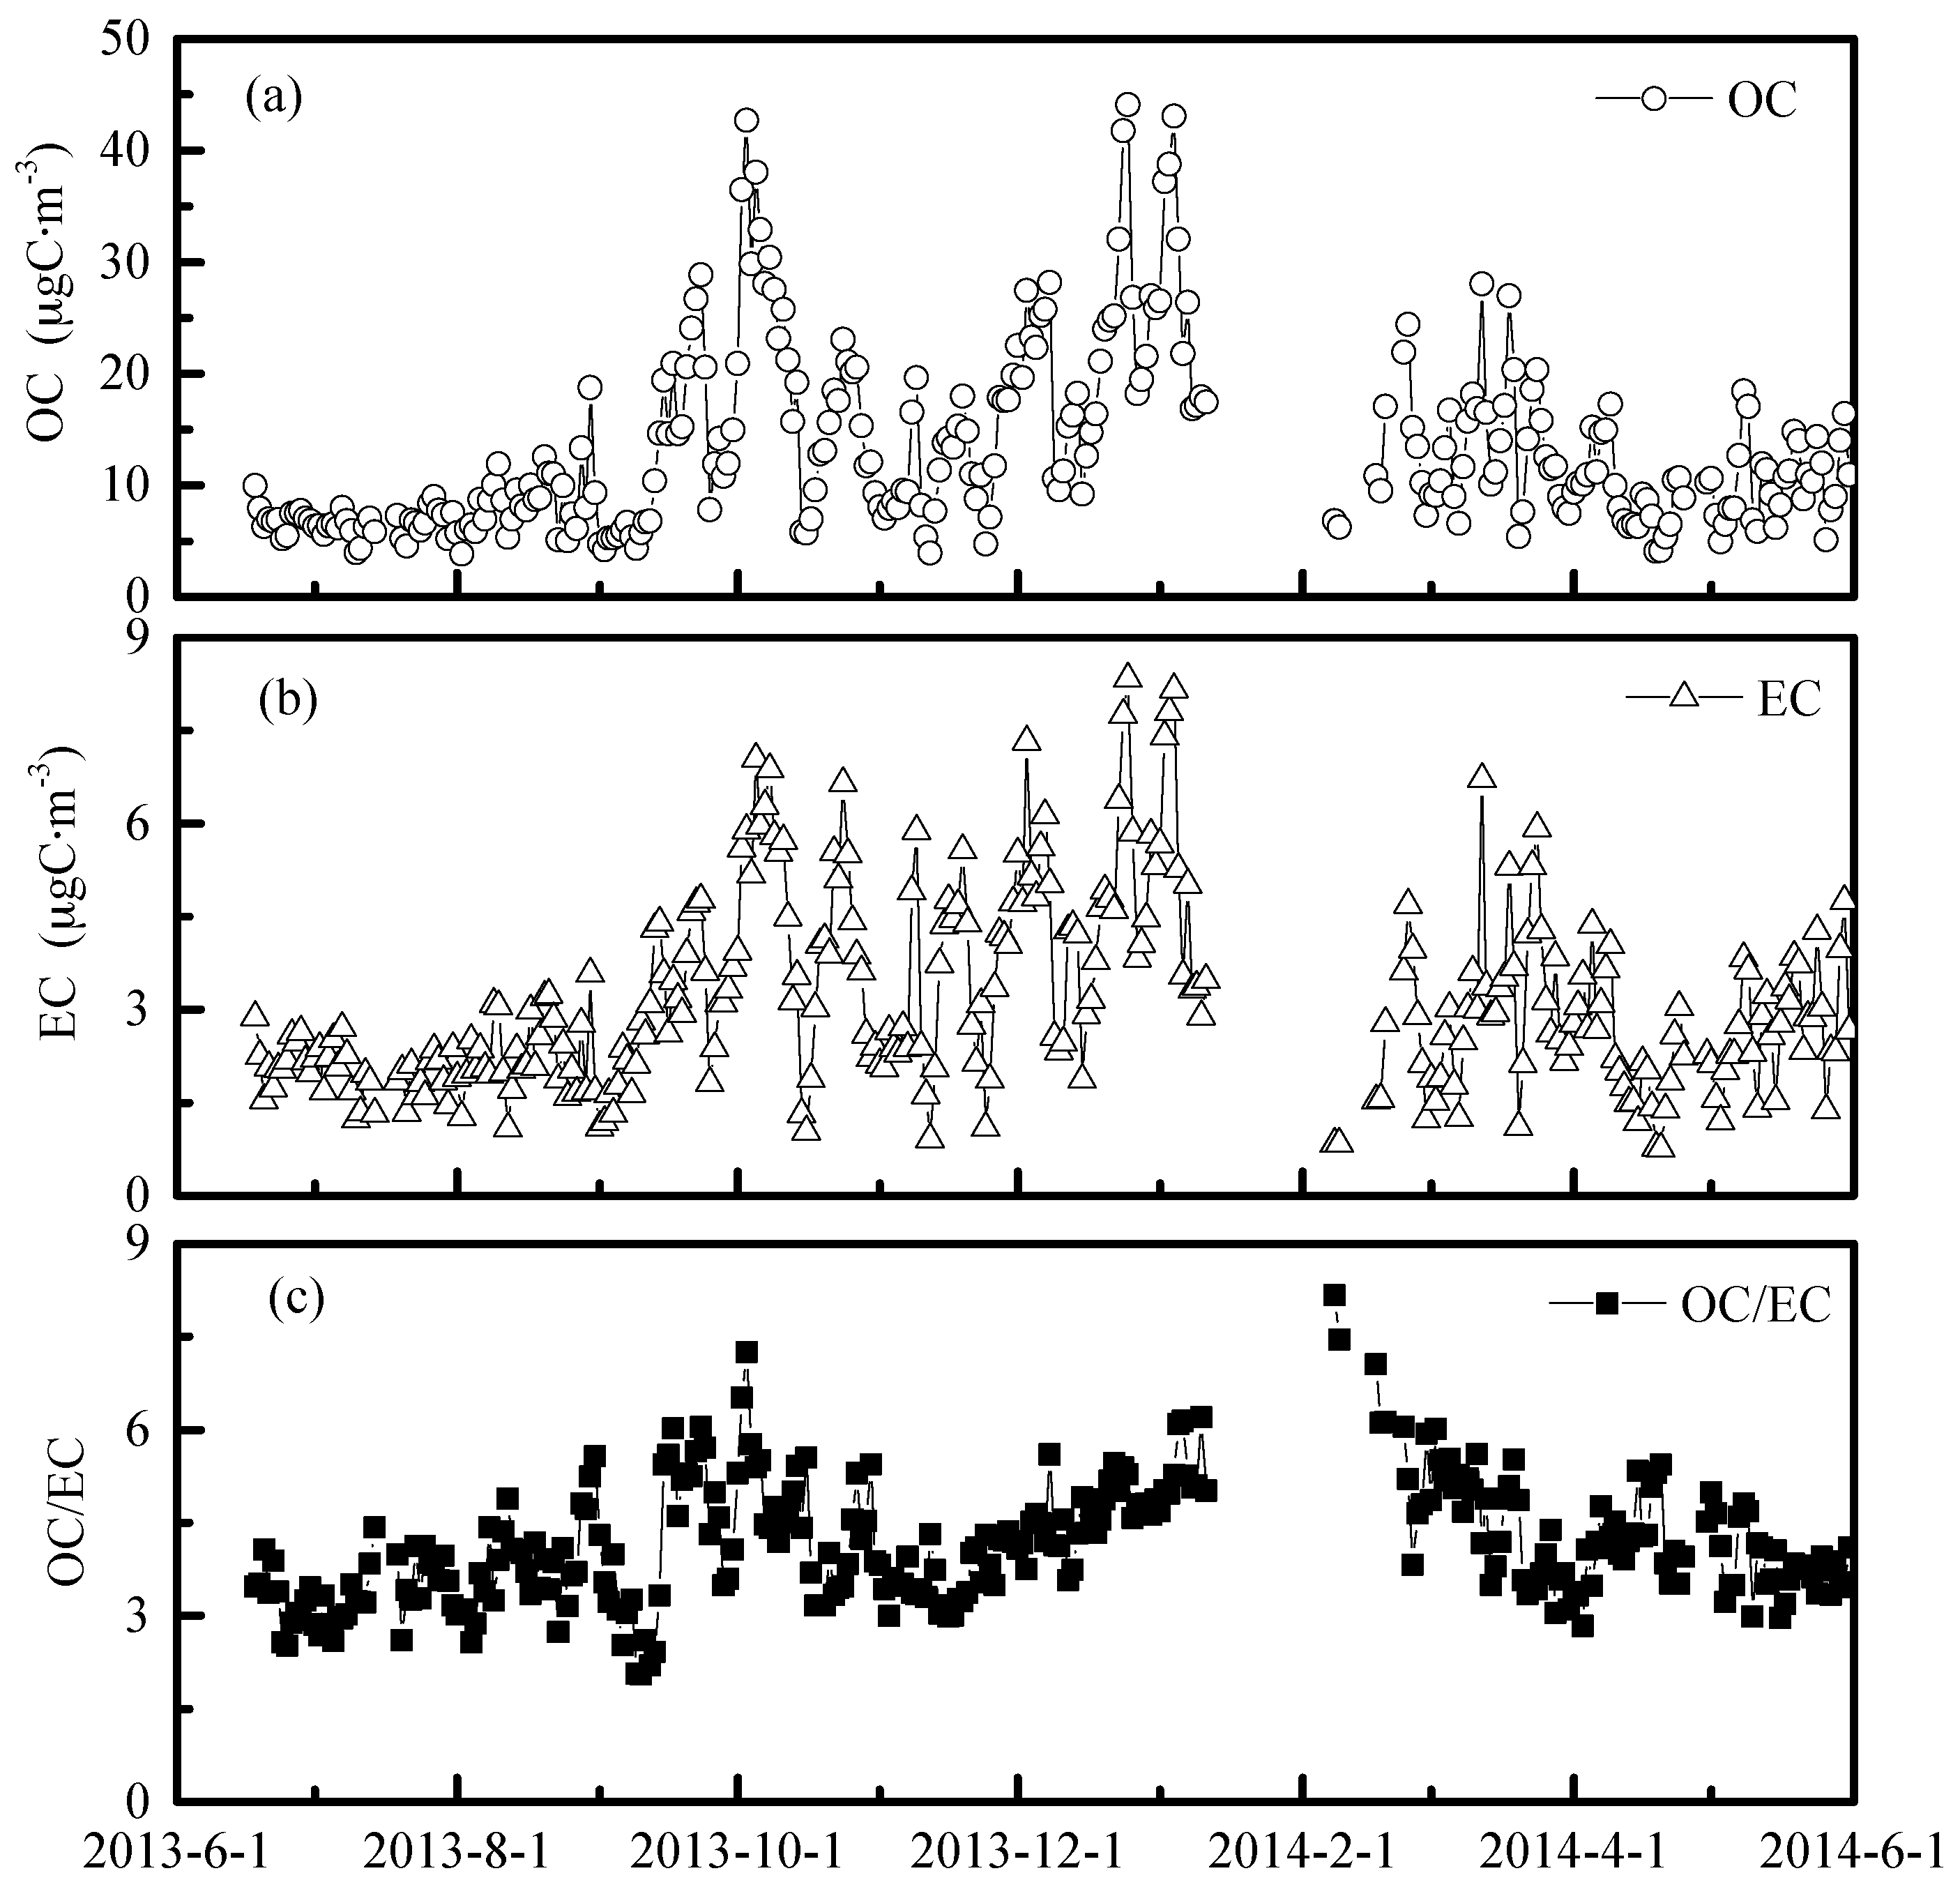
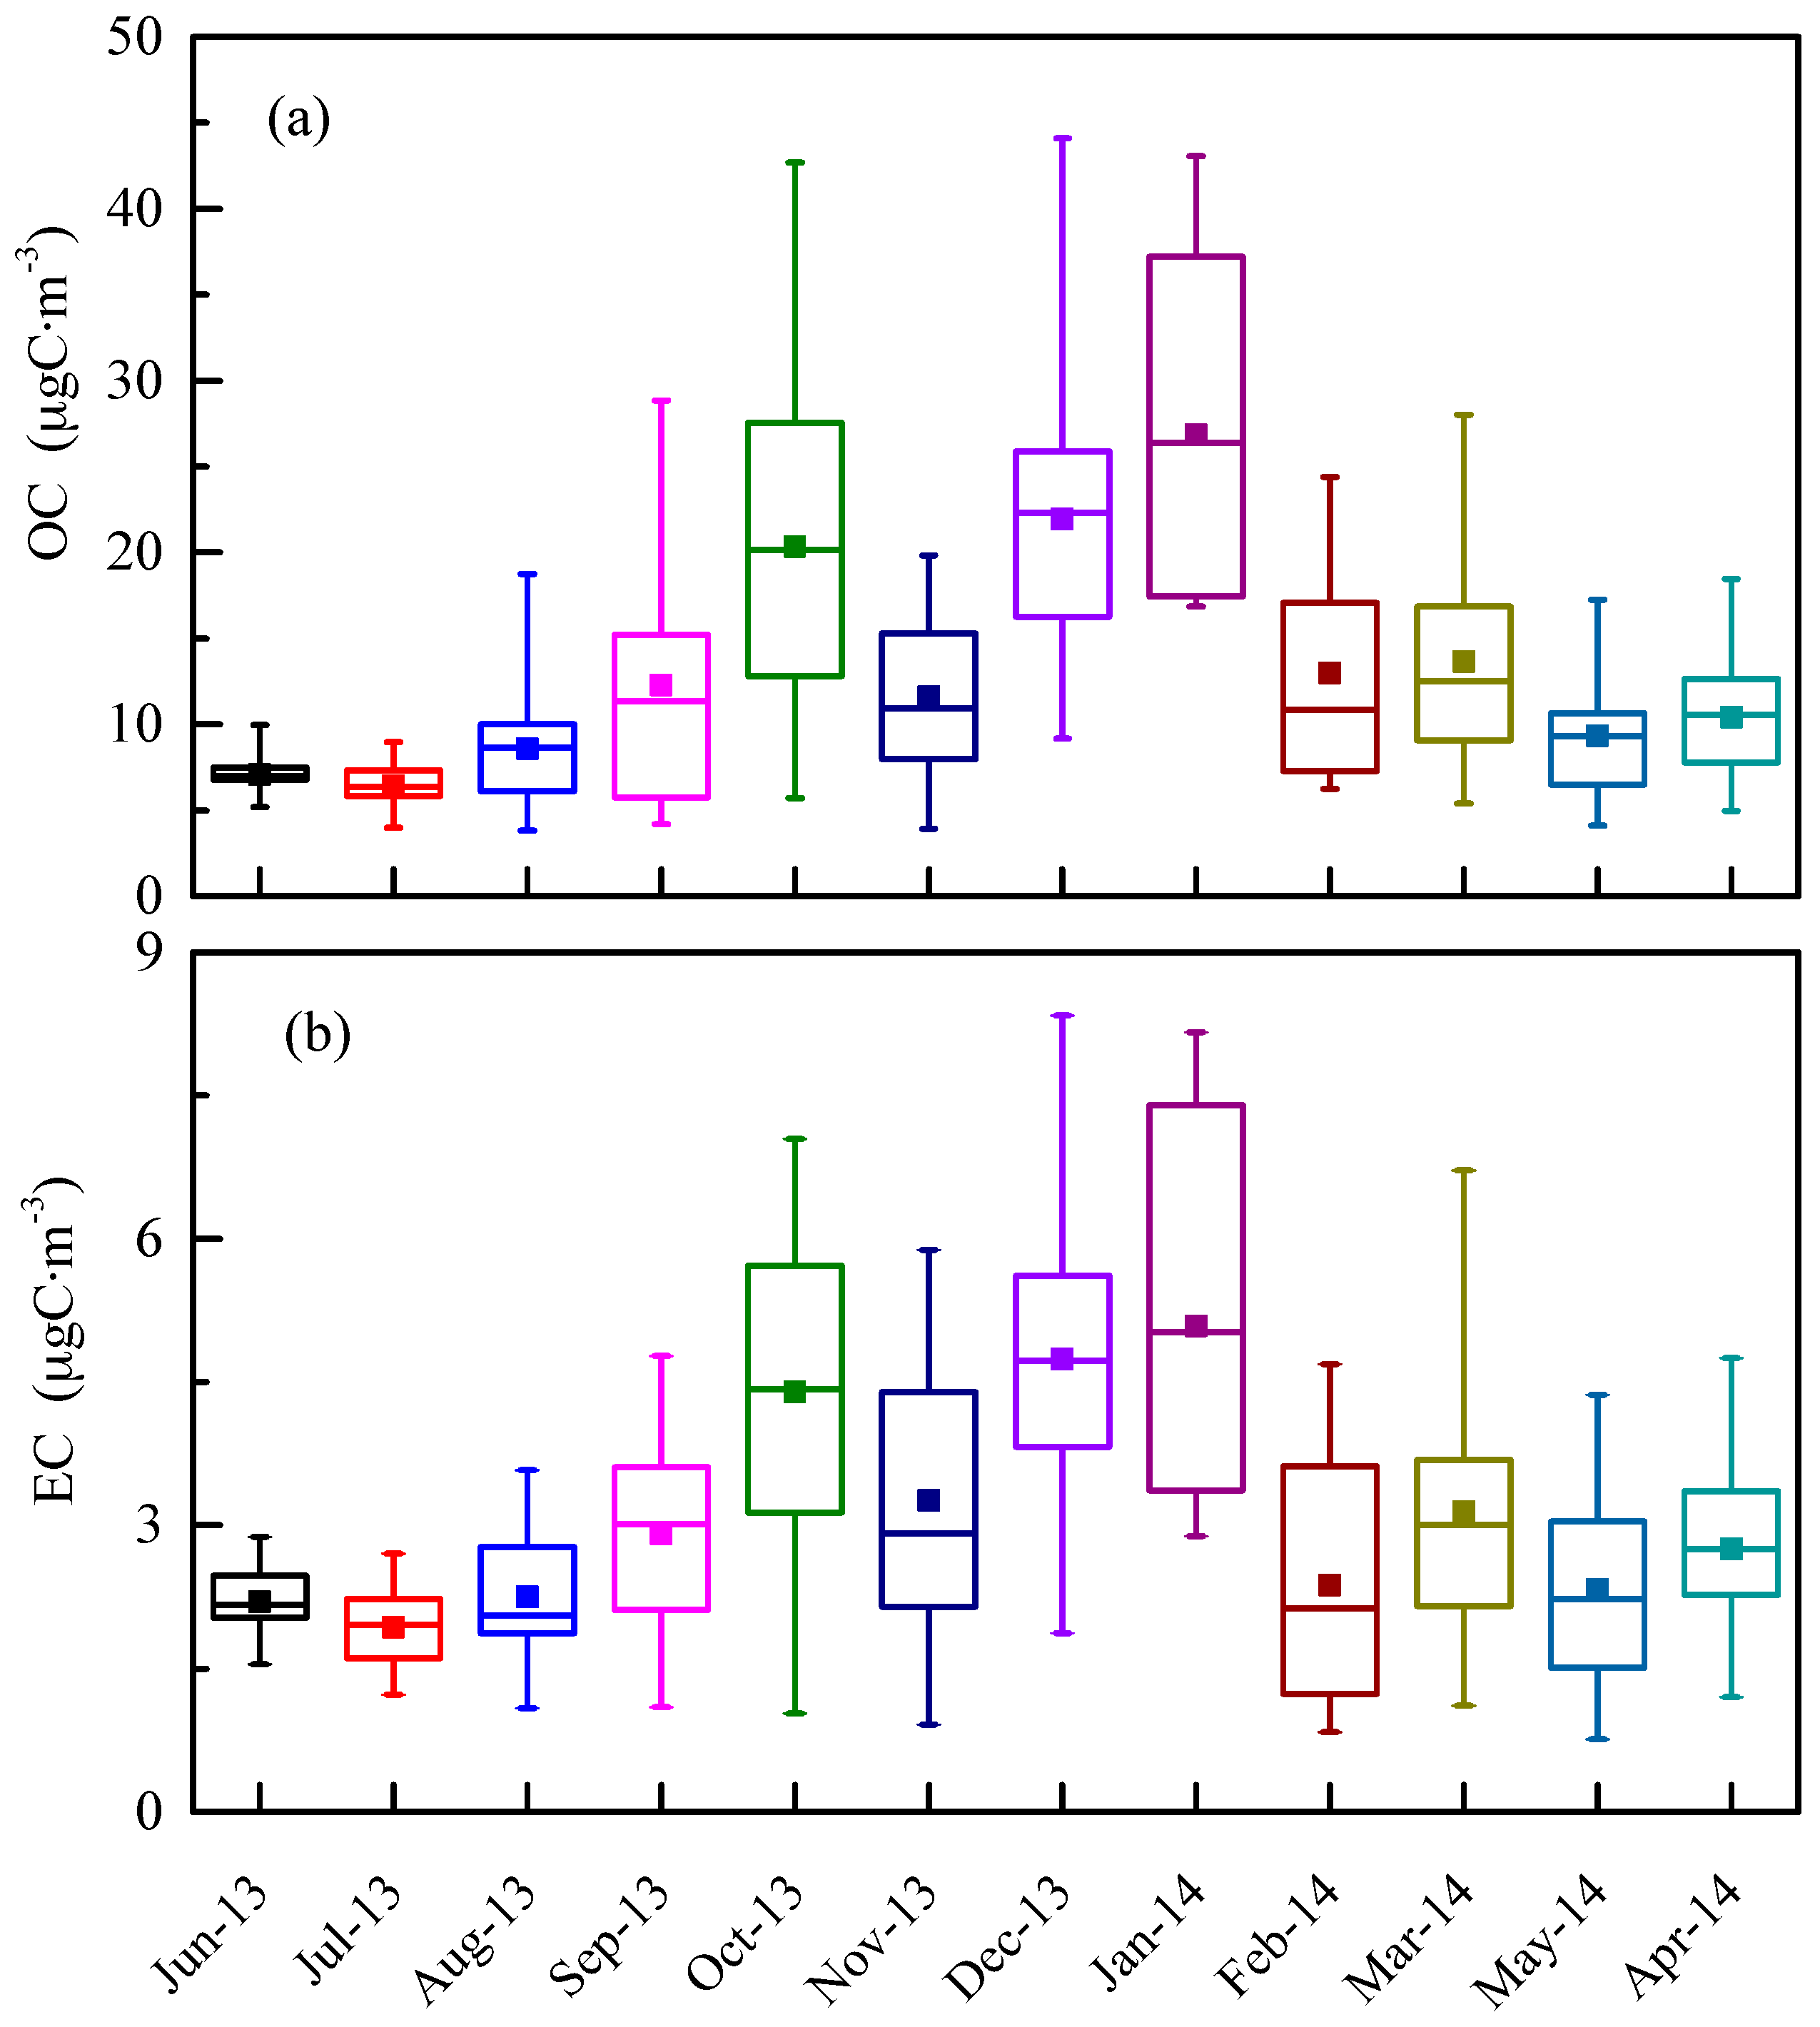
3.1. Seasonal Variations of OC and EC in PM2.5

As shown in Figure 2, OC and EC exhibited similar daily variations in Wanzhou. The daily average concentration of OC ranged from 3.84 to 44.09 μgC·m−3 with an average concentration of 13.16 ± 7.98 μgC·m−3, while EC concentration varied from 0.76 to 8.34 μgC·m−3 with an average concentration of 3.12 ± 1.51 μgC·m−3. OC and EC concentrations in this study are compared with those measured in other Chinese cities in Table 1. In spite of the incomparability of OC and EC data between the methods of NIOSH TOT, Interagency Monitoring of Protected Visual Environments (IMPROVE), thermal optical reflectance (TOR), and the two-step thermal procedure, total carbon (TC, TC = OC+ EC) measurements by those methods agree well [42,43]. The level of TC in Wanzhou was found to be similar to the urban sites in Shanghai, Quanzhou, and to the suburban site in Xiamen, but lower than the urban sites in Chongqing, Chengdu, Beijing, Tianjing, Guangzhou, and Wuhan in China. TC concentration contributed 25.3% to PM2.5 mass in Wanzhou. This fraction was comparable to that in most Chinese sites (17.6–41.4%).
Conversion of OC to organic matter (OM) is recognized as one of the most critical factors of uncertainty in mass closure calculations [44]. Turpin and Lim [45] suggested the use of different conversion factors according to site type: 1.6 ± 0.2 for urban areas, 1.9–2.3 for aged aerosols, and 2.2–2.6 for biomass burning. Taking into account that our site is an urban station, we used a value of 1.6 (OM = 1.6 × OC). Total carbonaceous aerosol (TCA) was calculated by the sum of EC and organic matter (OM). As Table 1 shows, TCA accounted for 38% of PM2.5, implying that TCA represented a major fraction of the PM2.5 mass in Wanzhou. This fraction was in accordance with findings in other Chinese sites (26.7–51.3%).
Figure 3 shows that monthly average OC values varied by nearly fourfold, from a low of 6.45 ± 1.19 μgC·m−3 (July 2013) to 26.84 ± 9.63 μgC·m−3 (January 2014), while the monthly average EC values varied by nearly threefold, from a low of 1.93 ± 0.40 μgC·m−3 (July 2013) to 5.08 ± 1.96 μgC·m−3 (January 2014). Both monthly OC and EC concentrations increased during autumn and peaked during winter. The seasonal concentrations of OC and EC are summarized in Table 2. The seasonal average OC concentrations in PM2.5 were 7.47 ± 2.37 μgC·m−3 for summer, 14.81 ± 8.39 μgC·m−3 for autumn, 21.11 ± 9.22 μgC·m−3 for winter, and 11.25 ± 4.65 μgC·m−3 for spring, while the average EC concentrations during the four seasons were 2.12 ± 0.51, 3.53 ± 1.51, 4.32 ± 1.86, and 2.76 ± 1.12 μgC·m−3, respectively. The OC and EC concentrations exhibited similar seasonal variations, with the descending order: winter > autumn > spring > summer. The seasonal characteristics of carbonaceous aerosols in Wanzhou can be explained as the combined impact of climatic conditions and local emissions. Though there was no central-heating period in winter as with northern cities in China, local emissions (coal and wood burning, small stoves used, etc.) also increased rapidly due to decentralized heating on cold days. At the same time, there was an increased combustion source attributed to the residents using wood-burning to cook their traditional bacon [37]. In addition, the urban area of Wanzhou is located in a valley surrounded by mountains that trap the pollutants within. As can also be seen from Table 2, the wind speed was lowest (0.78 m·s−1 in winter, 0.84, 0.95, 0.79 m·s−1 in spring, summer, and autumn, respectively) and RH was relatively higher in winter (78.0%, 80.2%, 69.2%, and 80.6% in winter, spring, summer, and autumn); these unfavourable geographical and meteorological conditions limited the dilution and dispersion of pollutants. In autumn, the enhanced emissions from biomass burning and frequent stable weather conditions mainly resulted in higher carbonaceous concentrations. In spring, the higher wind speeds facilitated the dispersion of pollutants. In the summer, rainfall was much more abundant (60–70% of annual precipitation in the summer, about 1181.5 mm on average) [51], and carbonaceous aerosol could be efficiently removed by wet scavenging [36]. The seasonal variations of OC and EC in this study were similar to other studies conducted in China [3,27,31,50].

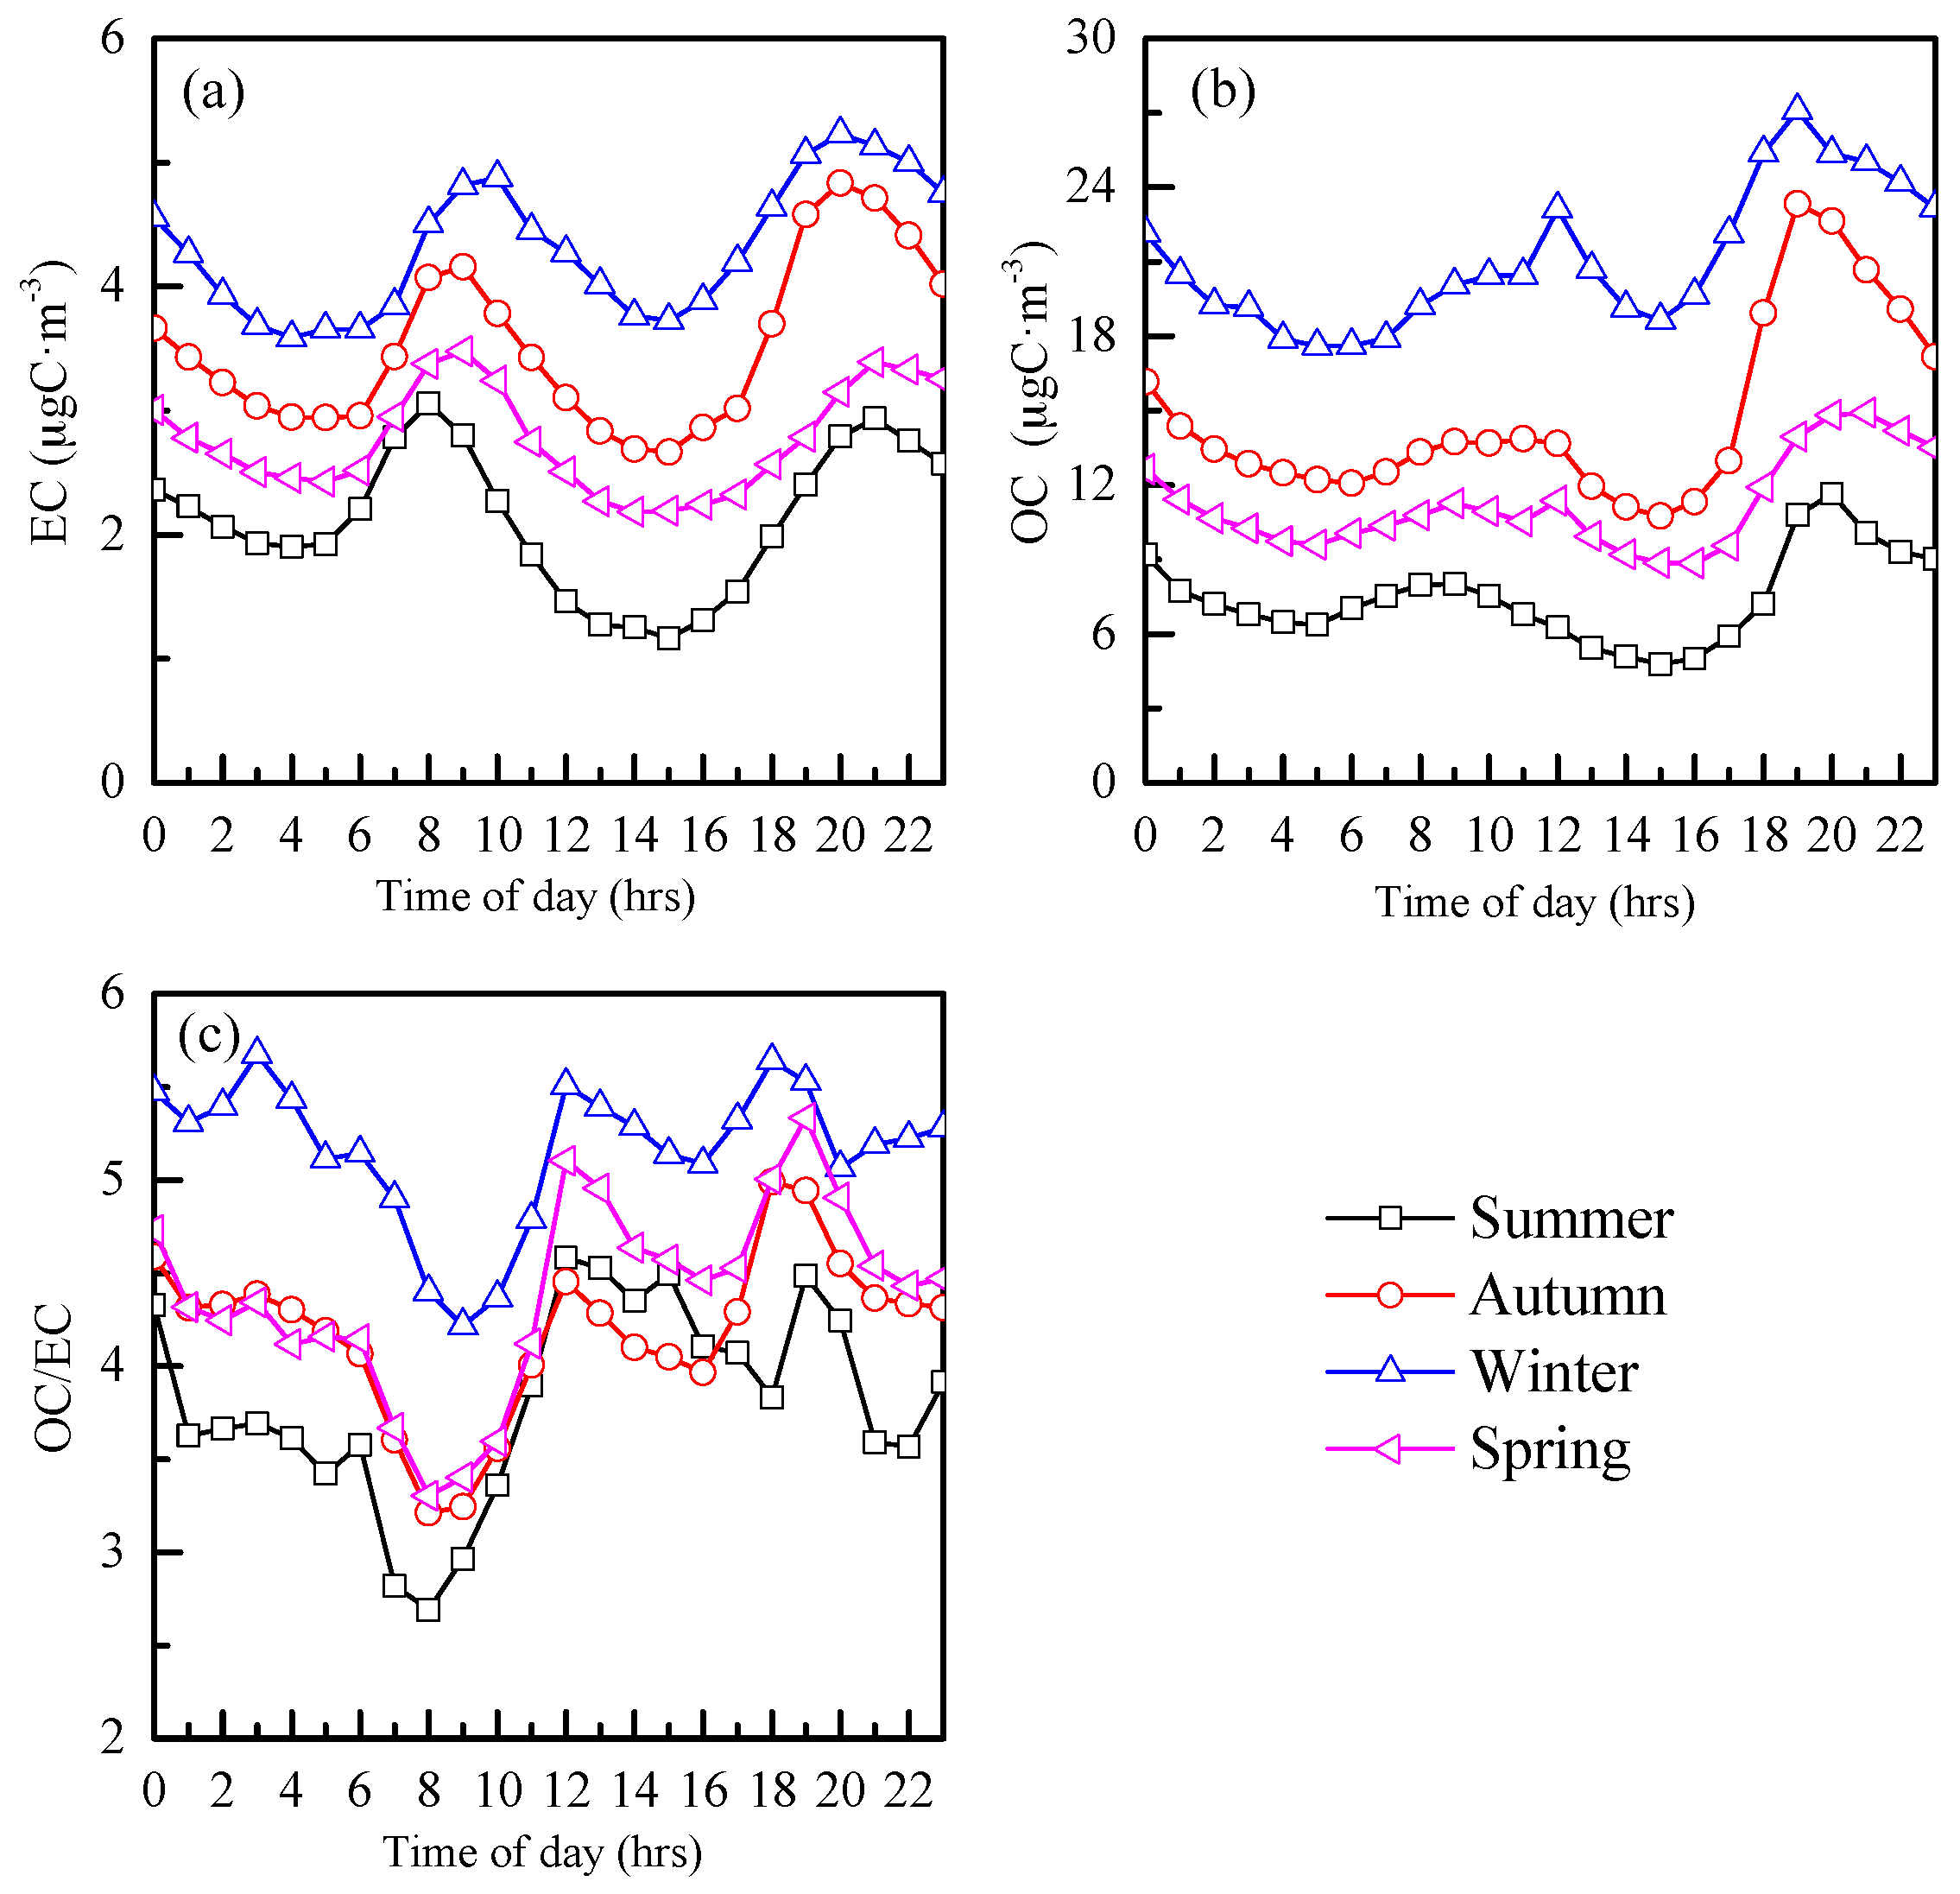
3.2. Diel Variations of OC and EC in PM2.5

The diel variations of OC and EC in different seasons are illustrated in Figure 4a,b. Pronounced EC diel variations were observed in different seasons, a bimodal pattern with a morning rush peak (8:00–10:00) and an evening peak (19:00–20:00). This bimodal trend was consistent with the local meteorological conditions and source emission. The EC distinct morning peak clearly corresponded to the morning traffic rush hour. The EC evening peak could be attributed to afternoon traffic emissions and cooking, combined with low mixing heights. The boundary layer usually becomes deeper in the afternoon because of strong solar radiation and turbulent eddies, providing a larger volume for diluting pollutants; hence the EC trough can be observed during this period (14:00–16:00). In comparison with EC, OC also showed a bimodal pattern, but there had broad maxima from 7:00 to 12:00 in summer, autumn, and spring. This phenomenon may be caused by the relative importance of sources of OC other than traffic existing at the site, such as secondary organic aerosol formation. In winter, the OC displayed a clearly bimodal pattern, with morning peak and evening peak occuring at 12:00 and 19:00–20:00 local time, respectively. The midday peak could be due to the longer existence of the inversion layer in the mountain area in winter. This phenomenon was also observed in EC diel variation; the EC morning peak time was delayed by about one to two hours during the winter. The later onset of the morning buildup and the earlier onset of the evening accumulation in winter compared to summer corresponded with the later sunrises and earlier sunsets in winter. The highest concentrations of both EC and OC were observed during the winter evenings and nights when there was the highest need for residential heating. However, the main factor for the higher night-time OC and EC concentrations (in all seasons) was probably a lower on average nocturnal mixing boundary layer in comparison with the daylight hours. Therefore, regardless of the season, the diel minima of EC and OC were found during the afternoon with both the highest temperature and a thicker mixing boundary layer.
The OC/EC ratio was rather variable within the day (Figure 4c). The diel variations of OC/EC ratios exhibited two peaks around the time 12:00 and 19:00 in summer, autumn, and spring. The midday OC/EC maximum can be due to the formation of SOC when the photochemical activity was intensive under favourable meteorological conditions. The evening OC/EC maximum may be owing to the surface inversion formed after sunset, trapping more secondary organic carbon in the shallow boundary layer. Unlike other seasons, the OC/EC ratio exhibited a third peak at 3:00 in winter. One possible reason for this phenomenon was residential heating (coal and wood burning, small stoves used, etc.) used during the cold winter night. The diel variations of OC/EC ratios in different seasons showed minimum values during the morning rush hour (8:00–9:00) when OC and EC concentrations build up, probably due to the increased contributions from primary emissions. In general, the OC/EC ratio in winter was higher than the other three seasons. There may be two reasons for this phenomenon: one is attributed to the increased combustion emissions as depicted in Section 3.1, the other one is that the adverse meteorological conditions in winter limited the dilution and dispersion of pollutants, and created conditions for the condensation or adsorption of volatile organic compounds.

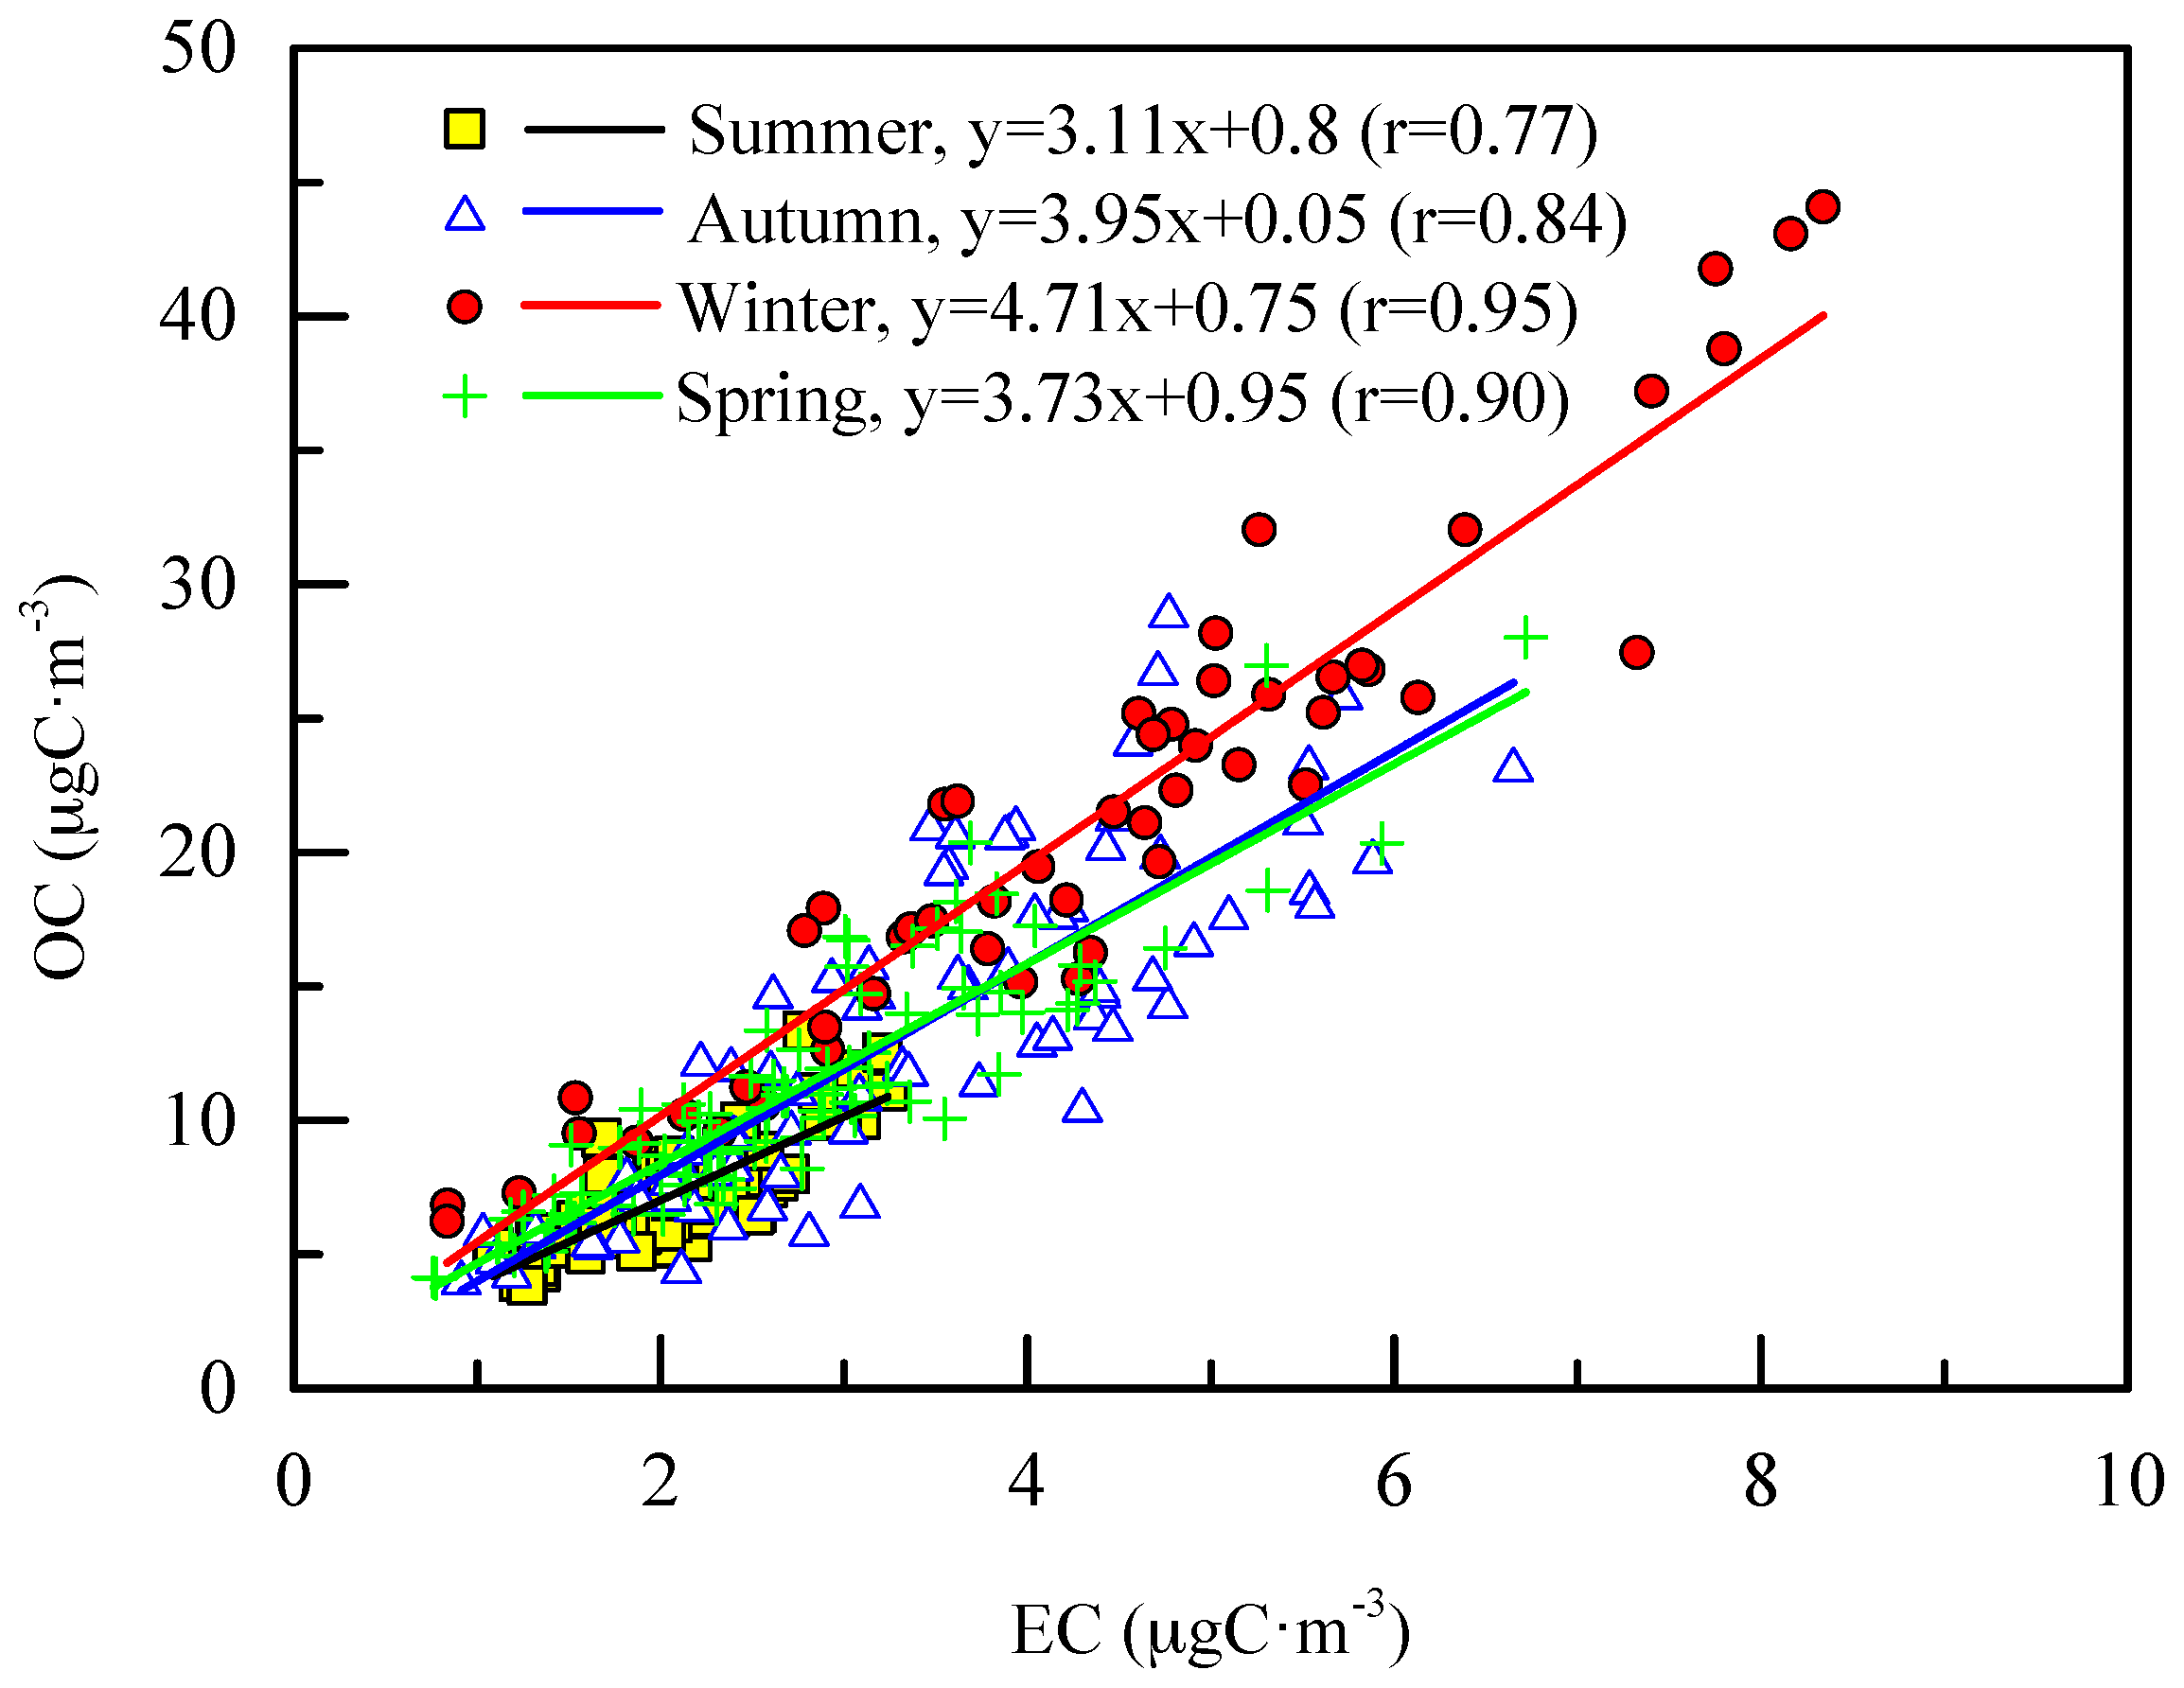
3.3. Relationship between OC and EC

As mentioned above, EC comes mainly from incomplete combustion emissions such as coal consumption, vehicle exhaust, and biomass burning. OC originates from both primary and secondary sources. Since primary OC and EC are mostly generated from the same sources, EC can be used as a tracer for primary combustion generated OC [52]. The relationship between OC and EC is very useful in assessing the original sources of carbonaceous particles [32,53]. As shown in Figure 5, the higher correlations between EC and OC were in winter (0.95) and spring (0.91). The poorer correlation (but still high) was observed in the summer (0.77). The strong winter and spring correlations indicated the presence of common dominant sources for OC and EC (e.g., biomass burning, coal combustion, and motor vehicle exhaust) in the vicinity of the site. On the contrary, the lower correlation in summer and autumn indicated some independent OC sources without the presence of EC such as biogenic and secondary organic aerosols [26]. The regression slopes varied from 3.11 to 4.71, implying that there is a seasonal variability in emission sources and SOA contributions.
The OC/EC ratio has been used to study the emission and transformation characteristics of carbonaceous aerosol. Typical emission sources of carbonaceous fractions include vehicle exhaust (2.5–5.0) [54], coal combustion (2.5–10.5) [55], and biomass burning (4.3–79.7) [56,57], respectively. It should be noted that the OC/EC ratios presented above were all measured by the TOT method, and were comparatively higher than the values by TOR [58]. As shown in Figure 2 and Table 2, the daily average OC/EC ratio varied between 2.05 and 8.17 with an average of 4.15 for the whole study period. The OC/EC ratio showed seasonal variations with a high value in winter (5.03) and a low value in summer (3.55). This seasonal pattern of higher wintertime OC/EC ratio was also observed in PRDR [33] and Shanghai [34]. The elevated OC/EC ratio in winter could be attributed to several reasons. Firstly, coal combustion and biomass emission for winter heating contribute more to OC than EC, and also increase the emission of volatile organic precursors. Peng et al. [38] found that TC in PM2.5 had a stronger relationship with water-soluble potassium (K+) in winter than in summer, suggesting biomass burning contributed significantly to the carbon pollution in Wanzhou. Secondly, a stable atmosphere and low temperatures can facilitate the accumulation of air pollutants and create conditions for the condensation or adsorption of volatile organic compounds. Thirdly, the low mixing layer height in winter would enhance the SOC formation [59].

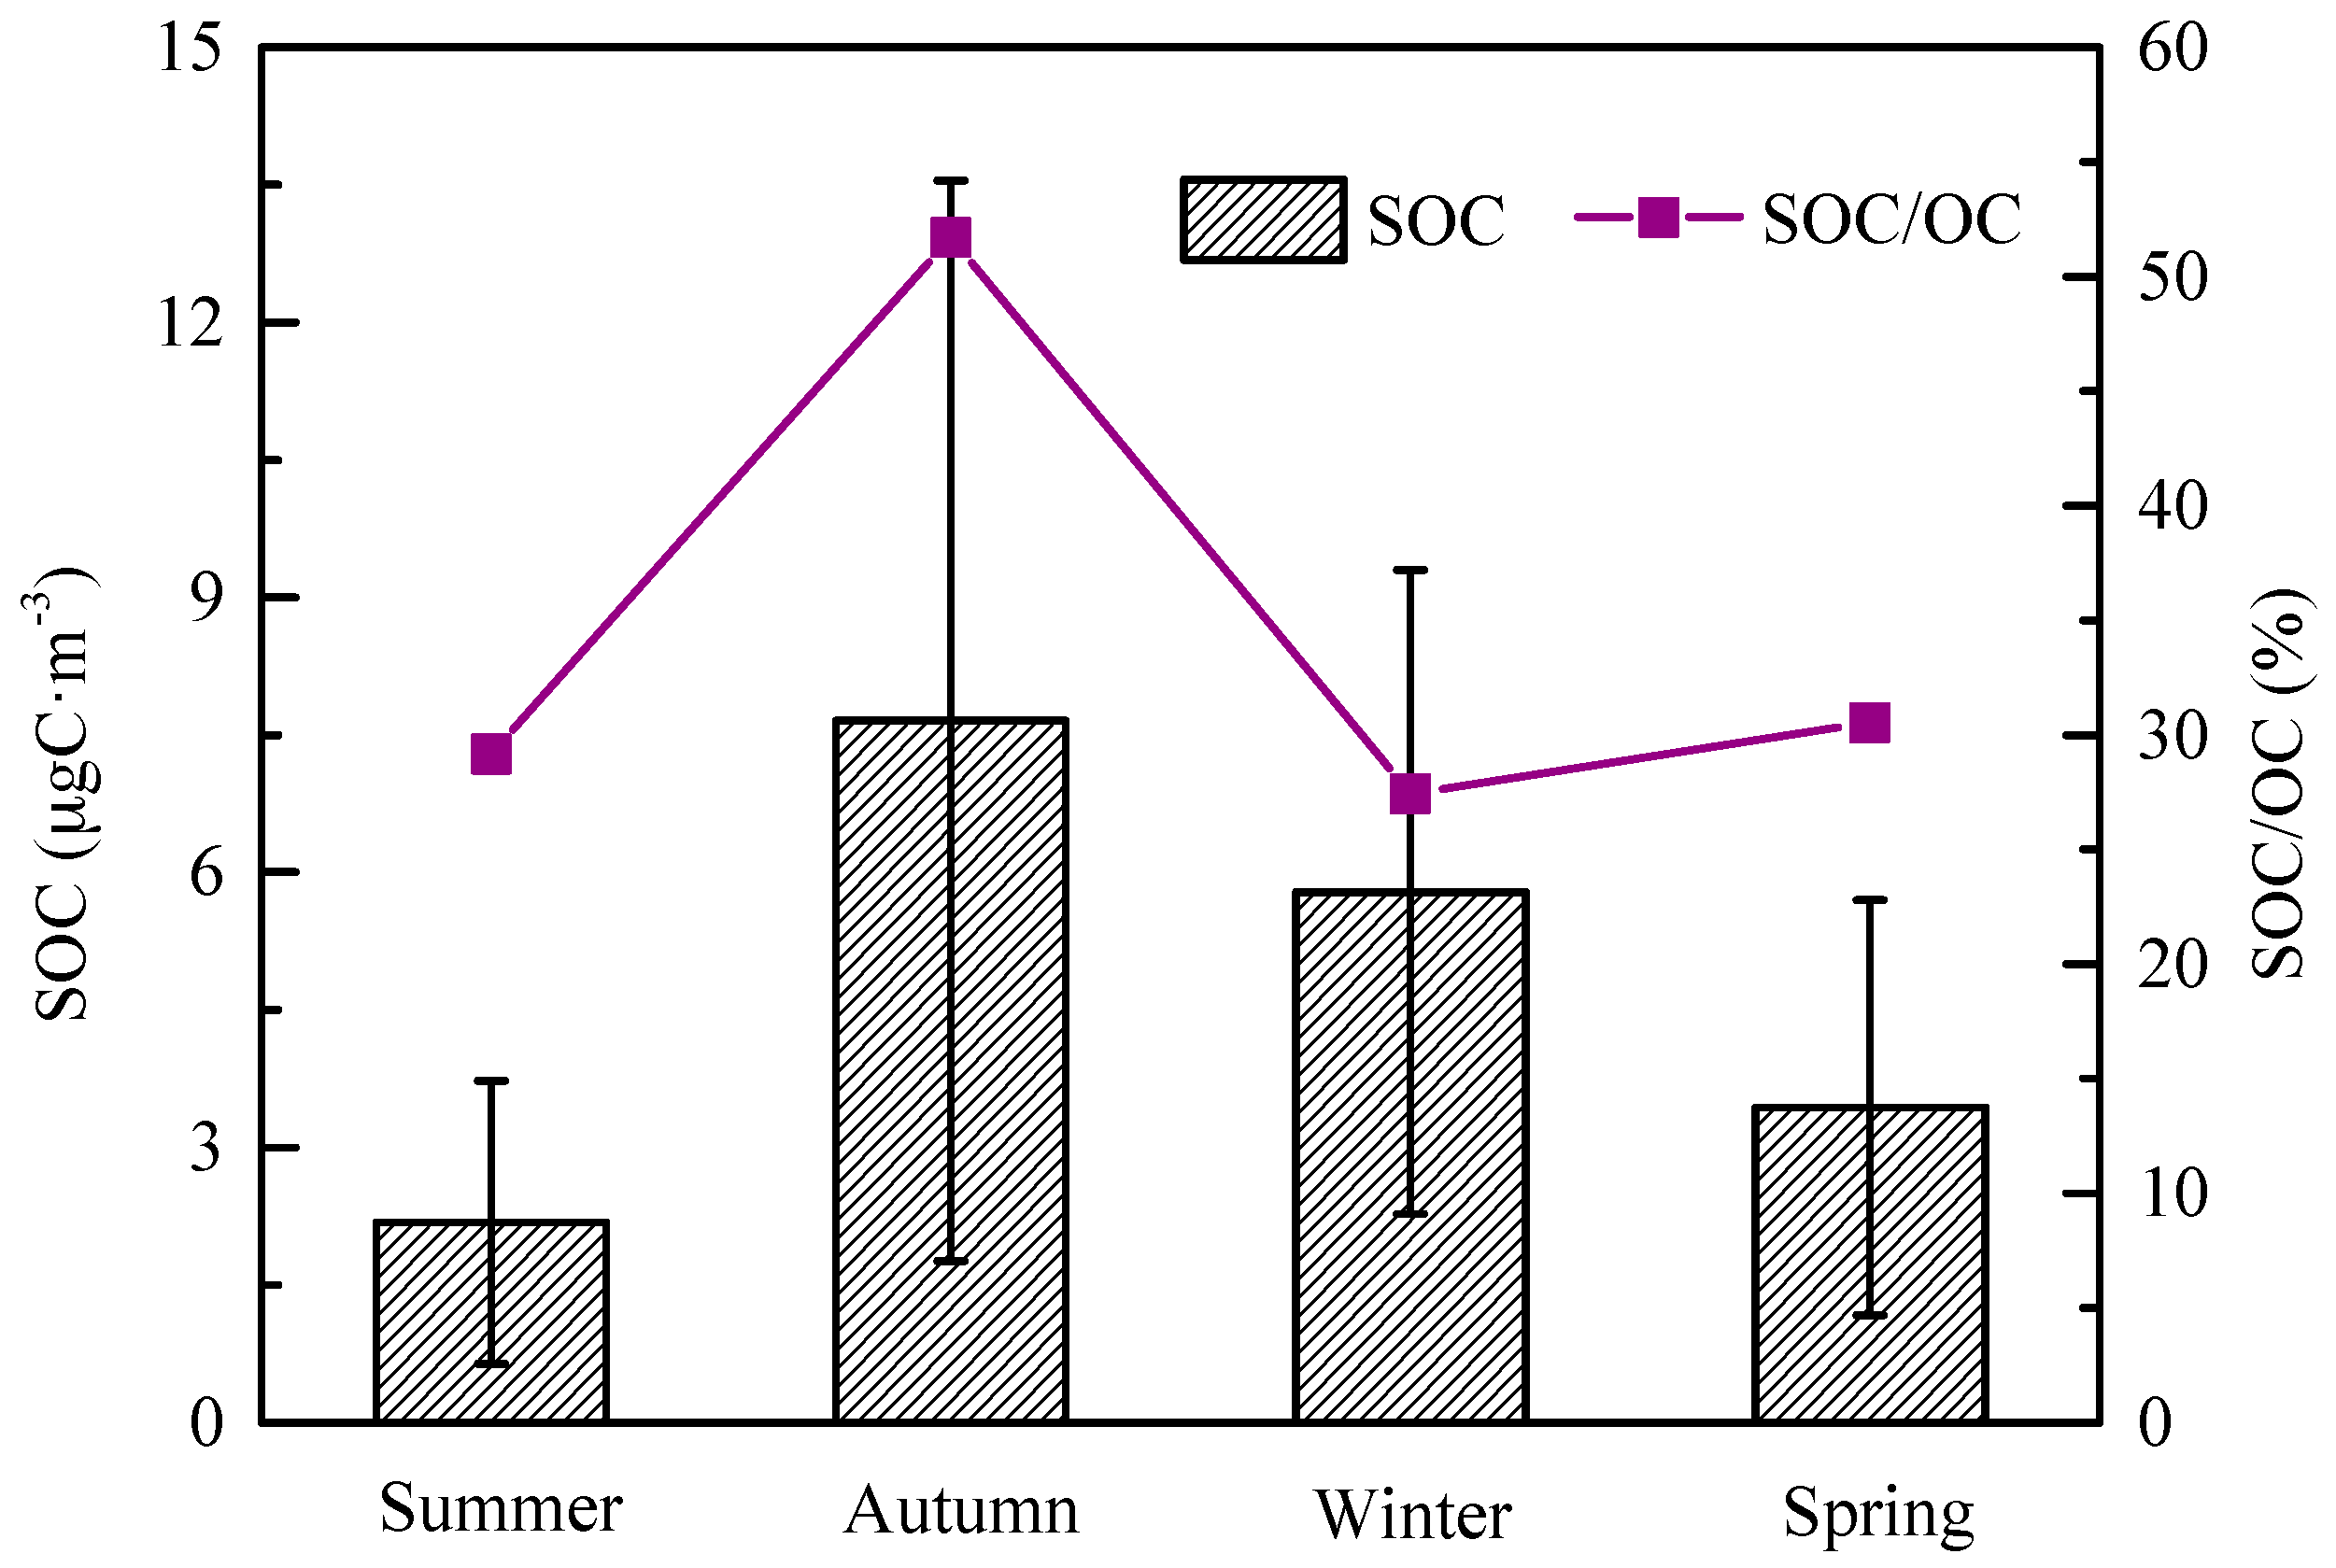
3.4. Estimation of Secondary Organic Carbon Concentration

Appel et al. [60] pointed out that high OC/EC ratios indicated the formation of SOC from gaseous precursors through the photochemical process. Chow et al. [53] observed that the ratios of OC/EC exceeding 2.0 can be used to identify SOC formation. In this study, all the values of OC/EC were larger than 2.0, indicating the formation of SOC during the sampling period. Castro et al. [61] suggested using the minimum OC/EC ratios in the EC tracer method to calculate SOC; the equation is as follows:
SOC = OC EC × ( OC / EC ) min
where (OC/EC)min is the minimum of the OC/EC ratios observed during the sampling time. An estimation of SOC in Wanzhou was made according to Equation (1). It must be noted that this method can give only semi-quantitative information because of the high uncertainties associated with them. As discussed in Section 3.2 and Section 3.3, the ratios of OC/EC can be affected by the meteorology and local sources. Taking these into consideration, the (OC/EC)min observed for each season was used in calculation: the values were 2.52 in summer, 2.05 in autumn, 3.57 in winter, and 2.84 in spring. These values were comparable with those of Guangzhou (2.3–4.5) [33], Shanghai (2.7–4.1) [34], and Xiamen (2.4) [50].
The seasonal variations of SOC concentrations and SOC/OC ratios are depicted in Figure 6. The seasonal variations of the estimated SOC concentrations were 2.19 ± 1.55 μgC·m−3, 7.66 ± 5.89, 5.79 ± 3.51, and 3.43 ± 2.26 in summer, autumn, winter, and spring, respectively. The relative proportion of the estimated SOC in OC was highest in autumn (52.7%) and roughly comparable in spring (30.5%), summer (29.2%), and winter (27.4%). This implied that the relative contribution of SOC to OC in PM2.5 was only comparable to that of POC to OC in autumn, while in the other three seasons, OC was dominated by POC. High SOC/OC ratio in autumn in Wanzhou could be due to the abundant sunlight and less precipitation as well as a stagnated atmospheric condition which provided favorable conditions for photochemical production of SOC and accumulation of pollutants. In wintertime, the averaged SOC concentrations were also higher compared to those in summer and spring, but its abundance in OC was smallest. The rather high absolute SOC contribution in winter could be due to the low mixing heights and stagnated weather conditions favoring the formation and accumulation of secondary organic aerosols. However, the stagnating weather conditions usually lead to high concentrations of all pollutants (both primary and secondary OC). The similar seasonal variation trend was also found in Beijing [42], Shanghai [34], and Tianjin [31].

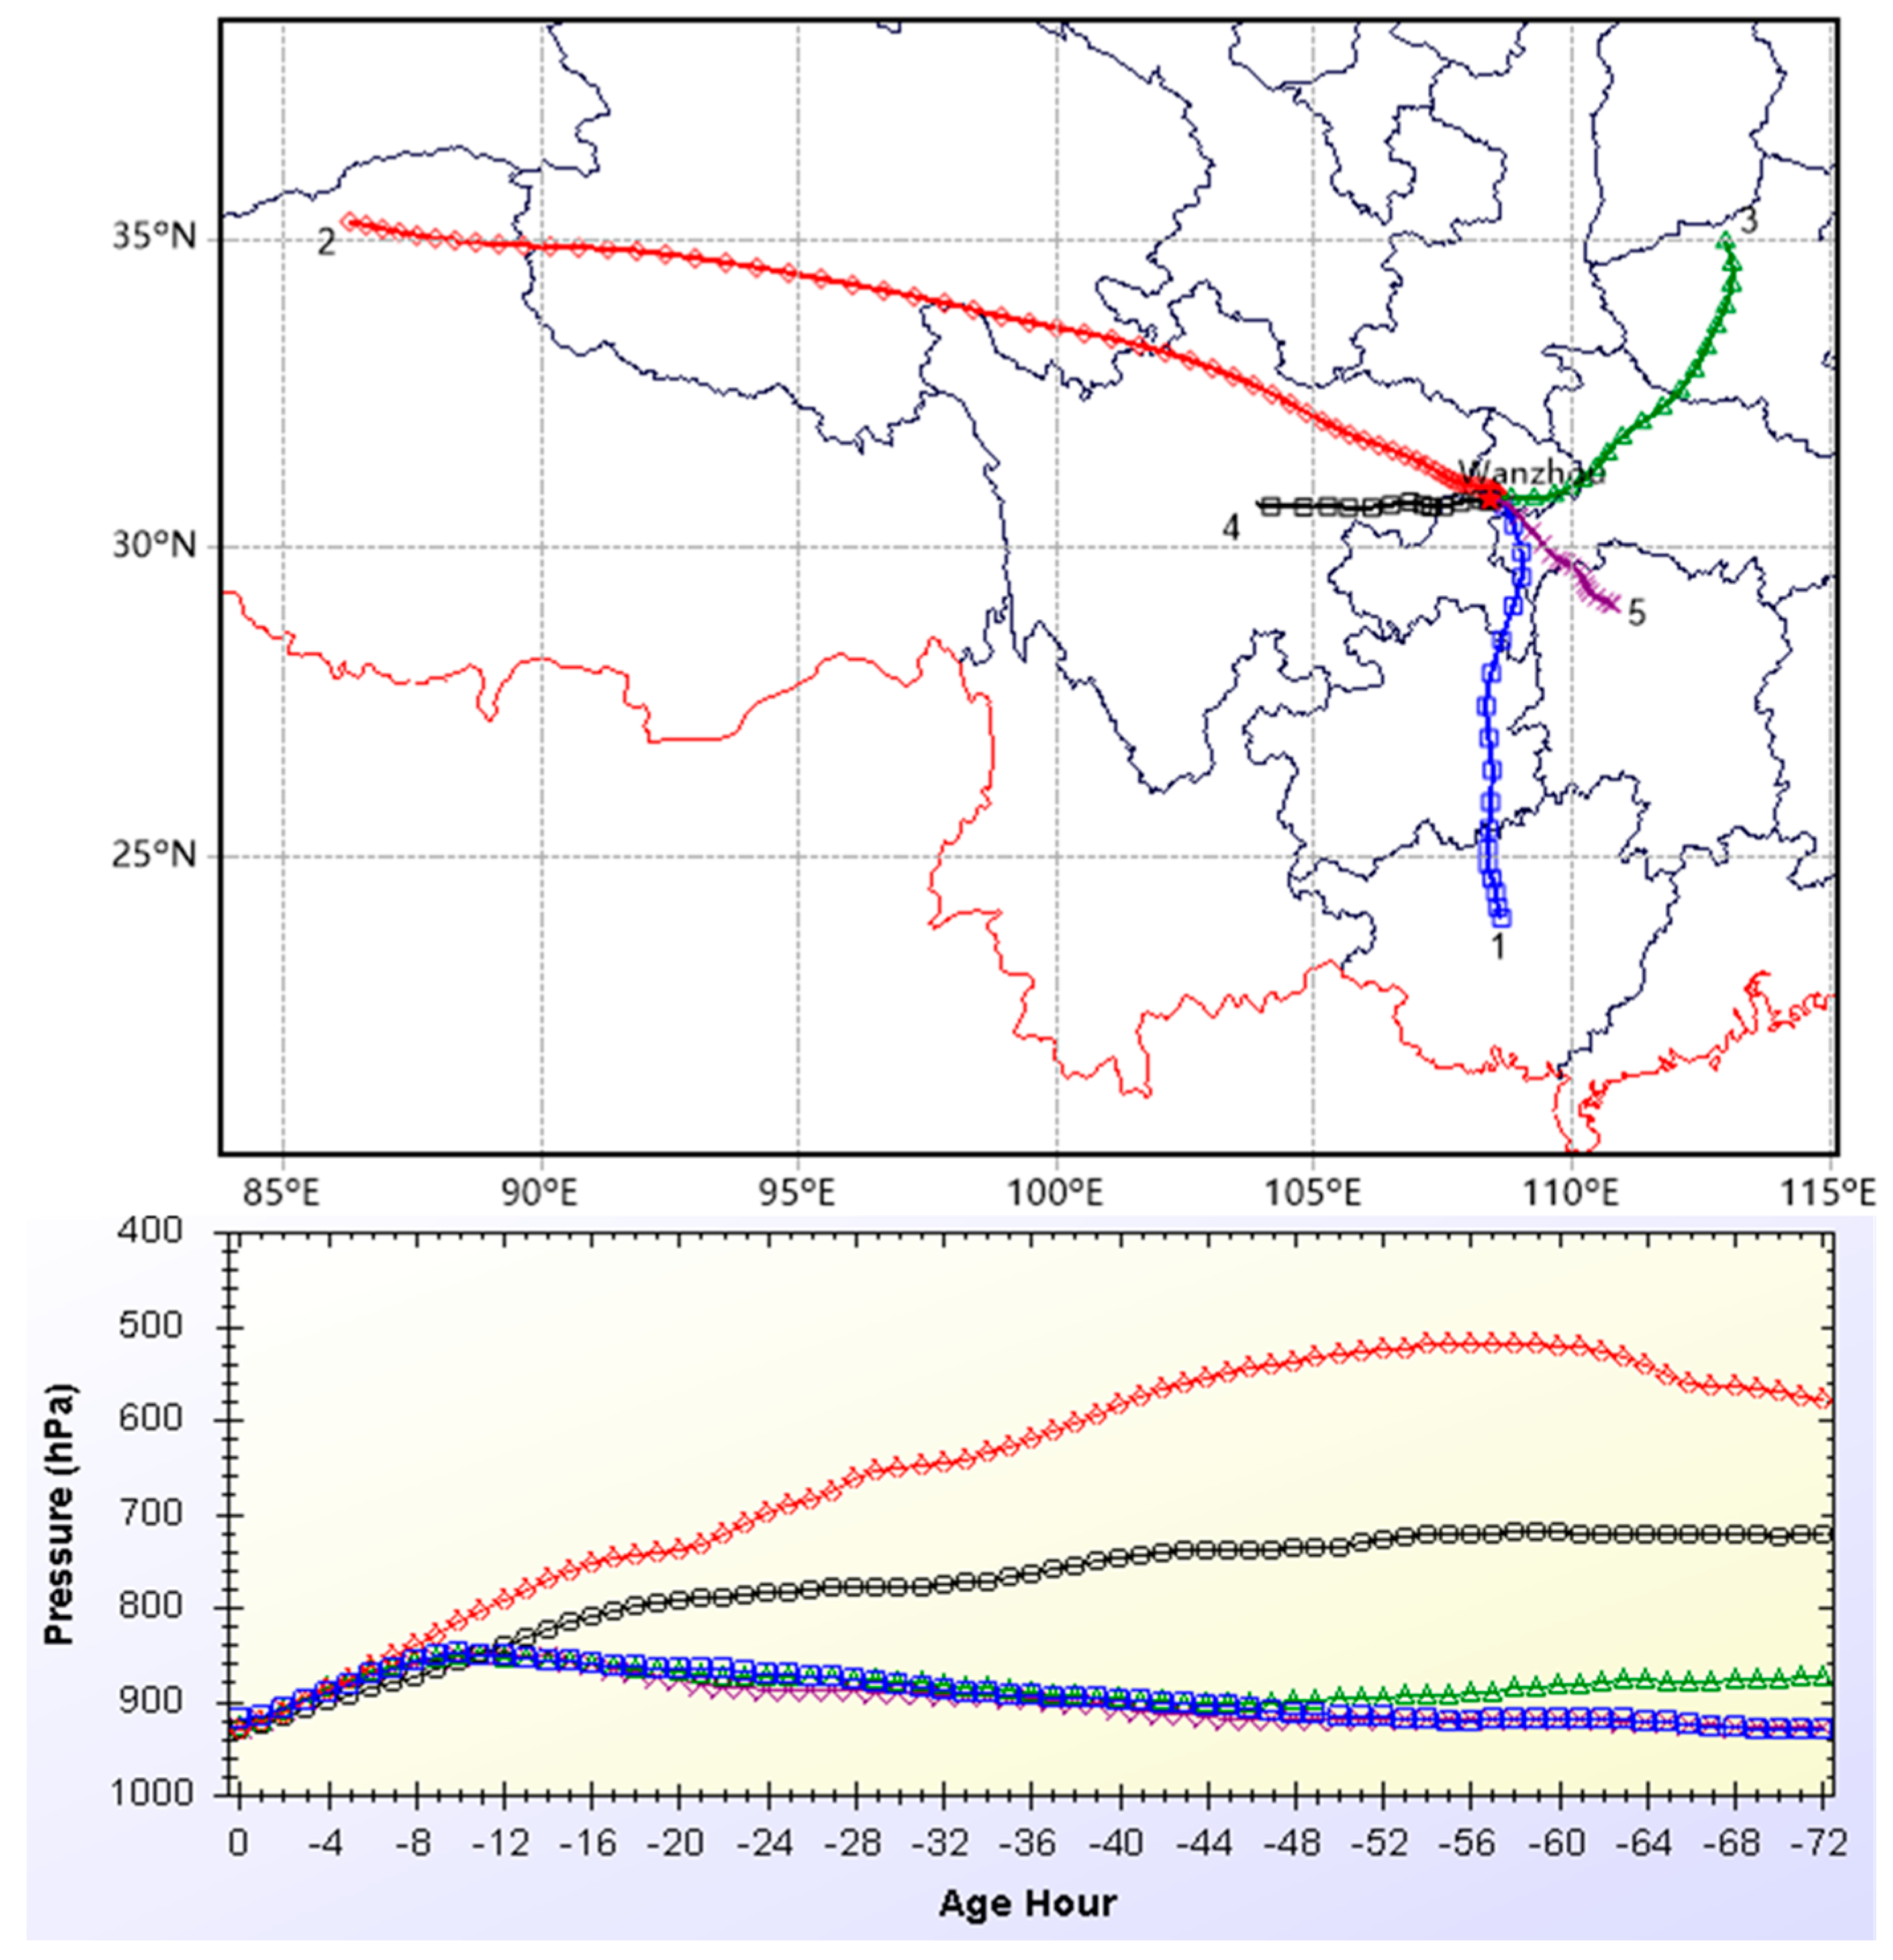
3.5. Back Trajectory Analysis

In order to investigate the effect of air mass pathway on the characteristics of carbonaceous aerosol, 3-day back trajectories arriving at Wanzhou at a height of 100 m above the ground level were calculated using a Geographical Information System based software [62] and gridded meteorological data from the US National Oceanic and Atmospheric Administration (NOAA). The trajectory computations were carried out once a day, with a start time of 00 UTC. The run time of every trajectory was 72 h. The three-dimensional vertical velocity field was used to calculate the vertical motion of the air parcel. Five clusters were obtained by the clustering algorithm for the sampling times, and the cluster-mean trajectories are shown in Figure 7. The air masses associated with cluster 1 originated from the middle part of Guangxi Province and then crossed the eastern part of Guizhou Province. Cluster 2 originated from the northern Tibetan Plateau, and moved southeasterly over the Qaidam basin, north of Sichuan Province, with a relatively higher travelling height. Cluster 3 originated from northeastern China, and passed over the middle of Henan and the northwest of Hubei. Cluster 4 came from the middle of Sichuan Province, and passed over several urban districts of Sichuan. Cluster 5 represented the short trajectories that came from the southeast areas around Wanzhou with a relatively lower travelling height.
Statistics of PM2.5, OC, EC, and TC daily average concentrations associated with each cluster’s backward trajectories are summarized in Table 3. The cluster-averaged PM2.5, OC, and EC levels were highest in cluster 4, i.e., 86.69, 17.09, and 4.23 μg·m−3, respectively. This is mainly because air masses of cluster 4 passed over several industrial centers and urban areas, such as Chengdu, a highly populated as well as industrially dense city [48], and Suining, Guang’an, and Dazhou. These cities are rich in mineral resources, such as oil, natural gas, and coal mines, etc. Cluster 2 and cluster 5 showed similar carbonaceous aerosols concentrations, but the PM2.5 concentration was higher in cluster 2. Cluster 2 passed though sources of Asian dust and several industrial cities, therefore its pathways were likely to bring aerosols to Wanzhou. Cluster 5 mainly came from local sources and was the primary type of air masses arriving in Wanzhou. There are large-scale industrial complexes including chemical industrial plants and the power plants in the southeast areas of Wanzhou. Thus, the southeast wind brought in a large amount of pollutants from the industrial activities from this region’s sources. The cluster-averaged low concentrations appeared in cluster 1 and cluster 3. The clean air masses from the south and northeast areas would disperse air pollution in Wanzhou.

4. Conclusions

In this study, OC and EC concentrations in PM2.5 were measured hourly with a semi-continuous thermal optical analyzer at an urban site in Wanzhou (in southwest China) during four seasons from June 2013 to May 2014. The annual average concentrations of OC and EC were 13.16 ± 7.98 μgC·m−3 and 3.12 ± 1.51 μgC·m−3. OC and EC showed seasonal variations as expected, with the highest values in winter and the lowest concentrations in summer, which was mainly associated with seasonal changes in source emissions and mesoscale meteorology. Pronounced and similar diel variations of EC concentrations in different seasons were found, which both displayed a bimodal pattern with peaks appearing in the morning and evening rush hour. The diel variations of OC concentrations also showed a similar bimodal pattern to EC in summer, autumn, and spring, but the morning peaks were broad. In wintertime, the diel OC concentration exhibited a clear bimodal pattern with the morning peak occurred at midday. Additionally, OC had its diel maxima during the night in all of the seasons. The seasonal and diel variations of OC and EC concentration were mostly dominated by the seasonal and diel variability of meteorological conditions and source emissions. Strong relationships between OC and EC concentrations were found in winter and spring, indicating their common sources. The correction was lower in summer and autumn, implying the presence of other sources. The secondary organic carbon concentrations in PM2.5 were estimated by using an EC-tracer method and the results showed that SOC concentrations were on average about 2.19 ± 1.55, 7.66 ± 5.89, 5.79 ± 3.51, and 3.43 ± 2.26 μgC·m−3, accounting for 29.2%, 52.7%, 27.4%, and 30.5% of total organic carbon in summer, autumn, winter, and spring, respectively. This result demonstrated that the relative contribution of SOC to OC in PM2.5 was only comparable to that of POC to OC in autumn, while in the other three seasons, OC was dominated by POC. Five transportation pathways that contributed to OC, EC, and PM2.5 in Wanzhou were identified by trajectory clustering. The air masses with high PM2.5 and carbonaceous concentrations originated from or passed over several industrial centers and urban areas in western and northwestern China. By contrast, the lowest PM2.5 and carbonaceous concentrations observed were those coming from south and northeast areas, which brought in clean air masses to Wanzhou with a longer pathway. However, air trajectories from the southeast were the dominant trajectories, which indicated the influence of local sources by their short pathway.

Acknowledgments

This work was supported by the National Natural Science Foundation of China (Grant No. 41375123), the Scientific and Technological Research Program of Chongqing Municipal Education Commission (Grant No. KJ1501001, KJ1501006), and Wanzhou project (Grant No. 201503049, 2016037).

Author Contributions

Fumo Yang conceived and designed the experiments; Yuan Liu contributed valuable scientific insight, ideas, and direction; Liuyi Zhang and Chao peng worked on the sample collection and analyzed the data; Yimin Huang wrote the paper.

Conflicts of Interest

The authors declare no conflict of interest.

References

  1. Lim, H.J.; Turpin, B.J. Origins of primary and secondary organic aerosol in Atlanta: Results of time-resolved measurements during the Atlanta Supersite Experiment. Environ. Sci. Technol. 2002, 36, 4489–4496. [Google Scholar] [CrossRef] [PubMed]
  2. Cabada, J.C.; Pandis, S.N.; Subramanian, R.; Robinson, A.L.; Polidori, A.; Turpin, B. Estimating the secondary organic aerosol contribution to PM2.5 using the EC Tracer Method. Aerosol Sci. Technol. 2004, 38, 140–155. [Google Scholar] [CrossRef]
  3. Niu, Z.; Zhang, F.; Chen, J.; Yin, L.; Wang, S.; Xu, L. Carbonaceous species in PM2.5 in the coastal urban agglomeration in the Western Taiwan Strait Region, China. Atmos. Res. 2013, 122, 102–110. [Google Scholar] [CrossRef]
  4. Paraskevopoulou, D.; Liakakou, E.; Gerasopoulos, E.; Theodosi, C.; Mihalopoulos, N. Long-term characterization of organic and elemental carbon in the PM2.5 fraction: The case of Athens, Greece. Atmos. Chem. Phys. 2014, 14, 13313–13325. [Google Scholar] [CrossRef]
  5. Jacobson, M.Z. Strong radiative heating due to the mixing state of black carbon in atmospheric aerosols. Nature 2001, 409, 695–697. [Google Scholar] [CrossRef] [PubMed]
  6. Hansen, J.; Sato, M.; Ruedy, R.; Nazarenko, L.; Lacis, A.; Schmidt, G.A.; Russell, G.; Aleinov, I.; Bauer, M.; Bauer, S.; et al. Efficacy of climate forcings. J. Geophys. Res. 2005, 110, 2571–2592. [Google Scholar] [CrossRef]
  7. Pöschl, U. Atmospheric aerosols: Composition, transformation, climate and health effects. Angew. Chem. 2005, 44, 7520–7540. [Google Scholar] [CrossRef] [PubMed]
  8. Ramanathan, V.; Carmichael, G. Global and regional climate changes due to black carbon. Nat. Geosci. 2008, 1, 221–227. [Google Scholar] [CrossRef]
  9. Larson, S.M.; Cass, G.R. Characteristics of summer midday low-visibility events in the Los Angeles area. Environ. Sci. Technol. 1988, 23, 281–289. [Google Scholar] [CrossRef]
  10. Penner, J.E.; Eddleman, H.E.; Novakov, T. Towards the development of a global inventory for black carbon emissions. Atmos. Environ. Part A 1993, 27, 1277–1295. [Google Scholar] [CrossRef]
  11. Mauderly, J.L.; Chow, J.C. Health effects of organic aerosols. Inhal. Toxicol. 2008, 20, 257–288. [Google Scholar] [CrossRef] [PubMed]
  12. Huang, W.; Cao, J.; Tao, Y.; Dai, L.; Lu, S.E.; Hou, B.; Wang, Z.; Zhu, T. Seasonal variation of chemical species associated with short-term mortality effects of PM2.5 in Xi’an, a central city in China. Am. J. Epidemiol. 2012, 175, 556–566. [Google Scholar] [CrossRef] [PubMed]
  13. Cao, J.J.; Lee, S.C.; Ho, K.F.; Zhang, X.Y.; Zou, S.C.; Fung, K.; Chow, J.C.; Watson, J.G. Characteristics of carbonaceous aerosol in Pearl River Delta Region, China during 2001 winter period. Atmos. Environ. 2003, 37, 1451–1460. [Google Scholar] [CrossRef]
  14. Bae, M.; Schauer, J.J.; DeMinter, J.T.; Turner, J.R. Hourly and daily patterns of particle-phase organic and elemental carbon concentrations in the urban atmosphere. J. Air Waste Manag. Assoc. 2004, 54, 823–833. [Google Scholar] [CrossRef] [PubMed]
  15. Hand, J.L.; Schichtel, B.A.; Malm, W.C.; Frank, N.H. Spatial and temporal trends in PM2.5 organic and elemental carbon across the United States. Adv. Meteorol. 2013, 2013, 367674. [Google Scholar] [CrossRef]
  16. Vodička, P.; Schwarz, J.; Ždímal, V. Analysis of one year’s OC/EC data at a Prague suburban site with 2-h time resolution. Atmos. Environ. 2013, 77, 865–872. [Google Scholar] [CrossRef]
  17. Mancilla, Y.; Herckes, P.; Fraser, M.P.; Mendoza, A. Secondary organic aerosol contributions to PM2.5 in Monterrey, Mexico: Temporal and seasonal variation. Atmos. Res. 2015, 153, 348–359. [Google Scholar] [CrossRef]
  18. Streets, D.G.; Bond, T.C.; Carmichael, G.R.; Fernandes, S.D.; Fu, Q.; He, D.; Klimont, Z.; Nelson, S.M.; Tsai, N.Y.; Wang, M.Q.; et al. An inventory of gaseous and primary aerosol emissions in Asia in the year 2000. J. Geophys. Res. Atmos. 2003, 108. [Google Scholar] [CrossRef]
  19. Simpson, D.; Yttri, K.E.; Klimont, Z.; Kupiainen, K.; Caseiro, A.; Gelencsér, A.; Pio, C.; Puxbaum, H.; Legrand, M. Modeling carbonaceous aerosol over Europe: Analysis of the CARBOSOL and EMEP EC/OC campaigns. J. Geophys. Res. Atmos. 2007, 112. [Google Scholar] [CrossRef]
  20. Junker, C.; Liousse, C. A global emission inventory of carbonaceous aerosol from historic records of fossil fuel and biofuel consumption for the period 1860–1997. Atmos. Chem. Phys. 2008, 8, 1195–1207. [Google Scholar] [CrossRef]
  21. Chow, J.C.; Watson, J.G.; Lowenthal, D.H.; Chen, L.W.A.; Motallebi, N. PM2.5 source profiles for black and organic carbon emission inventories. Atmos. Environ. 2011, 45, 5407–5414. [Google Scholar] [CrossRef]
  22. López-Veneroni, D. The stable carbon isotope composition of PM2.5 and PM10 in Mexico City Metropolitan Area air. Atmos. Environ. 2009, 43, 4491–4502. [Google Scholar] [CrossRef]
  23. Cao, J.J.; Zhu, C.S.; Tie, X.X.; Geng, F.H.; Xu, H.M.; Ho, S.S.H.; Wang, G.H.; Han, Y.M.; Ho, K.F. Characteristics and sources of carbonaceous aerosols from Shanghai, China. Atmos. Chem. Phys. Discuss. 2012, 12, 16811–16849. [Google Scholar] [CrossRef]
  24. Han, Z.; Zhang, R.; Wang, Q.G.; Wang, W.; Cao, J.; Xu, J. Regional modeling of organic aerosols over China in summertime. J. Geophys. Res. 2008, 113. [Google Scholar] [CrossRef]
  25. Mahmud, A.; Barsanti, K.C. Improving the representation of secondary organic aerosol (SOA) in the MOZART-4 global chemical transport model. Geosci. Model Dev. Discuss. 2012, 5, 4187–4232. [Google Scholar] [CrossRef]
  26. Lin, P.; Hu, M.; Deng, Z.; Slanina, J.; Han, S.; Kondo, Y.; Takegawa, N.; Miyazaki, Y.; Zhao, Y.; Sugimoto, N. Seasonal and diurnal variations of organic carbon in PM2.5 in Beijing and the estimation of secondary organic carbon. J. Geophys. Res. 2009, 114. [Google Scholar] [CrossRef]
  27. Yang, F.; He, K.; Ye, B.; Chen, X.; Cha, L.; Cadle, S.H.; Chan, T.; Mulawa, P.A. One-year record of organic and elemental carbon in fine particles in downtown Beijing and Shanghai. Atmos. Chem. Phys. 2005, 5, 1449–1457. [Google Scholar] [CrossRef]
  28. Cao, J.J.; Lee, S.C.; Chow, J.C.; Watson, J.G.; Ho, K.F.; Zhang, R.J.; Jin, Z.D.; Shen, Z.X.; Chen, G.C.; Kang, Y.M.; et al. Spatial and seasonal distributions of carbonaceous aerosols over China. J. Geophys. Res. 2007, 112. [Google Scholar] [CrossRef]
  29. Zhang, R.J.; Cao, J.J.; Lee, S.C.; Shen, Z.X.; Ho, K.F. Carbonaceous aerosols in PM10 and pollution gases in winter in Beijing. J. Environ. Sci. 2007, 19, 564–571. [Google Scholar] [CrossRef]
  30. Li, W.F.; Bai, Z.P. Characteristics of organic and elemental carbon in atmospheric fine particles in Tianjin, China. Particuology 2009, 7, 432–437. [Google Scholar] [CrossRef]
  31. Zhao, P.S.; Dong, F.; Yang, Y.D.; He, D.; Zhao, X.J.; Zhang, W.Z.; Yao, Q.; Liu, H.Y. Characteristics of carbonaceous aerosol in the region of Beijing, Tianjin, and Hebei, China. Atmos. Environ. 2013, 71, 389–398. [Google Scholar] [CrossRef]
  32. Cao, J.J.; Lee, S.C.; Ho, K.F.; Zou, S.C.; Fung, K.; Li, Y.; Watson, J.G.; Chow, J.C. Spatial and seasonal variations of atmospheric organic carbon and elemental carbon in Pearl River Delta Region, China. Atmos. Environ. 2004, 38, 4447–4456. [Google Scholar] [CrossRef]
  33. Duan, J.C.; Tan, J.H.; Cheng, D.X.; Bi, X.H.; Deng, W.J.; Sheng, G.Y.; Fu, J.M.; Wong, M.H. Sources and characteristics of carbonaceous aerosol in two largest cities in Pearl River Delta Region, China. Atmos. Environ. 2007, 41, 2895–2903. [Google Scholar] [CrossRef]
  34. Feng, Y.; Chen, Y.; Guo, H.; Zhi, G.; Xiong, S.; Li, J.; Sheng, G.; Fu, J. Characteristics of organic and elemental carbon in PM2.5 samples in Shanghai, China. Atmos. Res. 2009, 92, 434–442. [Google Scholar] [CrossRef]
  35. Pathak, R.K.; Wang, T.; Ho, K.F.; Lee, S.C. Characteristics of summertime PM2.5 organic and elemental carbon in four major Chinese cities: Implications of high acidity for water-soluble organic carbon (WSOC). Atmos. Environ. 2011, 45, 318–325. [Google Scholar] [CrossRef]
  36. Cao, J.J.; Wu, F.; Chow, J.C.; Lee, S.C.; Li, Y.; Chen, S.W.; An, Z.S.; Fung, K.K.; Watson, J.G.; Zhu, C.S.; et al. Characterization and source apportionment of atmospheric organic and elemental carbon during fall and winter of 2003 in Xi’an, China. Atmos. Chem. Phys. 2005, 5, 3127–3137. [Google Scholar] [CrossRef]
  37. Zhang, L.; Huang, Y.; Liu, Y.; Yang, F.; Lan, G.; Fu, C.; Wang, J. Characteristics of carbonaceous species in PM2.5 in Wanzhou in the hinterland of the Three Gorges Reservior of northeast Chongqing, China. Atmosphere 2015, 6, 534–546. [Google Scholar] [CrossRef]
  38. Peng, C.; Zhai, C.Z.; Wang, H.B.; Tian, M.; Li, H.L.; Liu, Y.; Fu, C.; Zhang, L.Y.; Yang, F.M. Characterization of organic carbon and elemental carbon in PM2.5 in the urban Wanzhou area in summer and winter. Acta Sci. Circumatantiae 2015, 35, 1638–1644. (In Chinese) [Google Scholar]
  39. Turpin, B.J.; Saxena, P.; Andrews, E. Measuring and simulating particulate organics in the atmosphere: Problems and prospects. Atmos. Environ. 2000, 34, 2983–3013. [Google Scholar] [CrossRef]
  40. Birch, M.E. Analysis of carbonaceous aerosols: Interlaboratory comparison. Analyst 1998, 123, 851–857. [Google Scholar] [CrossRef] [PubMed]
  41. Polidori, A.; Turpin, B.J.; Lim, H.J.; Cabada, J.C.; Subramanian, R.; Pandis, S.N.; Robinson, A.L. Local and regional secondary organic aerosol: Insights from a year of semi-continuous carbon measurements at Pittsburgh. Aerosol Sci. Technol. 2006, 40, 861–872. [Google Scholar] [CrossRef]
  42. Duan, F.K.; He, K.B.; Ma, Y.L.; Jia, Y.T.; Yang, F.M.; Lei, Y.; Tanaka, S.; Okuta, T. Characteristics of carbonaceous aerosols in Beijing, China. Chemosphere 2005, 60, 355–364. [Google Scholar] [CrossRef] [PubMed]
  43. Wu, C.; Ng, W.M.; Huang, J.; Wu, D.; Yu, J.Z. Determination of elemental and organic carbon in PM2.5 in the Pearl River Delta Region: Inter-instrument (Sunset vs. DRI Model 2001 Thermal/Optical Carbon Analyzer) and inter-protocol comparisons (IMPROVE vs. ACE-Asia Protocol). Aerosol Sci. Technol. 2012, 46, 610–621. [Google Scholar] [CrossRef]
  44. Yttri, K.E.; Aas, W.; Bjerke, A.; Cape, J.N.; Cavalli, F.; Ceburnis, D.; Dye, C.; Emblico, L.; Facchini, M.C.; Forster, C. Elemental and organic carbon in PM10: A one year measurement campaign within the European Monitoring and Evaluation Programme EMEP. Atmos. Chem. Phys. 2007, 7, 5711–5725. [Google Scholar] [CrossRef]
  45. Turpin, B.J.; Lim, H.J. Species contributions to PM2.5 mass concentrations: Revisiting common assumptions for estimating organic mass. Aerosol Sci. Technol. 2001, 35, 602–610. [Google Scholar] [CrossRef]
  46. Yang, F.; Tan, J.; Zhao, Q.; Du, Z.; He, K.; Ma, Y.; Duan, F.; Chen, G.; Zhao, Q. Characteristics of PM2.5 speciation in representative megacities and across China. Atmos. Chem. Phys. 2011, 11, 5207–5219. [Google Scholar] [CrossRef]
  47. Chow, J.C.; Watson, J.G.; Chen, L.W.A.; Ho, S.S.H.; Koracin, D.; Zielinska, B.; Tang, D.; Perera, F.; Cao, J.; Lee, S.C. Exposure to PM2.5 and PAHs from the Tong Liang, China Epidemiological Study. J. Environ. Sci. Health Part A 2006, 41, 517–542. [Google Scholar] [CrossRef]
  48. Tao, J.; Cheng, T.; Zhang, R.; Cao, J.; Zhu, L.; Wang, Q.; Luo, L.; Zhang, L. Chemical composition of PM2.5 at an urban site of Chengdu in southwestern China. Adv. Atmos. Sci. 2013, 30, 1070–1084. [Google Scholar] [CrossRef]
  49. Cheng, H.R.; Wang, Z.W.; Feng, J.L.; Chen, H.L.; Zhang, F.; Liu, J. Carbonaceous species composition and source apportionment of PM2.5 in urban atmosphere of Wuhan. Ecol. Environ. Sci. 2012, 21, 1574–1579. (In Chinese) [Google Scholar]
  50. Zhang, F.W.; Zhao, J.P.; Chen, J.S.; Xu, Y.; Xu, L. Pollution characteristics of organic and elemental carbon in PM2.5 in Xiamen, China. J. Environ. Sci. 2011, 23, 1342–1349. [Google Scholar] [CrossRef]
  51. Zhao, L.; Lu, Q.M.; Li, L.; Luo, Y.Z.; Yang, Q.L.; Chen, G.C. Chemical characteristics of atmospheric precipitation at Wanzhou district of Chongqing. Environ. Ecol. Three Gorges 2013, 35, 9–15. (In Chinese) [Google Scholar]
  52. Turpin, B.J.; Huntzicker, J.J. Secondary formation of organic aerosol in the Los Angeles basin: A descriptive analysis of organic and elemental carbon concentrations. Atmos. Environ. 1991, 25, 207–215. [Google Scholar] [CrossRef]
  53. Chow, J.C.; Watson, J.G.; Lu, Z.; Lowenthal, D.H.; Frazier, C.A.; Solomon, P.A.; Thuillier, R.H.; Magliano, K. Descriptive analysis of PM2.5, and PM10, at regionally representative locations during SJVAQS/AUSPEX. Atmos. Environ. 1996, 30, 2079–2112. [Google Scholar] [CrossRef]
  54. Schauer, J.J.; Kleeman, M.J.; Cass, G.R.; Simoneit, B.R. Measurement of emissions from air pollution sources. 5. C1–C32 organic compounds from gasoline-powered motor vehicles. Environ. Sci. Technol. 2002, 36, 1169–1180. [Google Scholar] [CrossRef] [PubMed]
  55. Chen, Y.; Zhi, G.; Feng, Y.; Fu, J.; Feng, J.; Sheng, G.; Simoneit, B.R.T. Measurements of emission factors for primary carbonaceous particles from residential raw-coal combustion in China. Geophys. Res. Lett. 2006, 33, 382–385. [Google Scholar] [CrossRef]
  56. Schauer, J.J.; Kleeman, M.J.; Cass, G.R.; Simoneit, B.R. Measurement of emissions from air pollution sources. 3. C1–C29 organic compounds from fireplace combustion of wood. Environ. Sci. Technol. 2001, 35, 1716–1728. [Google Scholar] [CrossRef] [PubMed]
  57. He, L.; Hu, M.; Huang, X.; Yu, B.; Zhang, Y.; Liu, D. Measurement of emissions of fine particulate organic matter from Chinese cooking. Atmos. Environ. 2004, 38, 6557–6564. [Google Scholar] [CrossRef]
  58. Watson, J.G.; Chow, J.C.; Houck, J.E. PM2.5 chemical source profiles for vehicle exhaust, vegetative burning, geological material, and coal burning in Northwestern Colorado during 1995. Chemosphere 2001, 43, 1141–1151. [Google Scholar] [CrossRef]
  59. Strader, R.; Lurmann, F.; Pandis, S.N. Evaluation of secondary organic aerosol formation in winter. Atmos. Environ. 1999, 33, 4849–4863. [Google Scholar] [CrossRef]
  60. Appel, B.R.; Colodny, P.; Wesolowski, J.J. Analysis of carbonaceous materials in southern California atmospheric aerosols. Environ. Sci. Technol. 1976, 13, 98–104. [Google Scholar] [CrossRef]
  61. Castro, L.M.; Pio, C.A.; Harrison, R.M.; Smith, D.J.T. Carbonaceous aerosol in urban and rural European atmospheres: Estimation of secondary organic carbon concentrations. Atmos. Environ. 1999, 33, 2771–2781. [Google Scholar] [CrossRef]
  62. Wang, Y.Q.; Zhang, X.Y.; Draxler, R.R. TrajStat: GIS-based software that uses various trajectory statistical analysis methods to identify potential sources from long-term air pollution measurement data. Environ. Model. Softw. 2009, 24, 938–939. [Google Scholar] [CrossRef]
Figure 1. Location of the sampling site in Wanzhou.
Atmosphere 09 00037 g001
Figure 2. Time series of OC (a) and EC (b) Concentrations, and OC/EC ratios (c) During the sampling time.
Atmosphere 09 00037 g002
Figure 3. Monthly variations of OC (a) and EC (b) Concentrations. The box plots indicate the minimum, 25th percentiles, median, 75th percentiles, maximum, and average (square) of OC and EC concentrations.
Atmosphere 09 00037 g003
Figure 4. Diel variations of OC (a) and EC (b) Concentrations, and OC/EC ratios (c) In different seasons.
Atmosphere 09 00037 g004
Figure 5. Relationship between OC and EC based on the daily average concentrations in different seasons.
Atmosphere 09 00037 g005
Figure 6. Seasonal SOC concentrations and SOC/OC ratios in Wanzhou.
Atmosphere 09 00037 g006
Figure 7. Back-trajectories of clusters of Wanzhou.
Atmosphere 09 00037 g007
Table 1. Comparison of organic carbon (OC) and elemental carbon (EC) concentrations (μgC·m−3), and percentages of TCA in PM2.5 with other sites in China.
LocationsSampling PeriodOCECTC/PM2.5TCA/PM2.5OC & EC MethodReference
Wanzhou18 June 2013–31 May 201413.163.1225.6%38%TOTThis study
Downtown ChongqingMarch 2005–February 200630.136.3928.3%42.3%TOR[46]
Tongliang, Chongqing2 March 2002–26 February 200336.910.741.1%51.3%TOR[47]
Chengdu19 April 2009–31 January 201022.39.019%32%TOR[48]
TianjinJanuary, April, July 200722.75.123.9%35%TOR[30]
BeijingApril 2009–February 201018.26.319.8%28.7%TOR[31]
Fuze District, QuanzhouNovember 2010–August 201113.52.418.9%28.5%TOT[3]
Guangzhou16 August–17 September 2004;17.55.721.6%32%TOT[33]
1 Februry–8 March 200523.94.421.8%32.9%
ShanghaiOctober 2005; January, April, July 200614.72.819.4%28.9%TOT[34]
WuhanJuly 2011–February 201219.42.917.6%26.7%TOT[49]
Jimei, XiamenApril 2009–January 201015.82.728.9%42.8%TOT[50]
Table 2. Seasonal averages (±standard deviation) of OC and EC concentrations, OC/EC ratios, and meteorological data in Wanzhou.
SummerAutumnWinterSpring
OC/(μgC·m−3)7.49 ± 2.3714.81 ± 8.3921.11 ± 9.2211.25 ± 4.65
EC/(μgC·m−3)2.12 ± 0.513.53 ± 1.514.32 ± 1.862.76 ± 1.12
OC/EC3.55 ± 0.644.09 ± 1.045.03 ± 0.914.15 ± 0.74
Temperature/(°C)29.7 ± 2.518.9 ± 4.68.7 ± 2.217.7 ± 3.7
Relative Humidity/(%)69.2 ± 12.980.6 ± 12.178.0 ± 11.580.2 ± 10.7
Wind Speed/(m·s−1)0.95 ± 0.330.79 ± 0.170.78 ± 0.240.84 ± 0.25
Table 3. Trajectory number and PM2.5, OC, EC, and TC mean concentrations of each cluster.
ClusterNumberPercent of Total TrajectoriesMean Concentration (μg·m−3)
PM2.5OCECTC
13712.2%48.467.182.139.31
2278.9%76.7014.743.5318.25
36320.8%42.5810.022.3412.36
45919.5%86.6917.094.2321.31
511738.6%65.6514.393.1917.57

