Article

Transport Paths and Identification for Potential Sources of Haze Pollution in the Yangtze River Delta Urban Agglomeration from 2014 to 2017

1
School of Automation, Nanjing University of Information Science and Technology, No.219, Ningliu Road, Nanjing 210044, China
2
School of Atmospheric Science, Nanjing University of Information Science and Technology, No.219, Ningliu Road, Nanjing 210044, China
3
School of Atmospheric Physics, Nanjing University of Information Science and Technology, No.219, Ningliu Road, Nanjing 210044, China
*
Author to whom correspondence should be addressed.
Atmosphere 2018, 9(12), 502; https://doi.org/10.3390/atmos9120502
Submission received: 28 October 2018 / Revised: 7 December 2018 / Accepted: 12 December 2018 / Published: 17 December 2018

Abstract

:
Besides local emissions, long-range transportation of polluted air masses also has a huge impact on haze pollution. In this study, the Hybrid Single-Particle Lagrangian Integrated Trajectory (HYSPLIT) model was used to determine the transport paths and potential sources of haze pollution in the Yangtze River Delta Urban Agglomeration. Haze days were determined by setting the threshold of meteorological elements. Shanghai, Hangzhou, Nanjing and Hefei were selected as four representative cities to calculate the −72 h backward transport trajectory of haze air mass; thus, the main transport path was obtained after clustering. A potential source contribution function and concentration weighted field were used to identify potential pollution sources of the study. The results showed that the number of haze days in the northern Yangtze River Delta Urban Agglomeration is much higher than that in the south. Haze days and Fine particulate matter (PM2.5) concentration showed a downward trend. The transport paths could be summarized as long-range transports from the northwest and coastal direction during the dry season and short-distance transports from all directions. −72 h air flow trajectories come from the higher altitudes in dry season than these in wet season. The main sources of potential pollution are Hebei, Shandong, Anhui and northern Jiangsu.

1. Introduction

The Yangtze River Delta Urban Agglomeration (YRDUA) is located in the east of China, and encompasses a total of 26 cities, including Nanjing, Hangzhou, Hefei and Shanghai. The YRDUA is also the most densely populated and economically developed region in China [1,2]. With the rapid development of urbanization and industrialization in recent years, haze pollution has become an important factor affecting regional economic development and urban environment [3,4]. The YRDUA, with Shanghai as its core, has become one of the most air polluted areas in China.
Regional atmospheric pollution is mainly affected by two factors: local anthropogenic emission of atmospheric aerosols and polluted air mass transport from other contaminated areas. Many scholars have discussed this problem of the ratio of contributions of local aerosol sources and long-range transport. He found that the haze episode in the Yangtze River Delta in the winter of 2015 was both affected by strong wind importation and local accumulation in steady weather [5]. Feng et al. simulated the severe haze episode in the Yangtze River Delta from 29 November to 11 December 2013 and found that the contribution of particulate matter from the core region of Yangtze River Delta was almost equal to that from foreign transport [6]. An et al. simulated the source tracing of fine particulate matter in the Yangtze River Delta. The results showed that the long-distance transport had a great influence on PM2.5 concentration in the northern Yangtze River Delta under the influence of the northwest dominant wind in winter. While the fine particles transport between cities in the Yangtze River Delta was dominated by short-distance transport under the unfavorable meteorological conditions [7]. In a more detailed analysis, the concentration of PM2.5 in Hangzhou was affected both by local emission sources and regional transportation pollution. Sulfates (21.5%), nitrates (19.4%), vehicle exhaust dust (18.2%), fugitive dust (14.1%) and coal combustion dust (10.7%) were the five main local emission sources. Moreover, the impact of regional transportation pollution had a seasonal variation. The northern Zhejiang province and southeast Anhui province were the main potential source areas in spring, summer and autumn, contributing 20–40 μg/m3 to the average daily PM2.5 concentration. In winter, the southern Shandong province was the main potential source areas in addition to the surrounding cities of Hangzhou, which contributed about 60 μg/m3 to the average daily PM2.5 concentration [8]. The ratio of contributions of local emission sources and long-range transport varied in different haze episodes and different cities [9]. This manuscript emphasizes the study of long-distance transport of atmospheric pollution and analyzed the pollution level of potential sources for understanding the formation, diffusion and degradation of haze pollution in the region.
At present, there are three main methods to study the transport of atmospheric pollution: ground observation, satellite remote sensing and numerical simulation. Han et al. analyzed the characteristics and mechanism of formation of the haze-fog episode based on ground observations. They found that the increase in relative humidity favored the formation of sulfate and nitrate and the strong descending air mass limited pollutant diffusion in the vertical direction [10]. Based on ground meteorological observations, Guo et al. studied the microphysical properties of haze events, such as aerosols, cloud condensation nuclei and fog droplet spectrum, during the formation, evolution and transformation stages, to understand the cause of the haze explosion at a small scale [11]. Koo et al. collected data from Light Detection and Ranging (LIDAR), meteorology and modeling to investigate the chemical characteristics of secondary inorganic and carbonaceous as well as their formation mechanisms during the haze event [12]. With the improvement of temporal-spatial resolution of satellite remote sensing, researchers have used satellites to understand the effects of meteorological factors on haze at a large scale. Jiang et al. used Geostationary Ocean Color Imager\Aerosol Optical Thickness and National Polar-orbiting Partnership\Aerosol Optical Thickness (GOCI\AOT and NPP\AOT) to build a muti-satellite observation model and combined atmospheric parameters to analyze haze events in eastern China [13,14]. Research showed that weak wind field (velocity < 5m/s), and the inversion layer level of the air are important meteorological reasons causing the occurrence and retention of the haze, while high northwest wind is the main mechanism, driving the movement and dispersion of the haze. Due to the limitation of the transit period of polar orbiting satellites, the trajectories of polluted air masses could not be continuously described. Numerical simulation based on ground observation can solve this problem. Wu et al. tested the effectiveness of PM2.5 concentration using a two-way coupled Weather Research and Forecasting-Community Multiscale Air Quality (WRF-CMAQ) model [15]. Chen et al. studied the transport characteristics for the dust events in Chengdu, and found the dust air to Chengdu was mostly from the northeastward direction after passing over the Qinling Mountain. Moreover, the air experienced obvious elevation from its source region driven by the cold front synoptic pattern [16]. Liang et al. examined the transport pathways and source areas of PM10 in Beijing based on a model-assisted analysis, and the results revealed that the major potential source areas were Hebei, Shandong, Tianjin, northwest of Inner Mongolia, and Outer Mongolia [17]. A comprehensive cluster analysis was carried out on the polluted air masses that affected Shanghai in December from 2013 to 2015 based on the Hybrid Single-Particle Lagrangian Integrated Trajectory (HYSPLIT) model by Zhou et al. [18]. Moreover, the contribution of potential pollution sources to PM2.5 concentration of Shanghai during heavy haze day was studied. Zhou et al. used cluster analysis to categorize the daily 72 h back trajectories of Hefei near the surface and at the mid-high level of the boundary layer, and showed that the effect of airflow subsidence on PM2.5 concentration aggravated by long distance transportation [19]. Li et al. used the HYSPLIT model to study the transport paths and the vertical exchange characteristics of haze episodes over the Guangdong Province. Three main haze transportation paths were summarized and the barrier function of high mountains to haze transportation was also pointed out [20]. Shi et al. employed back-trajectory clustering analysis together with daily quality data, routine and reanalysis meteorological data, and some climate indices to investigate the transport paths, large-scale vertical motion and related climate background conducive to PM2.5 pollution in the western Yangtze River Delta [21].
The Hybrid Single-Particle Lagrangian Integrated Trajectory model (HYSPLIT) is a modeling system with wide computational capabilities ranging from simple trajectories to complex dispersion and deposition simulations and is widely used to study the transport of pollutants, water vapor and dust [20]. HYSPLIT, combined with a statistical method to analyze trajectories, can not only analyze the trajectory of polluted air mass arriving at a specific area, but also calculate the potential source area and its pollution level. Positive Matrix Factorization (PMF) linked with a Potential Source Contribution Function (PSCF) were used to explore the PM2.5 speciation, sources and source regions in North China [22,23]. Mukherjee et al. used conditional bivariate probability function (CBPF), land use regression (LUR), trajectory cluster analysis and concentration weighted trajectory (CWT) to investigate local and long-distance sources of PM2.5 and their relationship with other air pollutants and meteorology [24,25]. Based on the clustering of backward trajectories, the haze potential source distribution in the Guangdong area was studied by residence time analysis (RTA) method [20,26].
In this manuscript, the pollutant transport path and potential sources during haze days of Hangzhou, Hefei, Nanjing and Shanghai were analyzed to characterize haze pollution in the Yangtze River Delta. First, haze days were selected based on visibility and relative humidity. Second, the backward trajectories of haze days in four cities were calculated and cluster analyzed during the dry season and wet season, respectively. Lastly, based on the PM2.5 concentration of the affected city and the HYSPLIT model, the potential sources of haze pollution were analyzed.

2. Study Area and Data
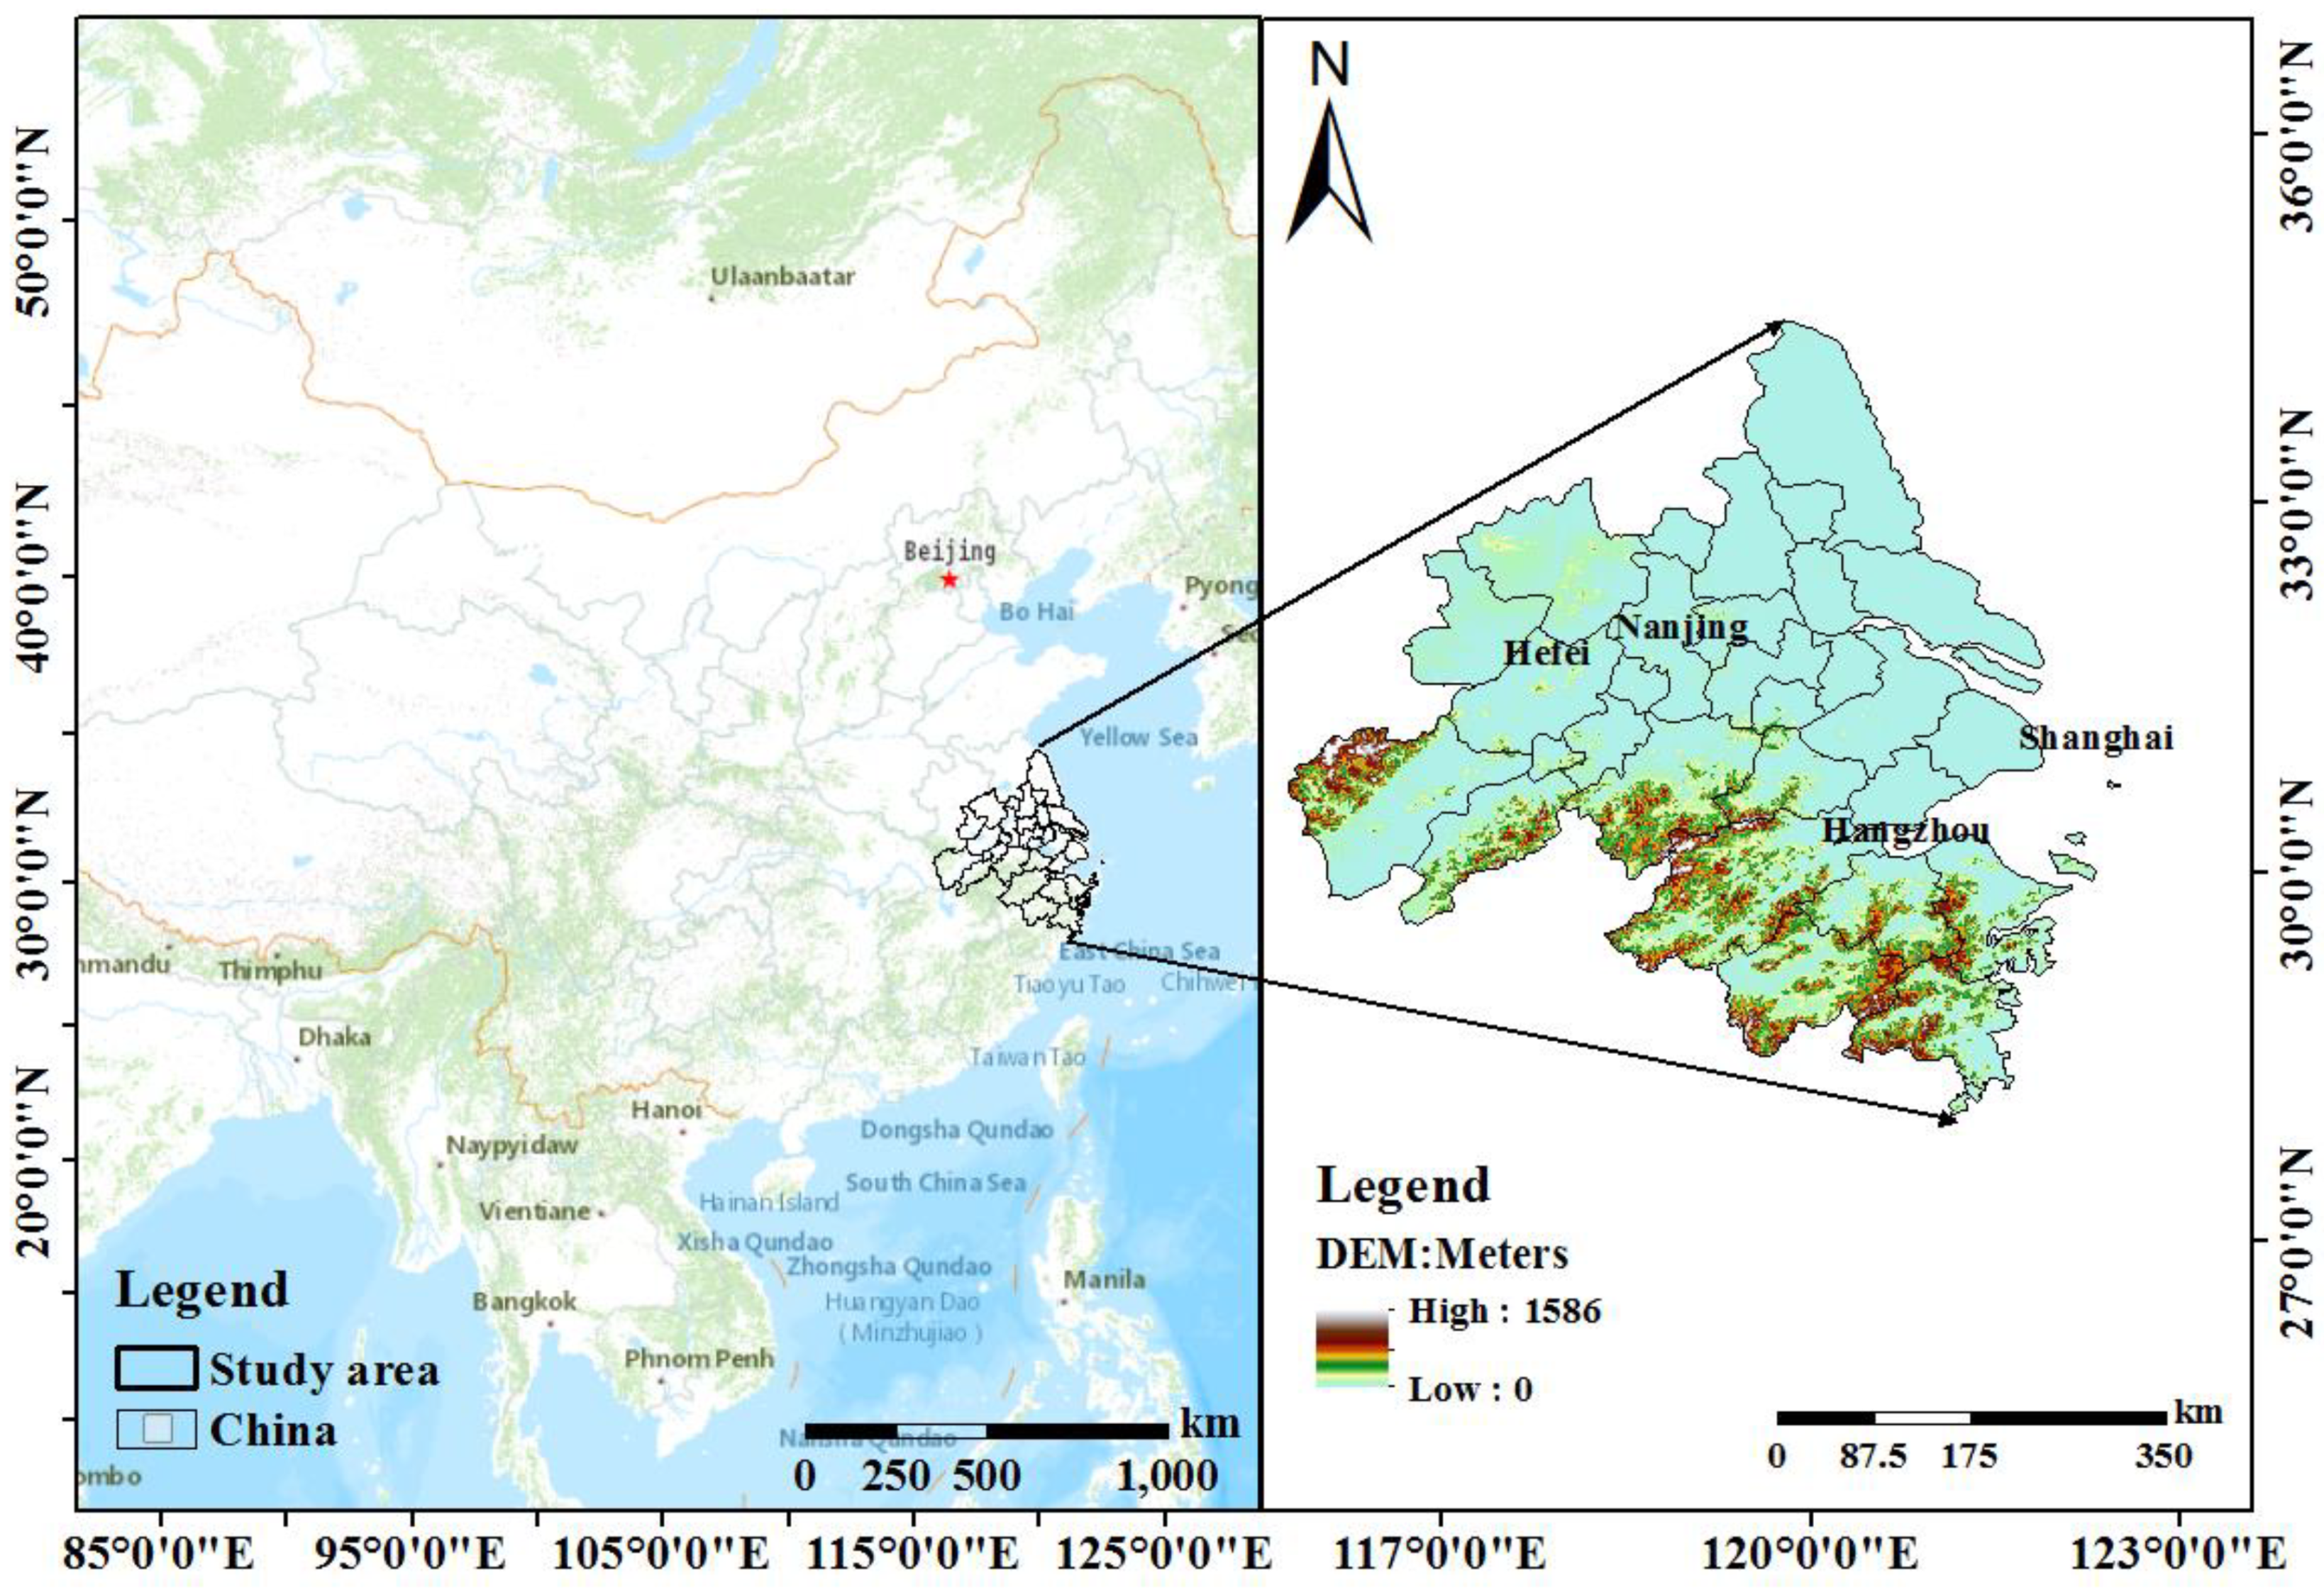
2.1. Study Area

The Yangtze River Delta Urban Agglomeration lies between 115°46’ E–123°25’ E and 32°34’ N–29°20’ N, adjacent to the Yellow Sea and the East China Sea. The geographical location of the study area is shown in Figure 1. The YRDUA encompasses the entire city of Shanghai, the southern parts of Jiangsu Province, the northern parts of Zhejiang Province and the Eastern parts of Anhui Province, with an area of 211,700 km2, accounting for 2.2% of China’s territory. The YRDUA belongs to the humid area in the eastern part of China, it is mainly affected by the monsoon climate and the terrain is high in the south and low in the north.
The Yangtze River Delta Urban Agglomeration is the most urbanized area with the most developed economy and the highest concentration of cities in China. It is regard as an important engine of China’s economic development, since although it only accounts for 2.2% of China’s territory, it is responsible of 1/4 of China’s total economic output and industrial added value. The YRDUA is facing serious air pollution as well as rapid economic development.
According to the bulletin of ecological environment in China, the average proportion of good days in 26 cities in the YRDUA area is 74.8%, and the average proportion of exceeding standard is 25.2%. The number of days with PM2.5 as the primary pollutant accounted for 44.5% of the total pollution days. In this study, Shanghai, Hangzhou, Nanjing and Hefei were selected as the representatives of the YRDUA to analyze the haze pollution situation in the area.

2.2. Data Source

2.2.1. Meteorological Data of the YRDUA

Meteorological observation data of the Yangtze River Delta Urban Agglomeration were used to determine haze days. Relative humidity and visibility data from 15 weather stations in the YRDUA during 2014–2017 were downloaded from the website (https://rp5.ru/). Historical weather data for specified time periods in XLS format or CSV format can be downloaded on the “historical weather of the city” interface. Historical weather data of meteorological stations included 28 parameters such as temperature, air pressure, humidity, wind speed, wind direction and horizontal visibility.

2.2.2. Reanalysis Data

The National Centers for Environmental Prediction (NCEP) Global Data Assimilation System (GDAS) final (FNL) global reanalysis data during 2014–2017 were used as the input data in HYSPLIT4.9 to calculate the backward trajectory. A meteorological reanalysis data file contains 7 days of data, the time resolution is 1 h and the spatial resolution is 1° × 1°. Each time of data contains times, grid settings, variables and layer information. In one time, the data of the ground variables are in front and the data of the stratified variables are in the back. Reanalysis data can be downloaded from “FTP: arlftp.arlhq.noaa.gov/archives”.

3. Method

3.1. Definition of a Haze Day and Calculation of Backward Trajectory

A haze day was defined as the phenomena where the average daily relative humidity was <90% and the average daily visibility was <10 km [20]. The temporal resolution of meteorological data was 1 h. Thus, 24 data points should be acquired every day. When there are 16 valid data points within the 24 data points, the average horizontal visibility and relative humidity of that day was calculated.
NCEP GDAS FNL global reanalysis data were input into a backward trajectory model to calculate the backward propagation path of the air mass on haze days. The grid resolution of the model was 1° × 1°, with an 1-h time resolution and 23 vertical pressure levels. The vertical coordinate of this model was altitude coordinate. The particles were initialized hourly at 100 m altitude and tracked backward for 72-h from Shanghai, Hangzhou, Nanjing and Anhui during the haze days of 2014–2017. The altitude of atmospheric boundary layer was an important parameter to characterize the characteristics of atmospheric boundary layer. The mixing, diffusion and dilution of pollutants mainly occurred in the mixing layer, and the altitude of atmospheric boundary layer determined the altitude of pollution diffusion over arrival. The altitude of atmospheric boundary layer varied with topography, season, weather and day and night. In the high-pressure terrestrial area, the boundary layer was composed of three parts: mixed layer, residual layer and stable boundary layer. According to Stull and Yang’s research [27,28], the altitude of 100 m can approximately represent the altitude of surface layer. The wind field at 100 m altitude can not only reduce the influence of friction on airflow trajectory from ground, but also accurately reflect the characteristics of air mass transport near the ground. Thus, the initial altitude of trajectory calculation was set at 100 m.
The backward trajectory described the 1-h time resolution air mass transport path in haze pollution period. The general path can be obtained by clustering a large number of trajectories. The fundamental of clustering is to quantitatively determine the relationship between samples according to their own attributes and similarity or difference indicators. In this manuscript, trajectory clustering was carried out according to the spatial similarity between trajectories, and the main source directions of PM2.5 in Yangtze River Delta was analyzed according to the clustering results. Starting from each track as the one category, the N tracks represent the N categories. By using Ward’s method [18], the sub-classes with minimal increase of the sum of Euclidean distance squares were selected and grouped into one category. After N-1 merging, all samples can be grouped into one category. The distance between trajectories was obtained according to the Euclidean distance formula (1):
d 1 , 2 = i = 1 n ( ( X 1 ( i ) X 2 ( i ) ) 2 + ( Y 1 ( i ) Y 2 ( i ) ) 2 )
In this formula, the trajectories 1 and 2 were composed of the same number of N nodes. X 1 ( i ) and Y 1 ( i ) represent longitude and latitude on node i of track 1. X 2 ( i ) and Y 2 ( i ) represent longitude and latitude on node i of track 2. The distance between two trajectories is the sum of the squares of each corresponding node distance.

3.2. Potential Source Contribution Function and Concentration Weighted Field

The application of trajectory analysis method promoted the study of pollutant transport path. As mentioned in Section 1, there were many trajectories statistical methods widely used, such as residence time analysis (RTA), potential source contribution function analysis (PSCF), concentration weighted field (CWT) and residence time weighted concentration (RTWC). Hsu et al. compared three methods, PSCF, CWT and RTWC, and found that no single method provided complete information and each method has advantages and disadvantages [25]. PSCF reflects the proportion of pollution trajectory in a grid; when the PSCF value is the same, it is impossible to distinguish the influence degree of the grid with the same value on the affected point. CWT is used to calculate the pollution weight concentration of the air flow trajectory, which is an effective supplement to reflect the pollution level of the potential source area. Therefore, PSCF and CWT [18] were both selected to analyze the potential sources of haze pollution in the YUDRA.
PSCF is a conditional probability function, which uses backward trajectory to calculate the space distribution of potential sources. The study area was divided into i × j grids, the sum of all tracks in the period was N ; if N i j nodes fall in the grid of i j , the probability of event A i j can be given in formula (2):
P [ A i j ] = n i j / N
where P [ A i j ] indicates the relative passage time of randomly selected air masses on the mesh of i j . If there are m i j nodes corresponding trajectory arrives at the receiving station at a concentration of particles higher than a certain set value in the n i j nodes, the probability of the event B i j is shown in formula (3):
P [ B i j ] = m i j / N
where P [ B i j ] in formula (3) reflects the relative passage time of these polluted air masses on a grid. Potential source contribution function (PSCF) is defined as a conditional probability, as shown in formula (4):
P S C F = P [ B i j | A i j ] = P [ B i j ] P [ A i j ] = m i j n i j
The grid with a large PSCF value was interpreted as potential source area.
PSCF is a conditional probability, when the residence time of airflow in each grid is short, PSCF value will fluctuate greatly and the error will be large. Moreover, results will be more uncertain if n i j is too small. When n i j was less than three times of the average number of trajectory endpoints per grid in the study area, W i j was introduced to reduce the uncertainty of results. The definition of weight is as follows in formulas (5) and (6):
W P S C F = W i j × P S C F
W i j = { 1.00 0.70 0.42 0.05 80 < n i j 20 < n i j 80 10 < n i j 20 n i j 10
Concentration weighted field (CWT) is a method to calculate the weighted concentration of air trajectories in a potential source area and reflect the pollution level of different trajectories. PSCF reflects the proportion of pollution trajectory in a grid; when the PSCF value is the same, it is impossible to distinguish the influence degree of the grid with the same value on the affected point. Therefore, the concentration weighted field method is used to calculate the pollution weight concentration of the air flow trajectory to reflect the pollution level of the potential source area. The formula (7) is as follows:
C i j = 1 k = 1 1 τ i j k k = 1 M C k τ i j k
In the formula (7), C i j is the average weight concentration on the grid of i j ; k is the trajectory’s number; C k is the PM2.5 concentration of affected city when corresponding trajectory k passes through the grid of i j ; τ i j k is the residence time of trajectory k in grid of i j . Thus, CWT is equivalent to screening the trajectories gained from PSCF based on the concentration standard; weight factors were similarly introduced to reduce uncertainties.

4. Results and Discussion

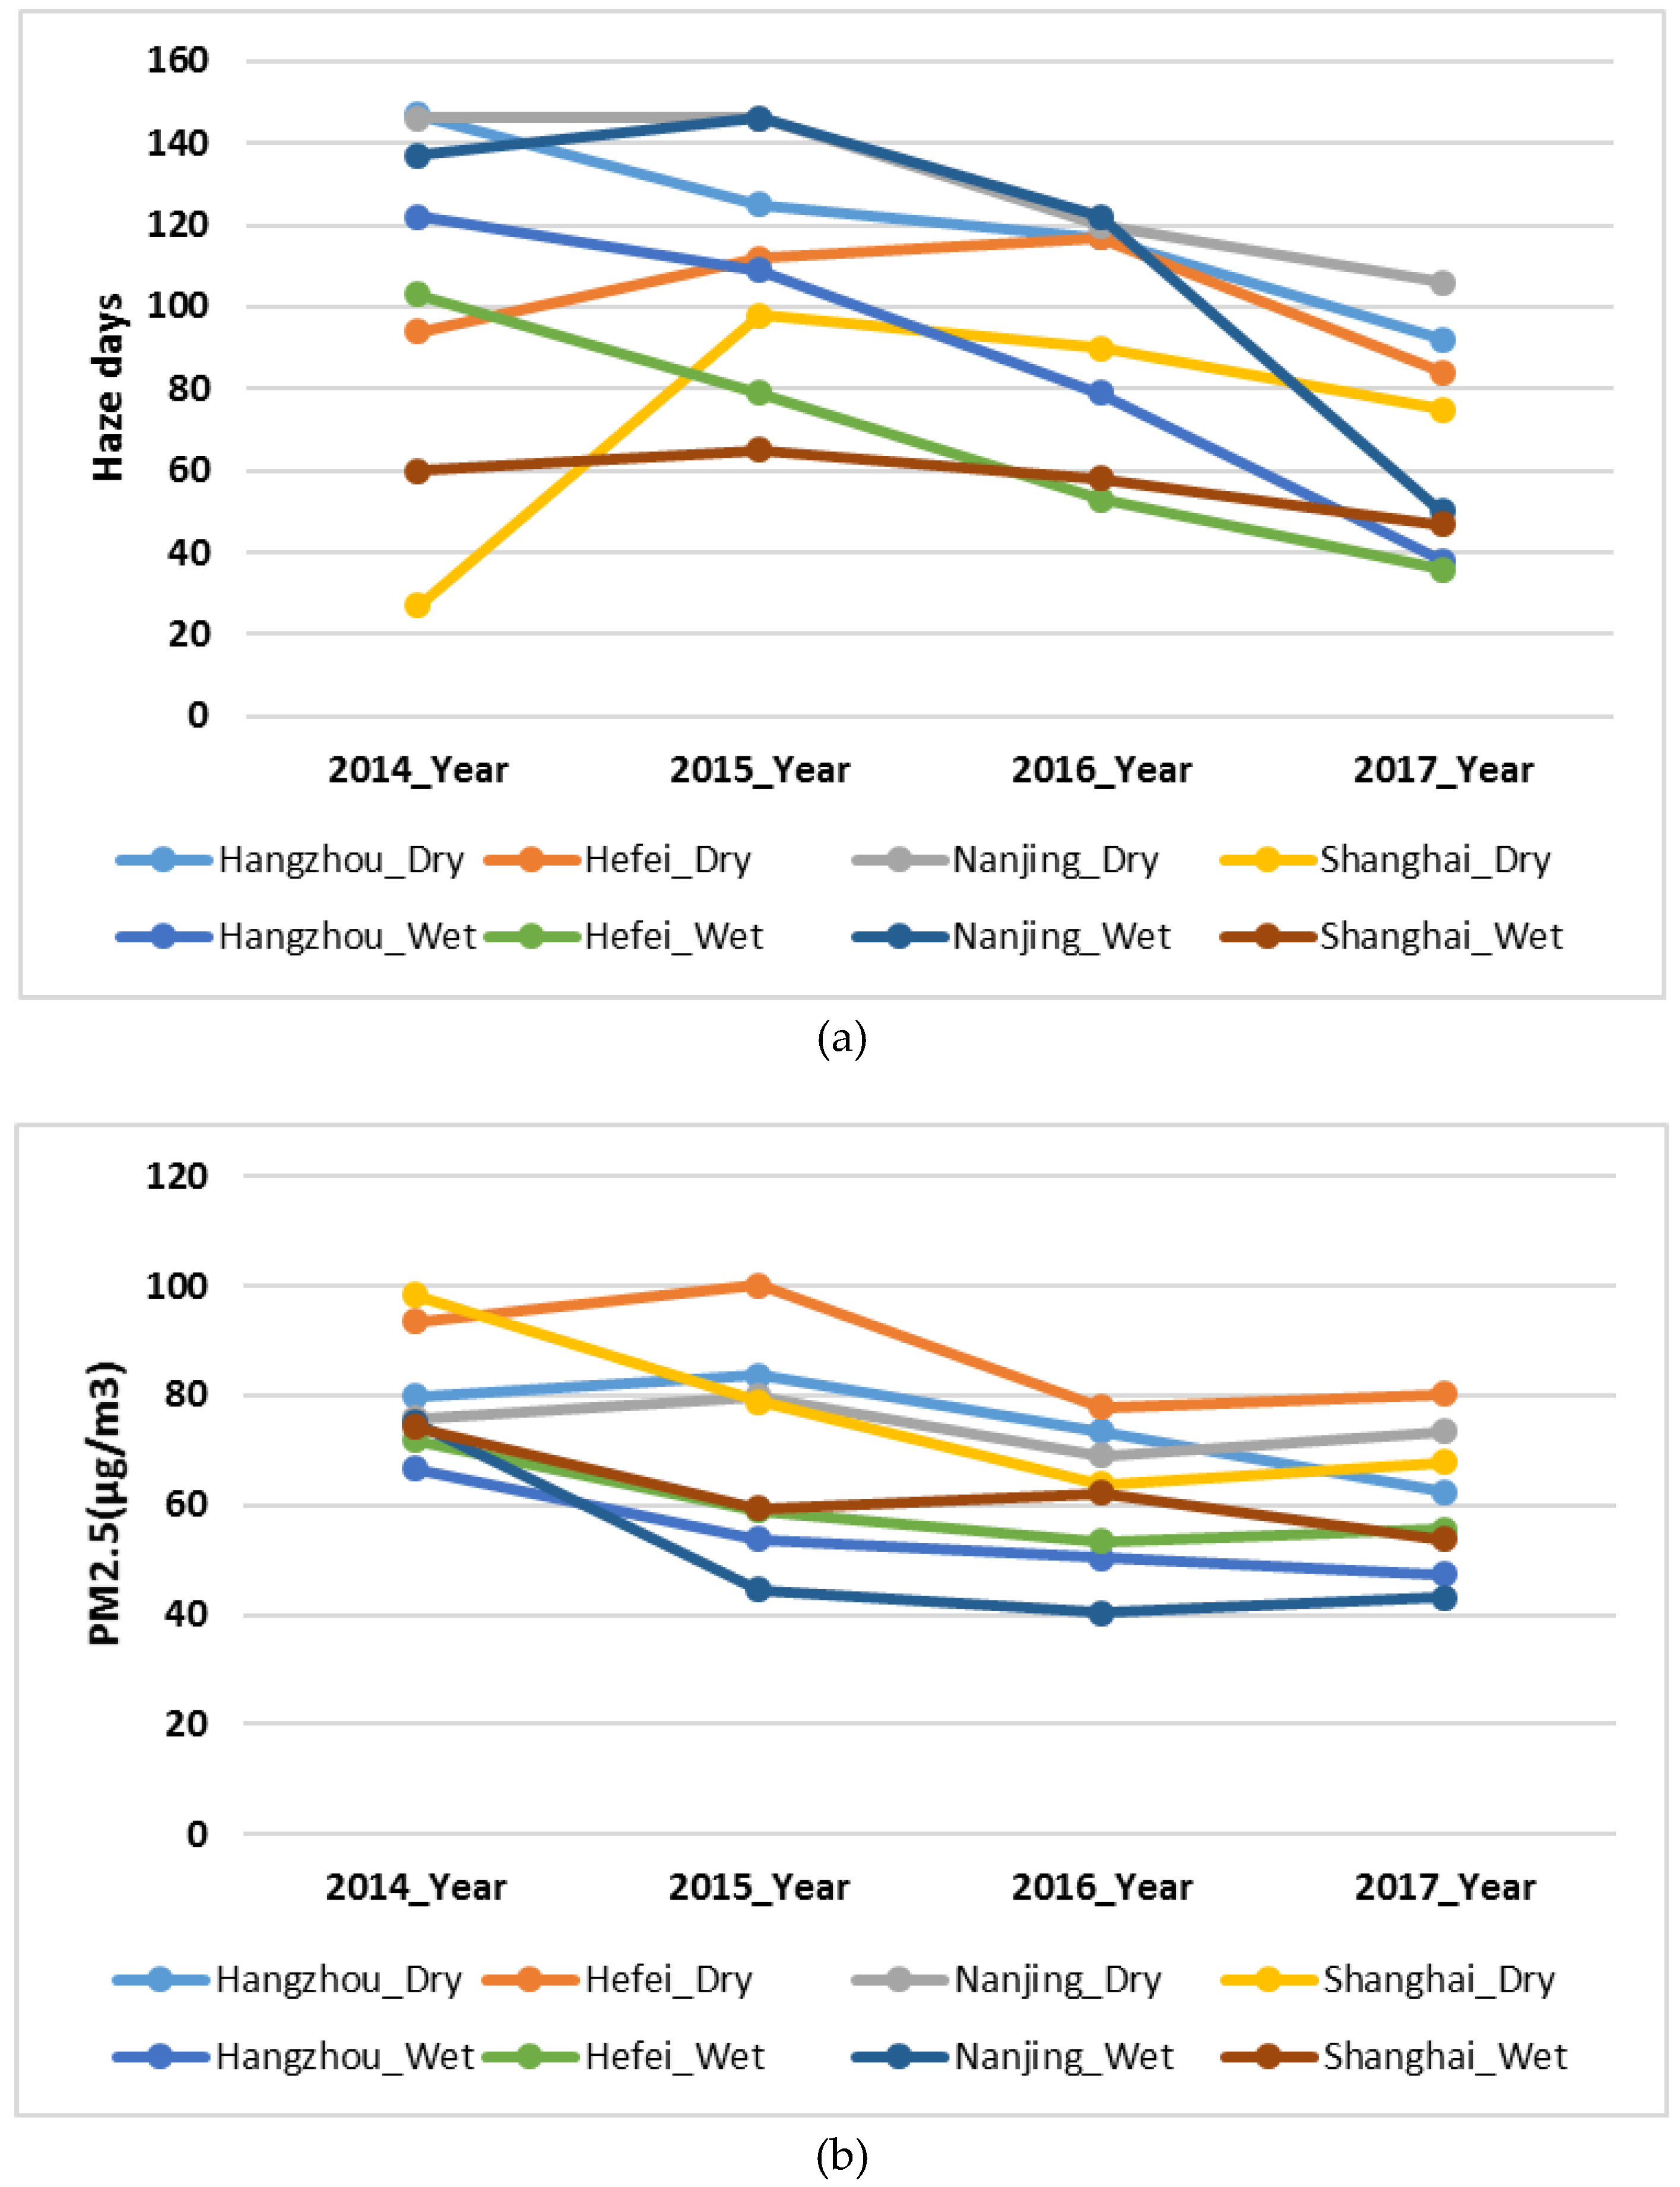
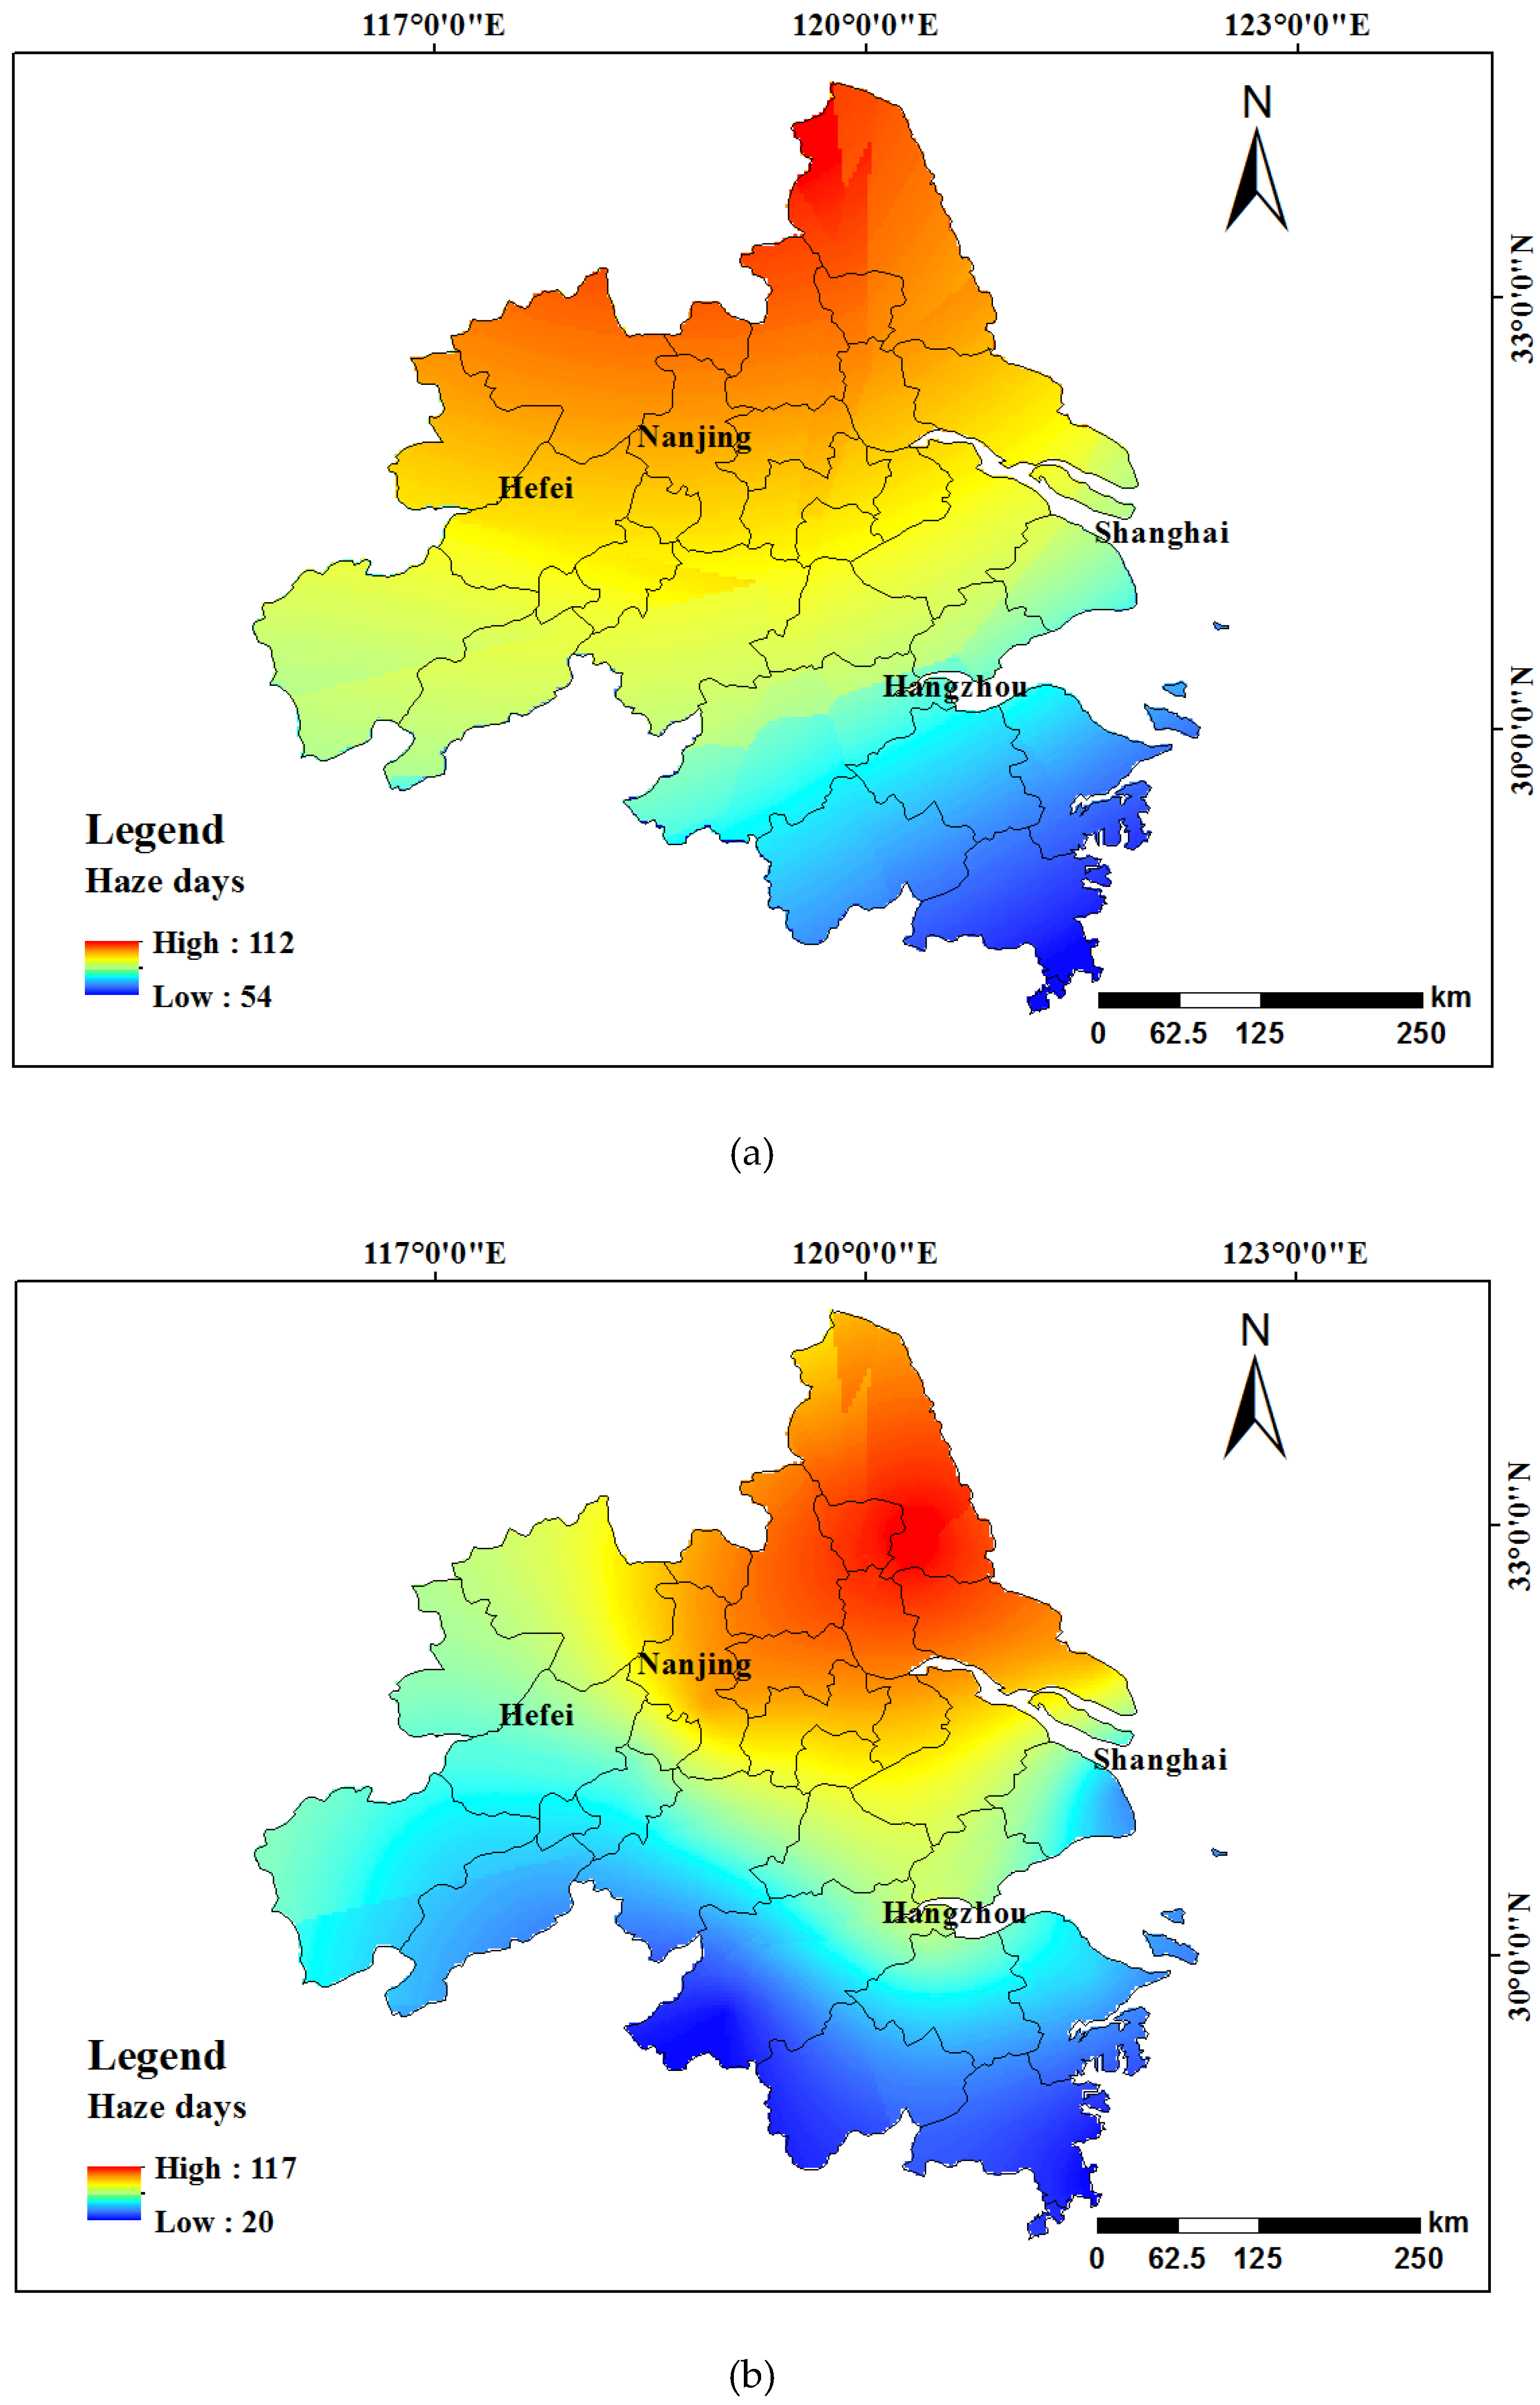
4.1. Haze Days Distribution in the YRDUA

The Yangtze River Delta has a typical subtropical climate. From October to March, the climate of YRDUA is dry and cold; thus, it is in a dry season. From April to September every year, the climate is hot and humid: that is when it is in a wet season. Therefore, we analyzed the characteristic of haze pollution separately during the dry season (from October to next March) and wet season (from April to September). As mentioned in the Section 3.1, haze days were determined by relative humidity and horizontal visibility. Table 1 shows the amount of haze days during the dry season and wet season at each meteorological station. Figure 2 shows the spatial distribution of haze days based on Kriging interpolation in the YRDUA.
As we can see in Table 1, the number of haze days during the dry season was higher than those in the wet season in all areas of the YRDUA. Take Hangzhou, Shanghai, Nanjing and Hefei as the four representative cities: during the dry season, Nanjing and Hangzhou had the top and second largest number of haze days, followed by Hefei and Shanghai. In the wet season, there was no change in the order of haze days in the four cities; however, haze days were significantly lower than those in the dry season. Haze days in Hefei decreased by 36% in the wet season compared to the dry season. The reduction rate in Shanghai and Hangzhou was about 25%, and Nanjing was the lowest at 12%. Haze days in each city during the dry and wet season from 2014 to 2017 are listed in Table 1. Combining the data of Table 1 and the fold line trend of Figure 2a, the haze days in the YRDUA showed a downtrend in both the dry and wet seasons from 2014 to 2017. Haze days decreased by 27.4% during the dry season and 63.5% during the wet season in Nanjing. The haze days in Hangzhou decreased by 37.4% (dry season) and 68.9% (wet season), respectively. The haze days in Hefei decreased by 10.6% (dry season) and 65% (wet season), respectively. Based on the data in Table 1, Figure 3 describes the spatial distribution of haze days in the YRDUA obtained by Kriging interpolation. The number of haze days in the northern YRDUA is much higher than that in the south. During the dry season, the dividing line between high numbers of haze days and a low number of haze days is in a northwest-southeast direction (Figure 3a). During the wet season, the dividing line is in a northeast-southwest direction (Figure 3b).
Haze days in the YRDUA showed a downtrend in both dry and wet season from 2014 to 2017 (Figure 2a), PM2.5 concentration listed in Table 2 showed a downward trend (Figure 2b). PM2.5 concentration decreased by 21.8% during the dry season and 28.8% during the wet season in Hangzhou. The PM2.5 concentration in Hefei decreased by 14.1% (dry season) and 22.6% (wet season). The PM2.5 concentration in Nanjing decreased by 3.1% (dry season) and 42.5% (wet season). The PM2.5 concentration in Shanghai decreased by 31% (dry season) and 27.5% (wet season). The decrease of haze days and decrease of PM2.5 concentration on haze days reflected the gradual improvement of air quality.

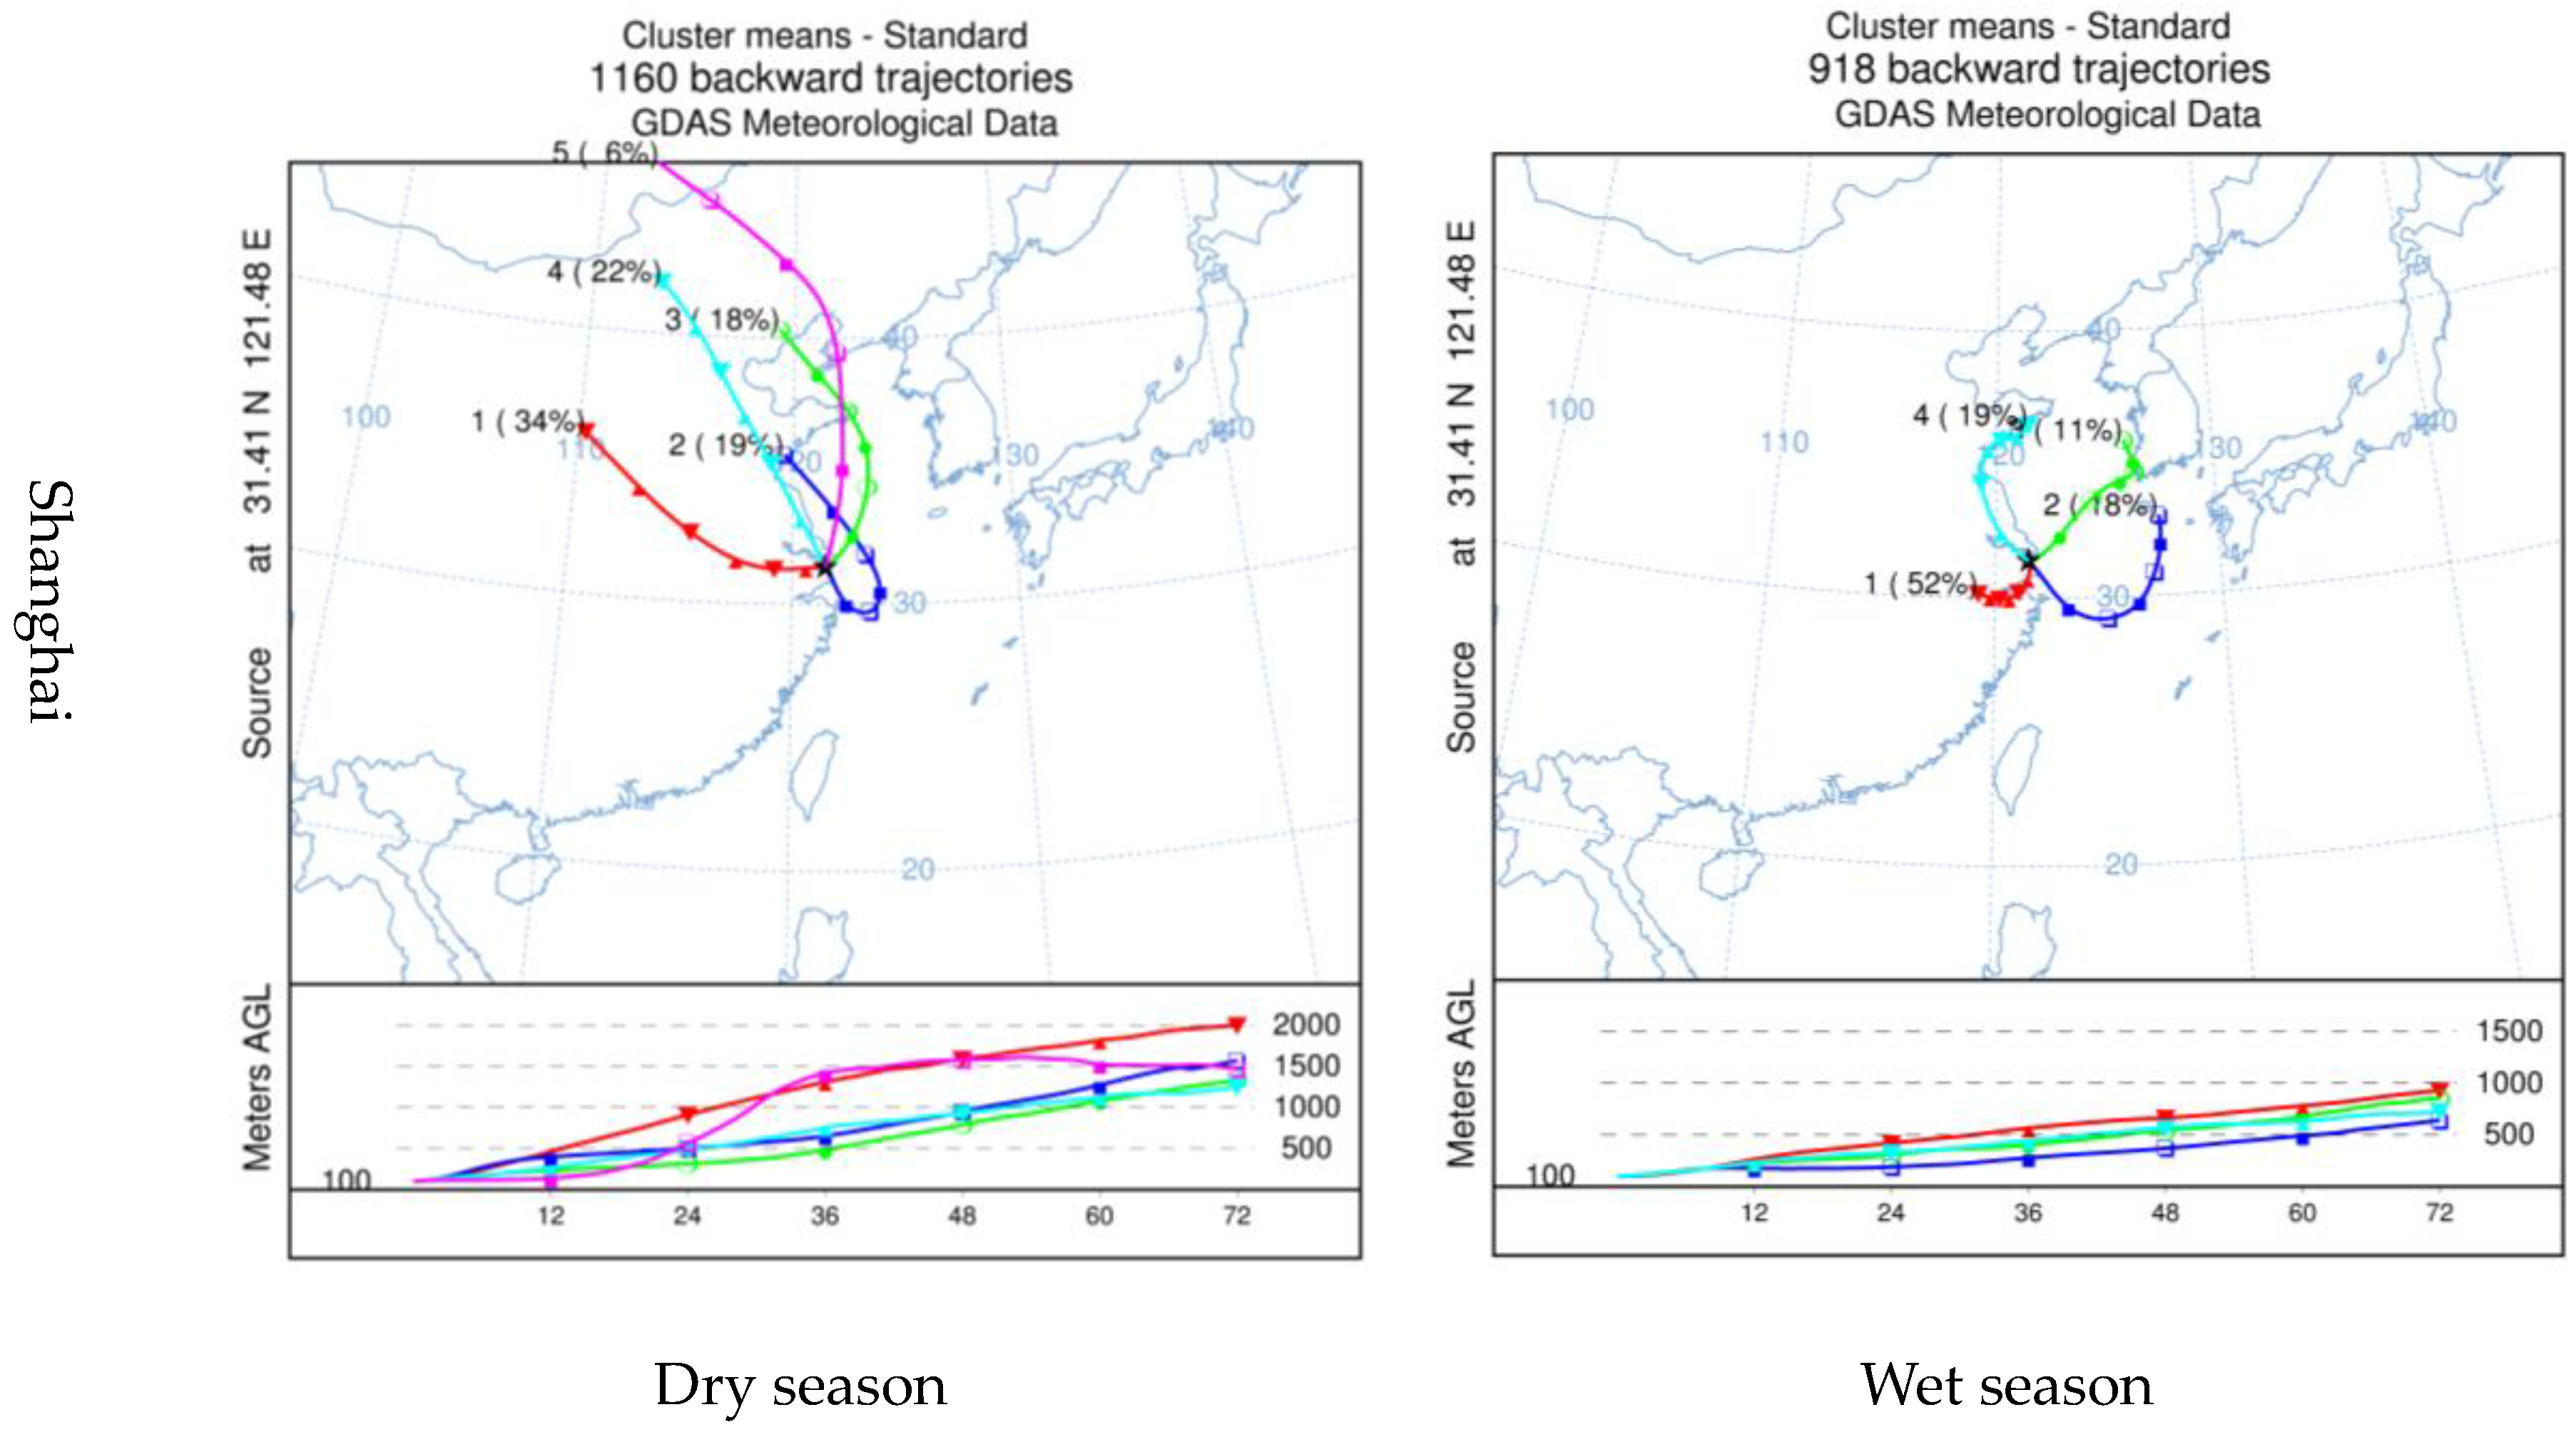
4.2. Backward Trajectory Clustering Analysis

Based on the HYSPLIT model, 100 m was set as the end altitude of air mass. A total of 11,161 backward trajectories were collected during 2014–2017, while the acceptance point was 120.19 E, 30.29 N (Hangzhou); 117.27 E, 31.86 N (Hefei); 118.78 E, 32.04 N (Nanjing); 121.48 E, 31.22 N (Shanghai), the clustering trajectories from different directions obtained by Ward’s method [18] were shown in Figure 4. The trajectory numbers and proportion of trajectories after clustering are also given in Figure 4. High proportion indicates a greater impact of particulates transported in the direction on city.
The transport directions and distance of the trajectories showed great differences in the wet season and dry season. Hangzhou is located in the southern part of the YRDUA, and is mainly affected by six types of air mass trajectories. During the dry season, the directions of the trajectories come from northwest or north. The second type of air mass trajectory originated from central and East Inner Mongolia, through Shanxi, Hebei, Shandong and Jiangsu, accounting for 28% of trajectories. Another type of air mass trajectory with a ratio of 28% originated from northern Anhui, which belongs to regional short-distance transport. The trajectories of the dry season come from the altitude of 1500 m to 2500 m, while the trajectories of air mass during the wet season mainly originated from the altitude of 1000 m to 1500 m. The velocity of air mass was relatively slow. The second type of trajectories in the wet season, which accounted for 30% of the total air mass trajectories, originated from the Yellow Sea and enters Hangzhou city through the Hangzhou Bay.
Nanjing and Hefei are both located in the western part of Yangtze River Delta Urban Agglomeration. The clustering of air mass trajectories in the two cities is similar in winter. More than 50% of the air mass trajectories originate in the North China Plain, and the transport altitude is between 1000 m and 1500 m. In addition, Hefei was also affected by the air mass from 3500 m altitude above Xinjiang. During the wet season, the air mass trajectories inputs of the two cities are very similar. The cities are mainly affected by the short distance input of the Yellow Sea, the East China Sea and the cities in the East China Plain. The air mass trajectory altitude is between 500 m and 1000 m.
Shanghai is the coastal city of the Yangtze River Delta. During the dry season, the air mass mainly comes from the northwest and the north. The air mass trajectories that entered Shanghai through Henan, Anhui and Jiangsu, originated from Shaanxi and accounted for 34% of the air mass trajectories. 37% of the air mass originated from the North China Plain and entered Shanghai through the sea. A total of 1160 backward trajectories were used to calculate the trajectories clustering in the dry season of Shanghai. The trajectories of green, sky blue and dark blue all originated in the area of Beijing, Tianjin and Hebei (35° N–40° N), where air pollution is serious. The three trajectories accounted for 59% of the total trajectories. During the wet season, 52% of air mass trajectories came from the input of Hangzhou and other surrounding cities. In addition, nearly 30% of the air mass came from the ocean; the altitude is below 1000 m.
In summary, the dry season was affected by the cold high pressure from Siberia, and the air flow mainly came from the northwest. The moving velocity of air mass can be judged according to the length of the trajectories; the air mass travelled faster during the dry season and reached the Yangtze River Delta through Inner Mongolia, Beijing-Tianjin-Hebei, Anhui and the Shandong provinces. The airflow from these areas not only carried particles along the journey, but also conveyed a large amount of gaseous pollutants. During the wet season, some of the air currents came from a southwest or southeast direction, which was influenced by the anticyclone over the western Pacific Ocean in spring or subtropical anticyclone in summer. The southeast direction of the airflow from the East China Sea and Yellow Sea was cleaner, and the backward trajectories of the other directions was shorter and the moving velocity is slower, which may be attributed to the contribution of some human pollution sources between cities. This is similar to the research results of other cities in the same area of Ge Y et al. [29]. Due to the difference of air mass velocity, the 72-h trajectory length also varied greatly. For example, the trajectory length during the dry season was generally longer than that in the wet season. According to the Advanced Regional Prediction System (ARPS) developed by the Center for Storm Analysis and Forecasting at the University of Oklahoma, USA, a 12-h trajectory of atmospheric pollution prediction in a mesoscale region (15 km) [30]. We argue that 72-h trajectory calculation is sufficient for the trajectory transport of pollution in a city scale (50–80 km). On the other hand, the backward trajectory of 36 h or 24 h can be used to calculate the short-distance air mass transport and to describe the motion of the air mass trajectory in a small area. This can provide ideas for studying the spread of internal pollution in smaller areas.

4.3. Potential Source Area and Pollution Level Analysis

On the basis of trajectory clustering, PSCF and CWT were selected to study the potential source area and pollution level of haze in YRDUA. Weighted potential source contribution and Concentration weighted trajectories for different PM2.5 over the Yangtze River Delta during haze days are presented in Figure 5 and Figure 6, respectively.
During the dry season, as shown in the left column of Figure 5, haze days of the YRDUA were mainly influenced by long-range transport from a northwest direction. The major long-range transport paths could be summarized into a northwestern path and a coastal path. Along the northwestern path, the airflows with pollution can cross over the Taihang Mountains and arrive in the Yangtze River Delta. Along the coastal path, haze airflows from Inner Mongolia passed through the Bohai Gulf and Shandong Peninsula, then entered into the Yangtze River Delta from the Yellow Sea.
During the wet season, as shown in the right column of Figure 5, there was a relatively short-distance transport from almost all the directions. Haze days of Yangtze River Delta were mainly influenced by short-distance regional transport. Nevertheless, the potential haze source areas in the YRDUA were still concentrated in northern Jiangsu and northern Anhui during the wet season.
Combined with transport directions and altitude variation of cluster trajectories, some air masses came from 2000 m or even higher altitudes. These were clean when they did not touch ground. However, as shown in Figure 4, the altitudes of air mass decreased gradually, and many polluted particles were transported to the Yangtze River Delta by air mass when they came into contact with the heavily polluted middle and lower atmosphere over the North China Plain. Take the trajectory of 3500 m altitudes during the dry season of Hefei as an example: the air mass transported to 1000 m altitude at −12 h, indicating that the air mass referred to by this trajectory is only the carrier of pollutant transport in the region. According to research by Stull [27] and Yang [28], the altitude of 1000 m is already below the atmospheric boundary layer and belongs to the mixed layer. The mixing, diffusion and dilution of pollutants mainly occur in the mixing layer. Thus, we argue that the trajectories of these air masses can carry pollutants to the Yangtze River Delta. Another example, there is a north-west trajectory at an altitude of 3000 m during the dry season of Hangzhou. The trajectory has been maintained at an altitude of 3000 m during the period of −72 h to −24 h. In −24 h, the air mass trajectory altitude dropped to 2000 m, carrying pollutants from northern Anhui and southern Shanxi to Yangtze River Delta. This indicates that the backward trajectory calculation for −72 h is sufficient.
Weighted concentration weighted field (WCWT) was used to analyze the pollution level of different trajectories. The distribution characteristics of WCWT and Weighted potential source contribution function (WPSCF) were similar in the dry season and wet season.
During the dry season, the North China plain to large areas of the Yangtze River Delta were potential pollution sources. Among the potential sources of haze pollution in Hangzhou during the dry season, Hunan in the southwest is the most polluted city, followed by other provinces in the North China Plain. Among the potential sources of haze pollution in Hefei, the most polluted province is Shandong. Among the potential sources of haze pollution in Shanghai, the most polluted areas are northern Anhui and Eastern Henan. As shown in the right column of Figure 6, the potential source of haze pollution in Hangzhou and Shanghai is along the coastline of China during the wet season. Haze pollution in Nanjing and Hefei, located in the western part of the Yangtze River Delta, was transported from the southeastern sea with air masses in the southeastern direction.

5. Conclusion

In this paper, meteorological elements (horizontal visibility and relative humidity) were selected to identify haze days in the Yangtze River Delta. The distribution maps of haze days in the Yangtze River Delta area can be drawn from the previous statistics. The number of haze days in the Northern YRDUA was much higher than that in the south. Based on the haze distribution, a HYSPLIT model was applied to calculate the transport trajectory and trajectory clustering.

5.1. Major Paths

The major transport paths of haze pollution to the Yangtze River Delta during the dry season could be summarized into a northwestern path and a costal path. The atmospheric pollutants in the North China were transported to Yangtze River Delta by the northwest trajectory. The transport path during the wet season could be classified as short distance transport from four different directions. The two main trajectories come from the southwest and northwest directions of the Yangtze River Delta, respectively. The other two trajectories were air masses transportations from the Yellow Sea and the East China Sea, respectively.

5.2. Trajectories Altitude

During the dry season, the −72 h air flow trajectories mainly come from the attitude of 1500 to 3000 m, while during the wet season, the air flow trajectories mainly come from the altitude of 500 to 1500 m. In these four cities, the input altitude of Shanghai air mass trajectories was the lowest. In conclusion, the trajectory altitude during the dry season was higher than that during the wet season, and the transportation velocity was faster.

5.3. Potential Source Area

The analysis results of PSCF and CWT showed that the haze pollution in the Yangtze River Delta region mainly comes from the fine particulate pollutants carried by air mass in the north and northwest, such as Hebei, Shandong, Anhui and Northern Jiangsu during the dry season. During the wet season, haze pollution was significantly reduced, embodied as internal transport in the Yangtze River Delta urban agglomeration. During the dry season, winds in the northwest and north can carry sand, dust and particulate matter to the Yangtze River Delta. Once stable weather occurs, it was not conducive to the elimination and diffusion of haze. During the wet season, the temperature was higher and the convections were more vigorous. Therefore, it is not easy to cause local pollution. Another reason is that a large proportion of the air masses in the wet season of the Yangtze River Delta came from the ocean, while the clean air masses over the ocean have little effect on haze pollution.

Author Contributions

Conceptualization, L.Z. and Y.Z.; methodology, L.Z.; software, X.K.; validation, X.K. and J.W.; formal analysis, L.Z.; investigation, L.Z.; resources, Y.Z.; data curation, X.K.; writing—original draft preparation, L.Z.; writing—review and editing, X.K.; visualization, L.Z.; supervision, J.W.; project administration, Y.Z.; funding acquisition, Y.Z.

Funding

This research was funded by the National Nature Science Foundation of China (Grant No. 41661144039, 41875027 and 41871238).

Acknowledgments

The authors would like to thank the NOAA and rp5.ru for the data that they kindly provided.

Conflicts of Interest

The authors declare no conflict of interest.

References

  1. Bouarar, I.; Wang, X.M.; Brasseur, G.P. Air Pollution in Eastern Asia: An Integrated Perspective; Springer International Publishing: Berlin, Germany, 2017. [Google Scholar]
  2. Xiao, Q.Y.; Wang, Y.J.; Chang, H.H.; Meng, X.; Geng, G.N.; Lyapustin, A.; Liu, Y. Full-coverage high-resolution daily PM2.5 estimation using MAIAC AOD in the Yangtze River Delta of China. Remote Sens. Environ. 2017, 199, 437–446. [Google Scholar] [CrossRef]
  3. Shao, P.; Xin, J.; An, J. The empirical relationship between PM2.5, and AOD in Nanjing of the Yangtze River Delta. Atmos. Pollut. Res. 2017, 8, 233–243. [Google Scholar] [CrossRef]
  4. Jiang, M.; Sun, W.W; Yang, G.; Zhang, D.F. Modelling seasonal GWR of daily PM2.5 with proper auxiliary variables for the Yangtze River Delta. Remote Sens. 2017, 9, 346. [Google Scholar] [CrossRef]
  5. He, Y. The Analysis of Two Haze Episodes from Different Sources over Yangtze River Delta in Winter. Master’s Thesis, Nanjing University of Information Science and Technology, Nanjing, China, 2017. [Google Scholar]
  6. Feng, Y.; Liu, H.N.; Sun, K. A sensitivity experiment of the air pollution transport in urban cluster over the Yangtze River Delta. Environ. Monit. Forewarn. 2016, 8, 5–12. (In Chinese) [Google Scholar]
  7. An, J.Y. Source Apportionment of Fine Particles in the Yangtze River Delta Region in Winter Season based on Air Quality Simulation. Master’s Thesis, Donghua University, Shanghai, China, 2015. [Google Scholar]
  8. Chen, W.C. Pollution Characteristics and Source Apportionment of Ambient Particulate Matter in Hangzhou, Yangtze River Delta of China. Master’s Thesis, Zhejiang University, Hangzhou, China, 2018. [Google Scholar]
  9. Yang, L.; Wu, Y.; Davis, J.M. Estimating the effects of meteorology on PM2.5 reduction during the 2008 Summer Olympic Games in Beijing, China. Front. Environ. Sci. Eng. China 2011, 5, 331–341. [Google Scholar] [CrossRef]
  10. Han, S.Q.; Wu, J.H.; Zhang, Y.F.; Cai, Z.Y.; Feng, Y.C.; Yao, Q.; Li, X.J.; Liu, Y.W.; Zhang, M. Characteristics and formation mechanism of a winter haze-fog episode in Tianjin, China. Atmos Environ. 2014, 98, 323–330. [Google Scholar] [CrossRef]
  11. Guo, L.J.; Guo, X.L.; Fang, C.G.; Zhu, S.C. Observation analysis on characteristics of formation, evolution and transition of a long-lasting severe fog and haze episode in North China. Sci. China-Earth Sci. 2015, 58, 329–344. [Google Scholar] [CrossRef]
  12. Koo, Y.S.; Yun, H.Y.; Choi, D.R.; Han, J.S.; Lee, J.B.; Lim, Y.J. An analysis of chemical and meteorological characteristics of haze events in the Seoul metropolitan are during January 12–18, 2013. Atmos. Environ. 2018, 178, 87–100. [Google Scholar] [CrossRef]
  13. Jiang, B.B. The development of Haze Events observed by multi-satellite retrievals and Meteorological Analysis in Eastern China. Master’s Thesis, Zhejiang University, Hangzhou, China, 2015. [Google Scholar]
  14. Jiang, B.B.; Zhang, X.Y.; Du, Y.; Huang, D.S. Establishing monitoring model of Haze event with multi-satellite data and application-a case: Yangtze River Delta. In Proceedings of the International Symposium on Optoelectronic Technology and Application, Beijing, China, 13 May 2014. [Google Scholar]
  15. Wu, Y.J.; Wang, P.; Yu, S.C.; Wang, L.Q.; Li, P.F.; Li, Z.; Mehmood, K.; Liu, W.P.; Wu, J.; Lichtfouse, E.; Rosenfeld, D.; Seinfeld, J.H. Residential emissions predicted as a major source of fine particulate matter in winter over the Yangtze River Delta, China. Environ. Chem. Lett. 2018, 16, 1–11. [Google Scholar] [CrossRef]
  16. Chen, Y.; Luo, B.; Xie, S.D. Characteristics of the long-range transport dust events in Chengdu, Southwest China. Atmos. Environ. 2015, 122, 713–722. [Google Scholar] [CrossRef]
  17. Liang, D.; Wang, Y.Q.; Ma, C.; Wang, Y.J. Variability in Transport Pathways and Source Areas of PM10 in Beijing during 2009–2012. Aerosol Air Qual. Res. 2016, 16, 3130–3141. [Google Scholar] [CrossRef]
  18. Zhou, S.; Liu, N.; Liu, C.S. Identification for potential sources for haze events in Shanghai from 2013 to 2015. Acta Scien. Circum. 2017, 37, 1835–1842. (In Chinese) [Google Scholar]
  19. Zhou, S.X.; Wang, X.; Gong, Z.Q.; Shi, C. Transport patterns of PM2.5 in the western Yangtze River Delta district, China. Acta Meteorol Sin. 2017, 75, 996–1010. [Google Scholar]
  20. Li, T.Y.; Deng, X.J.; Li, Y.; Song, Y.S.; Li, L.Y.; Tan, H.B.; Wang, C.L. Transport paths and vertical exchange characteristics of haze pollution in Southern China. Sci. Total. Environ. 2018, 625, 1074–1087. [Google Scholar] [CrossRef] [PubMed]
  21. Shi, C.N.; Yuan, R.M.; Wu, B.W.; Meng, Y.J.; Zhang, H.; Zhang, H.Q.; Gong, Z.Q. Meteorological conditions conducive to PM2.5 pollution in winter 2016/2017 in the Western Yangtze River Delta, China. Sci. Total. Environ. 2018, 642, 1221–1232. [Google Scholar] [CrossRef] [PubMed]
  22. Zong, Z.; Wang, X.P.; Tian, C.; Chen, Y.J.; Fu, S.F.; Qu, L.; Ji, L.; Li, J.; Zhang, G. PMF and PSCF based source apportionment of PM2.5, at a regional background site in North China. Atmos. Res. 2018, 203, 207–215. [Google Scholar] [CrossRef]
  23. Zeng, Y.; Hopke, P.K. A study of the sources of acid precipitation in Ontario, Canada. Atmos. Environ. 1989, 23, 1499–1509. [Google Scholar] [CrossRef]
  24. Mukherjee, A.; Agrawal, M. Assessment of local and distant sources of urban PM2.5, in middle Indo-Gangetic plain of India using statistical modeling. Atmos. Res. 2018, 213, 275–287. [Google Scholar] [CrossRef]
  25. Hsu, Y.K.; Holsen, T.M.; Hopke, P.K. Comparison of hybrid receptor models to locate PCB sources in Chicago. Atmos. Environ. 2003, 37, 545–562. [Google Scholar] [CrossRef]
  26. Li, T.Y.; Fan, S.J.; Deng, X.J.; Zhang, X.B.; Deng, T.; Li, F. Study on the regional transported effect of PM2.5 in Guangzhou area. J. Univers.Chin. Acad. Sci. 2014, 31, 403–409. [Google Scholar]
  27. Stull, R.B. An Introduction to Boundary Layer Meteorology; Kluwer Academic Publishers: Dordrecht, Netherlands, 1988; pp. 450–476. [Google Scholar]
  28. Yang, F.Y. The Atmospheric Boundary Layer Height Study Based on Ground-based Remote Sensing and Numerical Simulation. Master’s Thesis, Nanjing University, Nanjing, China, 2015. [Google Scholar]
  29. Ge, Y.; Wang, M.X.; Bai, X.; Yao, J.B; Zhu, Z.R. Pollution characteristics and potential sources of PM2.5 in Su-Xi-Chang region. Acta Scien. Circum. 2017, 37, 803–813. (In Chinese) [Google Scholar]
  30. Kang, N. A Study on Regional Numerical Simulation of Air Pollution. Master’s Thesis, Nanjing University of Information Science and Technology, Nanjing, China, 2006. [Google Scholar]
Figure 1. Geographical location of the study area.
Atmosphere 09 00502 g001
Figure 2. Haze days variety in four major cities (a); PM2.5 variety in four major cities (b).
Atmosphere 09 00502 g002
Figure 3. The spatial distribution of haze days in each meteorological station in the YRDUA from 2014 to 2017 during the dry season (a) and wet season (b).
Atmosphere 09 00502 g003
Figure 4. Trajectories clusters for dry and wet seasons of the YRDUA.
Atmosphere 09 00502 g004aAtmosphere 09 00502 g004b
Figure 5. Weighted potential source contribution for PM2.5 in dry and wet seasons in the YRDUA.
Atmosphere 09 00502 g005
Figure 6. Concentration weighted trajectories for PM2.5 in dry and wet seasons in YRDUA.
Atmosphere 09 00502 g006aAtmosphere 09 00502 g006b
Table 1. The amount of haze days in each station over The Yangtze River Delta Urban Agglomeration (YRDUA).
CityHaze DaysDry SeasonWet Season2014201520162017
DryWetDryWetDryWetDryWet
Shanghai5202902302760986590587547
Nanjing97451845514613714614612012210650
Liyang7524193331281131048788739960
Lvsi9344854491321371191231099212597
Dongtai10015044971471341371431271259395
Hangzhou829481348147122125109117799238
Dachen island81612089228161152
Ningbo586361225107901007188416623
Qiandao Lake1931553842103784512318
Shengzhou53635518110458927295306421
Zhoushan3742181566167754151343114
Hefei6684072619410311279117538436
Anqing5163291877568796397287828
Wuhu5083091995049997497456331
Table 2. PM2.5 concentration in four main cities during dry season and wet season (μg/m3).
CityDry SeasonWet Season2014201520162017
DryWetDryWetDryWetDryWet
Hangzhou77.7055.8479.8966.6983.7353.7173.3550.4362.4547.45
Hefei90.4061.6293.4371.75100.1758.9877.8253.3180.2355.55
Nanjing75.5750.3975.8874.9979.8344.6568.9940.3173.5343.09
Shanghai76.6961.9698.4074.2078.9359.3563.9062.2867.9053.79

