Article

Combination of Warming and Vegetation Composition Change Strengthens the Environmental Controls on N2O Fluxes in a Boreal Peatland

1
Environment and Sustainability, School of Science and the Environment, Memorial University of Newfoundland, Corner Brook, NL A2H 5G4, Canada
2
Graduate Program in Environmental Science, Memorial University of Newfoundland, St. John’s, NL, A1C 5S7, Canada
*
Author to whom correspondence should be addressed.
Atmosphere 2018, 9(12), 480; https://doi.org/10.3390/atmos9120480
Submission received: 29 October 2018 / Revised: 29 November 2018 / Accepted: 4 December 2018 / Published: 6 December 2018
(This article belongs to the Special Issue Surface-Atmosphere Exchange: Impact on Biogeochemistry)

Abstract

:
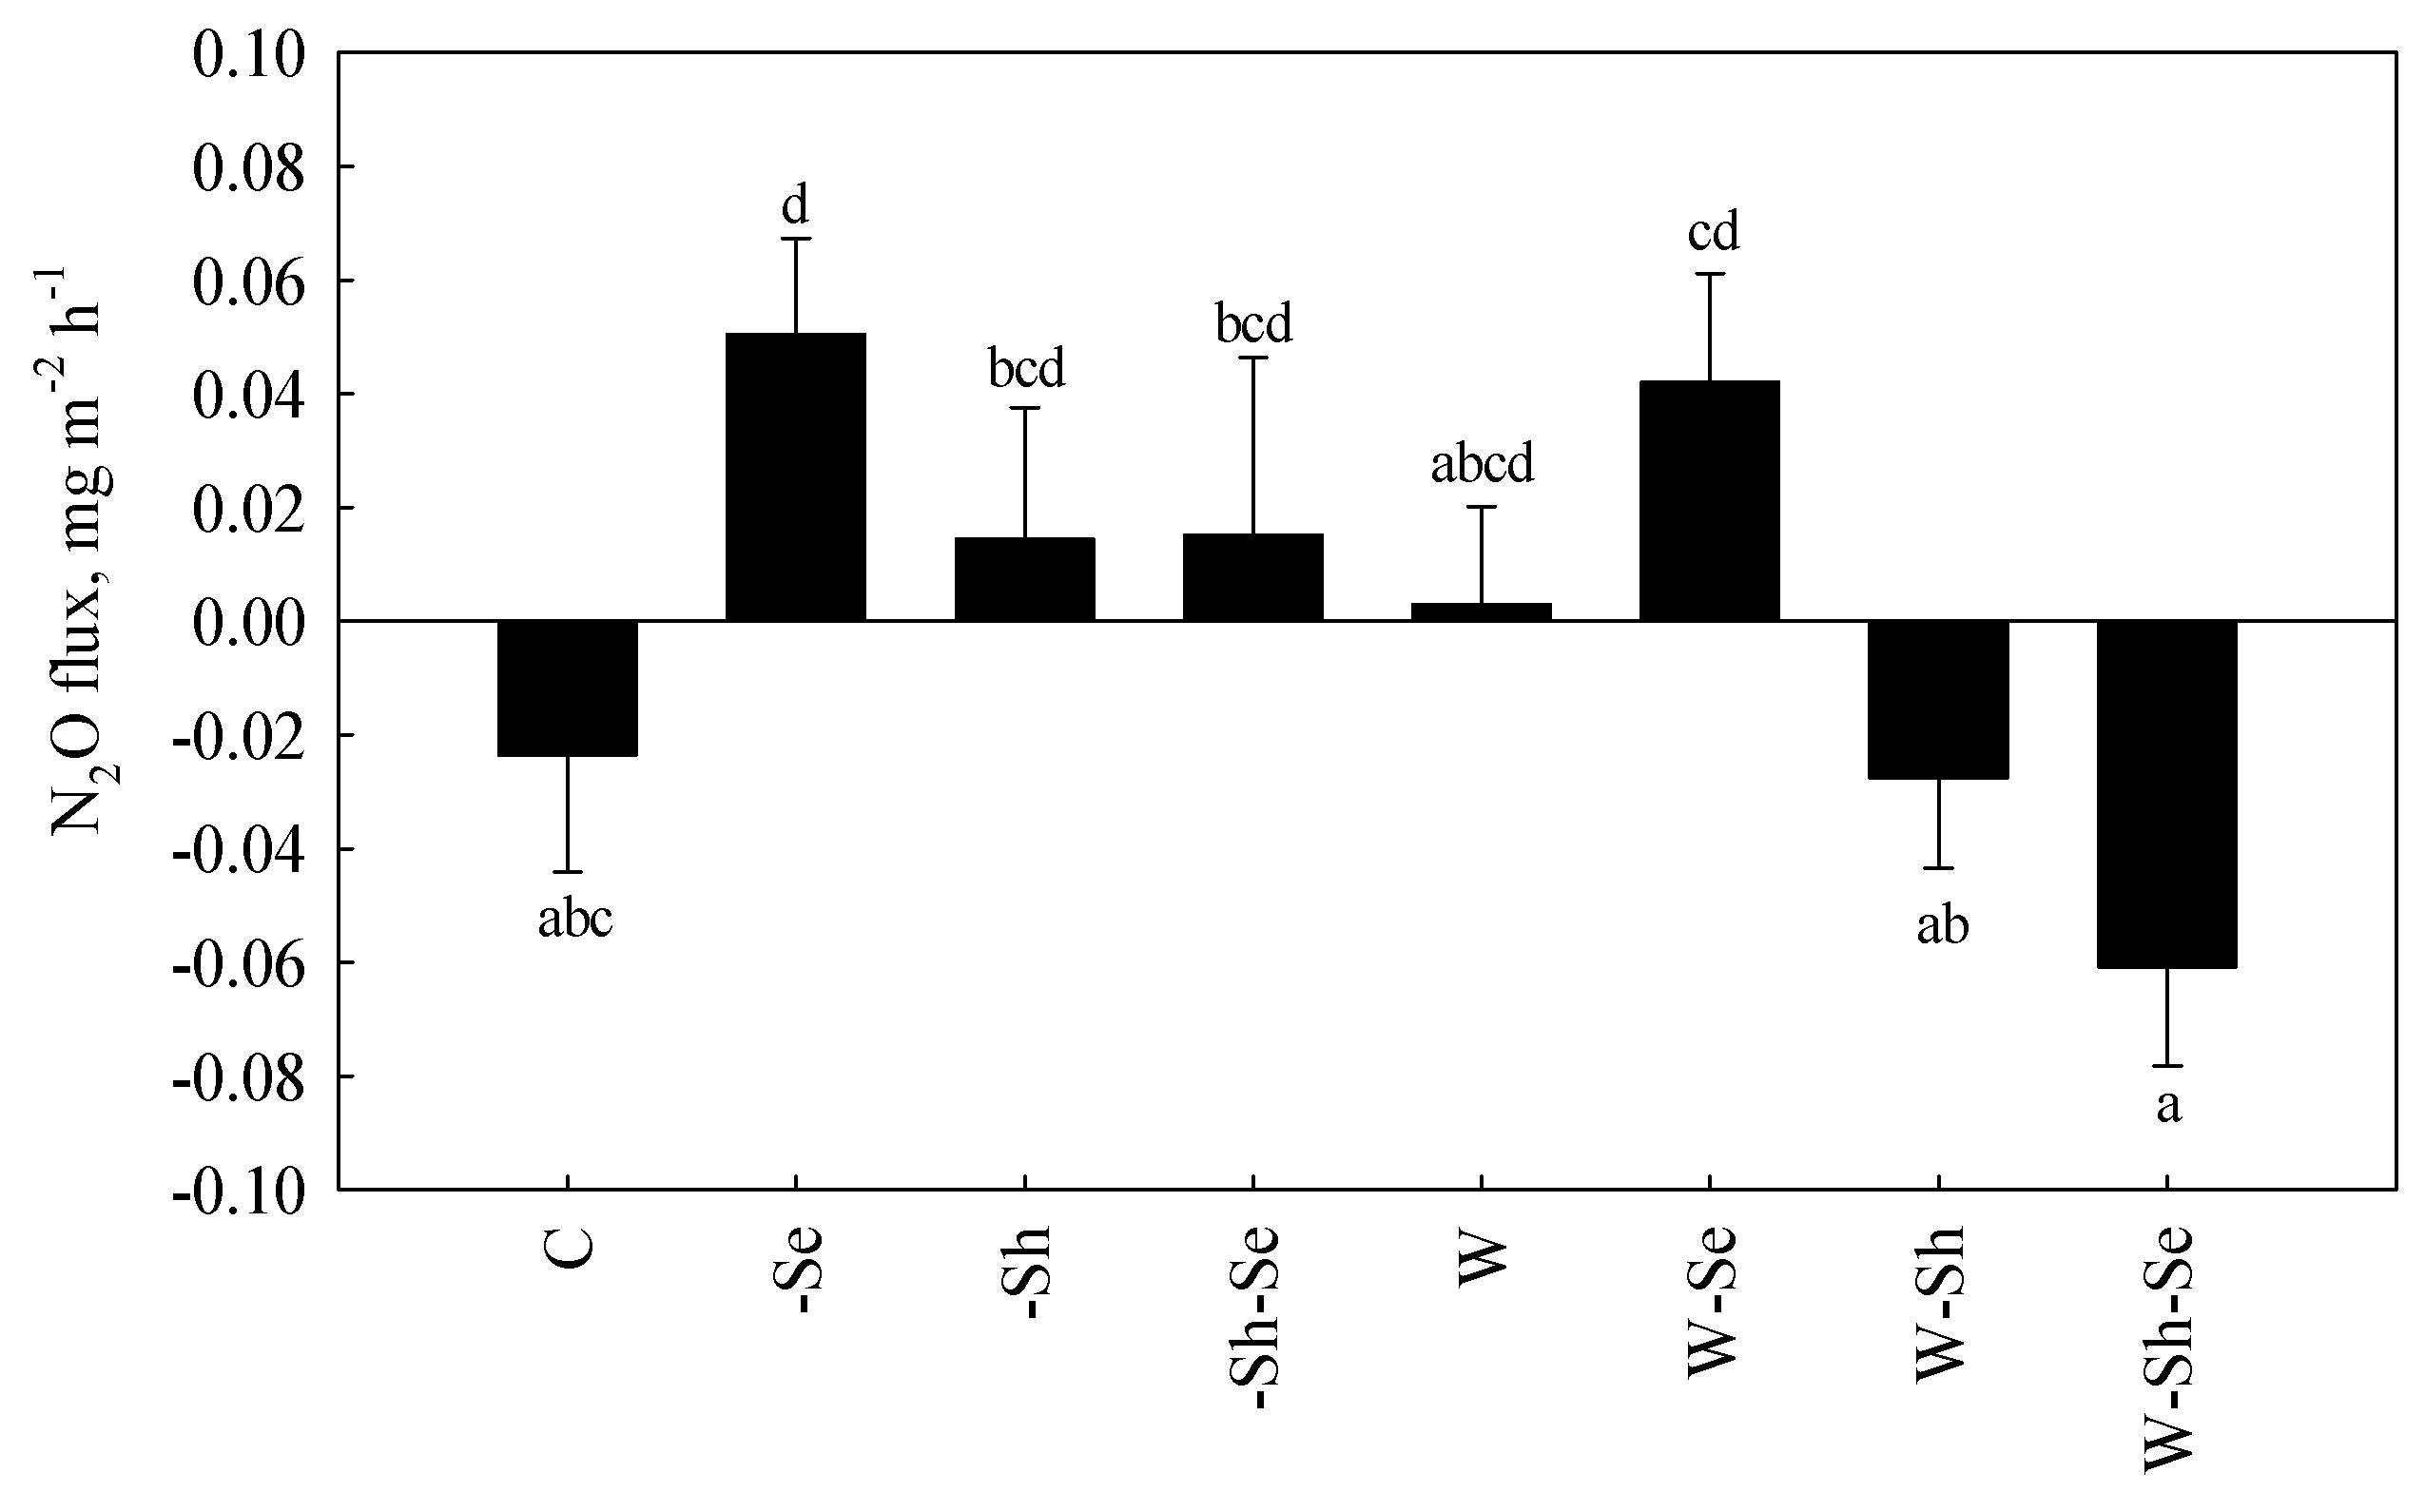
Climate warming and vegetation composition change are expected to influence greenhouse gas emissions from boreal peatlands. However, the interactive effects of warming and different vegetation compositions on N2O dynamics are poorly known, although N2O is a very potent greenhouse gas. In this study, manipulated warming and vegetation composition change were conducted in a boreal peatland to investigate the effects on N2O fluxes during the growing seasons in 2015 and 2016. We did not find a significant effect of warming treatment and combination treatments of warming and vegetation composition change on N2O fluxes. However, sedge removal treatment significantly increased N2O emissions by three-fold. Compared with the treatment of shrub and sedge removal, the combined treatment of warming and shrub and sedge removal significantly increased N2O consumption by five-fold. Similar to N2O fluxes, the cumulative N2O flux increased by ~3.5 times under sedge removal treatment, but this effect was not significant. In addition, the results showed that total soil nitrogen was the main control for N2O fluxes under combinative treatments of warming and sedge/shrub removal, while soil temperature and dissolved organic carbon were the main controls for N2O release under warming combined with the removal of all vascular plants. Our results indicate that boreal peatlands have a negligible effect on N2O fluxes in the short-term under climate change, and environmental controls on N2O fluxes become increasingly important under the condition of warming and vegetation composition change.

1. Introduction

Peatlands exert a global cooling effect on climate over centuries due to prevailing carbon dioxide (CO2) uptake by photosynthesis compared to small greenhouse gas (GHG) emissions by decomposition. However, climate change, such as global warming and vegetation composition change, can reduce this cooling function through the alteration of the photosynthesis and decomposition rate. On the one hand, as a result of global warming, soil temperature will be increased, which can stimulate microbial activity and then increase the rate of decomposition [1]. On the other hand, global warming can increase the rate of photosynthesis [2]. Accordingly, the net effect of global warming on GHG emissions from peatlands depends on the balance between photosynthesis and decomposition. Varying the vegetation composition also impacts the cooling function of peatlands driven by the vegetation traits, including aerenchymatous tissues, nutrient uptake ability, quantity and quality of litter, and root exudates [3,4]. Contrary to moss, vascular plants have aerenchymatous tissues to transport GHGs from the anaerobic zone to the atmosphere [5]; and litter from vascular plants decays faster than moss [6]. Furthermore, vascular plants also compete with soil microbes for nutrients, which may decrease the decomposition rate [7]; but the priming effect of the roots can increase the decomposition of recalcitrant substance [8,9]. Despite the knowledge that global warming and vegetation composition can both affect greenhouse gas dynamics, their interactive effect is poorly understood, especially for nitrous oxide (N2O), which is one of the most important GHGs and ozone depletion substances.
Some studies have revealed no evidence of warming effects on N2O flux due to nitrogen limitation [10,11], while other studies have reported that warming enhanced N2O emissions from peatlands by changing the water table depth and soil temperature [12,13]. Taking these contradictory results into account, we are still unclear about the effect of warming on N2O flux in peatlands and the major controls on it. Although some studies have focused on biotic and abiotic controls on N2O emission from peatland ecosystems, including soil microorganisms, water table depth, soil temperature, soil carbon, and nitrogen content [11,12,13,14,15], it remains unclear if these relationships still stand, and little is known about the main controls on N2O emission from natural peatlands under climate change.
Besides warming, vegetation composition is also critical to N2O fluxes in peatlands and plays an important role in N2O production, consumption, and transportation. For instance, plant litter and root exudates provide labile materials for N2O production. Aerenchymatous tissues can facilitate N2O transport from the soil to the atmosphere [16], but oxygen supplied to sedge roots via aerenchymatous tissues inhibits denitrification and thus prevents N2O production as denitrification requires anaerobic conditions [17]. N2O is produced via nitrification under oxic conditions; however, the production rates are very small in comparison to N2O production via denitrification under anaerobic conditions. Furthermore, vegetation competes with soil microorganisms for nitrogen (N), thus reducing N2O production [18]. Likewise, one recent study has demonstrated that vascular plants reduce N2O emissions from a peatland, which is associated with the priming effect and competition for nutrients [7].
The aim of this study was to investigate the effect of warming, vegetation composition, and environmental controls on N2O fluxes in a boreal peatland. Manipulated warming and removal of vascular plants (sedge and/or shrub) were conducted in a boreal peatland in western Newfoundland, Canada. Since the competition between plants and microbes may lead to decreasing nitrogen availability for N2O production, we hypothesized that (1) the removal of sedges increases N2O emissions. Since warming can stimulate microbial activities, we hypothesized that (2) warming enhances the effect of vascular plant removal treatments on N2O release. In addition, we also hypothesized that (3) environmental controls on N2O emissions vary between the treatments.

2. Methodology

2.1. Study Site

The study was conducted in an ombrotrophic blanket bog, in Robinsons, western Newfoundland, Canada (48°15′46″ N, 58°39′21″ W). The study area experiences a boreal climate, with a mean annual temperature of 5 °C and annual rainfall of 1340 mm (1981–2010). The mean pH (1:5 soil/water) and peat depth at the site are 4.5 ± 0.01 and 3 m, respectively [19]. The site represents the typical type of peatland found on the island of Newfoundland, where the dominant plant community consists of graminoids (Trichophorum cespitosum, Carex chordorrhiza) and dwarf shrubs (Gaylussacia baccata, Rhododendron groenlandicum, Andromeda glaucophylla, Ledum palustre ssp.), with bryophytes (Sphagnum spp., Hylocomium splendens, Aulacomnium turgidum) [20].

2.2. Experimental Design

A factorial design comprising the manipulation of temperature and plant functional types was established in spring 2014. The experiment was run for three years, and we sampled during the growing seasons of 2015 and 2016. There were eight treatments: control (C), warming (W), removal of shrub (-Sh), removal of sedge (-Se), removal of shrub and sedge (-Sh-Se), warming and removal of sedge (W-Se), warming and removal of shrub (W-Sh), and warming and removal of shrub and sedge (W-Se-Sh). Four replicates of each treatment were randomly distributed throughout the 32 plots (2 m × 2 m). A 2 m buffer zone separated adjoining plots. Warming was achieved by open-top chambers (OTC) [21], which were 0.8 m along the bottom edge in length, 0.625 m along the top edge in length, and 0.4 m in height. Vegetation was removed by hand and cut back to the litter layer level. Although Sphagnum mosses and other bryophytes were the dominant vegetation type in the peatland, they were not removed to avoid soil disturbance.

2.3. Gas Measurements

Gas samples were collected using opaque chambers (0.5 m in height and 0.263 m in diameter) fitted to the groove of the PVC collar, which was permanently inserted into the peat to a depth of 0.1 m in spring 2014. The chambers were equipped with a capillary tube to maintain atmospheric pressure. Gas samples were taken from the chamber headspace using 60 mL gas syringes at 0 min, 10 min, 20 min, and 30 min after closure. The samples were analyzed within a week after sampling using the gas chromatograph (Bruker Inc., Milton, Canada) equipped with an electron capture detector. Gas sampling was conducted between 10:00–15:00 local time biweekly from June to October 2015 and 2016. N2O flux was adjusted for field sampling temperature and headspace volume [22], and was calculated by:
F = ( d C / d t ) × V / A
where F is N2O flux (positive values indicate N2O emission, negative values indicate N2O absorption), V is the volume of the chamber, A is the chamber cover area, and dC/dt is the change of concentration over time. Samples were accepted when they yielded a linear regression with the value of r2 greater than 0.7. In addition, cumulative seasonal (May–October) N2O fluxes were obtained through the linear interpolation of biweekly static chamber measurements.

2.4. Soil Water Measurements

Soil pore water samples at a ~0.1 m depth were collected using MacroRhizons samplers (Rhizosphere Inc., Wageningen, The Netherlands) from each plot. Water samples at a depth of 0.4 m were collected using a 60 mL syringe and perforated PVC tube that was previously inserted at a 0.4 m depth. All water samples were collected at the same time when the gas samples were taken. The water samples were filtered by a 0.45 µm membrane prior to analysis. Dissolved organic carbon (DOC) and dissolved total nitrogen (TN) in the water sample were analyzed on a Shimadzu TOC-LCPH/TN analyzer (Shimadzu Inc., Kyoto, Japan).

2.5. Environmental Variables

Air temperatures at vegetation canopy height were recorded continually at a 30-min time step using temperature loggers (Lascar Electronics Ltd., Wiltshire, UK). Because the temperature logger at the warming plot was damaged during the growing seasons of 2015 and 2016, the air temperature data during the growing season of 2014 was used to test the efficiency of the warming treatment. Soil temperature at a 0.05 m and 0.2 m depth was measured by soil thermometers (Traceable™ Digital Thermometer, Fisher Scientific Inc., Ottawa, Canada). Soil moisture at a 0.05 m depth was measured by a soil moisture sensor (ProCheck, Decagon Devices Inc., Pullman, USA). Water table levels were measured from dip-wells made of a 1 m-long perforated PVC pipe installed in each plot (a positive value indicates a water level below the peat surface). Soil temperature, soil moisture, and water table depth were measured at the same time when the gas samples were collected.

2.6. Statistical Analysis

The effects of warming, plant functional types, years, and dates on average N2O fluxes were examined using repeated measurements ANOVA, and the Duncan’s significant difference test was employed to identify differences among these treatments. Three-way ANOVA was used to analyze the effect of warming, sedge removal, and shrub removal treatments on cumulative N2O fluxes and environmental parameters, including soil temperature, soil moisture, water table depth, DOC, and TN in the water samples. Data were checked for normality and transformed if necessary before analysis. A linear regression model was applied to analyze the relationship between N2O flux and the environmental parameters. All statistical analyses were performed in the SPSS 20.0 statistical software package (SPSS, Inc., Chicago, IL, USA).

3. Results

3.1. Environmental Parameters

The warming treatment effectively increased the daytime (from 8 a.m. to 6 p.m.) air temperature by 1.93 °C during the growing season of 2014 (Figure 1). The soil temperature at a 0.05 m depth increased by 0.8 °C during the growing seasons of 2015 and 2016, but this effect was not significant. Compared with the control treatment, the total nitrogen at a 0.1 m depth was significantly decreased by 25% under warming. The vascular plant removal treatment (-Sh-Se) significantly increased DOC at a 0.1 m depth by 9%. The combined treatment of warming and shrub removal significantly decreased soil moisture by 17.3% and decreased TN at a 0.1 m depth by 25%. No significant effects of warming and different vegetation composition treatments on soil temperature (T) at a 0.2 m depth, water table depth (WTD), and DOC at a 0.4 m depth were observed (Table 1).

3.2. Treatment Effects on N2O Fluxes

The mean N2O fluxes were 0.050 mg m−2 h−1 under sedge removal treatment (-Se), 0.042 mg m−2 h−1 under warming and sedge removal treatment (W-Se), 0.015 mg m−2 h−1 under shrub removal treatment (-Sh), 0.015 mg m−2 h−1 under sedge and shrub removal treatment (-Se-Sh), 0.003 mg m−2 h−1 under warming treatment (W), −0.024 mg m−2 h−1 under control (C) treatment, −0.028 mg m−2 h−1 under warming and removal of shrub (W-Sh), and −0.061 mg m−2 h−1 under warming and all vascular plants removal treatment (W-Sh-Se) (Figure 2). Generally, the individual treatments switched from a N2O sink to a N2O source, but only the effect of sedge removal treatment was significant (Table 2). We did not detect a significant effect of warming combined with different vegetation compositions on N2O fluxes. However, compared with the treatment of vascular plant removal (-Se-Sh), the combined treatment of warming and vascular plant removal (W-Sh-Se) significantly increased N2O consumption by five-fold. In addition, there was a significant difference between the treatments W-Se (0.042 ± 0.019 mg m−2 h−1) and W-Sh (−0.028 ± 0.016 mg m−2 h−1).
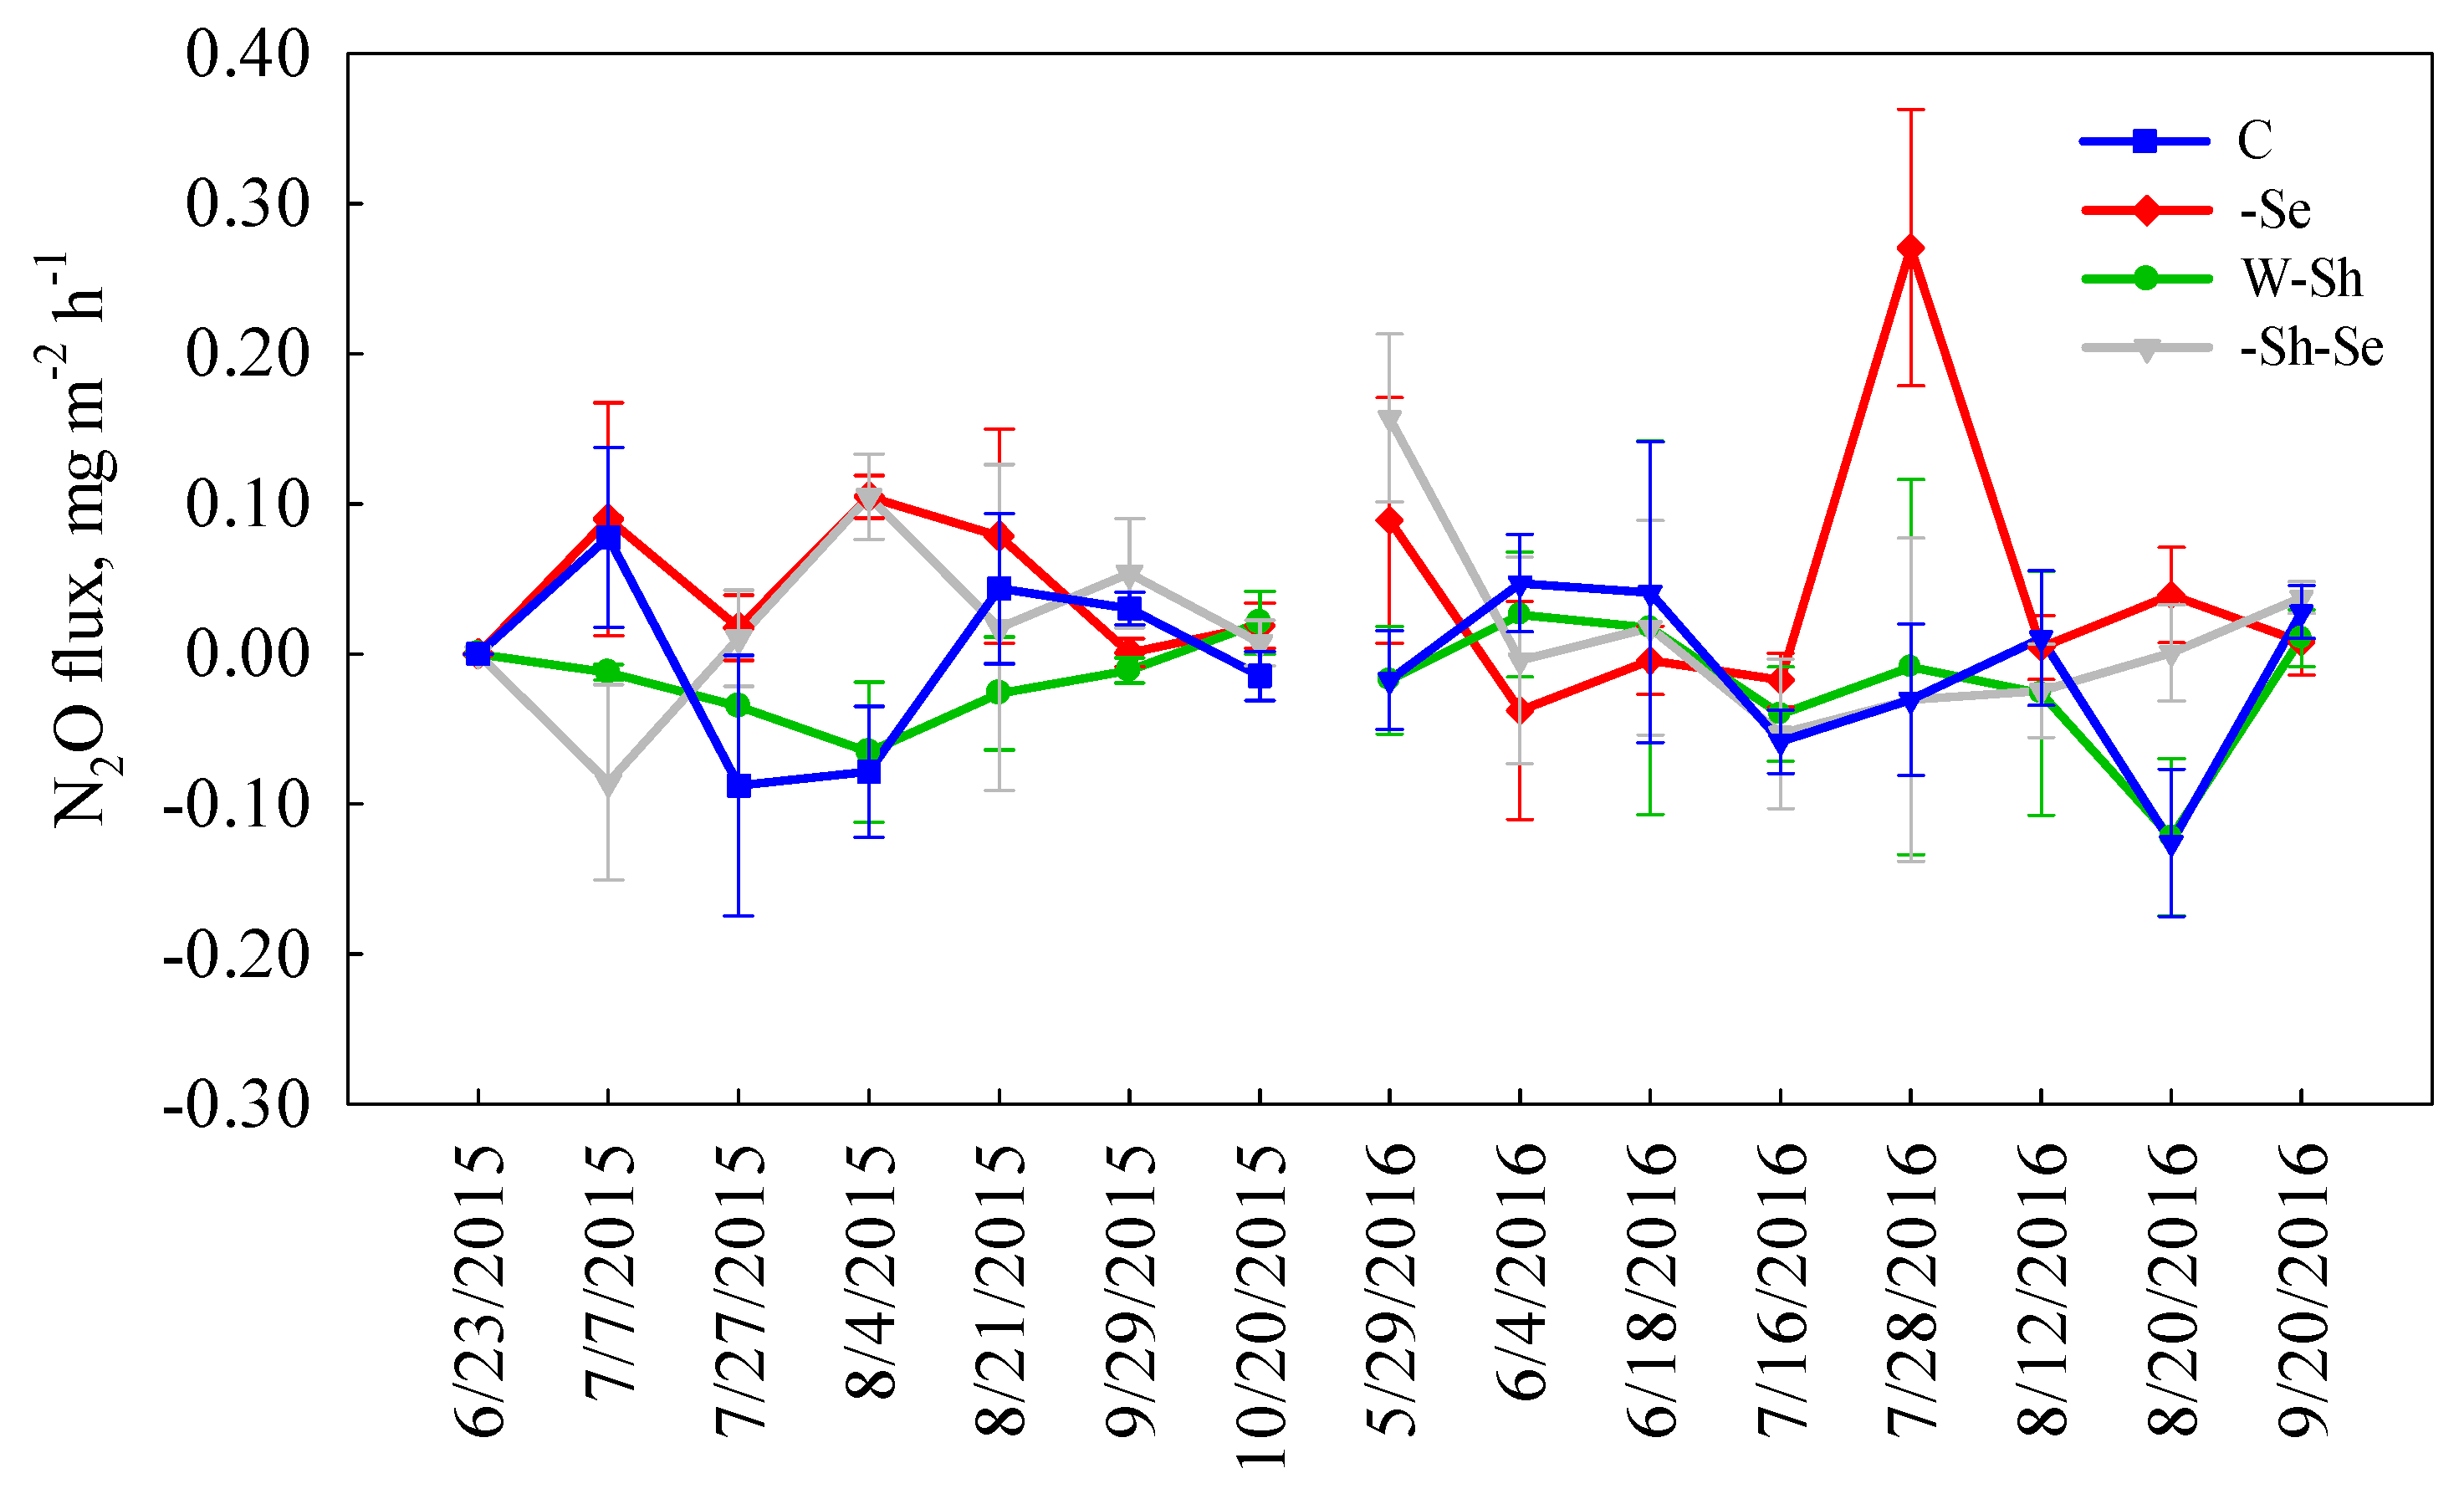
As shown in Table 2, not only the treatment of sedge removal had a significant effect on N2O emission, but also the treatments W-Sh or -Sh-Se showed significant seasonal variation of N2O fluxes. Figure 3 shows the seasonal variation of N2O fluxes under these four treatments (C, -Se, W-Sh, and -Sh-Se). The peaks of mean N2O fluxes for sedge removal treatment were on 4 August 2015 (0.105 ± 0.014 mg m−2 h−1), 29 May 2016 (0.089 ± 0.082 mg m−2 h−1), and 28 July 2016 (0.271 ± 0.092 mg m−2 h−1). The peaks of mean N2O flux for sedge and shrub removal treatment were on 4 August 2015 (0.105 ± 0.029 mg m−2 h−1) and 29 May 2016 (0.157 ± 0.056 mg m−2 h−1).

3.3. Cumulative N2O Fluxes

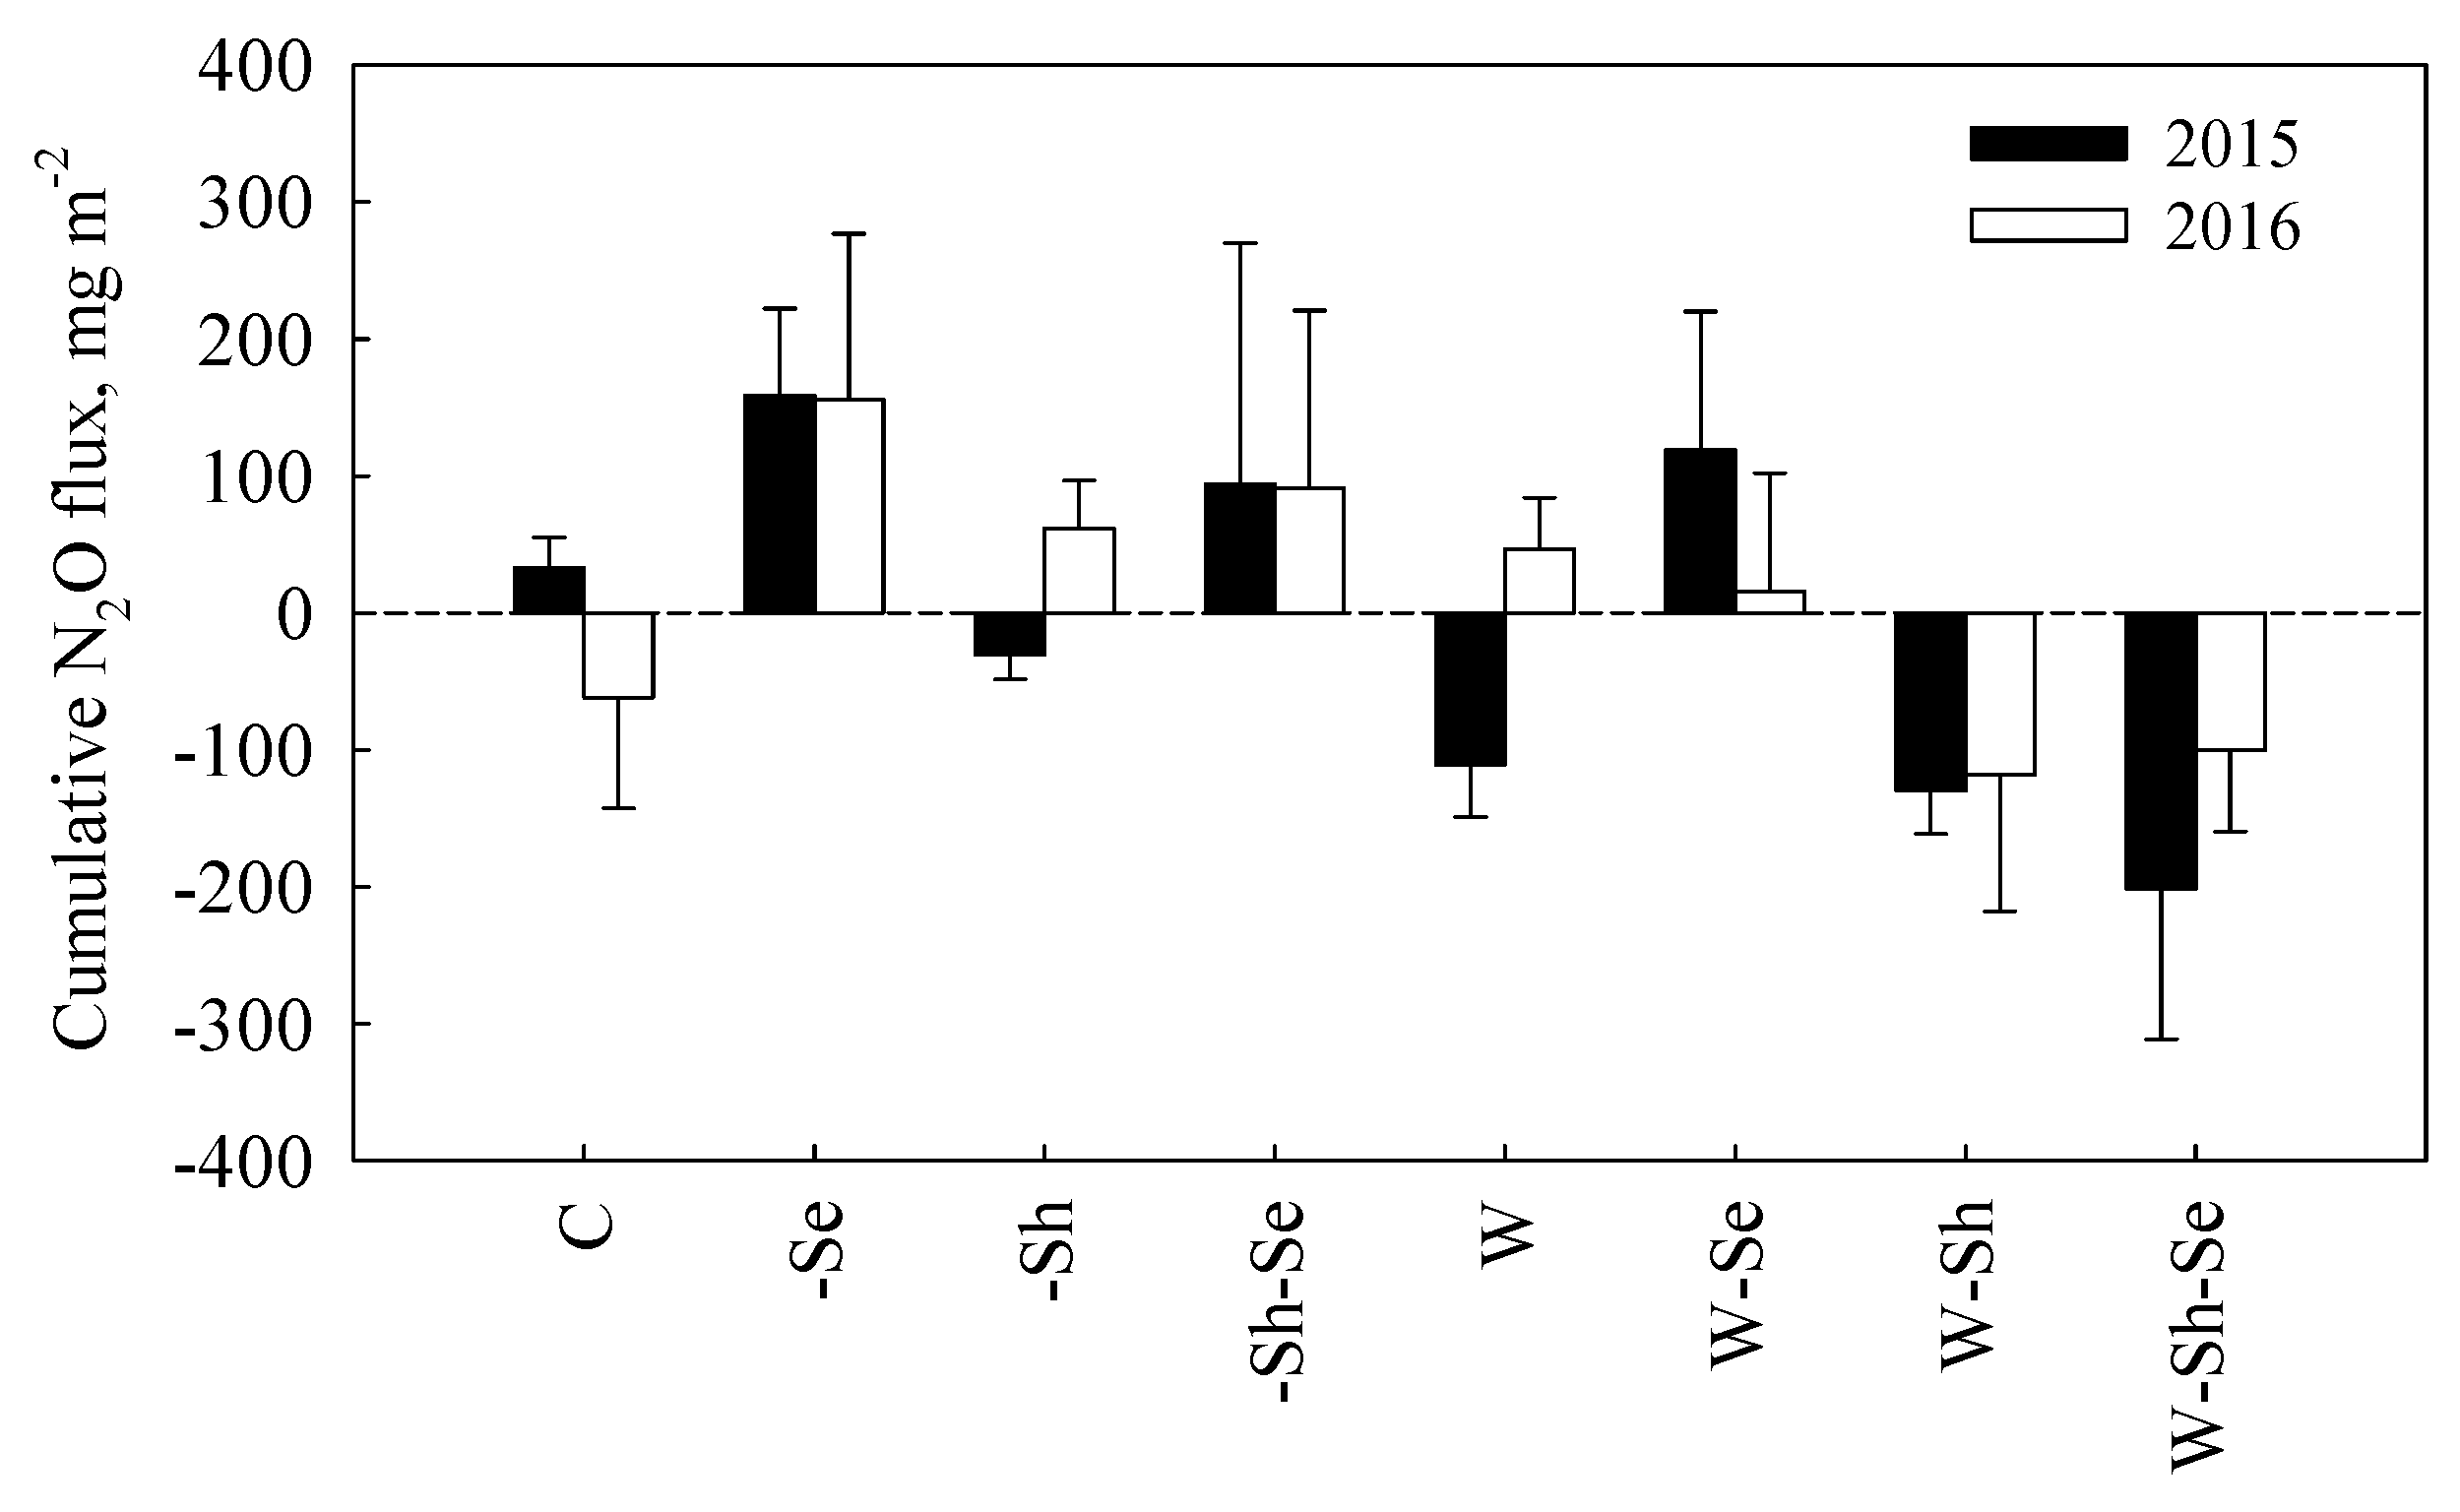
As shown in Figure 4, the cumulative N2O fluxes ranged from −201.61 ± 109.56 mg m−2 to 158.52 ± 63.78 mg m−2 in the 2015 growing season, and from −118.43 ± 99.60 mg m−2 to 155.77 ± 120.98 mg m−2 in the 2016 growing season. In 2015, compared with the control treatment, the mean cumulative N2O flux increased by ~3.8 times under the sedge removal treatment (-Se), by ~1.8 times under the sedge and shrub removal treatment (-Se-Sh), and by ~2.6 times under the warming and removal of sedge treatment (W-Se). Cumulative N2O fluxes decreased by ~1.9 times under the shrub removal treatment (-Sh), by ~4.4 times under the warming treatment (W), by ~4.9 times under the warming and removal of shrub treatment (W-Sh), and by ~7.1 times under warming and removal of sedge and shrub treatment (W-Se-Sh). In 2016, control had a small N2O sink, and treatments of W-Sh and W-Sh-Se enhanced the sink by ~0.9 and ~0.6 times, respectively. However, W, -Se, -Sh, -Sh-Se, and W-Se all switched the system from a small sink to a moderate source. However, no evidence of a significant effect of all treatments on cumulative N2O flux was detected during the two growing seasons.

3.4. Relationship between N2O Fluxes and Abiotic Parameters

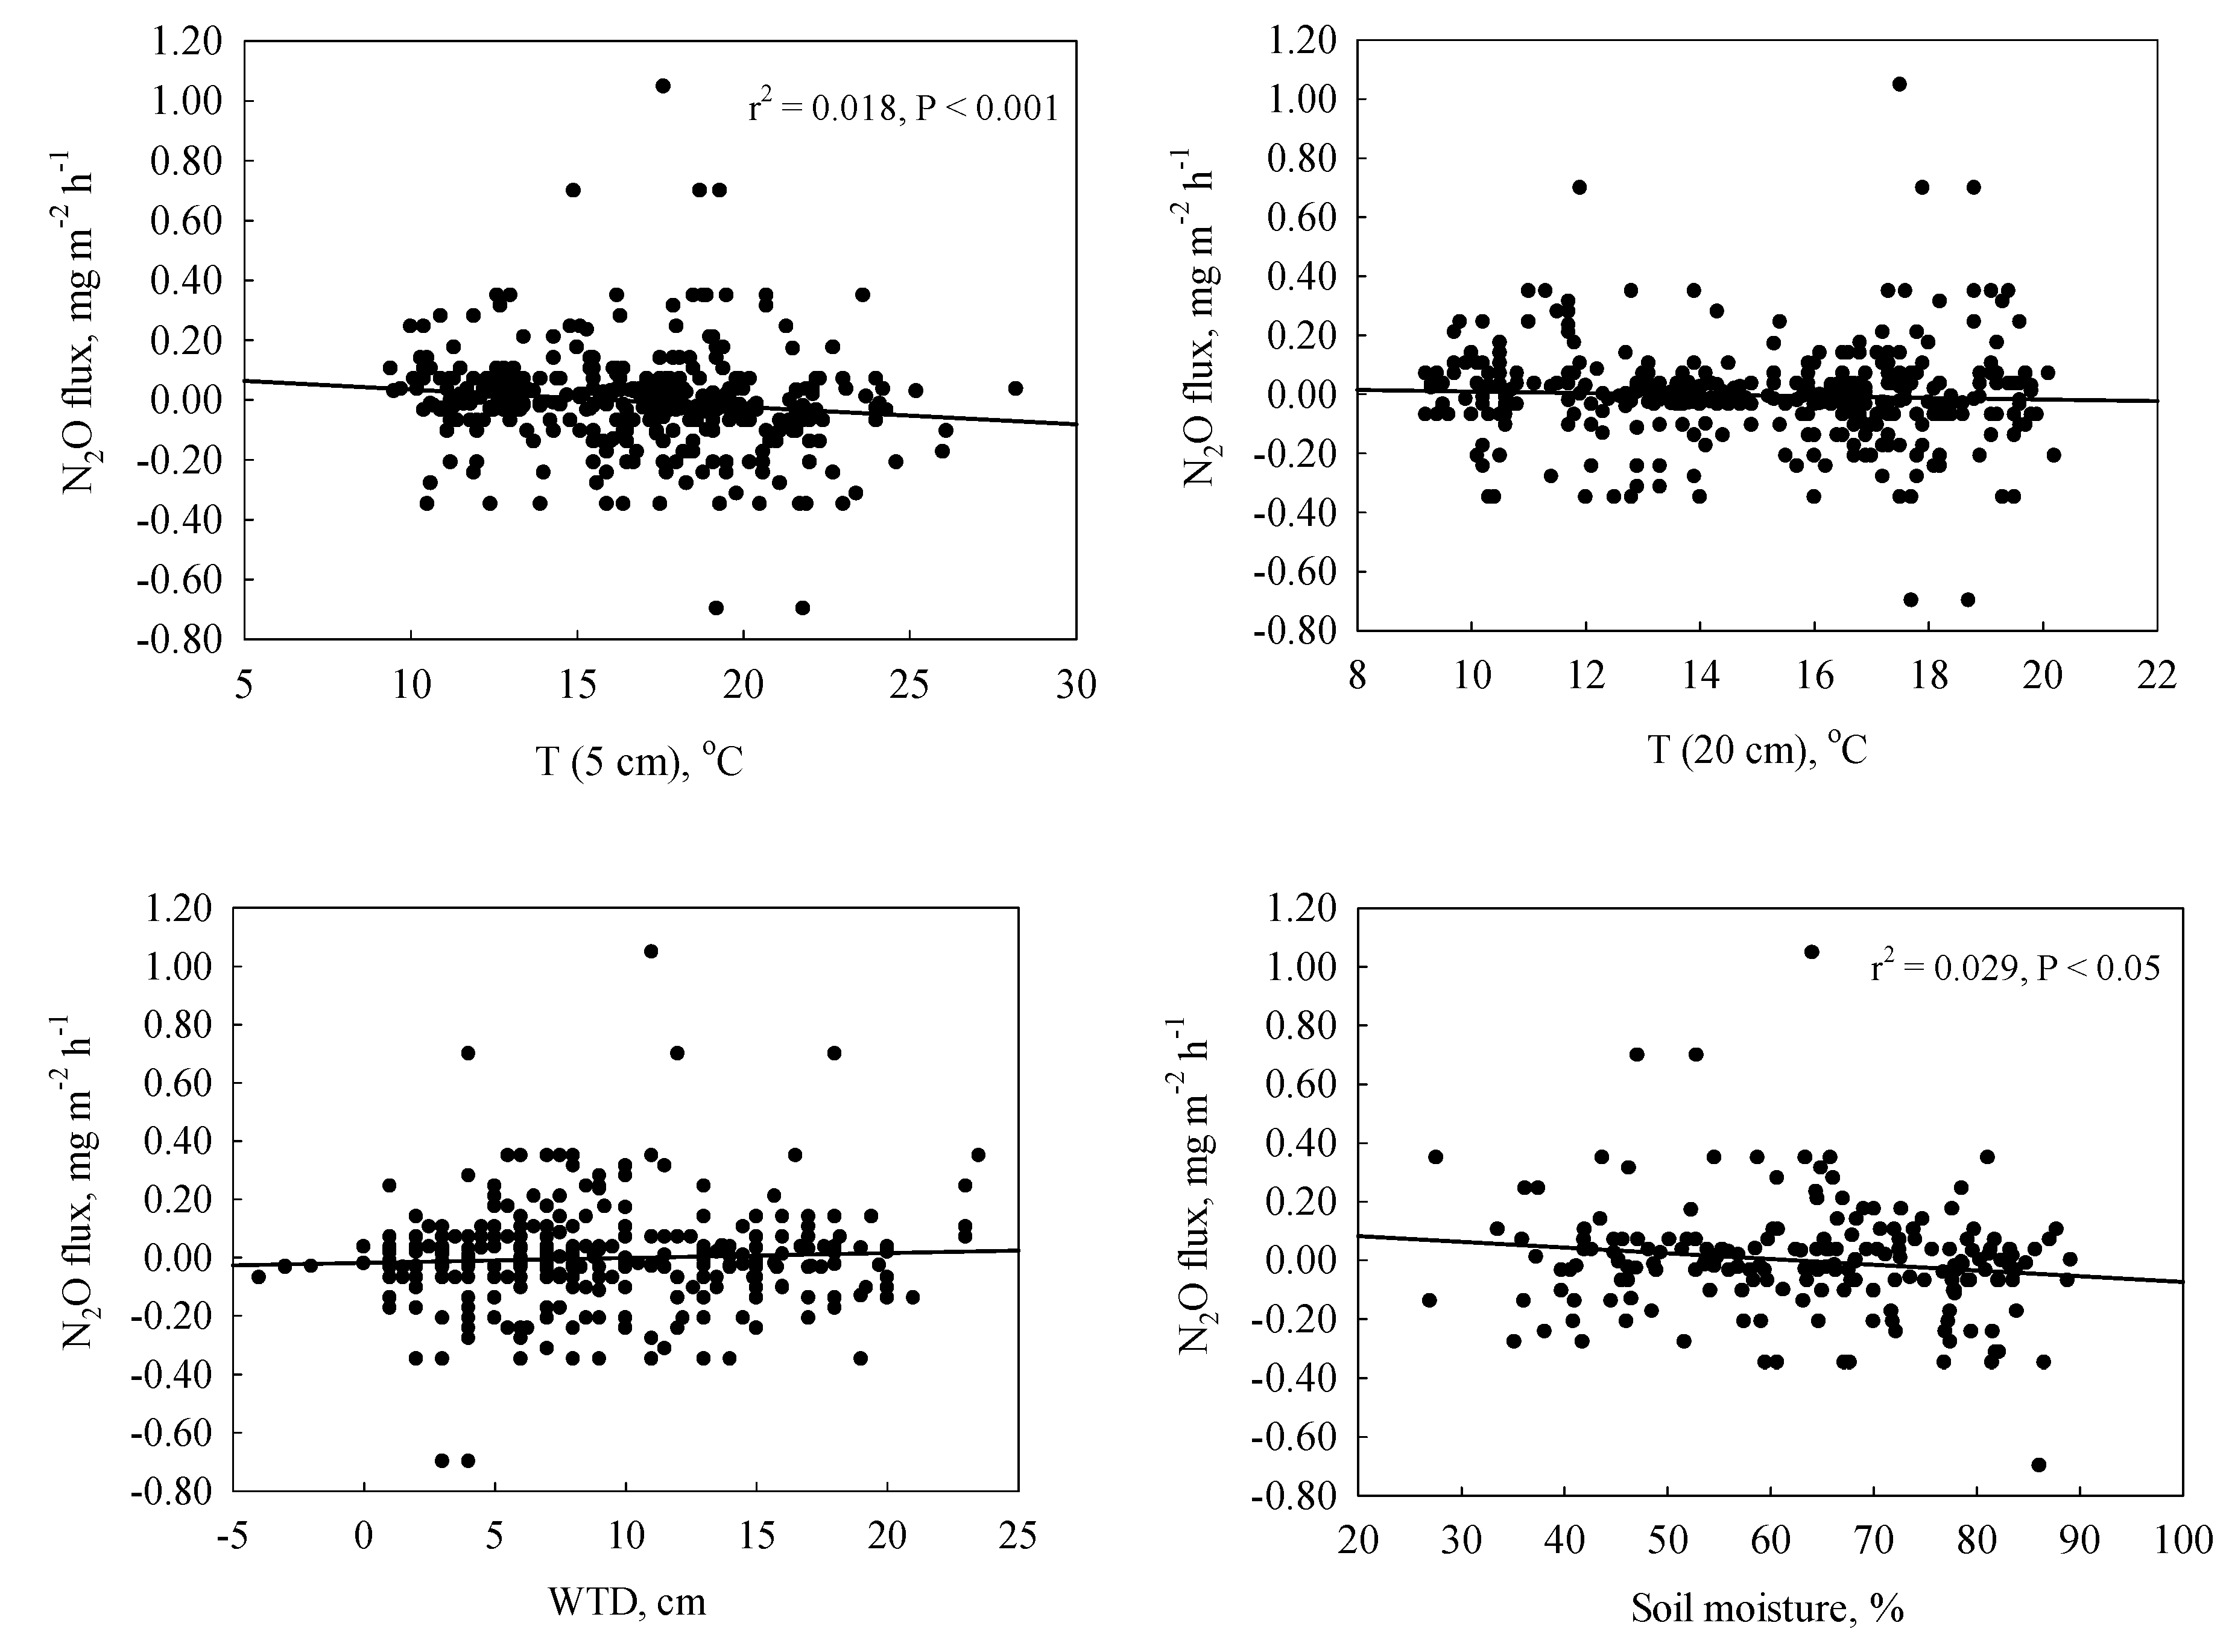
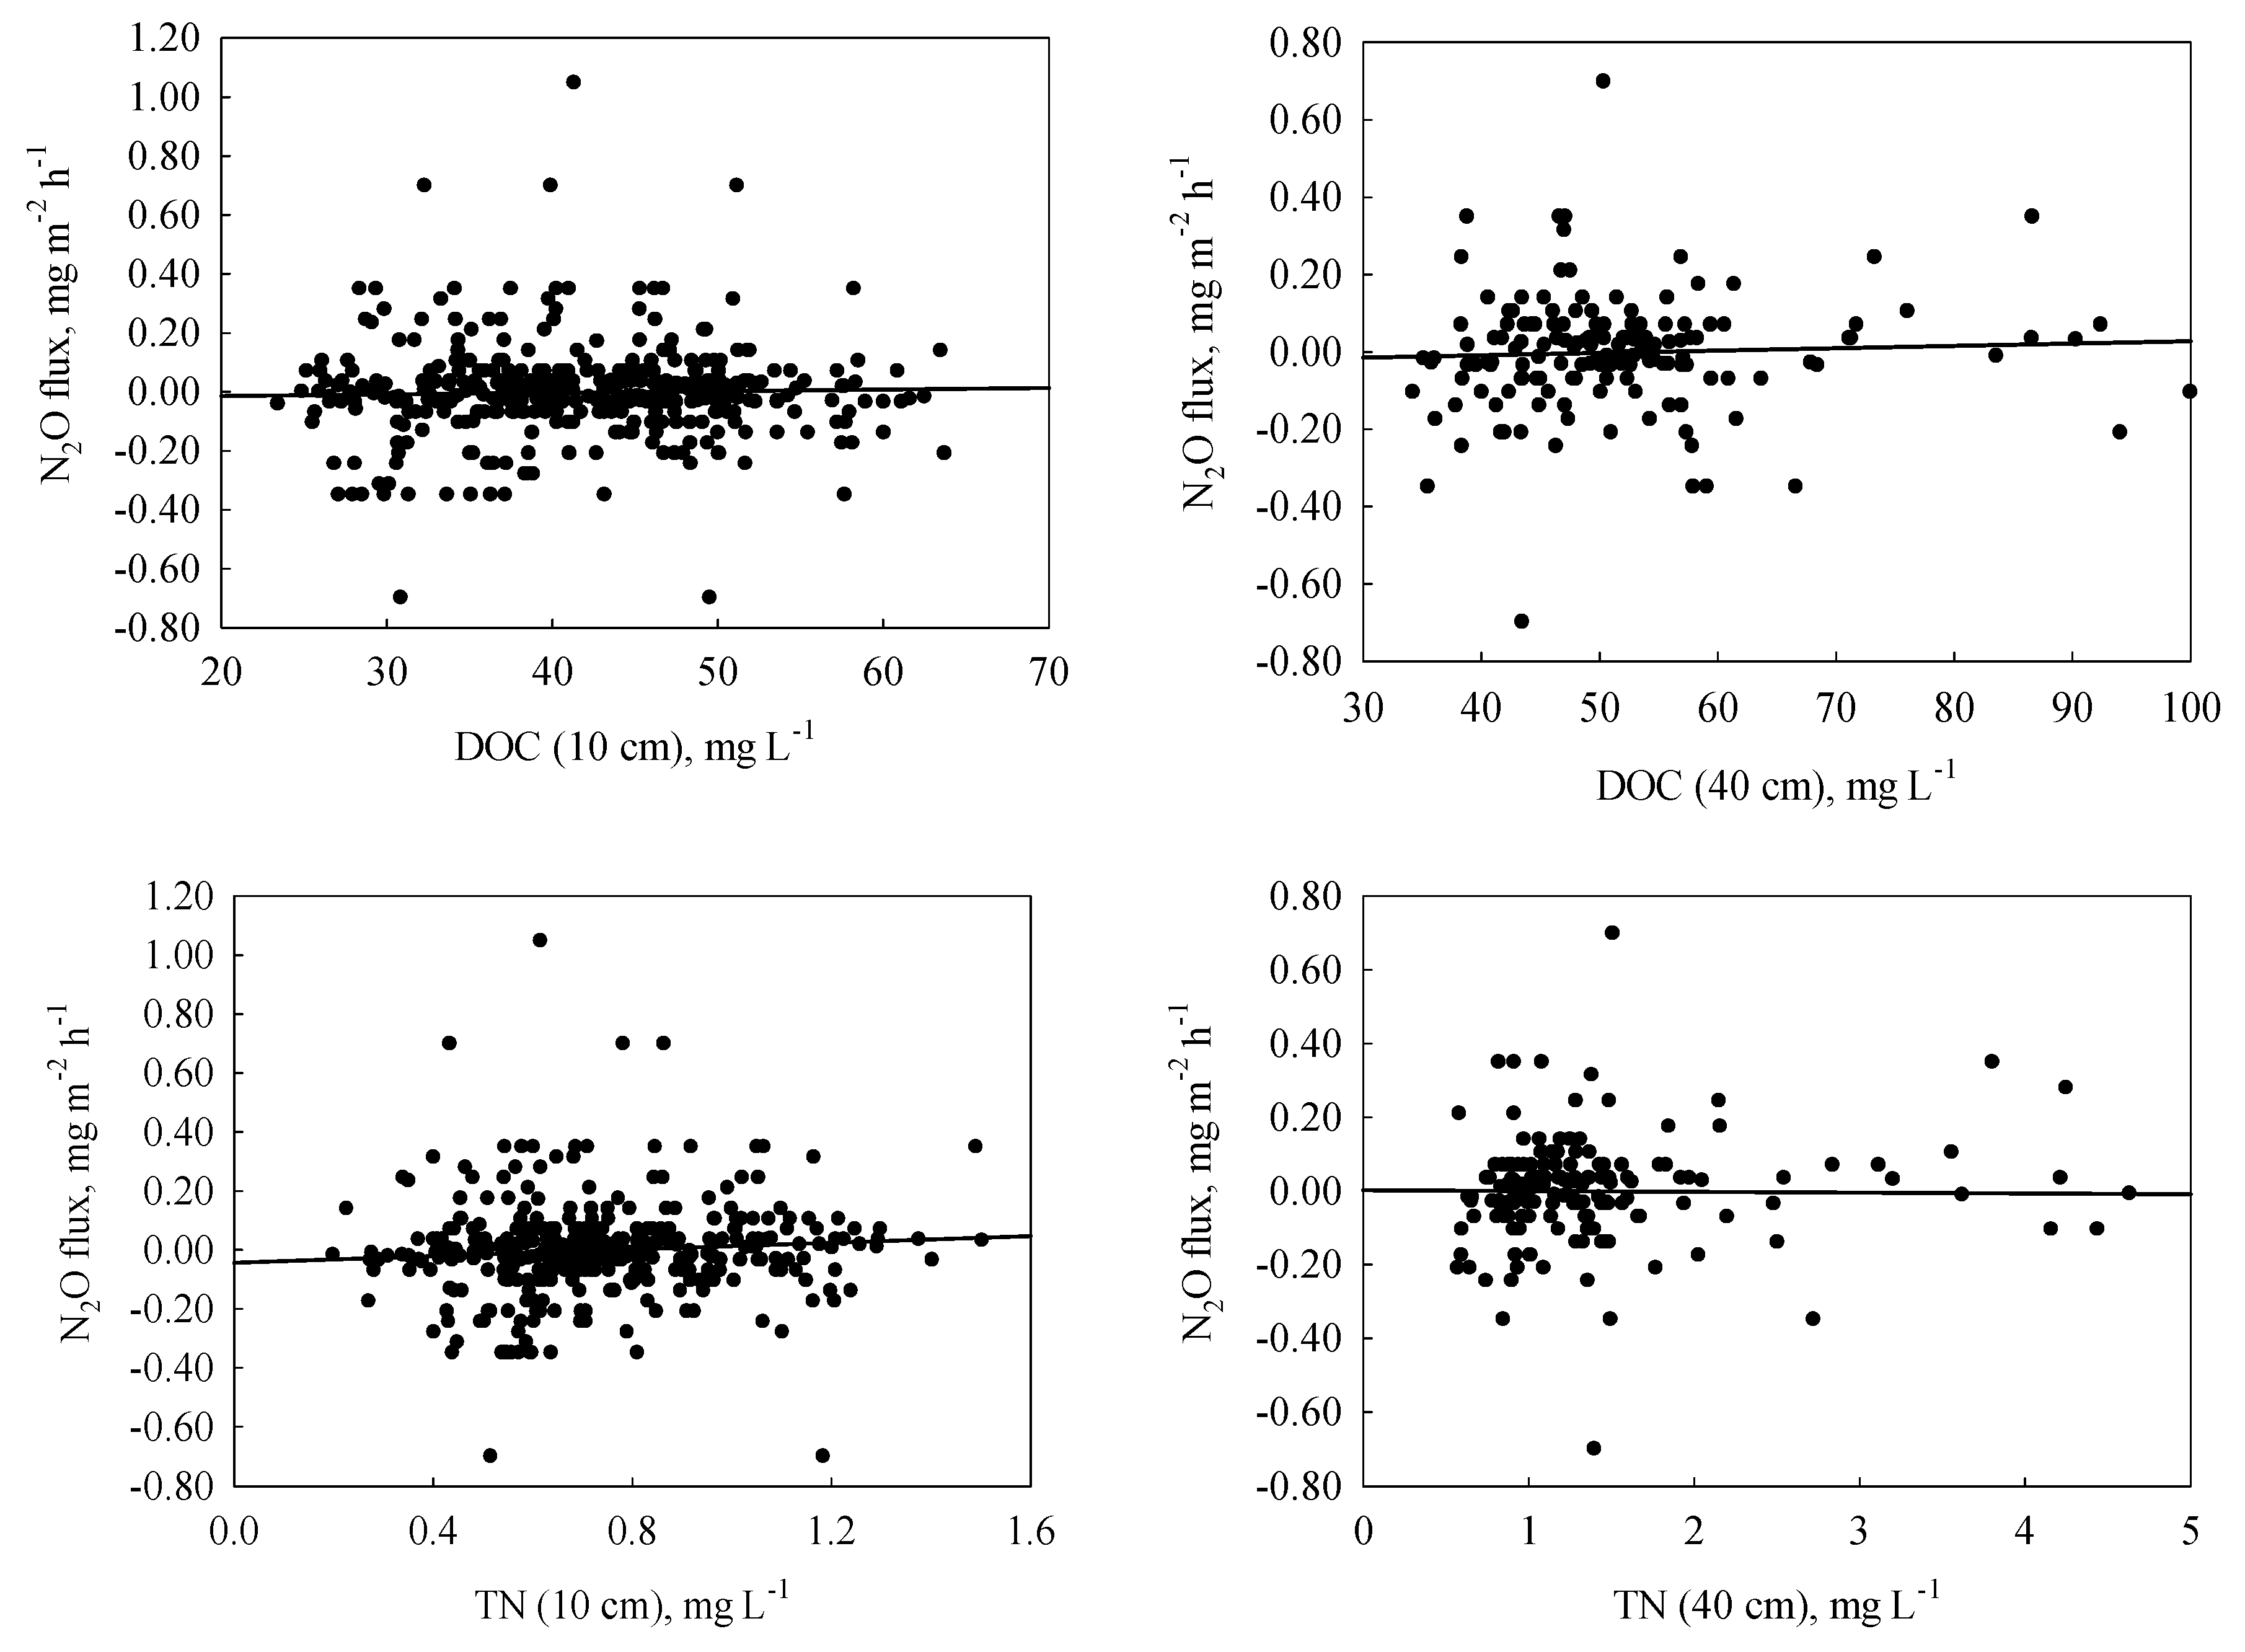
During both growing seasons, N2O fluxes exhibited a negative linear relationship with soil temperature at 0.05 m and soil moisture (Figure 5). However, they only explained 4.7% of N2O variation. We did not find significant correlations between N2O and other environmental factors, including soil temperature at a 0.2 m depth, water table depth, soil moisture, DOC, and TN at 0.1 m and 0.4 m depths.
Although there were no considerable differences in N2O fluxes between the years, the relationships between N2O flux and environmental parameters varied between years and between treatments (Table 3). In the control treatment, significant correlations were observed between N2O flux and water table depth in 2015, and between N2O flux and total nitrogen at a 0.4 m depth in 2016. A significant correlation between N2O flux and soil temperature at a 0.2 m depth was observed under sedge removal treatment in 2016. Although there were no correlations between N2O flux and environmental parameters under warming, significant correlations were observed under the combined treatments of warming and vegetation composition. Under warming and sedge removal, the N2O flux was significantly related to soil T at a 0.2 m depth in 2015, and water table depth and total N at a 0.4 m depth in 2016. Under the combined treatment of warming and shrub removal, the relationship between N2O fluxes and total N at a 0.1 m depth was only significant in 2015. Under the combined treatment of warming and removal of all vascular plants, a significant relationship was observed between N2O fluxes and WTD in 2015, and between N2O fluxes and soil T at 0.05 m and 0.2 m depths, and DOC at a 0.4 m depth in 2016.

4. Discussion

4.1. N2O Fluxes

Our study confirms that N2O emissions from peatlands are low [10,13,23,24]. The average N2O fluxes varied between treatments and ranged from −0.061 to 0.050 mg m−2 h−1, which is similar to the fluxes in a boreal fen (from −0.045 to 0.037 mg m−2 h−1) [13] and a permafrost peatland (from 0.004 to 0.050 mg m−2 h−1) [12], and is within the range of N2O fluxes in an ombrotrophic bog (from −1 to 7 mg m−2 h−1) [10]. However, the N2O flux is slightly lower than in a drainage peatland (0.079 mg m−2 h−1) [24]. This can be attributed to high N availability in the drainage peatland. In addition, compared with N2O flux from an ombrotrophic bog in 1996 (0.002 mg m−2 h−1) [25], our result is significantly greater. This is probably because of relatively high N deposition in recent years, which increases N availability for N2O production [26].
The average cumulative N2O flux was 30.38 mg m−2 per growing season in our study, which is higher than that in a permafrost peatland (from 5 to 25 mg m−2 yr−1) [12]. The possible reason for this is that the mean annual temperature in the permafrost peatland (−3.9 °C) is much lower than at our study site (5 °C), which decreases the microbial activity. A boreal fen reveals a significantly higher average cumulative N2O flux (366 mg m−2 yr−1) [13] than that in our study, as environmental conditions in the boreal fen, such as rich nutrients [27], a low water table [13] and special dominant vegetation [7], are favorable for N2O production.

4.2. The Effects of Treatments on N2O Fluxes

There was a significant effect of vegetation composition treatments on N2O fluxes. The removal of sedge significantly increased N2O release. This result supports our first hypothesis and is in agreement with previous studies, showing that sedge was an effective competitor for nitrogen and lowered N availability for N2O production [7,28]. This is supported by a moderate variation of N2O fluxes, as shown in Figure 3. A significant difference between the control treatment and sedge removal was observed every year at the middle growing season (end of July and early of August). At that time, the vegetation demands more nutrients compared with the early and late growing season, which stimulates the competition with microorganisms. Accordingly, under sedge removal treatment, there was a relatively high N2O emission by increasing N availability [7,28]. However, we found no effect of shrub removal on N2O fluxes. This can be attributed to the alteration of soil microbial community and decomposition rate. Previous studies have reported that the structure of the soil microbial community in an ombrotrophic peatland was significantly impacted by shrub removal [10,29]. They also demonstrated that litter decomposition was lower when shrub was removed, compared with sedge removal. This suggests that there is a higher labile carbon supply after sedge removal [27], which may stimulate the microbial activity for N2O production.
During both growing seasons, warming did not significantly impact N2O fluxes in the boreal peatland. This is in line with previous studies, which reported that the effects of water table level and N availability predominated the temperature response [10,13]. Nevertheless, this result is inconsistent with the studies on permafrost and mountain peatlands [12,30], attributing the positive effect of warming on N2O fluxes to the soil temperature, water table depth, microbial abundance, and activity. However, we did not find a significant difference in soil temperature between warming and control treatments due to the short-term warming in our study, potentially causing the absence of a warming effect on N2O fluxes. In addition, the lack of a significant response of soil to the warming treatment could be attributed to the fact that it is covered with an insulating layer of moss.
Although there were no significant interactive effects of warming and different vegetation composition treatments, we found that the combined treatment of warming and removal of all vascular plants (W-Sh-Se) remarkably increased N2O consumption compared with the treatment of vascular plants removal only (-Sh-Se). This disproves our second hypothesis that warming stimulated N2O emission under the treatments of vascular plant removal and can be attributed to soil moisture reduction. As a result of soil moisture reduction, N2O easily enters into the anaerobic zone and is consumed by denitrification [31]. However, we did not find a significant relationship between soil moisture and N2O fluxes under the combination of warming and vascular plant removal (W-Sh-Se). Our results imply that warming stimulates N2O consumption under vascular plant removal not by reducing soil moisture, but by increasing soil temperature [17]. This was supported by the significant negative relationship between N2O fluxes and soil T under the treatment of W-Sh-Se, as shown in Table 3.
From the perspective of cumulative N2O fluxes, although N2O emissions significantly increased under the sedge removal treatment, the cumulative N2O flux was not significantly impacted, which indicates that the contribution of N2O to the cooling function of peatlands is negligible on a short time scale under climate change. Furthermore, there was a trend that combinative treatments of warming and sedge/shrub removal enhanced N2O consumption, which implies that boreal peatlands have the potential to be N2O sinks under climate change. Accordingly, the positive feedback of peatlands to the climate warming may be modulated by changing vegetation composition. This is in line with a previous study, which reported that the effects of warming on GHG emissions can be alleviated by vegetation composition [10].

4.3. Abiotic Controls on N2O Fluxes

During the two growing seasons, we found a significant relationship between N2O flux and soil temperature at a 0.05 m depth and soil moisture at a 0.05 m depth, indicating that the important processes controlling the N2O fluxes take place at the surface layer of the peat. This is consistent with other studies in boreal peatlands, which have shown that the most important layer for N2O production or consumption is the topmost soil layer [13,24,32].
Environmental controls on N2O fluxes in this boreal peatland varied between the treatments, which proves our third hypothesis. Important controls for N2O fluxes were water table depth and total nitrogen in 2015 and 2016, respectively. There were no significant relationships between N2O fluxes and environmental variables under individual treatments in both years, except for a positive relationship between N2O fluxes and soil T at a 0.2 m depth under sedge removal in 2016. This can be attributed to decreased competition between plants and microbes under sedge removal, and a stimulated denitrification process when soil T at a 0.2 m depth increases. The same relationship between N2O fluxes and soil temperature was found in 2015 under the interactive treatment of warming and sedge removal. The positive relationship between N2O flux and TN at a 0.4 m depth was observed under warming and sedge removal, indicating that increased N availability can stimulate N2O emissions [7]. A significant correlation between N2O flux and TN at a 0.1 m depth was observed under warming and shrub removal, which implies that shrub and sedge affect N2O fluxes at different depths. This is supported by the fact that sedge has relatively deep roots [33], and shrub and sedge have a different effect on the structure of microorganisms [10]. The labile C excreted from roots is reduced under all vascular plant removal treatment, thus decreasing N2O production [27,34]. Accordingly, a significant positive relationship between N2O and DOC at 0.4 m was observed. Furthermore, the main controls on N2O fluxes only explained small parts of N2O variation (~20%) under individual treatments, while water table depth and TN explained 46.6% of N2O variation under the combined treatment of warming and sedge removal. Soil temperature and DOC explained 58% of N2O variation under the combined treatment of warming and removal of all vascular plants. This suggests that environmental variables will become increasingly important for N2O emissions from boreal peatlands under climate change. Caution needs to be made here, however, as our results indicate that the abiotic controls on N2O flux vary with different treatments, and the correlation between N2O flux and the abiotic variables is not consistent with all the treatment. This suggests that more studies are needed to examine the mechanism and controls on N2O flux under changes in vegetation composition due to climate change.
The other important control on N2O flux may be the oxygen availability [16,17]. Oxygen can be supplied to sedge root, which can extend further below the water table in the anoxic zone, via aerenchymatous tissues. With the presence of sedges, the availability of oxygen at the sedge root zone can inhibit denitrification and thus prevent N2O production [16,17]. N2O production is much greater via denitrification under anoxic conditions, although N2O can be produced via nitrification under oxic conditions. Therefore, removing sedges removes the supply of oxygen via the aerenchyma. This would stimulate denitrification and thus increase N2O emission (Figure 3 and Figure 4), provided there is available N. However, ericaceous vegetation, such as shrubs, lacks aerenchymatous tissues, and thus it may not be surprising that shrub removal had no effect on N2O emissions (Figure 3 and Figure 4).

5. Conclusions

In this study, we conducted a warming and vegetation composition experiment in a boreal peatland over two growing seasons. We found that sedge removal treatment had a significant effect on N2O flux by reducing nutrient competition with microbes. However, no significant effects of all treatments on cumulative N2O fluxes were observed in our study. In addition, environmental controls on N2O fluxes varied among the different treatments. The environmental parameters explained a larger part of N2O variation under the combined treatments (warming and sedge removal treatment, and warming and all vegetation removal treatment) compared with individual treatments of warming and different vegetation compositions. In the present study, soil temperature only explained ~20% of N2O variation under the treatment of sedge removal, while soil temperature and DOC explained more than half of N2O variation (58%) under the combined treatment of warming and removal of all vascular plants. Although the effect on cumulative N2O fluxes is negligible in the short-term under climate change, the environmental controls on N2O emission from boreal peatlands become increasingly important under the warmer condition and vegetation composition change.

Author Contributions

J.W. initiated and designed this experiment and supervised the study. J.W. provided the funding to carry out the study and comprehensively commented and edited the draft. Y.G. analyzed the data and wrote the first draft. J.V. and T.B.L. were involved in the discussion of the results and offered their comments on the draft and revision. T.Y. helped developing the analysis method for analyzing our soil water samples.

Funding

This research was funded by Natural Sciences and Engineering Research Council of Canada (NSERC)-Discovery Grarnt [016-04466], Canada Foundation for Innovation-John R. Evans Leaders Fund [30480], Research & Development Corporation (RDC, NL)-Leverage R&D [5404.1417.101], RDC-Ignite R&D [5404.1418.101], RDC-RCRI (Regional Collaborative Research Initiative) [5404.1645.101], Humber River Basin Research Initiative of NL, Vice-President Research Fund, and the Graduate Student Stipend funding from the Institute for Biodiversity, Ecosystem Sciences and Sustainability (IBES, NL). The APC was funded by Humber River Basin Research Initiative of NL.

Acknowledgments

This study was made possible by the support of the following funding to J. Wu: Natural Sciences and Engineering Research Council of Canada (NSERC)-Discovery Grant, Canada Foundation for Innovation-John R. Evans Leaders Fund, Research & Development Corporation (RDC, NL)-Leverage R&D, RDC-Ignite R&D, RDC-RCRI (Regional Collaborative Research Initiative), Humber River Basin Research Initiative of NL, Vice-President Research Fund, and the Graduate Student Stipend funding from the Institute for Biodiversity, Ecosystem Science, and Sustainability (IBES, NL). Y. Gong, J. Vogt, and T. Le all received a Graduate Student Baseline Fellowship from School of Graduate Studies, Memorial University. The comments from two anonymous reviewers and the editor significantly improved our manuscript.

Conflicts of Interest

The authors declare no conflict of interest.

References

  1. Tremblay, S.L.; D’Orangeville, L.; Lambert, M.C.; Houle, D. Transplanting boreal soils to a warmer region increases soil heterotrophic respiration as well as its temperature sensitivity. Soil Biol. Biochem. 2018, 116, 203–212. [Google Scholar] [CrossRef]
  2. Laine, A.M.; Mehtätalo, L.; Tolvanen, A.; Frolking, S.; Tuittila, E.S. Impacts of drainage, restoration and warming on boreal wetland greenhouse gas fluxes. Sci. Total Environ. 2019, 647, 169–181. [Google Scholar] [CrossRef]
  3. De Deyn, G.B.; Cornelissen, J.H.; Bardgett, R.D. Plant functional traits and soil carbon sequestration in contrasting biomes. Ecol. Lett. 2008, 11, 516–531. [Google Scholar] [CrossRef] [Green Version]
  4. Bridgham, S.D.; Cadillo-Quiroz, H.; Keller, J.K.; Zhuang, Q. Methane emissions from wetlands: Biogeochemical, microbial, and modeling perspectives from local to global scales. Glob. Chang. Biol. 2013, 19, 1325–1346. [Google Scholar] [CrossRef]
  5. Nielsen, C.S.; Michelsen, A.; Strobel, B.W.; Wulff, K.; Banyasz, I.; Elberling, B. Correlations between substrate availability, dissolved CH4, and CH4 emissions in an Arctic wetland subject to warming and plant removal. J. Geophys. Res. Biogeosci. 2017, 122, 645–660. [Google Scholar] [CrossRef]
  6. Tian, K.; Kong, X.; Gao, J.; Jia, Y.; Lin, H.; He, Z.; Ji, Y.; Bei, Z.; Tian, X. Local root status: A neglected bio-factor that regulates the home-field advantage of leaf litter decomposition. Plant Soil 2018, 431, 175–189. [Google Scholar] [CrossRef]
  7. Brummell, M.E.; Lazcano, C.; Strack, M. The effects of eriophorum vaginatum on N2O fluxes at a restored, extracted peatland. Ecol. Eng. 2017, 106, 287–295. [Google Scholar] [CrossRef]
  8. Hartley, I.P.; Garnett, M.H.; Sommerkorn, M.; Hopkins, D.W.; Fletcher, B.J.; Sloan, V.L.; Phoenix, G.K.; Wookey, P.A. A potential loss of carbon associated with greater plant growth in the european Arctic. Nat. Clim. Chang. 2012, 2, 875–879. [Google Scholar] [CrossRef]
  9. Gavazov, K.; Albrecht, R.; Buttler, A.; Dorrepaal, E.; Garnett, M.H.; Gogo, S.; Hagedorn, F.; Mills, R.T.E.; Robroek, B.J.M.; Bragazza, L. Vascular plant-mediated controls on atmospheric carbon assimilation and peat carbon decomposition under climate change. Glob. Chang. Biol. 2018, 00, 1–11. [Google Scholar] [CrossRef]
  10. Ward, S.E.; Ostle, N.J.; Oakley, S.; Quirk, H.; Henrys, P.A.; Bardgett, R.D. Warming effects on greenhouse gas fluxes in peatlands are modulated by vegetation composition. Ecol. Lett. 2013, 16, 1285–1293. [Google Scholar] [CrossRef]
  11. Pearson, T.P.; Harjunpää, L.; Laiho, R.; Laine, J.; Sarjala, T.; Silvan, K.; Silvan, N. Effects of temperature rise and water-table-level drawdown on greenhouse gas fluxes of boreal sedge fens. Boreal Environ. Res. 2015, 20, 489–505. [Google Scholar]
  12. Cui, Q.; Song, C.; Wang, X.; Shi, F.; Yu, X.; Tan, W. Effects of warming on N2O fluxes in a boreal peatland of permafrost region, northeast China. Sci. Total Environ. 2018, 616–617, 427–434. [Google Scholar] [CrossRef] [PubMed]
  13. Lohila, A.; Aurela, M.; Hatakka, J.; Pihlatie, M.; Minkkinen, K.; Penttilä, T.; Laurila, T. Responses of N2O fluxes to temperature, water table and N deposition in a northern boreal fen. Eur. J. Soil Sci. 2010, 61, 651–661. [Google Scholar] [CrossRef]
  14. Wang, H.; Yu, L.; Zhang, Z.; Liu, W.; Chen, L.; Cao, G.; Yue, H.; Zhou, J.; Yang, Y.; Tang, Y.; et al. Molecular mechanisms of water table lowering and nitrogen deposition in affecting greenhouse gas emissions from a tibetan alpine wetland. Glob. Chang. Biol. 2017, 23, 815–829. [Google Scholar] [CrossRef] [PubMed]
  15. Cui, Q.; Song, C.; Wang, X.; Shi, F.; Wang, L.; Guo, Y. Rapid N2O fluxes at high level of nitrate nitrogen addition during freeze-thaw events in boreal peatlands of northeast China. Atmos. Environ. 2016, 135, 1–8. [Google Scholar] [CrossRef]
  16. Jørgensen, C.J.; Struwe, S.; Elberling, B. Temporal trends in N2O flux dynamics in a danish wetland—Effects of plant-mediated gas transport of N2O and O2 following changes in water level and soil mineral-N availability. Glob. Chang. Biol. 2012, 18, 210–222. [Google Scholar] [CrossRef]
  17. Butterbach-Bahl, K.; Baggs, E.M.; Dannenmann, M.; Kiese, R.; Zechmeister-Boltenstern, S. Nitrous oxide emissions from soils: How well do we understand the processes and their controls? Philos. Trans. R. Soc. Lond. Ser. B Biol. Sci. 2013, 368, 20130122. [Google Scholar] [CrossRef]
  18. He, H.; Jansson, P.-E.; Svensson, M.; Meyer, A.; Klemedtsson, L.; Kasimir, Å. Factors controlling nitrous oxide emission from a spruce forest ecosystem on drained organic soil, derived using the coupmodel. Ecol. Model. 2016, 321, 46–63. [Google Scholar] [CrossRef] [Green Version]
  19. Luan, J.; Wu, J. Gross photosynthesis explains the ‘artificial bias’ of methane fluxes by static chamber (opaque versus transparent) at the hummocks in a boreal peatland. Environ. Res. Lett. 2014, 9, 105005. [Google Scholar] [CrossRef] [Green Version]
  20. Luan, J.; Wu, J. Long-term agricultural drainage stimulates CH4 emissions from ditches through increased substrate availability in a boreal peatland. Agric. Ecosyst. Environ. 2015, 214, 68–77. [Google Scholar] [CrossRef]
  21. Marion, G.M.; Henry, G.H.R.; Freckman, D.W.; Johnstone, J.; Jones, G.; Jones, M.H.; Levesque, E.; Molau, U.; Molgaard, P.; Parsons, A.N.; et al. Open-top designs for manipulating field temperature in high-latitude ecosystems. Glob. Chang. Biol. 1997, 3, 20–32. [Google Scholar] [CrossRef]
  22. Holland, E.A.; Robertson, G.P.; Greenberg, J.; Groffman, P.; Boone, R.D.; Gosz, J. Soil CO2, N2O, and CH4 exchange. In Standard Soil Methods for Long-Term Ecological Research; Robertson, G.P., Bledsoe, C.S., Coleman, D.C., Sollins, P., Eds.; Oxford University Press: New York, NY, USA, 1999; pp. 185–201. ISBN 0195120833. [Google Scholar]
  23. Drewer, J.; Lohila, A.; Aurela, M.; Laurila, T.; Minkkinen, K.; Penttilä, T.; Dinsmore, K.J.; McKenzie, R.M.; Helfter, C.; Flechard, C.; et al. Comparison of greenhouse gas fluxes and nitrogen budgets from an ombotrophic bog in scotland and a minerotrophic sedge fen in finland. Eur. J. Soil Sci. 2010, 61, 640–650. [Google Scholar] [CrossRef]
  24. Regina, K.; Maljanen, H.N.; Silvola, M.; Martikainen, J. Emissions of N2O and NO and net nitrogen mineralization in a boreal forested peatland treated with different nitrogen compounds. Can. J. For. Res. 1998, 28, 132–140. [Google Scholar] [CrossRef]
  25. Nykänen, H.V.; Huttunen, J.T.; Martikainen, P.J. Effect of experimental nitrogen load on methane and nitrous oxide fluxes on ombrotrophic boreal peatland. Plant Soil 2002, 242, 147–155. [Google Scholar] [CrossRef]
  26. Reay, D.S.; Dentener, F.; Smith, P.; Grace, J.; Feely, R.A. Global nitrogen deposition and carbon sinks. Nat. Geosci. 2008, 1, 430–437. [Google Scholar] [CrossRef]
  27. Liimatainen, M.; Voigt, C.; Martikainen, P.J.; Hytönen, J.; Regina, K.; Óskarsson, H.; Maljanen, M. Factors controlling nitrous oxide emissions from managed northern peat soils with low carbon to nitrogen ratio. Soil Biol. Biochem. 2018, 122, 186–195. [Google Scholar] [CrossRef]
  28. Silvan, N.; Tuittila, E.-S.; Kitunen, V.; Vasander, H.; Laine, J. Nitrate uptake by eriophorum vaginatum controls N2O production in a restored peatland. Soil Biol. Biochem. 2005, 37, 1519–1526. [Google Scholar] [CrossRef]
  29. Ward, S.E.; Ostle, N.J.; Briones, M.J.I.; Thomson, B.C. Vegetation exerts a greater control on litter decomposition than climate warming in peatlands. Ecology 2015, 96, 113–123. [Google Scholar] [CrossRef] [Green Version]
  30. Wang, X.; Siciliano, S.; Helgason, B.; Bedard-Haughn, A. Responses of a mountain peatland to increasing temperature: A microcosm study of greenhouse gas emissions and microbial community dynamics. Soil Biol. Biochem. 2017, 110, 22–33. [Google Scholar] [CrossRef]
  31. Zhou, Y.; Hagedorn, F.; Zhou, C.; Jiang, X.; Wang, X.; Li, M.H. Experimental warming of a mountain tundra increases soil CO2 effluxes and enhances CH4 and N2O uptake at Changbai mountain, China. Sci. Rep. 2016, 6, 21108. [Google Scholar] [CrossRef]
  32. Pihlatie, M.K.; Kiese, R.; Brüggemann, N.; Butterbach-Bahl, K.; Kieloaho, A.J.; Laurila, T.; Lohila, A.; Mammarella, I.; Minkkinen, K.; Penttilä, T.; et al. Greenhouse gas fluxes in a drained peatland forest during spring frost-thaw event. Biogeosciences 2010, 7, 1715–1727. [Google Scholar] [CrossRef] [Green Version]
  33. Greenup, A.L.; Bradford, M.A., McNamara; Lee, J.A. The role of eriophorum vaginatum in CH4 flux from an ombrotrophic peatland. Plant Soil 2000, 227, 265–272. [Google Scholar] [CrossRef]
  34. Dodla, S.K.; Wang, J.J.; DeLaune, R.D.; Cook, R.L. Denitrification potential and its relation to organic carbon quality in three coastal wetland soils. Sci. Total Environ. 2008, 407, 471–480. [Google Scholar] [CrossRef] [PubMed]
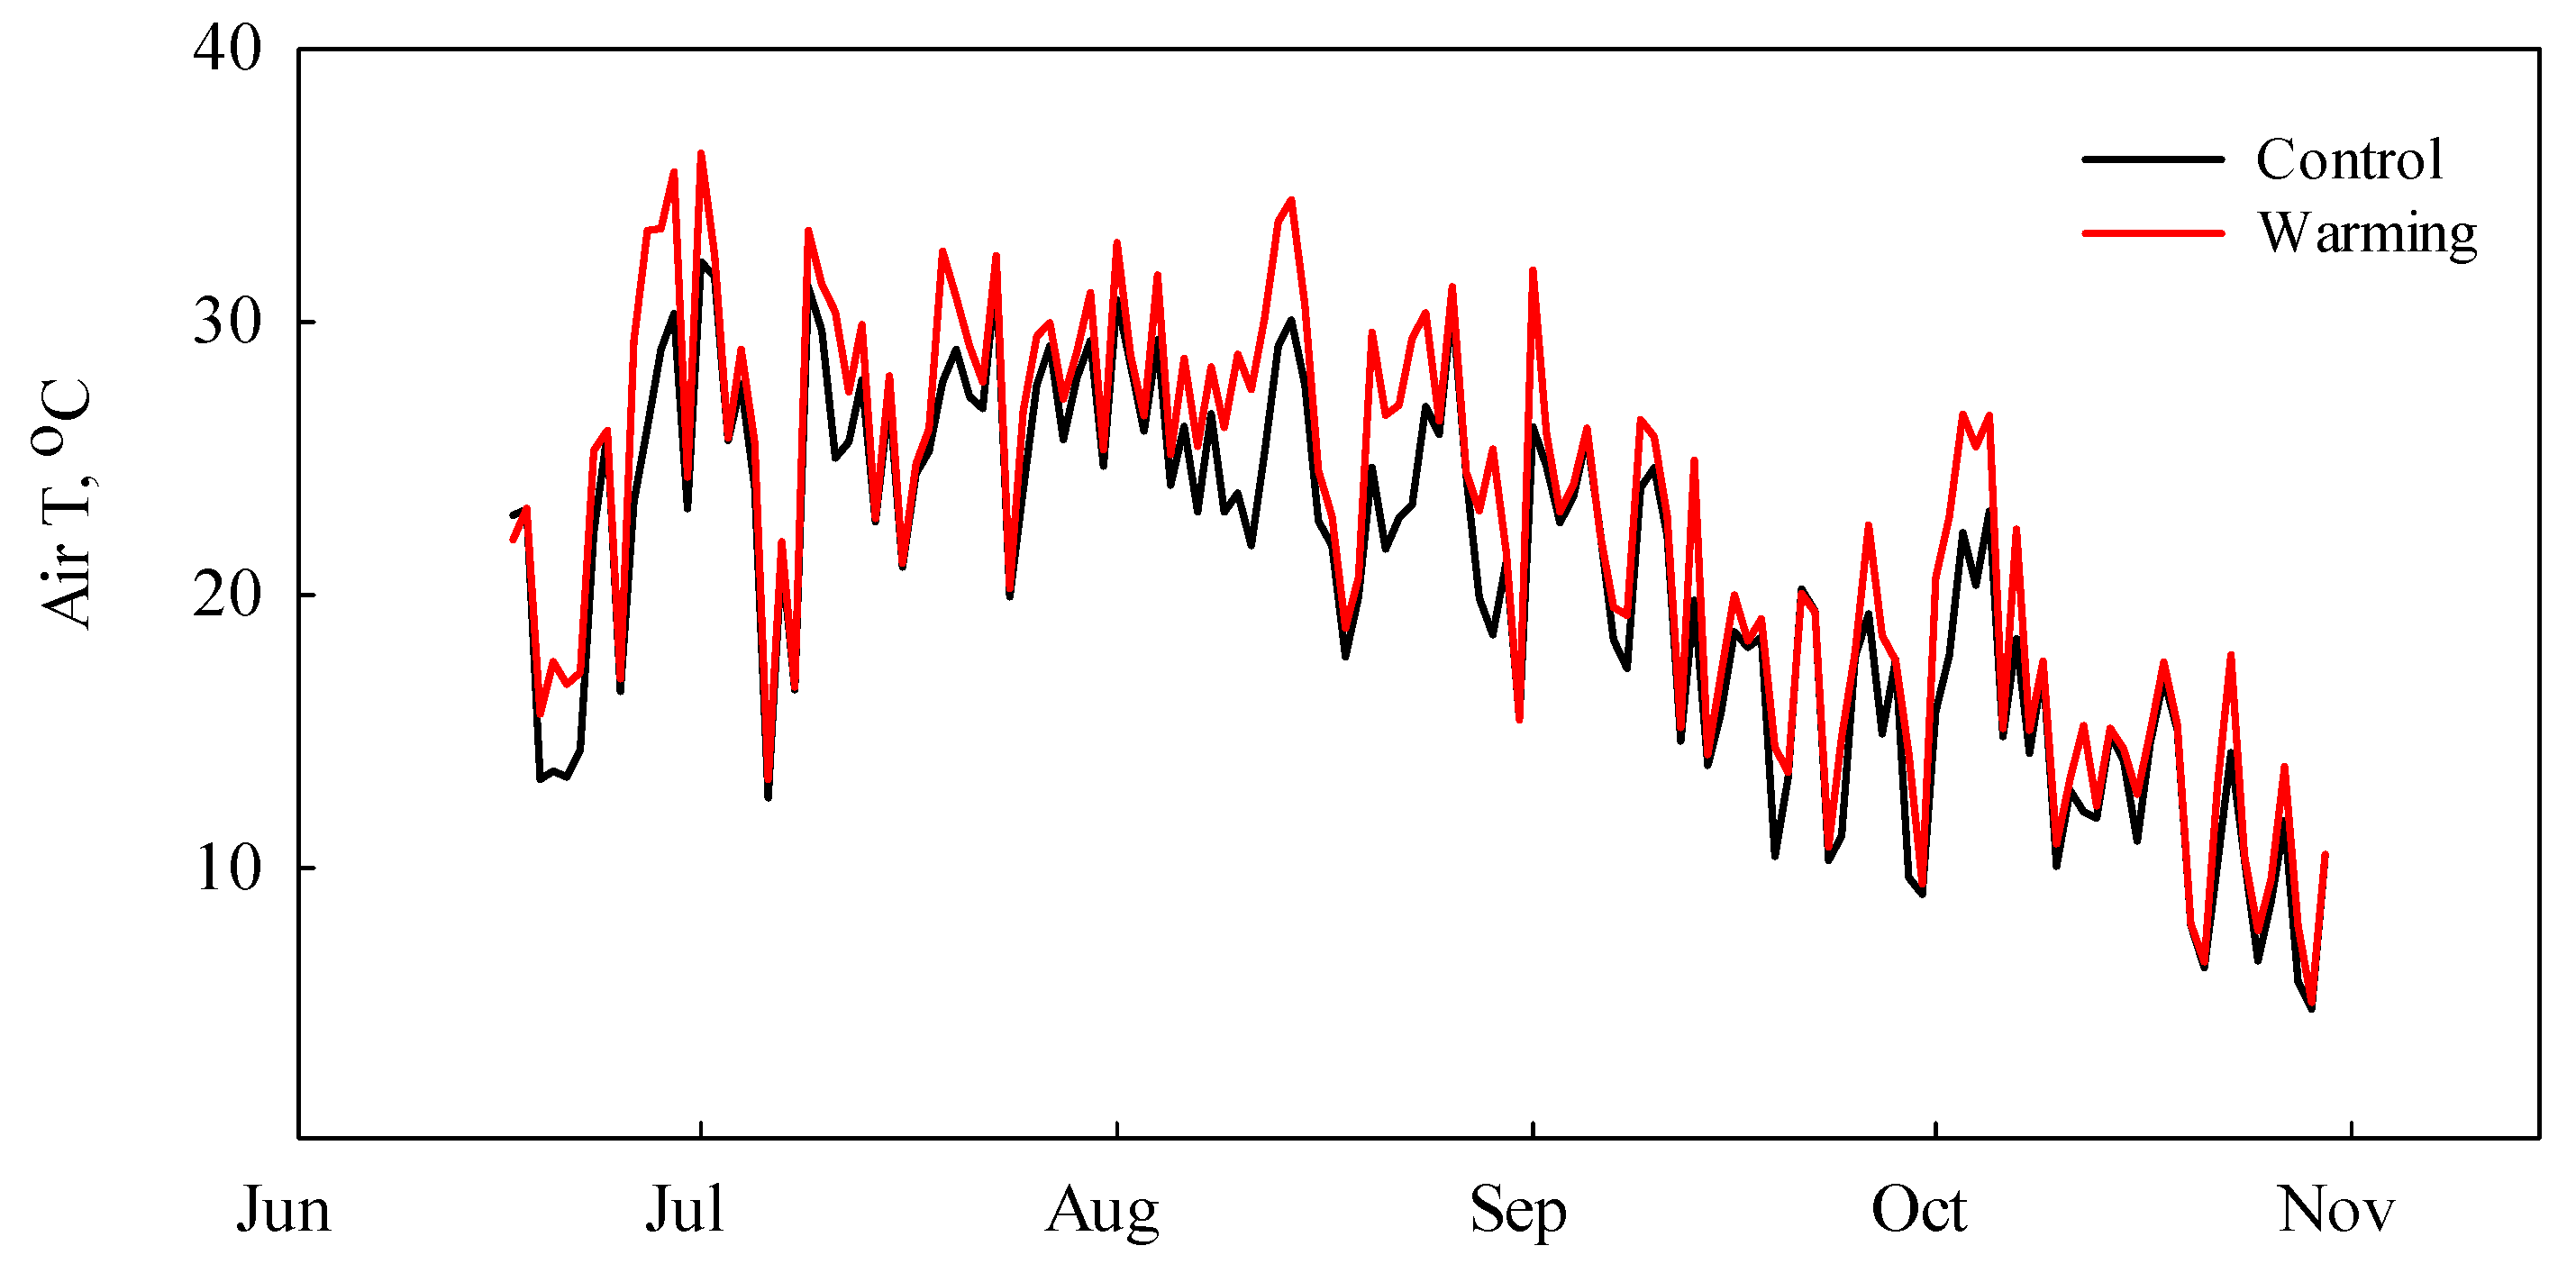
Figure 1. Daytime air temperature in the warming plots (red line) and control plots (black line) during the 2014 growing season.
Atmosphere 09 00480 g001
Figure 2. Effects of different treatments on the average N2O flux during the growing seasons of 2015–2016. Error bars represent standard errors. Different lowercase letters represent significant differences (p < 0.05) between the treatments (n = 60).
Atmosphere 09 00480 g002
Figure 3. The seasonal variation of N2O flux for selected treatments (C, -Se, W-Sh, and -Sh-Se) during the growing seasons of 2015–2016. Error bar represents standard error (n = 4).
Atmosphere 09 00480 g003
Figure 4. Cumulative N2O flux under different treatment during two growing seasons in 2015 and 2016. Error bar represents standard error (n = 4).
Atmosphere 09 00480 g004
Figure 5. Linear regression between N2O flux and soil temperature at 0.05 m and 0.2 m depths, soil moisture, water table depth (WTD), dissolved organic carbon (DOC), and total nitrogen (TN) in the water at 0.1 m and 0.4 m depths during the growing seasons of 2015 and 2016.
Atmosphere 09 00480 g005aAtmosphere 09 00480 g005b
Table 1. Environmental parameters under different treatments during the growing seasons of 2015 and 2016 (Means ± SE).
TreatmentSoil T (0.05 m)Soil T (0.2 m)WTDSoil moistureDOC (0.1 m)DOC (0.4 m)TN (0.1 m)TN (0.4 m)
C16.6 ± 0.5 a14.9 ± 0.4 a7.8 ± 0.7 a74.5 ± 4.5 a40.7 ± 1.2 ab53.0 ± 3.7 a0.8 ± 0.1 c1.5 ± 0.2 ab
-Se16.2 ± 0.7 a14.6 ± 0.4 a8.0 ± 0.8 a72.5 ± 3.3 ab41.3 ± 1.2 abc50.7 ± 1.6 a0.8 ± 0.1 c1.2 ± 0.1 a
-Sh16.9 ± 0.6 a15.0 ± 0.4 a8.3 ± 0.8 a71.4 ± 4.3 ab39.5 ± 1.1 a51.0 ± 4.1 a0.7 ± 0.1 bc1.5 ± 0.2 ab
-Sh-Se16.0 ± 0.5 a14.6 ± 0.4 a9.3 ± 0.7 a68.0 ± 3.6 ab44.4 ± 1.2 c59.3 ± 5.4 a0.7 ± 0.1 c2.1 ± 0.4 b
W17.1 ± 0.6 a15.5 ± 0.4 a7.2 ± 0.7 a68.6 ± 3.3 ab39.6 ± 0.9 a52.8 ± 1.2 a0.6 ± 0.1 a1.1 ± 0.1 a
W-Se16.9 ± 0.5 a15.1 ± 0.4 a8.8 ± 0.9 a65.7 ± 5.3 ab40.2 ± 1.2 a48.2 ± 1.4 a0.7 ± 0.1 abc1.4 ± 0.2 ab
W-Sh16.8 ± 0.5 a15.1 ± 0.4 a8.6 ± 0.7 a61.6 ± 4.1 b43.8 ± 1.2 bc56.7 ± 3.9 a0.6 ± 0.1 ab1.8 ± 0.3 ab
W-Sh-Se17.4 ± 0.5 a14.9 ± 0.4 a7.3 ± 0.7 a71.6 ± 2.5 ab40.8 ± 1.1 ab53.0 ± 3.3 a0.8 ± 0.1 c1.5 ± 0.2 ab
Note: C represents control; W represents warming; -Se represents sedge removal; -Sh represents shrub removal; -Sh-Se represents shrub and sedge removal. The units of soil T, soil moisture, and water table depth (WTD) were °C, %, and m, respectively. The unit of total nitrogen (TN) and dissolved organic carbon (DOC) was mg/L. The number in the brackets represents the depth below the surface. Different lowercase letters represent significant differences (p < 0.05) between treatments.
Table 2. Repeated measures analysis of variance for the effects of warming, vegetation composition, years, and date on N2O flux over the growing seasons of 2015 and 2016.
SourceDfFSig.(p)
Corrected Model73.2070.003
Intercept10.0470.829
Year10.0040.950
Date131.1300.350
Warming/ambient temperature10.9720.327
Shrub presence/absence12.2980.133
Sedge presence/absence16.0110.016
Date * Warming270.7120.857
Warming * Shrub 10.0170.897
Warming * Sedge 13.8050.054
Shrub * Sedge 11.1750.281
Warming * Shrub * Sedge 11.5510.216
Year * Warming21.3740.254
Year * Shrub22.4840.085
Year * Sedge21.3290.266
Year * Warming * Shrub * Sedge81.7760.080
Date * Warming120.8150.635
Date * Shrub121.0060.443
Date * Sedge122.1730.013
Date * Warming * Shrub141.7350.049
Date * Shrub * Sedge142.4280.003
Date * Warming * Shrub * Sedge141.1620.304
Date * Warming * Sedge140.3690.982
Note: The bond font represents significance at p < 0.05. * indicated the interaction effect.
Table 3. Coefficient matrix table between N2O fluxes and environmental parameters during the growing seasons of 2015 and 2016.
TreatmentYearSoil T (0.05 m)Soil T (0.2 m)WTDSoil MoistureDOC (0.1 m)TN (0.1 m)DOC (0.4 m)TN (0.4 m)
C2015−0.282−0.1900.463−0.4620.2890.287nn
2016−0.161−0.265−0.0900.304−0.1330.2170.2580.457
-Se2015−0.1730.142−0.084−0.3280.181−0.061nn
20160.4170.458−0.1600.102−0.016−0.290−0.1160.149
-Sh2015−0.2200.0290.155−0.3750.1800.244nn
20160.0310.046−0.0020.574−0.067−0.131−0.019−0.029
-Sh-Se2015−0.119−0.0530.2680.1500.0280.104nn
2016−0.316−0.2140.109−0.176−0.201−0.072−0.159−0.285
W2015−0.268−0.2360.212−0.3440.0930.031nn
20160.1120.157−0.1140.2880.113−0.016−0.234−0.006
W-Se2015−0.0190.4240.222−0.4420.093−0.270nn
20160.2430.3060.4070.3400.0180.122−0.2260.548
W-Sh2015−0.238−0.252−0.2620.065−0.225−0.063nn
2016−0.047−0.091−0.224−0.5430.0080.4360.3080.256
W-Sh-Se2015−0.058−0.054−0.379−0.0370.239−0.124nn
2016−0.447−0.473−0.0720.551−0.2750.0080.4050.280
Note: C represents control; W represents warming; -Se represents sedge removal; -Sh represents shrub removal; -Sh-Se represents shrub and sedge removal. “n” represents no data. The number in the brackets represents the depth below the surface. The bond font represents significance at p < 0.05.