Article

Development of a Regression Model for Estimating Daily Radiative Forcing Due to Atmospheric Aerosols from Moderate Resolution Imaging Spectrometers (MODIS) Data in the Indo Gangetic Plain (IGP)

Department of Infrastructure Engineering, University of Melbourne, Parkville, Melbourne, VIC 3010, Australia
*
Author to whom correspondence should be addressed.
Atmosphere 2018, 9(10), 405; https://doi.org/10.3390/atmos9100405
Submission received: 31 July 2018 / Revised: 26 September 2018 / Accepted: 29 September 2018 / Published: 16 October 2018
(This article belongs to the Section Aerosols)

Abstract

:
The assessment of direct radiative forcing due to atmospheric aerosols (ADRF) in the Indo Gangetic Plain (IGP), which is a food basket of south Asia, is important for measuring the effect of atmospheric aerosols on the terrestrial ecosystem and for assessing the effect of aerosols on crop production in the region. Existing comprehensive analytical models to estimate ADRF require a large number of input parameters and high processing time. In this context, here, we develop a simple model to estimate daily ADRF at any location on the surface of the IGP through multiple regressions of AErosol RObotic NETwork (AERONET) aerosol optical depth (AOD) and atmospheric water vapour using data from 2002 to 2015 at 10 stations in the IGP. The goodness of fit of the model is indicated by an adjusted R2 value of 0.834. The Jackknife method of deleting one group (station data) was employed to cross validate and study the stability of the regression model. It was found to be robust with an adjusted R2 fluctuating between 0.813 and 0.842. In order to use the year-round ADRF model for locations beyond the AERONET stations in the IGP, AOD, and atmospheric water vapour products from MODIS Aqua and Terra were compared against AERONET station data and they were found to be similar. Using MODIS Aqua and Terra products as input, the year-round ADRF regression was evaluated at the IGP AERONET stations and found to perform well with Pearson correlation coefficients of 0.66 and 0.65, respectively. Using ADRF regression model with MODIS inputs allows for the estimation of ADRF across the IGP for assessing the aerosol impact on ecosystem and crop production.

1. Introduction

The Indo Gangetic Plain (IGP) is considered to be one of the most highly polluted regions of the world due to persistent heavy aerosol loading in its atmosphere [1,2]. Due to the high level of air pollution, premature mortality as a result of exposure to PM2.5 in the Indian section of IGP alone is estimated to be 240,000 per annum [3]. Krishna Moorthy et al. [4] analysed the historical data from aerosol observatories in India and found that the aerosol optical depth (AOD) had increased at a rate of 2.3% (relative to 1985) per annum and the increasing trend was further increased (to 4%) in the last decade. High atmospheric pollution in this region is not only due to emissions from an increased use of fossil fuel in transportation and the industrial sector, but also due to a high dependence on biomass being used mainly for cooking in the residential sector [5,6]. In addition, the burning of crop residue (rice and wheat) in the field has significantly contributed to the high level of aerosols during the post monsoon and pre monsoon seasons in the IGP [7,8,9,10,11]. Furthermore, the unique topographic features of the IGP with the Hindu Kush Himalayan range to the north, moderate hills in the south, Thar desert and Arabian sea to the west, and the Bay of Bengal to the east, in combination with rapidly increasing anthropogenic aerosol loading in the region and mineral dust from the Thar desert, has resulted in an alarming increase in aerosol loading in this region [1]. Based upon the annual mean PM2.5 concentration, 17 cities of the IGP were included in the 20 most polluted cities of the world [12]. Given that all the representative concentration pathway (RCP) scenarios indicate that the air quality in this region is likely to degrade further. It is expected that severe negative effects on public health and the ecosystem will continue into the future [13].
Along with the negative effects on public health, it is reported that the high level of atmospheric aerosols in the IGP has also affected natural systems significantly. Unlike other parts of the world, solar dimming is found to be continued in India even after 2000 [14]. Similarly, while analyzing net downward shortwave radiation (NDSWR) over south Asia for the period of 1979–2004, it was found that solar dimming continues in south Asia with a trend of −0.54 W/m2/year [15]. Singh et al. [16] analyzed the solar radiation and evaporation trends at four metrological stations in India during 1975–1995 and found solar diming in the range of 1.5% to 3.4% per decade across the stations. Similarly, it is reported that the net incoming radiation reduced by about 19% in the Indo Gangetic basin due to aerosols, which is expected to effect the regional climate significantly [17]. The atmospheric brown cloud (ABC) over the north Indian Ocean and south Asia, due to anthropogenic atmospheric aerosols, was documented after the Indian Ocean Experiment (INDOEX) and several studies into its possible effects on regional and global climate [18,19,20,21,22]. In the study of the IGP region using remote sensing techniques, Devara and Manoj [23] concluded that there is strong association between atmospheric aerosol content and monsoon precipitation. Since the summer monsoon provides 75–90% of the annual rainfall in the IGP, the agricultural performance of this region is also expected to be affected by the high level of atmospheric aerosols.
Aerosols also have a significant effect on fog formation in the IGP region [24]. Every winter, the whole IGP region is engulfed by dense fog with a significant increasing trend in the number of foggy days during the past 35 years [25,26]. The increasing trend of winter fog has not only affected day-to-day life of millions of people living in this region, through frequent flight/train delay due to poor visibility [27], but it also negatively affected the production of several winter crops [28,29]. A statistical model of historical rice harvest in India, coupled with a regional climate scenario, indicated that there has been a slowdown in the increase in production over the last two decades due to increased brown cloud and greenhouse gas [30]. Similarly, Latha et al. [31] compared the radiative forcing of atmospheric black carbon at two locations in IGP, Varanasi and Ranchi by using Santa Barbara DISTORT Atmospheric Radiative Transfer (SBDART) model and concluded that the incoming radiation is reduced by about 5% due to black carbon (BC) during any time of day at Varanasi and 4% at Ranchi. This study also estimated the loss of wheat crop at Varanasi and Ranchi while using the empirical model that was developed by Ahmed and Hassen [32] as −149 kg/ha and −141 kg/ha, respectively, due to the reduction of solar radiation because of atmospheric black carbon. Moreover, a crop response simulation model has shown that there is a direct relationship between the increase (decrease) in solar irradiance and increase (decrease) in rice and wheat yield in China and that due to atmospheric aerosols and regional haze there has been a reduction in wheat and rice yields in China by 5 to 30% [33]. In this context, information on the effect of aerosols on solar radiation in the IGP is important not only to study the effect on the climate and ecosystem in the long run, but also to study the immediate effects of atmospheric aerosols on solar radiation availability for agricultural production in the region.
The effect of atmospheric aerosols on climate is generally measured in terms of aerosol radiative forcing, which is defined as the effect of anthropogenic aerosols on the radiative fluxes [34]. The radiative forcing is estimated at the top of atmosphere (TOA), bottom of atmosphere (BOA), and in the atmosphere. Ramanathan & Ramana [19] studied the direct radiative forcing of atmospheric brown clouds in the Himalayan foot hills and Indo Gangetic Plains (IGPs) by using MODIS Terra satellite data during 2001 to 2003 and found the average surface radiative forcing during the dry season (October to May) in the region is about −32 ± 5 Wm−2. Similarly, Dey and Tripathi [35] studied the direct radiative effect of aerosols in the IGP during 2001 to 2005 by using an aerosol optical model and found the annual average radiative forcing at the surface at Kanpur was −31.8 ± 10.9 Wm−2. Their study also concluded that anthropogenic aerosols contributed 80% of the radiative forcing at Kanpur during October to February. Similarly, Ramachandran and Kedia [36] investigated the seasonal variation of aerosol radiative forcing at Kanpur and Gandhi college during January 2006 to December 2007 by using AERONET data and the Santa Barbara DISORT Atmospheric Radiative Transfer (SBDART) model, which provided very similar results. The maximum radiative forcing in the atmosphere and at the surface was in the pre-monsoon season at both stations. Das et al. [37] studied winter haze in the eastern Indo Gangetic Basin through ground measurements during December 2013 to February 2014 and the radiative effect of haze by using SBDART and found the radiative forcing at the BOA in Silguri, Kolkata and Sunderban was −39.3, −70.3 and −38 Wm−2 respectively. In addition, Latha et al. [31] studied the radiative forcing of atmospheric black carbon at Varanasi and Ranchi using SBDART and concluded that the radiative forcing due to atmospheric black carbon is significantly increased from February to March (i.e., from −30 Wm−2 to −50 Wm−2) at Varanasi due to an increased BC concentration and mixing layer height. The radiative forcing due to atmospheric aerosols at IGP stations has been studied at the annual, seasonal, and in some cases, monthly time scale by using radiative transfer models [36,38,39,40,41,42,43,44].
The Santa Barbara DISTORT Atmospheric Radiative Transfer (SBDART) model was developed to model the plane parallel radiative transfer within the atmosphere and at the earth surface [45]. SBDART is a comprehensive model that consists of six standard atmospheric profiles, five basic surface types and four standard aerosol types, SBDART is widely used to study direct radiative forcing due to atmospheric aerosols at the earth surface, within the atmosphere and at the top of atmosphere [38,46,47,48]. However, it requires a large number of input parameters (and therefore assumptions) and high processing time, making it unrealistic for use with large amounts of data across spatial and temporal scales [49]. In this context, there is a need for a simple model to determine radiative forcing across the IGP at daily time scale. Determination of the daily radiative forcing across the IGP may also help to determine the change in radiative flux due to atmospheric aerosols loading, and this could help to assess the effect of atmospheric aerosols on terrestrial ecosystems at the regional scale. In turn, this will help to investigate the effects of atmospheric aerosols on the crop production system at the regional level, as suggested by Huntingford et al. [50].
We aimed to develop a simple regression model to determine daily radiative forcing from high quality station data in the IGP, which can then be driven by remotely sensed data (which has wide temporal and spatial coverage). Within the IGP, there are several AERONET (AErosol RObotic NETwork) stations that are part of the global network of ground based remote sensing aerosol stations initiated by National Aeronautics and Space Administration (NASA) [51]. These stations provide continuous high-quality point observations of aerosol loading and radiative forcing due to atmospheric aerosols. Garcia et al. [52] validated the AERONET estimated radiative forcing against ground based broad band measurements from the Baseline Surface Radiation (BSRN) and the Solar Radiation Networks (SolRad-Net), and found that AERONET estimated radiative forcing is very close to ground measurements with uncertainty less than 15 Wm−2 for all stations, which is within the uncertainty of BSRN and SolRad-Net observed data. AERONET ground observation data are extensively used to study the optical properties of atmospheric aerosols and their radiative effects [48,53,54,55]. In addition, AERONET observations are also considered to be the benchmark for the validation of aerosol properties obtained from other indirect methods, such as models and satellite imagery. But, these point data on aerosol optical properties and radiative forcing due to atmospheric aerosols at the surface and top of atmosphere are limited to the location of the AERONET stations.
In this context, it is planned to develop and evaluate a multiple regression model to estimate daily radiative forcing at the bottom of the atmosphere in the IGP by using the quality AERONET station point data and spatially distributed satellite remotely sensed data in the region. Remer et al. [56] extensively validated the Moderate Resolution Imaging Spectrometers (MODIS) retrieved AOD with AERONET measured AOD at the global scale and found that MODIS products are accurate within prelaunch expectations and they are sufficiently accurate for a variety of applications, including improved estimates of observationally based aerosol radiative effects. For the wide scale application of this simple regression model, it is evaluated by using MODIS derived aerosol properties at the AERONET stations located in IGP. After successful evaluation of the model with MODIS derived aerosol properties at AERONET stations in the IGP, this model can be used to estimate the radiative forcing due to atmospheric aerosols at the surface on any day at any location of the IGP because MODIS sensors on the Terra and Aqua earth observing system (EOS) satellites provide continuous and near real time aerosol properties of the earth at higher temporal and spatial resolutions. This model will help to estimate the reduction of solar radiation at the surface of the IGP, which may be utilised to study the immediate effects of aerosols in the IGP on, for example, crop production, evapotranspiration, etc., along with the long-term effects of aerosols on climate change and the natural systems of the IGP.
The important feature of this study is the development and evaluation of a simple regression model to estimate direct daily radiative forcing due to atmospheric aerosol (ADRF) in the IGP region by using point AERONET data. Once established, the model will be evaluated while using MODIS inputs at the AERONET stations, where AERONET ADRF is available. Using MODIS products of daily average AOD and precipitable water vapour in this model will allow, ADRF to be estimated at any location across the IGP. This simple model may be used to assess the effect of atmospheric aerosols on solar radiation, and consequently environmental effects at daily time scale in the IGP region.

2. Study Area and Data Sets

2.1. Study Area

The Indo-Gangetic basin is the combination of two neighbouring river basins—the Indus and the Ganga in south Asia. The origin of both rivers is the Hindu Kush Himalaya, which strongly influences and controls the atmospheric circulation around the region [57]. Both of these rivers have fertile alluvium plains that are intensely cultivated and are known as the Indo Gangetic Plain (IGP). The IGP is the study area, which encompasses the eastern plain area of Pakistan, most of northern and eastern India, the southern plain area of Nepal and almost all of Bangladesh (Figure 1). The IGP is 250 to 450 km wide and extends from the delta of the Indus river at the Arabian sea to the delta of the Ganga at the Bay of Bengal and it separates the Himalaya from the Indian peninsula [58]. Agriculture is one of the major economic activities of the population in the IGP. Rice and wheat are the major crops that are cultivated in the IGP covering 13.5 M ha of Pakistan, India, Nepal and Bangladesh [59]. The IGP is also known as the ‘food basket’ of the region because it produces 53% of rice and 93% of wheat in these countries [60]. The IGP is home to about 800 M people with high population density in the range of 400–600 people per square kilometre [61,62]. The IGP is a densely populated region with five mega cities (New Delhi, Karachi, Dhaka, Kolkata, and Lahore) and dozens of cities with population of more than one-million [63]. Due to rapid urbanization, industrialization and lack of effective monitoring and control on pollution, there is persistent heavy aerosol loading in the atmosphere of the Indo Gangetic Plain (IGP), which is considered to be one of the most highly polluted regions of the world [1,2].
The climate of the IGP varies from semi-arid in the Punjab region of Pakistan, hot sub-humid in Haryana, Uttar Pradesh and Bihar of India and Terai region of Nepal and sub-humid to humid climate in West Bengal of India and the plain area of Bangladesh [59]. There is a clear gradient in annual average precipitation in the IGP with 654 mm in the Punjab (western IGP) to 1462 mm in West Bengal (eastern IGP) [64]. The monsoon season (June to September) is the rainy season and about 85% of the total precipitation occurs during this period.

2.2. Ground Station Instrumentation and Data

The AERONET network provides, long-term continuous monitoring and characterisation of aerosols, at a regional and global scale, as well as aerosol information from spectral data of direct sun radiation extinction and angular measurement of sky radiance [51,65]. In addition, the inversion AERONET products provide aerosol parameters (e.g., size distribution, complex refractive index, partition of spherical, and non-spherical particles) and properties (e.g., phase function, refractive index, spectral and broad band fluxes, etc.), including radiative forcing at the top of atmosphere and bottom of atmosphere [66]. The AERONET data for daily aerosol optical depth (AOD) at 500 nm, atmospheric water vapour, and daily direct radiative forcing at the bottom of the atmosphere (BOA) from the AERONET stations in the IGP (listed in Table 1) are used in this study. Out of those 10 AERONET stations in the IGP, two stations are from Pakistan, five are from India, one from Nepal, and two from Bangladesh.

2.3. Satellite Data

Two Moderate Resolution Imaging Spectroradiometer (MODIS) sensors, Aqua and Terra of the Earth observing system (EOS) satellites are considered to be the most comprehensive sensors continuously providing electromagnetic images of land, ocean, and atmosphere environment for a wide range of applications. EOS with MODIS Terra sensor (10:30 p.m. local solar equatorial crossing time) was launched in late 1999 and the MODIS Aqua sensor (1:30 p.m. local solar Equatorial crossing time) was launched in 2002 [67]. The MODIS deep blue (DB) algorithm was originally developed to retrieve AOD over bright surfaces by using deep blue wave length and similarly the MODIS dark target (DT) algorithm was originally developed for dark vegetated surface areas. The merged DT-DB product combines and it merges the results of both algorithms and is considered to be the “best-of” combined aerosol product available [68]. In addition, Mhawish et al. [51] found that the merged DT-DB product showed less bias across IGP sites and performed as good as DT and DB products, except over the upper IGP. The MODIS Aqua and MODIS Terra merged DT and DB AOD products are used in this study. At each of the AERONET stations in the IGP listed in Table 1, the area averaged time series of daily merged DT and DB AOD product from MODIS Aqua and Terra was extracted for pixel lying in a ±0.1° longitude and latitude box around each station. Similarly, time series data of mean daily precipitable water vapour from MODIS Aqua and Terra products at those selected AERONET stations were also obtained.

2.4. Data Quality

The accuracy of the Cimel radiometers, used at the AERIONET stations, is within ±0.01 to ±0.02 for measured columnar AOD [51,69]. Based upon the results of extensive sensitivity studies on AERONET data by Dubovik et al. [70], Dubovik et al. [71] recommended a set of quality control criteria for high accuracy in the retrieval of aerosol parameters. These recommended quality control criteria were used to produce quality assured version 2.0 AERONET inversion products (National Aeronautics and Space Administration, Washington, DC, USA) [72]. Similarly, Pérez-Ramírez, D. et al. [73] demonstrated the ability of AERONET to retrieve precipitable water vapour (average bias less than 6% and total uncertainty less than 15%) by comparing it with radio sonde, Global Positioning System (GPS), and microwave radiometry methods. The AERONET data used in this study are taken from the highest quality version under clear-sky conditions, i.e., Version 2.0 at level 2.0. Hence, the AERONET data are considered to be standard data and are used to validate atmospheric properties from satellite data. The MODIS Aqua and Terra products are validated by using AERONET data at the regional and global scale in many studies [74,75,76,77,78,79]. The uncertainty in the MODIS retrieved aerosol optical depth (AOD) over land and ocean are reported to be in the range of ±(0.05 + 0.2 × AOD) and ±(0.03 + 0.15 × AOD), which is also considered to be the expected error (EE) [74]. Similarly, Sayer et al. [80] compared the MODIS Aqua data products with AERONET data at global and regional scales and found that MODIS merged AOD at 550 nm has the correlation coefficient and root mean square error of 0.86 and 0.16, respectively, for the Indian subcontinent.

3. Methodology

This section is sub-divided in to 3 sub-sections. The first sub-section describes the regression modelling of the ADRF using AERONET data. In the second sub-section, the method adopted to compare the MODIS products (AOD and precipitable water vapour) with the corresponding AERONET product is presented. Finally, in the third sub-section, the method employed to evaluate the developed model is described.

3.1. Multiple Regressions

To develop a statistical model to predict daily direct radiative forcing due to atmospheric aerosols (ADRF) at the bottom of atmosphere (BOA), multiple regressions were performed for different combinations of parameters, including AOD, atmospheric water vapour, elevation, Angstrom coefficient, etc. A multiple regression of ADRF with daily mean AOD and daily mean atmospheric water vapour provided a simple model with good results (see Equation (1)) and significant improvement was not obtained with the inclusion of other variables in the model. Russel et al. [81] showed that AOD is the important factor that is responsible for the local radiative forcing among other several factors. Bilbao et al. [82] also showed that direct short wave irradiance is a function of AOD at 550 nm. Obviously, AOD is an important parameter related to the radiative forcing at the surface because it measures the optical extinction due to scattering and absorption in the vertical column. Moreover, it is also reported that the optical properties of hygroscopic aerosols are significantly affected by atmospheric water vapour [83]. Furthermore, Bilbao et al. [82] showed that there is statistically significant negative correlation between direct short wave irradiance and column atmospheric water vapour.
The null hypothesis for the statistical test of this multiple regression is that there is no relationship between daily ADRF and daily aerosol optical depth and daily mean atmospheric water vapour at any particular location in the IGP. The F test was performed, as described by Cohen [84], to test the hypothesis and the model was evaluated while using the adjusted R2 value. The statistical significance of the individual atmospheric parameters (viz. AOD and atmospheric water vapour) in the following linear model was evaluated using the t test, as described by Cohen [84].
ADRF = A + B1 AOD550 + B2 AWV
where, A is an intercept and B1 and B2 are the coefficients for AOD and atmospheric water vapour respectively.
ADRF = Daily direct radiative forcing due to atmospheric aerosols (Wm−2).
AOD550 = Daily average atmospheric aerosol optical depth at wavelength 550 nm.
AWV = Daily mean atmospheric water vapour (m).
After pooling the data sets from all the stations together, a year-round radiative model for the IGP region is developed. Similarly, after pooling the seasonal data (winter, pre-monsoon, monsoon, and post monsoon seasons) of all stations seasonal models for the IGP region are also developed.

3.2. Comparison of AERONET and MODIS Products

As the AERONET measured AOD and precipitable water vapour are only available at a few stations in the IGP, this limits the applicability of the derived model. Unlike point products of AERONET, MODIS provides continuous spatial as well as the temporal distribution of AOD and precipitable water vapour over the earth. Since MODIS provide the AOD at 550 nm and AERONET provides the AOD at 500 nm, the AOD at 500 nm wavelength, is transformed to 550 nm by using the following equation, as suggested by Prasad and Singh [85] and Bibi et al. [44].
AOD550 = AOD500 (500/550)α
where,
AOD550 = Daily average atmospheric aerosol optical depth at wavelength 550 nm.
AOD500 = Daily average atmospheric aerosol optical depth at wavelength 500 nm.
α = Angstrom Exponent in the wavelength range of 440 to 870 nm.
Before using MODIS derived AOD and precipitable water vapour for the IGP in the developed model, the MODIS derived AOD and mean precipitable water vapour are compared against the AERONET station based AOD and mean atmospheric water in the IGP. The comparison was performed using a scatterplot, calculating mean error (ME), mean absolute error (MAE), root mean square error (RMSE), and Pearson correlation coefficient (r).

3.3. Evaluation of the Model

The ADRF predicted by the model is compared with the AERONET observed ADRF for all the AERONET stations in the IGP. The model predicted results are evaluated by calculating the mean error, mean absolute error, root mean square error, Nash-Sutcliffe coefficient of efficiency [86], and Pearson correlation coefficient. Since it is reported that Jackknife validation is unbiased when compared to validation with data splitting [87], the model is evaluated and the stability of the model is tested by adopting a delete one group (station) Jackknife method, as described by [88,89]. The ADRF predicted by the model when using MODIS Aqua and Terra derived AOD and mean precipitable water vapour is compared against the AERONET measured ADRF.

4. Results and Discussions

This section is sub-divided in to six sub-sections. In the first sub-section, the year round and seasonal ADRF models that were developed through multiple regression using AERONET data at 10 stations in the IGP region are presented. In the second sub-section, the overall and station wise evaluation of the performance of the models are discussed. Moreover, the results of the cross-validation Jackknife method are also discussed in this sub-section. To use the developed year-round ADRF model beyond the AERONET stations in the IGP, two model input parameters AOD and precipitable water vapour retrieved from MODIS Aqua and Terra are compared against AERONET values in the third sub-section. In the fourth sub-section, the developed ADRF is evaluated by using MODIS Aqua and Terra products. In the fifth sub-section, the performance of the model with MODIS Aqua input parameters is compared with that of the MODIS Terra products. Finally, in the sixth sub-section, the results of the ADRF model is compared against the published values from SBDART at two AERONET stations.

4.1. Development of Regression Model for ADRF

Multiple linear regressions are developed for year-round and seasonal empirical models to estimate daily ADRF at the surface using AOD and mean atmospheric water vapour from the AERONET stations in the IGP listed in Table 1. The results of the regressions are presented in Table 2. The intercept (A) and coefficients (B1 and B2) of the year-round model, which is developed using 5138 daily data points from the IGP, are found to be significant (p < 0.01). The adjusted R2 of the year-round model is 0.834, which indicates the year-round model provides a good fit to the ADRF in the IGP. All of the seasonal models, except winter, have significant (p < 0.01) intercept and coefficients. In the winter model the coefficient of mean atmospheric water vapour in the atmosphere is not significant, which may be due to the dry atmospheric condition during this time with nil to very little rainfall in the IGP [90]. The adjusted R2 values of the seasonal models are similar to that of the year-round model, ranging from 0.825 for the monsoon model to 0.862 for the post monsoon model. The standard error is a measure of model prediction accuracy and it is defined as the square root of the ratio of the sum of squared residuals and the degree of freedom. The standard error of the year-round model is 14.39 Wm−2 where as that of the seasonal models range from 11.364 Wm−2 for the Monsoon model to 14.970 Wm−2 for the post monsoon model. From the results of the regression using AERONET data, it appears that the proposed models could be promising models for estimating daily ADRF in the IGP.

4.2. Evaluation of the Performance of the ADRF Model

The performance of the developed year-round ADRF regression model is evaluated through station wise scatterplots of AERONET ADRF and estimated ADRF using AERONET AOD and precipitable atmospheric water vapour, as shown in Figure 2. The total number of daily observations across all 10 stations in the IGP during 2002 to 2015 is 5138 and the station wise observations vary from 27 at Kolkata to 1581 at Kanpur. From Figure 2, it is evident that most of the observed and estimated ADRF points follow the 1:1 line, indicating agreement between the estimated ADRF and the AERONET ADRF at all ten stations of the IGP.
The results of applying the year-round model to estimate daily ADRF by using AERONET AOD and daily mean atmospheric moisture at each station is presented in Table 3. The mean error (ME) in the estimation of daily ADRF varies from −7.689 Wm−2 at Bhola to 22.946 Wm−2 at Kolkata. Both of those stations have very few observations i.e., 37 and 27 at Bhola and Kolkata, respectively, out of a total of 5138 data points. The mean absolute error (MAE) ranges from 8.607 Wm−2 at Karachi to 23.338 Wm−2 at Kolkata and the MAE across all stations is 10.490 Wm−2. The root mean square error (RMSE) in estimated ADRF across all the stations in IGP is 14.390 Wm−2. The RMSE of Kolkata is highest (26.284 Wm−2) and that of Karachi is lowest (10.592 Wm−2) among the stations in the IGP.
Even though the acceptability of the performance of a model depends upon the application of the model [91], for practical application Ritter and Muňoz-Carpena [92] adopted Nash–Sutcliffe efficiency of between 0.65 and 0.8 as an acceptable range and 0.81 to 0.9 as a good range for the goodness of fit when evaluating a model. The Nash–Sutcliffe efficiency of the year-round model for all station data is 0.830, indicating that the model is a good fit to the data. The station wise Nash–Sutcliffe efficiency of the year-round model at all stations in the IGP, except that of Kolkata (0.402) and Bhola (0.608) is within the acceptable range. The Pearson correlation coefficient (r) between the year-round model estimated ADRF and the AERONET ADRF at all stations in the IGP is 0.91. The Pearson correlation coefficient of the station wise estimated values of the ADRF range from 0.87 at Bhola to 0.95 at Kolkata. Test results of the year-round ADRF model at the station level indicate that the year round ADRF model is acceptable.
To test the consistency and stability of the year-round model for prediction of ADRF, the model is tested by adopting a delete one group (station) Jackknife method. The results of the multiple regressions from the delete one group (station data) Jackknife method are shown in Table 4. From the table, it is observed that the adjust R2 value ranged from 0.813 to 0.842 and the standard error varied from 13.791 Wm−2 to 15.098 Wm−2 in the 10 Jackknife cases, which indicates consistency in the performance of the model, even when one of the stations is removed from the analysis. The intercept (A) of the year-round model in the Jackknife cases ranged from −36.43 to −30.21. The coefficients B1 and B2 values fluctuated from −121.390 to −116.116 and 3.843 to 5.113, respectively. Interestingly, it is also observed that the mean value of intercept, coefficients, adjusted R2, and standard error from the Jackknife cases is very close to the values that are generated by the regression with all station data. The limited variation in the distribution of the coefficients, the intercepts, adjusted R2, and standard error values in the Jackknife cases indicates that the year-round model is a stable model for the prediction of the ADRF in the IGP.

4.3. Comparison of MODIS and AERONET Products

To extend the applicability of the developed year-round and seasonal ADRF models throughout the IGP, it is necessary to obtain AOD and atmospheric water vapour data for any location within the IGP. In this context, MODIS products are considered to be very useful for this application, because they provide high spatial resolution atmospheric aerosol data with observations twice a day covering most of the planet and easy access to near real-time data [78]. Before applying MODIS data in this model, it is necessary to compare the MODIS and AERONET products in the IGP. The comparison of MODIS Aqua and MODIS Terra products is performed separately against the AERONET AOD and atmospheric water vapour. The results of comparison of MODIS and AERONET data are presented in the supplement section.

4.3.1. Comparison of MODIS Aqua and AERONET Products

The station wise comparison of MODIS Aqua retrieved AOD550 against transformed AERONET AOD at 550 nm from measured AOD at 500 nm at the IGP stations is performed through scatterplots in Figure S1. The plots indicate that the MODIS Aqua AOD is similar to the transformed AERONET AOD measured at each station in the IGP, because the majority of the scatter points are near to the 1:1 line. The uncertainty in the MODIS retrieved aerosol optical depth (AOD) over land and ocean are reported to be in the range of ±(0.05 + 0.2 × AOD) and ±(0.03 + 0.15 × AOD), which is also considered to be the expected error (EE) [74]. Figure S2 provides the share of the MODIS Aqua AOD values that lie within, above and below the expected error range where AERONET AOD is assumed to be actual AOD. The figure indicates that in all the stations except Kolkata, more than 60% of MODIS Aqua retrieved AOD data lie within the expected error range for the IGP stations. Since more than 70% of MODIS Aqua retrieved AOD at Kanpur is within the expected error range, MODIS retrieved AOD is well matched with AERONET data, which is similar to the findings of Choudhary et al. [93]. As 64.4% of MODIS Aqua retrieved AOD is within the expected error range at Gandhi college in this study, the correlation of the MODIS Aqua retrieved AOD at Gandhi College in this study is higher than the findings of Choudhary et al. [93], which may be due to the extended data period of this study (2002 to 2015) as compared to the previous study (2002 to 2010). Similarly, more than two-thirds of the MODIS Aqua AOD data across all IGP stations are within the expected error range.
The statistical comparison of the MODIS Aqua retrieved AOD and atmospheric water vapour with the AERONET measured AOD and atmospheric water vapour is presented in Table 5. It is observed that the station wise mean error (ME) of the MODIS Aqua retrieved AOD ranges from −0.107 to 0.079 with an all station ME of −0.004. Similarly, the station wise MAE of MODIS Aqua retrieved AOD ranges from 0.11 to 0.175 with an all station MAE of 0.144. The station wise root mean square error (RMSE) of MODIS Aqua AOD varies from 0.156 at Kanpur to 0.255 at Lahore and the all station RMSE is 0.210. Station wise Pearson correlation coefficient (r) of the MODIS Aqua retrieved daily AOD with AERONET measured daily AOD ranges from a minimum of 0.538 at New Delhi to a maximum of 0.898 at Lumbini. The Pearson Correlation coefficient of MODIS Aqua retrieved AOD with AERONET AOD across all stations in the IGP is 0.778. In summary, the MODIS Aqua retrieved daily AOD at the IGP stations is found to be similar to the AERONET measured AOD.
Scatterplots of the station wise MODIS Aqua retrieved daily mean precipitable water vapour and AERONET measured daily mean atmospheric water vapour are presented in Figure S3. The figure indicates that the MODIS Aqua derived precipitable water vapour is very similar to that of AERONET, because most the points are close to the 1:1 line at all stations in the IGP. The station wise ME of MODIS Aqua derived precipitable water vapour ranges from −0.436 cm at Lumbini to 0.518 cm at New Delhi and across all of the stations ME in the IGP is 0.278 cm (Table 5). The station wise MAE ranges from 0.394 cm at Pantnagar to 0.623 cm at New Delhi and across all the stations the MAE is 0.479 cm. The RMSE of the MODIS Aqua derived precipitable water vapour across all of the stations in the IGP is limited to 0.638 cm. The correlation coefficient of the MODIS Aqua derived precipitable water vapour with AERONET measured atmospheric water vapour across all the stations in the IGP is 0.887, which indicates a good correlation.
At the seasonal scale (winter, pre-monsoon, monsoon, and post monsoon), MODIS Aqua derived AOD at all stations of the IGP is plotted against AERONET measured AOD in Figure S4. It is observed that there is more variation of MODIS Aqua AOD and AERONET AOD in the monsoon season when compared to other seasons, which may be due to the effect of clouds on MODIS Aqua retrieved AOD because AERONET Version 2 AOD is quality assured and cloud screened data [94]. Season wise evaluation of the MODIS Aqua retrieved AOD and water vapour is presented in Table 6. The table indicates that the ME of MODIS Aqua retrieved AOD vary from −0.059 during the pre-monsoon to 0.093 in the monsoon season. The MAE and RMSE value of MODIS Aqua retrieved AOD is found to be least (0.118 and 0.180, respectively) during winter and maximum (0.249 and 0.336, respectively) during the monsoon season. With respect to seasonal performance of MODIS Aqua derived daily mean precipitable water vapour, the least value of ME, MAE, and RMSE is found during the post monsoon as 0.175, 0.397, and 0.519, respectively, and the maximum value is found during monsoon season as 0.642, 0.813, and 1.015, respectively. Comparatively higher ME, MAE, and RMSE of MODIS Aqua retrieved AOD and precipitable water vapour during the monsoon season is possibly due to the effect of clouds in this season. The correlation between AERONET and MODIS Aqua retrieved AOD and atmospheric water vapour ranges from 0.702 to 0.84 and 0.655 to 0.853, respectively, indicating good seasonal correlations.

4.3.2. Comparison of MODIS Terra Products

The station wise comparison of MODIS Terra retrieved AOD550 against transformed AERONET AOD at 550 nm from measured AOD at 500 nm at the IGP stations is performed through scatterplots in Figure S5. The figure also consists of two lines indicating expected error (EE) range of MODIS Terra retrieved AOD as ±(0.05 + 0.2 × AOD), as explained by Chu [74]. It is observed that at Bhola, Dhaka University, Gandhi College, Kanpur, Lahore and New Delhi a significant portion of the points lie above the upper limit of expected error line. Similarly, at Karachi, Lumbini, and Pantnagar a significant portion of the points lie below the lower limit of expected error line. The figures indicate that in general the majority of MODIS Terra retrieved AOD are within the expected error limits. Figure S6 presents the share of the MODIS Terra AOD values that lie within, above and below the expected error range where AERONET AOD is assumed to be actual AOD. The figure indicates that in all of the stations, except Bhola, Pantnagar, and Lumbini, more than 60% of MODIS Terra AOD data lie within the expected error range for the IGP stations. The figure also shows that more than 65% of the MODIS Terra AOD data across IGP stations are within the expected error range.
The station wise statistical comparison of the MODIS Terra AOD and precipitable water vapour with the AERONET measured AOD and atmospheric water vapour is presented in Table 7. It is observed that the station wise ME of the MODIS Terra AOD ranges from −0.178 at Pantnagar to 0.115 at Bhola with an all station ME of 0.035. Similarly, the station wise MAE of MODIS Terra retrieved AOD ranges from 0.106 at Kanpur to 0.197 at Pantnagar with an all station MAE of 0.152. The station wise RMSE of MODIS Terra retrieved AOD vary from 0.162 at Kanpur to 0.262 at Dhaka University and the all station RMSE is 0.230. Station wise Pearson correlation coefficient of the MODIS Terra retrieved daily AOD with AERONET measured daily AOD vary from 0.572 at New Delhi to 0.907 at Lumbini. The Pearson Correlation coefficient of MODIS Terra retrieved AOD with AERONET AOD across all the stations in the IGP is 0.781. In summary, the MODIS Terra retrieved daily AOD at the IGP stations is also found to be similar to the AERONET measured AOD.
Scatterplots of the station wise MODIS Terra retrieved atmospheric water vapour and AERONET measured atmospheric water vapour are shown in Figure S7. Even though MODIS Terra somewhat overestimated the atmospheric water vapour at Karachi, Kanpur, and New Delhi and somewhat underestimated at Bhola, Lumbini, and Pantnagar; overall MODIS Terra derived daily atmospheric water vapour is very similar to that of AERONET measured atmospheric water vapour because most the points are close to the 1:1 line at all stations in the IGP (Figure S7). The station wise ME of MODIS Terra derived atmospheric water vapour vary from −0.651 cm at Lumbini to 0.543 cm at New Delhi and across all of the stations in the IGP the ME is 0.212 cm (Table 7). The station wise MAE ranges from 0.425 cm at Lahore to 0.690 cm at Lumbini and across all the stations the MAE is 0.483 cm. The RMSE of the MODIS Terra derived atmospheric water vapour across all the stations in the IGP is 0.646 cm. The correlation coefficient of the MODIS derived atmospheric water vapour with AERONET measured atmospheric water vapour across all of the stations in the IGP is 0.880, which indicates a good correlation.
For the season wise comparison, the scatterplots of MODIS Terra retrieved AOD with AERONET AOD in four seasons (winter, pre-monsoon, monsoon, and post monsoon) at all stations of the IGP are plotted in Figure S8. Like MODIS Aqua seasonal plot, in this figure, also, there is more variation in the monsoon season when compared to other seasons, which may be also due to the effects of clouds in MODIS Terra retrieved AOD. However, the majority of points are near to the 1:1 line, indicating that the MODIS Terra retrieved AOD is similar to AERONET measured AOD.
The statistical results of season wise evaluation of MODIS Terra retrieved AOD and precipitable water vapour with the AERONET AOD and atmospheric water vapour is presented in Table 8. The ME of the MODIS Terra retrieved AOD vary from −0.016 cm during the pre-monsoon to 1.508 cm during the monsoon season. Comparatively small MAE and RMSE on seasonal MODIS Terra derived AOD is obtained during the pre-monsoon season with values 0.126 cm and 0.181 cm, respectively, and larger MAE and RMSE during the monsoon season with values 1.100 and 0.673, respectively. The seasonal Pearson correlation coefficient of MODIS Terra derived AOD and AERONET AOD vary from 0.713 in the monsoon season to 0.834 in the post monsoon season, which indicates good seasonal correlations. The ME of the MODIS Terra retrieved atmospheric water vapour ranges from 0.079 cm during post monsoon season to 0.573 cm during monsoon season. Similarly, comparatively higher MAE and RMSE on MODIS Terra derived atmospheric water vapour is obtained during the monsoon season with values 0.799 cm and 1.015 cm, respectively. The seasonal Pearson correlation coefficient of MODIS Terra derived precipitable water vapour and the AERONET water vapour ranges from 0.598 during winter to 0.820 during monsoon season. It is observed that comparatively more error on the MODIS Terra products is observed during monsoon season than other seasons, which may be due to the effect of clouds. After comparing the seasonal and station wise errors and correlation coefficients, it is found that the MODIS Terra retrieved products in general are found to be close to the AERONET products.

4.4. Evaluation of Model with MODIS Products

The developed year-round ADRF model is evaluated by using the MODIS Aqua and MODIS Terra retrieved AOD and atmospheric water vapour in the following sections.

4.4.1. Evaluation of the Model with MODIS Aqua Products

By using the MODIS Aqua derived AOD and daily mean atmospheric water vapour in the developed year-round ADRF model, the daily ADRF is estimated and it is plotted against AERONET ADRF in Figure 3. Since the majority of the points are clustered near to the 1:1 line in almost all stations, the estimated ADRF are similar to the AERONET ADRF. However, in the stations like Kolkata, New Delhi and Bhola the estimated ADRF showed more deviation from the AERONET observation when compared to other stations, which may be due to less number of data points compared to other stations. The test results of the year-round model estimated ADRF by using the MODIS Aqua AOD and atmospheric water vapour is presented in Table 9. It is observed that the average error ranged from −15.070 Wm−2 at Bhola to 37.429 Wm−2 at Kolkata and the average error of the model with all the stations in IGP is only 1.739 Wm−2. The MAE varies from 15.083 Wm−2 at Karachi to 40.715 Wm−2 at Kolkata and the MAE of all stations of IGP is limited to 21.822 Wm−2. Similarly, the station wise RMSE value fluctuated from 20.810 Wm−2 at Karachi to 45.397 Wm−2 at Kolkata and the RMSE value across all of stations in the IGP of the model with MODIS Aqua AOD and atmospheric water vapour is 30.700 Wm−2. Except New Delhi, Pantnagar, and Lahore, the station wise Pearson correlation coefficient of the year-round model estimated ADRF from MODIS Aqua AOD and precipitable water vapour is found to be above 0.6 in all stations of IGP and the correlation coefficient of the model across all the stations in the IGP is found to be 0.66. These data indicate that the year round ADRF model at the surface using inputs of MODIS Aqua AOD and precipitable water vapour provided fairly reliable estimates of daily ADRF in the IGP region.

4.4.2. Evaluation of the Model with MODIS Terra Products

The estimated ADRF by using inputs of MODIS Terra AOD and daily mean precipitable water vapour in the year-round model is compared with AERONET ADRF in the IGP stations through scatterplots in Figure 4. Except Bhola, Kolkata, and New Delhi, the station wise scatterplots in the stations of IGP tend to follow the 1:1 line, indicating an agreement of the estimation with the AERONET ADRF. More deviation of estimated ADRF in Kolkata, New Delhi, and Bhola may be due to the low number of data points at those stations. The test results for the evaluation of the estimated ADRF from the year-round model whileusing MODIS TERRA AOD and atmospheric water vapour inputs is given in Table 10. The table indicates that the station wise average error varies from −21.532 Wm−2 at Bhola to 28.748 Wm−2 at Kolkata and the average error using all the stations in the IGP is −2.818 Wm−2. The MAE and RMSE of the model for all stations in the IGP while using MODIS Terra AOD and precipitable water vapour is 22.668 Wm−2 and 33.08 Wm−2 respectively. The Pearson correlation coefficient of the estimated value of the model for all stations of the IGP with MODIS Terra AOD and precipitable water vapour is 0.654, indicating good correlation between estimated ADRF and AERONET ADRF in the IGP region.

4.5. Comparison of the Model Estimation from MODIS Aqua and Terra Products

While comparing the evaluation results of ADRF estimated from MODIS Aqua and MODIS Terra in Table 9 and Table 10, respectively, it is observed that the ADRF estimated from both the products provided almost similar results. It is found that the results from the MODIS Aqua is slightly superior than MODIS Terra, because of low average error (1.739 Wm−2 against −2.818 Wm−2), MAE (21.822 Wm−2 against 22.668 Wm−2), and RMSE (30.700 Wm−2 against 33.080 Wm−2) in all the stations of the IGP. Moreover, the Pearson correlation coefficient of the ADRF estimated from MODIS Aqua AOD and atmospheric water vapour in all stations of the IGP is marginally higher than that from MODIS Terra (0.660 against 0.654). In summary, the results of the ADRF model with MODIS Aqua products is almost similar to that from MODIS Terra products in the IGP, but MODIS Aqua products provided a slightly better estimate of ADRF when compared to that of MODIS Terra products in the IGP.

4.6. Comparison of Model Estimated ADRF with Published SBDART Results

The SBDART model is considered to be a comprehensive reliable model to estimate radiative forcing due to the atmospheric aerosols. In Table 11, the performance of the ADRF model is compared against published SBDART model results at Lahore and Karachi from Alam et al. [95,96]. The ADRF model estimated monthly ADRF at the surface for Karachi during July 2006 and November 2010 and Lahore during November 2010 to be consistent with the published SBDART results. It is shown that the ME of year-round model is less in both the periods July 2006 and November 2010 than that of SBDART model. Since MAE and RMSE from the SBDART model are less than from the year-round model at both stations, SBDART is found to be a better model than the year round ADRF model to estimate ADRF at Lahore and Karachi. Similarly, the SBDART model performed better than the year round ADRF model with respect to Pearson correlation coefficient at both stations. In spite of the comparatively better performance of SBDART than the year round ADRF model at Lahore and Karachi, the results of the year round ADRF model are comparable to the complex SBDART model. Moreover, with respect to the input requirement (only two input parameters for the year round ADRF model against more than 60 input parameters for SBDART [48] and simplicity the ADRF model is an attractive alternative to SBDART and other complex models to estimate radiative forcing at the surface across the IGP region.
Regarding the limitations of this model, the performance of the model is mainly dependent upon the accuracy of those two input parameters that are derived from satellite data. Moreover, other limitation is that the accuracy of this model is only moderate. Moreover, the output of the model is limited to only daily radiative forcing. In spite of these limitations, because of simplicity and moderate accuracy, this could be used to study the effect of atmospheric aerosols on the natural systems in the IGP.

5. Summary and Conclusions

The IGP region is considered to have an extremely high loading of atmospheric aerosols in the south Asian region [97]. The high loading of atmospheric aerosols has not only negatively affected the public health and day to day life of people, but also the natural systems in the IGP. The ADRF is a measure to estimate the effect of atmospheric aerosols on the regional and global natural systems. Various studies indicate that there is a significant effect of atmospheric aerosols on solar radiation in the IGP. To estimate the ADRF at the BOA and TOA, radiative transfer models are used, and, among them, SBDART is found to be comprehensive and widely used. However, the complexity of SBDART, which requires more than 60 input parameters [48] and high processing time, are limitations to wider use. To address these limitations, here we developed a simple year-round model to estimate the daily radiative forcing due to atmospheric aerosols (ADRF) at the surface of the IGP through multiple regressions of AERONET AOD, atmospheric water vapour, and the radiative forcing at the surface using data from 2002 to 2015 at 10 stations in the IGP. The goodness of fit of the developed ADRF model is indicated by the adjusted R2 value of 0.834. The Jackknife method of delete one group (station data) was employed to study the stability of the model and the model was found to be robust because adjusted R2 fluctuated between 0.813 and 0.842 and the standard error varied from 13.791 to 15.098. Station wise and season wise evaluations of the model were performed and found that the model performed well in all seasons and stations.
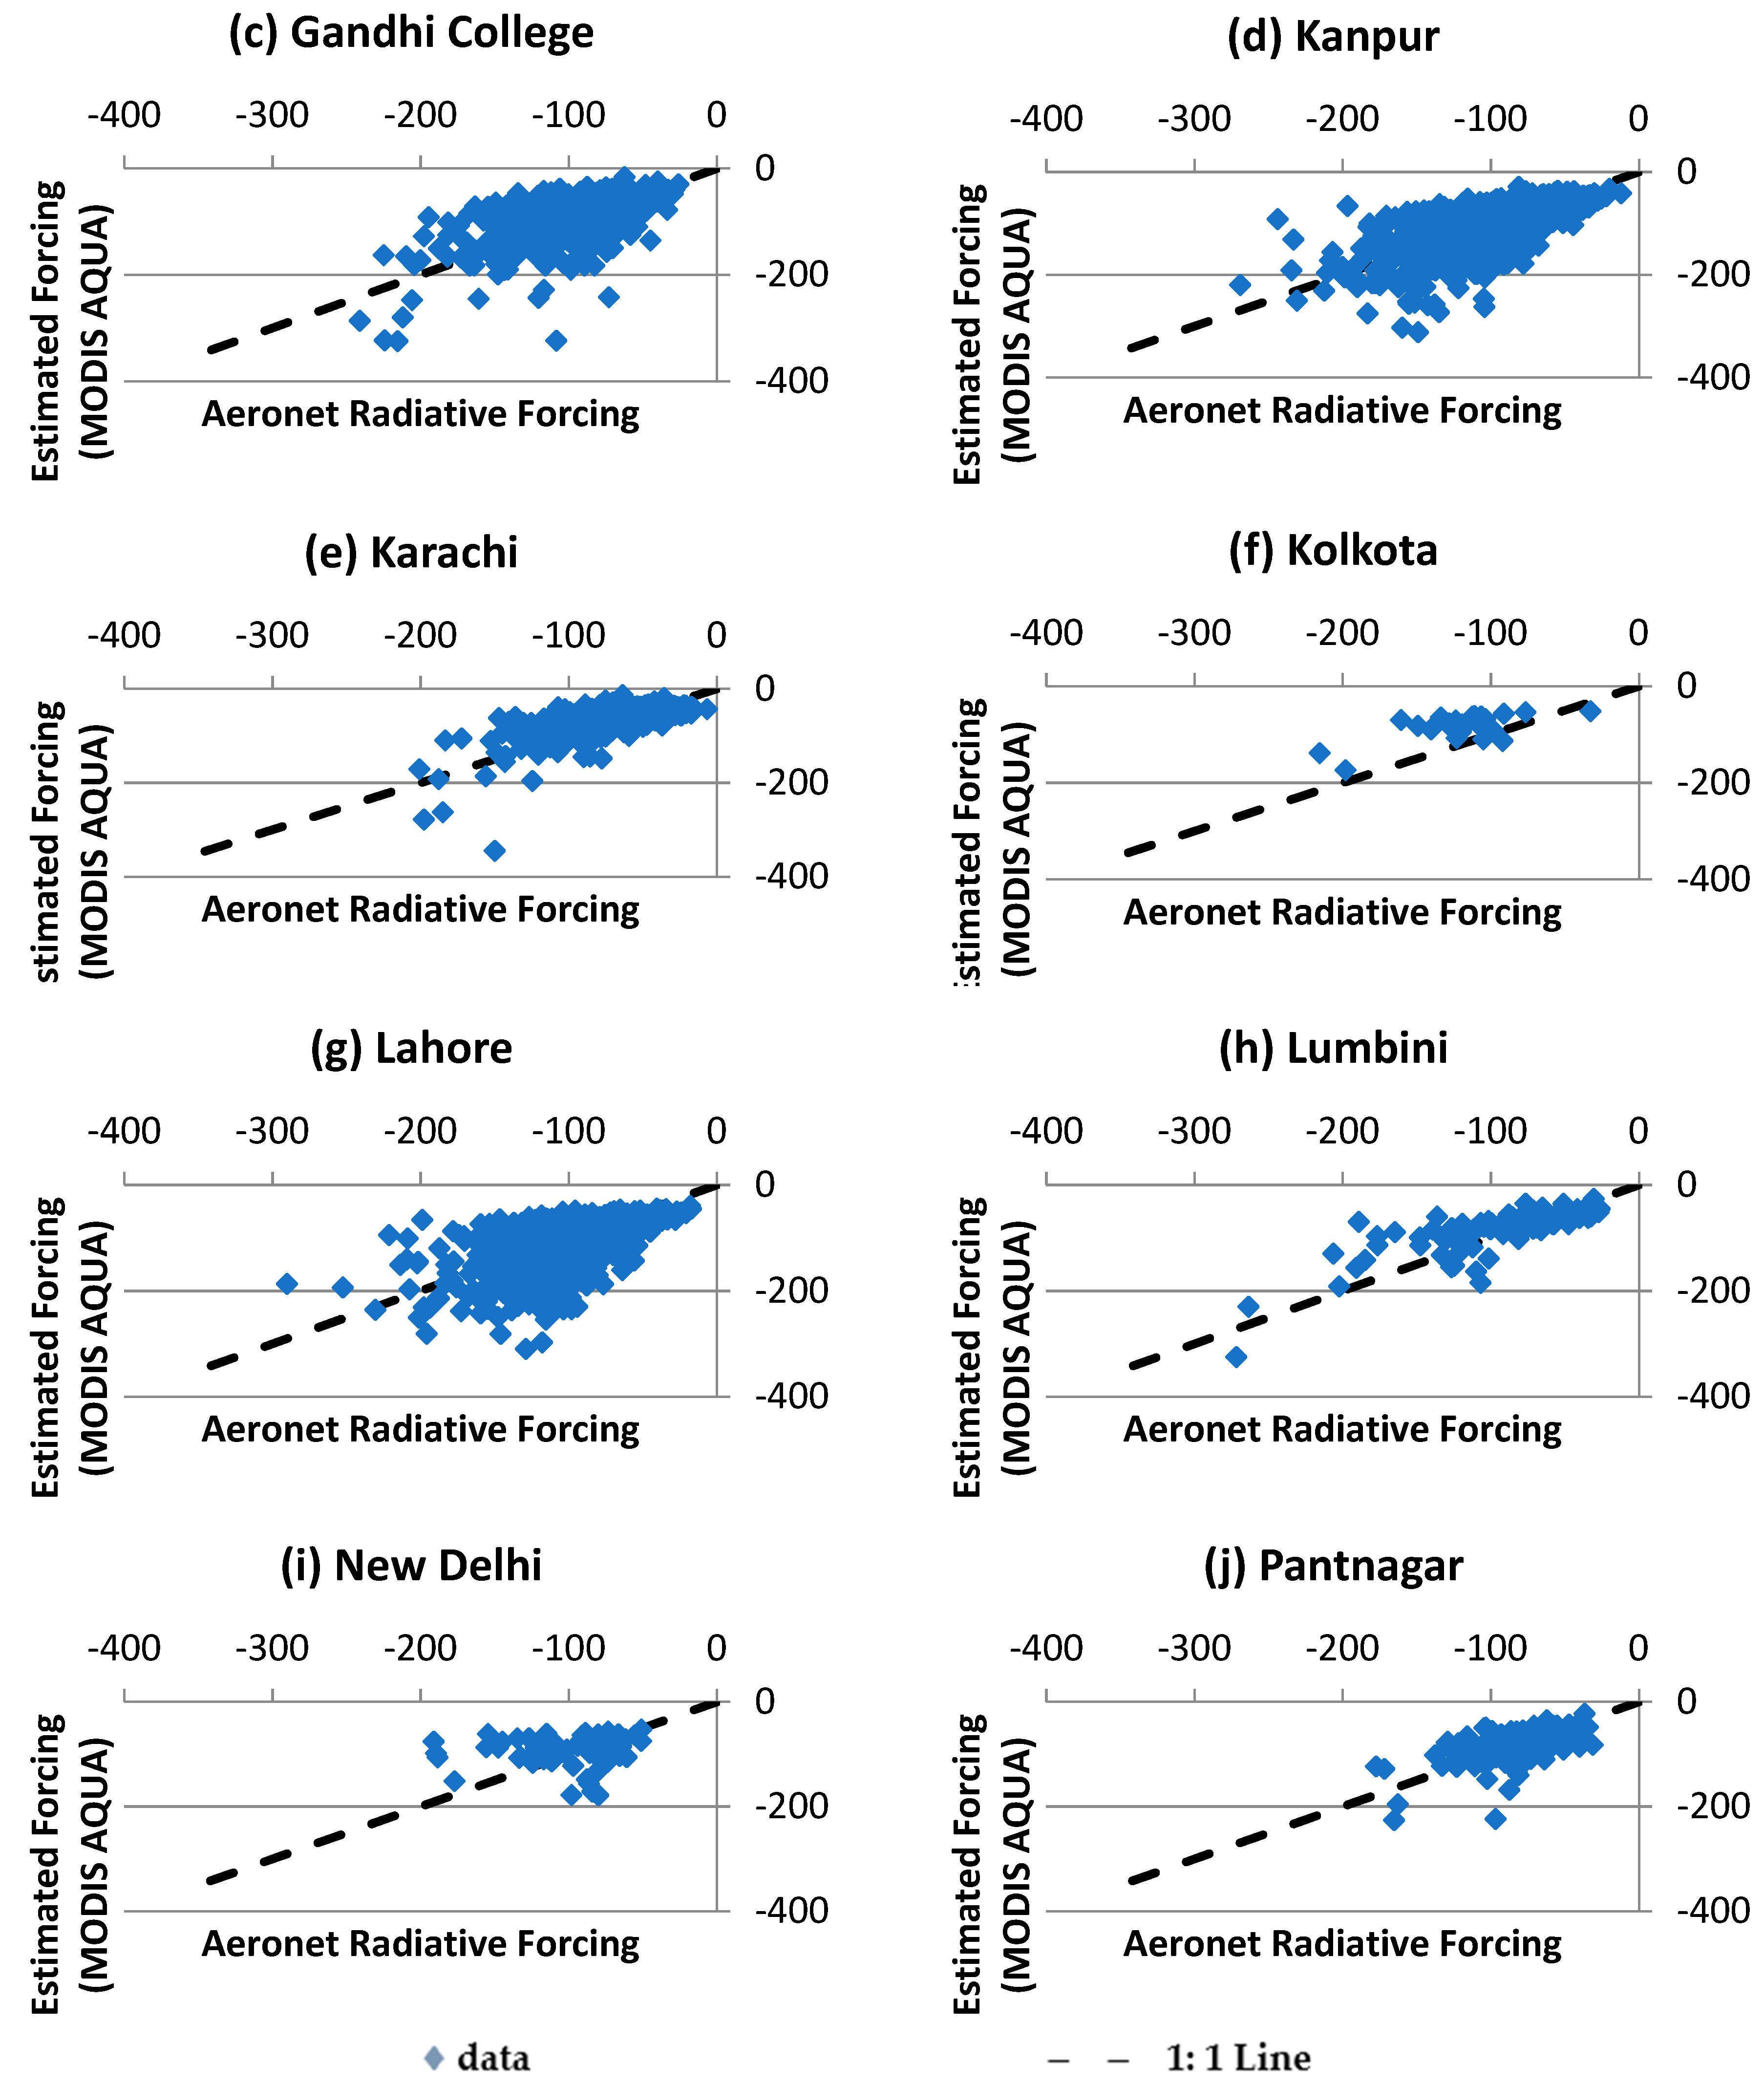
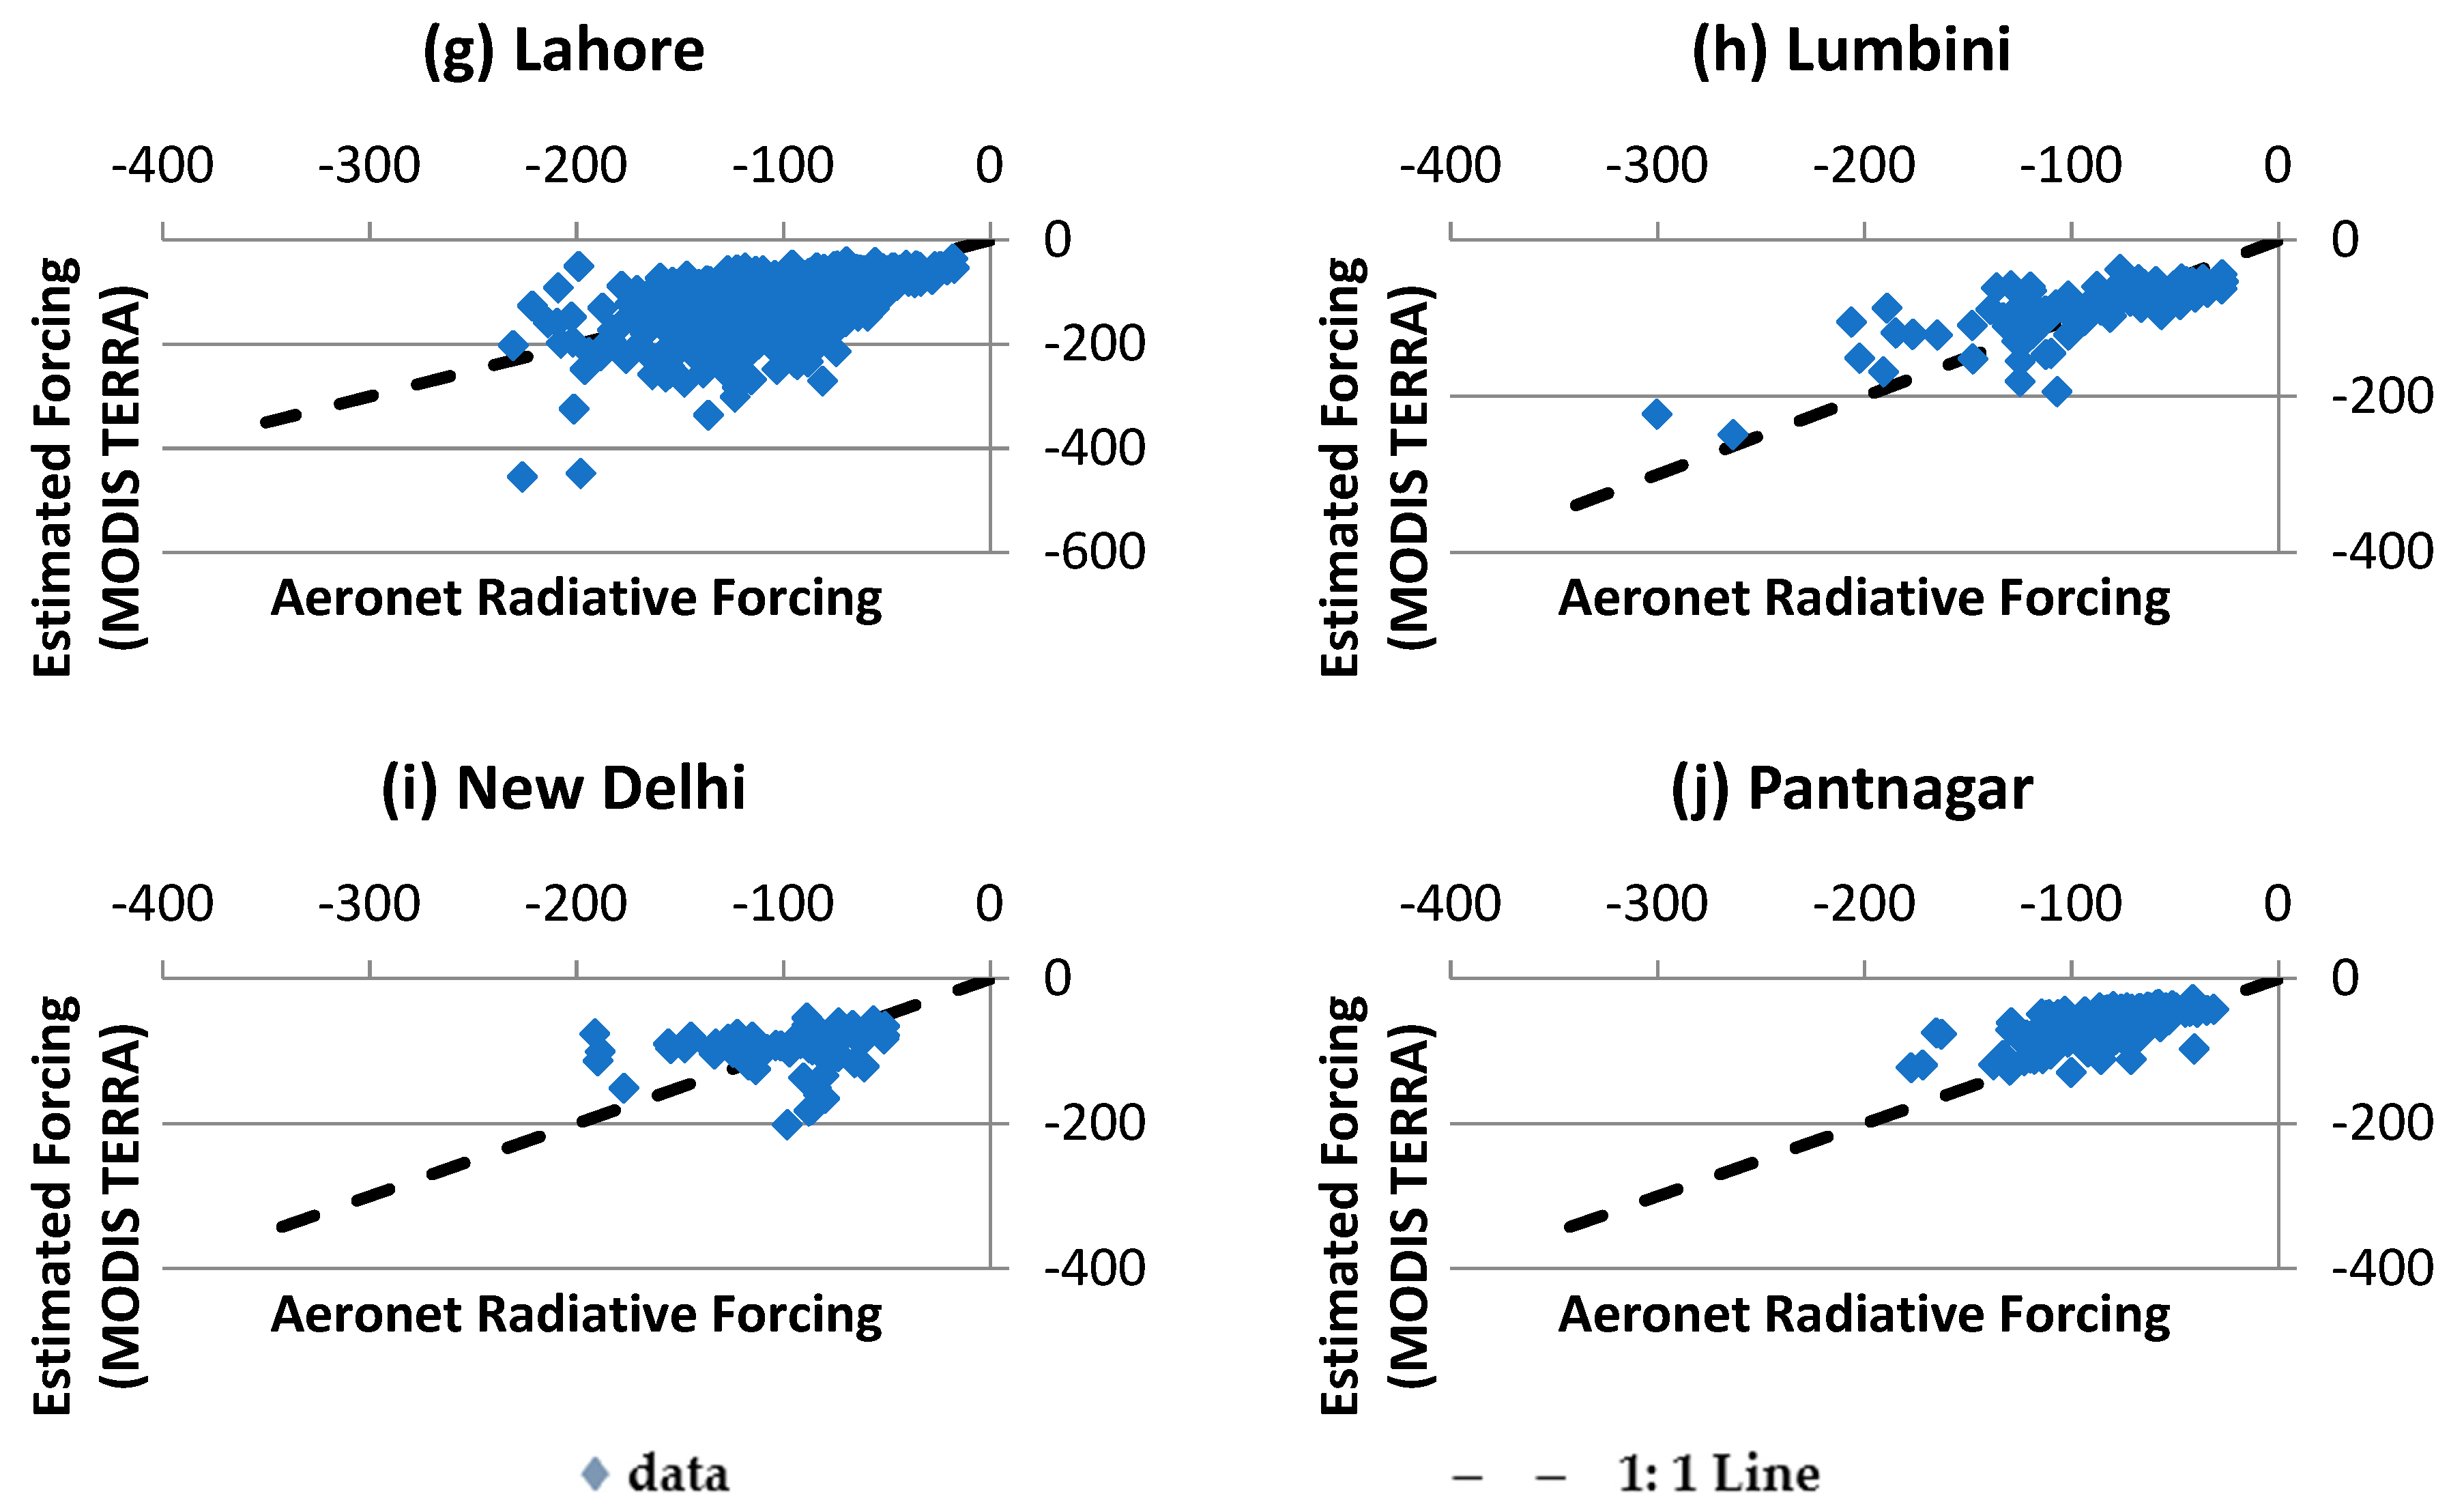
In order to use the year-round ADRF model beyond the AERONET stations, AOD and atmospheric water vapour products from MODIS Aqua and Terra (daily mean AOD at 550 nm and daily mean precipitable water vapour) were compared against AERONET AOD and atmospheric water vapour. Since the RMSE of MODIS Aqua derived daily mean AOD and precipitable water vapour in IGP stations is 0.210 and 0.638 cm with correlation coefficients 0.778 and 0.887, MODIS Aqua product is found to be similar to the AERONET product. Similarly, MODIS Terra product is also found to be similar to the AERONET products because RMSE of MODIS Terra retrieved daily mean AOD and precipitable water vapour is 0.230 and 0.646 cm, respectively, with Pearson correlation coefficients of 0.781 and 0.880, respectively.
By using the MODIS Aqua and MODIS Terra products, the year round ADRF is evaluated in the IGP stations and found that the model performed well with both MODIS products with RMSE 30.700 Wm−2 and 33.080 Wm−2 respectively with Pearson correlation coefficient 0.660 and 0.654 respectively. The ADRF model performed slightly better with MODIS Aqua products than MODIS Terra products. The ADRF model was also compared against the published SBDART results at Karachi and Lahore. The results indicate the ADRF model is comparable with the complex SBDART results. Even though SBDART is found to be better than the year round ADRF model, with respect to RMSE (7.16 Wm−2 against 11.52 Wm−2 at Karachi and 8.86 Wm−2 against 15.67 Wm−2 at Lahore) and correlation coefficients (0.92 against 0.82 at Karachi and 0.98 against 0.71 at Lahore), the developed year round model is much simpler and it requires less input parameters (two compared to more than 60 in SBDART) to estimate radiative forcing at the surface in the IGP.

Supplementary Materials

The following are available online at https://www.mdpi.com/2073-4433/9/10/405/s1, Figure S1: Comparison of MODIS Aqua Derived AOD with AERONET AOD at the IGP stations, Figure S2: Station wise comparison of MODIS Aqua AOD with AERONET AOD in terms of expected error (EE) for the IGP stations, Figure S3: Comparison of MODIS Aqua and AERONET derived Atmospheric Water vapour (in cm) at the IGP Stations, Figure S4: Comparison of MODIS Aqua derived AOD with AERONET AOD in four seasons in the IGP, Figure S5: Comparison of MODIS Terra derived AOD with AERONET AOD at the IGP stations, Figure S6: Station wise comparison of MODIS Terra AOD with AERONET AOD in terms of expected error (EE) in the IGP stations, Figure S7: Comparison of MODIS Terra derived atmospheric water vapour with AERONET atmospheric water vapour at the IGP stations, Figure S8: Comparison of MODIS Terra derived AOD with AERONET AOD in four seasons in the IGP.

Author Contributions

Conceptualization, S.S.; Formal analysis, S.S.; Supervision, M.C.P. and G.A.M.; Writing–Original draft, S.S.; Writing–Review & editing, M.C.P. and G.A.M.

Funding

This research received no external funding.

Acknowledgments

The lead author (S.S.) is thankful to Australian Centre for International Agricultural Research (ACIAR) for providing John Alright Fellowship (JAF) to pursue his PhD in the University of Melbourne. We thank the principal investigators and their staff for establishing and maintaining the AERONET sites used in this study. Also, thanks are owed to Brent N. Holben and AERONET team for their effort in making the data available. We also acknowledge the MODIS mission scientists and associated NASA personnel for the production of the data used in this research effort. We also would like to express our gratitude to three anonymous reviewers for their valuable suggestions in improving the manuscript.

Conflicts of Interest

The authors declare no conflicts of interest.

References

  1. Srivastava, A.K.; Dey, S.; Tripathi, S.N. Aerosol Characteristics over the Indo-Gangetic Basin: Implications to Regional Climate. In Atmospheric Aerosols—Regional Characteristics—Chemistry and Physics; Abdul-Razzak, H., Ed.; InTech: London, UK, 2012; pp. 47–79. [Google Scholar]
  2. Kumar, M.; Parmar, K.S.; Kumar, D.B.; Mhawish, A.; Broday, D.M.; Mall, R.K.; Banerjee, T. Long-Term Aerosol Climatology over Indo-Gangetic Plain: Trend, Prediction and Potential Source Fields. Atmos. Environ. 2018, 180, 37–50. [Google Scholar] [CrossRef]
  3. Ghude, S.D.; Chate, D.M.; Jena, C.; Beig, G.; Kumar, R.; Barth, M.C.; Pfister, G.G.; Fadnavis, S.; Pithani, P. Premature Mortality in India Due to PM2.5 and Ozone Exposure. Geophys. Res. Lett. 2016, 43, 4650–4658. [Google Scholar] [CrossRef]
  4. Krishna Moorthy, K.; Suresh Babu, S.; Manoj, M.R.; Satheesh, S.K. Buildup of Aerosols over the Indian Region. Geophys. Res. Lett. 2013, 40, 1011–1014. [Google Scholar] [CrossRef]
  5. Streets, D.G.; Bond, T.C.; Carmichael, G.R.; Fernandes, S.D.; Fu, Q.; He, D.; Klimont, Z.; Nelson, S.M.; Tsai, N.Y.; Wang, M.Q.; et al. An Inventory of Gaseous and Primary Aerosol Emissions in Asia in the Year 2000. J. Geophys. Res. Atmos. 2003, 108. [Google Scholar] [CrossRef]
  6. Venkataraman, C.; Habib, G.; Eiguren-Fernandez, A.; Miguel, A.H.; Friedlander, S.K. Residential Biofuels in South Asia: Carbonaceous Aerosol Emissions and Climate Impacts. Science 2005, 307, 1454–1456. [Google Scholar] [CrossRef] [PubMed]
  7. Mishra, A.K.; Shibata, T.; Srivastava, A. Synergistic Approach for the Aerosol Monitoring and Identification of Types over Indo-Gangetic Basin in Pre-Monsoon Season. Aerosol Air Qual. Res. 2014, 14, 767–782. [Google Scholar] [CrossRef]
  8. Kaskaoutis, D.G.; Kumar, S.; Sharma, D.; Singh, R.P.; Kharol, S.K.; Sharma, M.; Singh, A.K.; Singh, S.; Singh, A.; Singh, D. Effects of Crop Residue Burning on Aerosol Properties, Plume Characteristics, and Long-Range Transport over Northern India. J. Geophys. Res. Atmos. 2014, 119, 5424–5444. [Google Scholar] [CrossRef]
  9. Singh, R.P.; Kaskaoutis, D.G. Crop Residue Burning: A Threat to South Asian Air Quality. EOS 2014, 95, 333–334. [Google Scholar] [CrossRef] [Green Version]
  10. Rajput, P.; Sarin, M.; Sharma, D.; Singh, D. Characteristics and Emission Budget of Carbonaceous Species from Post-Harvest Agricultural-Waste Burning in Source Region of the Indo-Gangetic Plain. Tellus Ser. B Chem. Phys. Meteorol. 2014, 66, 1–12. [Google Scholar] [CrossRef]
  11. Rastogi, N.; Singh, A.; Sarin, M.M.; Singh, D. Temporal Variability of Primary and Secondary Aerosols over Northern India: Impact of Biomass Burning Emissions. Atmos. Environ. 2016, 125, 396–403. [Google Scholar] [CrossRef]
  12. WHO. Ambient Air Quality Database, WHO. April 2018. Available online: http://www.who.int/airpollution/en/ (accessed on 3 May 2018).
  13. Kumar, R.; Barth, M.C.; Pfister, G.G.; Delle Monache, L.; Lamarque, J.F.; Archer-Nicholls, S.; Tilmes, S.; Ghude, S.D.; Wiedinmyer, C.; Naja, M.; et al. How Will Air Quality Change in South Asia by 2050? J. Geophys. Res. Atmos. 2018, 123, 1840–1864. [Google Scholar] [CrossRef]
  14. Wild, M. Global Dimming and Brightening: A Review. J. Geophys. Res. 2009, 114, 1–31. [Google Scholar] [CrossRef]
  15. Kambezidis, H.D.; Kaskaoutis, D.G.; Kharol, S.K.; Moorthy, K.K.; Satheesh, S.K.; Kalapureddy, M.C.R.; Badarinath, K.V.S.; Sharma, A.R.; Wild, M. Multi-Decadal Variation of the Net Downward Shortwave Radiation over South Asia: The Solar Dimming Effect. Atmos. Environ. 2012, 50, 360–372. [Google Scholar] [CrossRef]
  16. Singh, J.; Bhattacharya, B.K.; Kumar, M. Solar Radiation and Evaporation Trend over India. J. Earth Sci. Eng. 2012, 2, 160–165. [Google Scholar]
  17. Dey, S.; Tripathi, S.N. Estimation of Aerosol Optical Properties and Radiative Effects in the Ganga Basin, Northern India, during the Wintertime. J. Geophys. Res. 2007, 112, D03203. [Google Scholar] [CrossRef]
  18. Ramanathan, V.; Crutzen, P.J.; Lelieveld, J.; Mitra, A.P.; Althausen, D.; Anderson, J.; Andreae, M.O.; Cantrell, W.; Cass, G.R.; Chung, C.E.; et al. Indian Ocean Experiment: An Integrated Analysis of the Climate Forcing and Effects of the Great Indo-Asian Haze. J. Geophys. Res. 2001, 106, 28371. [Google Scholar] [CrossRef]
  19. Ramanathan, V.; Ramana, M.V. Persistent, Widespread, and Strongly Absorbing Haze over the Himalayan Foothills and the Indo-Gangetic Plains. Pure Appl. Geophys. 2005, 162, 1609–1626. [Google Scholar] [CrossRef]
  20. Ramanathan, V. Atmospheric Brown Clouds: Health, Climate and Agriculture Impacts. Scripta Varia. 2006. Available online: http://www.academyofsciences.va/content/dam/accademia/pdf/sv106/sv106-ramanathan.pdf (accessed on 29 September 2018).
  21. Ramanathan, V.; Ramana, M.V.; Roberts, G.; Kim, D.; Corrigan, C.; Chung, C.; Winker, D. Warming Trends in Asia Amplified by Brown Cloud Solar Absorption. Nature 2007, 448, 575–578. [Google Scholar] [CrossRef] [PubMed]
  22. Bonasoni, P.; Laj, P.; Marinoni, A.; Sprenger, M.; Angelini, F.; Arduini, J. Atmospheric Brown Clouds in the Himalayas: First Two Years of Continuous Observations at the Nepal-Climate Observatory at Pyramid (5079 M). Atmos. Chem. Phys. 2010, 10, 7515–7531. [Google Scholar] [CrossRef] [Green Version]
  23. Devara, P.C.S.; Manoj, M.G. Aerosol–cloud–precipitation Interactions: A Challenging Problem in Regional Environment and Climate Research. Particuology 2013, 11, 25–33. [Google Scholar] [CrossRef]
  24. Gautam, R.; Hsu, N.C.; Kafatos, M.; Tsay, S.C. Influences of Winter Haze on Fog/Low Cloud over the Indo-Gangetic Plains. J. Geophys. Res. Atmos. 2007, 112, 1–11. [Google Scholar] [CrossRef]
  25. Syed, F.S.; Körnich, H.; Tjernström, M. On the Fog Variability over South Asia. Clim. Dyn. 2012, 39, 2993–3005. [Google Scholar] [CrossRef]
  26. Shrestha, S.; Moore, G.A.; Peel, M.C. Trends in Winter Fog Events in the Terai Region of Nepal. Agric. For. Meteorol. 2018, 259, 118–130. [Google Scholar] [CrossRef]
  27. Jenamani, R.K. Alarming Rise in Fog and Pollution Causing a Fall in Maximum Temperature over Delhi. Curr. Sci. 2007, 93, 313–322. [Google Scholar]
  28. Samra, J.S.; Singh, G.; Ramakrishna, Y. Cold Wave of 2002–03: Impact on Agriculture; Central Research Institute for Dryland Agriculture: Hyderabad, India, 2003. [Google Scholar]
  29. Singh, S.; Singh, D. Recent Fog Trends and Its Impact on Wheat Productivity in NW Plains in India. In Proceedings of the 5th International Conference on Fog, Fog Collection and Dew, Münster, Germany, 25–30 July 2010. [Google Scholar]
  30. Auffhammer, M.; Ramanathan, V.; Vincent, J.R. Integrated Model Shows That Atmospheric Brown Clouds and Greenhouse Gases Have Reduced Rice Harvests in India. Proc. Natl. Acad. Sci. USA 2006, 103, 19668–19672. [Google Scholar] [CrossRef] [PubMed]
  31. Latha, R.; Murthy, B.S.; Lipi, K.; Srivastava, M.K.; Kumar, M. Absorbing Aerosols, Possible Implication to Crop Yield—A Comparison between IGB Stations. Aerosol. Air Qual. Res. 2017, 17, 693–705. [Google Scholar] [CrossRef]
  32. Ahmed, M.; Hassan, F. Cumulative Effect of Temperature and Solar Radiation on Wheat Yield. Not. Bot. Horti Agrobot. Cluj-Napoca 2011, 39, 146–152. [Google Scholar] [CrossRef]
  33. Chameides, W.L.; Yu, H.; Liu, S.C.; Bergin, M.; Zhou, X.; Mearns, L.; Wang, G.; Kiang, C.S.; Saylor, R.D.; Luo, C.; et al. Case Study of the Effects of Atmospheric Aerosols and Regional Haze on Agriculture: An Opportunity to Enhance Crop Yields in China through Emission Controls? Proc. Natl. Acad. Sci. USA 1999, 96, 13626–13633. [Google Scholar] [CrossRef] [PubMed]
  34. Chung, C.E. Aerosol Direct Radiative Forcing: A Review. In Atmospheric Aerosols—Regional Characteristics—Chemistry and Physics; Abdul-Razzak, H., Ed.; InTech: London, UK, 2012; pp. 379–394. [Google Scholar]
  35. Dey, S.; Tripathi, S.N. Aerosol Direct Radiative Effects over Kanpur in the Indo-Gangetic Basin, Northern India: Long-Term (2001–2005) Observations and Implications to Regional Climate. J. Geophys. Res. Atmos. 2008, 113, 1–20. [Google Scholar] [CrossRef]
  36. Ramachandran, S.; Kedia, S. Radiative Effects of Aerosols over Indo-Gangetic Plain: Environmental (Urban vs. Rural) and Seasonal Variations. Environ. Sci. Pollut. Res. 2012, 19, 2159–2171. [Google Scholar] [CrossRef] [PubMed]
  37. Das, S.K.; Chatterjee, A.; Ghosh, S.K.; Raha, S. An Integrated Campaign for Investigation of Winter-Time Continental Haze over Indo-Gangetic Basin and Its Radiative Effects. Sci. Total Environ. 2015, 533, 370–382. [Google Scholar] [CrossRef] [PubMed]
  38. Kaskaoutis, D.G.; Sinha, P.R.; Vinoj, V.; Kosmopoulos, P.G.; Tripathi, S.N.; Misra, A.; Sharma, M.; Singh, R.P. Aerosol Properties and Radiative Forcing over Kanpur during Severe Aerosol Loading Conditions. Atmos. Environ. 2013, 79, 7–19. [Google Scholar] [CrossRef]
  39. Srivastava, R.; Ramachandran, S. The Mixing State of Aerosols over the Indo-Gangetic Plain and Its Impact on Radiative Forcing. Q. J. R. Meteorol. Soc. 2013, 139, 137–151. [Google Scholar] [CrossRef]
  40. Praveen, P.S.; Ahmed, T.; Kar, A.; Rehman, I.H.; Ramanathan, V. Link between Local Scale BC Emissions in the Indo-Gangetic Plains and Large Scale Atmospheric Solar Absorption. Atmos. Chem. Phys. 2012, 12, 1173–1187. [Google Scholar] [CrossRef] [Green Version]
  41. Patel, P.N.; Kumar, R. Estimation of Aerosol Characteristics and Radiative Forcing during Dust Events over Dehradun. Aerosol. Air Qual. Res. 2015, 15, 2082–2093. [Google Scholar] [CrossRef]
  42. Sadavarte, P.; Venkataraman, C.; Cherian, R.; Patil, N.; Madhavan, B.L.; Gupta, T.; Kulkarni, S.; Carmichael, G.R.; Adhikary, B. Seasonal Differences in Aerosol Abundance and Radiative Forcing in Months of Contrasting Emissions and Rainfall over Northern South Asia. Atmos. Environ. 2015, 125, 512–523. [Google Scholar] [CrossRef]
  43. Sathiyamoorthy, V.; Arya, R.; Kishtawal, C.M. Radiative Characteristics of Fog over the Indo-Gangetic Plains during Northern Winter. Clim. Dyn. 2016, 47, 1793–1806. [Google Scholar] [CrossRef]
  44. Bibi, H.; Alam, K.; Bibi, S. Estimation of Shortwave Direct Aerosol Radiative Forcing at Four Locations on the Indo-Gangetic Plains: Model Results and Ground Measurement. Atmos. Environ. 2017, 163, 166–181. [Google Scholar] [CrossRef]
  45. Ricchiazzi, P.; Yang, S.; Gautier, C.; Sowle, D. SBDART: A Research and Teaching Software Tool for Plane-Parallel Radiative Transfer in the Earth’s Atmosphere. Bull. Am. Meteorol. Soc. 1998, 79, 2101–2114. [Google Scholar] [CrossRef]
  46. Singh, S.; Soni, K.; Bano, T.; Tanwar, R.S.; Nath, S.; Arya, B.C. Clear-Sky Direct Aerosol Radiative Forcing Variations over Mega-City Delhi. Ann. Geophys. 2010, 28, 1157–1166. [Google Scholar] [CrossRef]
  47. Tiwari, S.; Dumka, U.C.; Kaskaoutis, D.G.; Ram, K.; Panicker, A.S.; Srivastava, M.K.; Tiwari, S.; Attri, S.D.; Soni, V.K.; Pandey, A.K. Aerosol Chemical Characterization and Role of Carbonaceous Aerosol on Radiative Effect over Varanasi in Central Indo-Gangetic Plain. Atmos. Environ. 2016, 125, 437–449. [Google Scholar] [CrossRef]
  48. Fu, Y.; Zhu, J.; Yang, Y.; Yuan, R.; Liu, G.; Xian, T.; Liu, P. Grid-Cell Aerosol Direct Shortwave Radiative Forcing Calculated Using the SBDART Model with MODIS and AERONET Observations: An Application in Winter and Summer in Eastern China. Adv. Atmos. Sci. 2017, 34, 952–964. [Google Scholar] [CrossRef]
  49. Gautier, C.; Landsfeld, M. Surface Solar Radiation Flux and Cloud Radiative Forcing for the Atmospheric Radiation Measurement (ARM) Southern Great Plains (SGP): A Satellite, Surface Observations, and Radiative Transfer Model Study. J. Atmos. Sci. 1997, 54, 1289–1307. [Google Scholar] [CrossRef]
  50. Huntingford, C.; Cox, P.M.; Mercado, L.M.; Sitch, S.; Bellouin, N.; Boucher, O.; Gedney, N. Highly Contrasting Effects of Different Climate Forcing Agents on Terrestrial Ecosystem Services. Philos. Trans. R. Soc. A Math. Phys. Eng. Sci. 2011, 369, 2026–2037. [Google Scholar] [CrossRef] [PubMed] [Green Version]
  51. Holben, B.N.; Eck, T.F.; Slutsker, I.; Tanré, D.; Buis, J.P.; Setzer, A.; Vermote, E.; Reagan, J.A.; Kaufman, Y.J.; Nakajima, T.; et al. AERONET—A Federated Instrument Network and Data Archive for Aerosol Characterization. Remote Sens. Environ. 1998, 66, 1–16. [Google Scholar] [CrossRef] [Green Version]
  52. García, O.E.; Díez, A.M.; Expósito, F.J.; Díaz, J.P.; Dubovik, O.; Dubuisson, P.; Roger, J.C.; Eck, T.F.; Sinyuk, A.; Derimian, Y.; et al. Validation of AERONET Estimates of Atmospheric Solar Fluxes and Aerosol Radiative Forcing by Ground-Based Broadband Measurements. J. Geophys. Res. Atmos. 2008, 113, 1–16. [Google Scholar] [CrossRef]
  53. Kaskaoutis, D.G.; Houssos, E.E.; Houssos, E.E.; Bartzokas, Á.A.; Goto, D.; Nastos, P.T.; Sinha, P.R.; Kharol, S.K.; Kosmopoulos, P.G.; Singh, R.P.; et al. Synoptic Weather Conditions and Aerosol Episodes over Indo-Gangetic Plains, India. Clim. Dyn. 2014, 43, 2313–2331. [Google Scholar] [CrossRef]
  54. Srivastava, A.K.; Tripathi, S.N.; Dey, S.; Kanawade, V.P.; Tiwari, S. Inferring Aerosol Types over the Indo-Gangetic Basin from Ground Based Sunphotometer Measurements. Atmos. Res. 2012, 109–110, 64–75. [Google Scholar] [CrossRef]
  55. Zhuang, B.L.; Li, S.; Wang, T.J.; Deng, J.J.; Xie, M.; Yin, C.Q.; Zhu, J.L. Direct Radiative Forcing and Climate Effects of Anthropogenic Aerosols with Different Mixing States over China. Atmos. Environ. 2013, 79, 349–361. [Google Scholar] [CrossRef]
  56. Remer, L.A.; Kaufman, Y.J.; Tanré, D.; Mattoo, S.; Chu, D.A.; Martins, J.V.; Li, R.-R.; Ichoku, C.; Levy, R.C.; Kleidman, R.G.; et al. The MODIS Aerosol Algorithm, Products, and Validation. J. Atmos. Sci. 2005, 62, 947–973. [Google Scholar] [CrossRef] [Green Version]
  57. Shrestha, A.; Agrawal, N.; Alfthan, B.; Bajracharya, S.; Maréchal, J.; van Oort, B. (Eds.) The Himalayan Climate and Water Atlas: Impact of Climate Change on Water Resources in Five of Asia’s Major River Basins; ICIMOD, GRID-Arendal and CICERO: Kathmandu, Nepal, 2015. [Google Scholar]
  58. Mani, M.S. Biogeography of the Indo-Gangetic Plain. In Ecology and Biogeography in India; Mani, M.S., Ed.; Springer: Dordrecht, The Netherlands, 1974; pp. 689–697. [Google Scholar]
  59. Gupta, R.; Seth, A. A Review of Resource Conserving Technologies for Sustainable Management of the Rice-Wheat Cropping Systems of the Indo-Gangetic Plains (IGP). Crop Prot. 2007, 26, 436–447. [Google Scholar] [CrossRef]
  60. Sharma, B.; Amarasinghe, U.; Xueliang, C.; de Condappa, D.; Shah, T.; Mukherji, A.; Bharati, L.; Ambili, G.; Qureshi, A.; Pant, D.; et al. The Indus and the Ganges: River Basins under Extreme Pressure. Water Int. 2010, 35, 493–521. [Google Scholar] [CrossRef]
  61. Taneja, G.; Pal, B.D.; Joshi, P.K.; Aggarwal, P.K.; Tyagi, N.K. Farmerss Preferences for Climate-Smart Agriculture: An Assessment in the Indo-Gangetic Plain; International Food Policy Research Institute (IFPRI): Washington, DC, USA, 2014. [Google Scholar]
  62. Lal, D.M.; Ghude, S.D.; Patil, S.D.; Kulkarni, S.H.; Jena, C.; Tiwari, S.; Srivastava, M.K. Tropospheric Ozone and Aerosol Long-Term Trends over the Indo-Gangetic Plain (IGP), India. Atmos. Res. 2012, 116, 82–92. [Google Scholar] [CrossRef]
  63. Department of Economic and Social Affairs Population Division. World Urbanization Prospects, 2014 Revisions (ST/ESA/SER.A/366); Department of Economic and Social Affairs Population Division: New York, NY, USA, 2015. [Google Scholar]
  64. Erenstein, O.; Thorpe, W.; Singh, J.; Varma, A. Crop–Livestock Interactions and Livelihoods in the Trans-Gangetic Plains, India; International Livestock Research Institute: Nairobi, Kenya, 2007. [Google Scholar]
  65. Dubovikl, O.; King, M.D. A Flexible Inversion Algorithm for Retrieval of Aerosol Optical Properties from Sun and Sky Radiance Measurements. J. Geophys. Res. 2000, 105, 20673–20696. [Google Scholar] [CrossRef]
  66. NASA. AERONET Inversion Products. Available online: https://aeronet.gsfc.nasa.gov/new_web/Documents/Inversion_products_V2.pdf (accessed on 5 July 2016).
  67. NASA. MODIS (Moderate Resolution Imaging Spectroradiometer). Available online: http://modis.gsfc.nasa.gov/about/media/modis_brochure.pdf (accessed on 26 September 2016).
  68. Levy, R.C.; Mattoo, S.; Munchak, L.A.; Remer, L.A.; Sayer, A.M.; Patadia, F.; Hsu, N.C. The Collection 6 MODIS Aerosol Products over Land and Ocean. Atmos. Meas. Tech. 2013, 6, 2989–3034. [Google Scholar] [CrossRef]
  69. Eck, T.F.; Holben, B.N.; Reid, J.S.; Dubovik, O.; Smirnov, A.; O’Neill, N.T.; Slutsker, I.; Kinne, S. Wavelength Dependence of the Optical Depth of Biomass Burning, Urban, and Desert Dust Aerosols. J. Geophys. Res. 1999. [Google Scholar] [CrossRef]
  70. Dubovik, O.; Smirnov, A.; Holben, B.N.; King, M.D.; Kaufman, Y.J.; Eck, T.F.; Slutsker, I. Accuracy Assessments of Aerosol Optical Properties Retrieved from Aerosol Robotic Network (AERONET) Sun and Sky Radiance Measurements. J. Geophys. Res. 2000, 105, 9791–9806. [Google Scholar] [CrossRef]
  71. Dubovik, O.; Holben, B.; Eck, T.F.; Smirnov, A.; Kaufman, Y.J.; King, M.D.; Tanré, D.; Slutsker, I. Variability of Absorption and Optical Properties of Key Aerosol Types Observed in Worldwide Locations. J. Atmos. Sci. 2002, 59, 590–608. [Google Scholar] [CrossRef] [Green Version]
  72. Holben, B.N.; Eck, T.F.; Slutsker, I.; Smirnov, A.; Sinyuk, A.; Schafer, J.; Giles, D.; Dubovik, O. AERONET’s Version 2.0 Quality Assurance Criteria. Remote Sens. Atmos. Clouds 2006. [Google Scholar] [CrossRef]
  73. Pérez-ramírez, D.; Whiteman, D.N.; Smirnov, A.; Lyamani, H.; Holben, B.N.; Pinker, R.; Andrade, M.; Alados-Arboledas, L.; Whiteman, D.N.; Smirnov, A.; et al. Evaluation of AERONET Precipitable Water Vapor versus Microwave Radiometry, GPS, and Radiosondes at ARM Sites. J. Geophys. Res. Atmos. 2014, 119, 9596–9613. [Google Scholar] [CrossRef]
  74. Chu, D.A. Validation of MODIS Aerosol Optical Depth Retrieval over Land. Geophys. Res. Lett. 2002, 29. [Google Scholar] [CrossRef]
  75. Remer, L.A.; Kleidman, R.G.; Levy, R.C.; Kaufman, Y.J.; Tanré, D.; Mattoo, S.; Martins, J.V.; Ichoku, C.; Koren, I.; Yu, H.; et al. Global Aerosol Climatology from the MODIS Satellite Sensors. J. Geophys. Res. Atmos. 2008, 113, 1–18. [Google Scholar] [CrossRef]
  76. Hyer, E.J.; Reid, J.S.; Zhang, J. An Over-Land Aerosol Optical Depth Data Set for Data Assimilation by Filtering, Correction, and Aggregation of MODIS Collection 5 Optical Depth Retrievals. Atmos. Meas. Tech. 2011, 4, 379–408. [Google Scholar] [CrossRef] [Green Version]
  77. Mao, K.B.; Ma, Y.; Xia, L.; Chen, W.Y.; Shen, X.Y.; He, T.J.; Xu, T.R. Global Aerosol Change in the Last Decade: An Analysis Based on MODIS Data. Atmos. Environ. 2014, 94, 680–686. [Google Scholar] [CrossRef]
  78. Shi, Y.; Zhang, J.; Reid, J.S.; Holben, B.; Hyer, E.J.; Curtis, C. An Analysis of the Collection 5 MODIS Over-Ocean Aerosol Optical Depth Product for Its Implication in Aerosol Assimilation. Atmos. Chem. Phys. 2011, 11, 557–565. [Google Scholar] [CrossRef] [Green Version]
  79. Soni, K.; Parmar, K.S.; Kapoor, S.; Kumar, N. Statistical Variability Comparison in MODIS and AERONET Derived Aerosol Optical Depth over Indo-Gangetic Plains Using Time Series Modeling. Sci. Total Environ. 2016, 553, 258–265. [Google Scholar] [CrossRef] [PubMed]
  80. Sayer, A.M.; Munchak, L.A.; Hsu, N.C.; Levy, R.C.; Bettenhausen, C.; Jeong, M. MODIS Collection 6 Aerosol Products: Comparison between Aqua’s e-Deep Blue, Dark Target, and “Merged” Data Sets, and Usage Recommendations. J. Geo-Phys. Res. Atmos. 2014, 119, 13965–13989. [Google Scholar] [CrossRef]
  81. Russell, P.B.; Kinne, S.A.; Bergstrom, R.W. Aerosol Climate Effects: Local Radiative Forcing and Column Closure Experiments. J. Geophys. Res. 1997, 102, 9397–9407. [Google Scholar] [CrossRef]
  82. Bilbao, J.; Román, R.; Yousif, C.; Mateos, D.; de Miguel, A. Total Ozone Column, Water Vapour and Aerosol Effects on Erythemal and Global Solar Irradiance in Marsaxlokk, Malta. Atmos. Environ. 2014, 99, 508–518. [Google Scholar] [CrossRef]
  83. Yu, H.; Kaufman, Y.J.; Chin, M.; Feingold, G.; Remer, L.A.; Anderson, T.L.; Balkanski, Y.; Bellouin, N.; Boucher, O.; Christopher, S.; et al. A Review of Measurement-Based Assessments of the Aerosol Direct Radiative Effect and Forcing. Atmos. Chem. Phys. 2006, 6, 613–666. [Google Scholar] [CrossRef]
  84. Cohen, J. Multiple Regression as a General Data Analytic System. Psychol. Bull. 1968, 70, 426–443. [Google Scholar] [CrossRef]
  85. Prasad, A.K.; Singh, R.P. Comparison of MISR-MODIS Aerosol Optical Depth over the Indo-Gangetic Basin during the Winter and Summer Seasons (2000–2005). Remote Sens. Environ. 2007, 107, 109–119. [Google Scholar] [CrossRef]
  86. Nash, J.E.; Sutcliffe, J.V. River Flow Forecasting Through Conceptual Models Part I—A Discussion of Principles*. J. Hydrol. 1970, 10, 282–290. [Google Scholar] [CrossRef]
  87. Olden, J.D.; Jackson, D.A. Torturing Data for the Sake of Generality: How Valid Are Our Regression Models? Ecoscience 2000, 7, 501–510. [Google Scholar] [CrossRef]
  88. Shao, J.; Rao, J.N.K. Jackknife Inference for Heteroscedastic Linear Regression Models. Can. J. Stat. 1993, 21, 377–395. [Google Scholar] [CrossRef]
  89. Garren, S.T.; Kott, P.S. Evaluating the Effective Degrees of Freedom of the Delete-a-Group Jackknife. Commun. Stat. Simul. Comput. 2014, 43, 2649–2660. [Google Scholar] [CrossRef]
  90. Nair, V.S.; Moorthy, K.K.; Alappattu, D.P.; Kunhikrishnan, P.K.; George, S.; Nair, P.R.; Babu, S.S.; Abish, B.; Satheesh, S.K.; Tripathi, S.N.; et al. Wintertime Aerosol Characteristics over the Indo-Gangetic Plain (IGP): Impacts of Local Boundary Layer Processes and Long-Range Transport. J. Geophys. Res. Atmos. 2007, 112, 1–15. [Google Scholar] [CrossRef]
  91. Beven, K. A Manifesto for the Equifinality Thesis. J. Hydrol. 2006, 320, 18–36. [Google Scholar] [CrossRef] [Green Version]
  92. Ritter, A.; Muñoz-Carpena, R. Performance Evaluation of Hydrological Models: Statistical Significance for Reducing Subjectivity in Goodness-of-Fit Assessments. J. Hydrol. 2013, 480, 33–45. [Google Scholar] [CrossRef]
  93. Choudhry, P.; Misra, A.; Tripathi, S.N. Study of MODIS Derived AOD at Three Different Locations in the Indo Gangetic Plain: Kanpur, Gandhi College and Nainital. Ann. Geophys. 2012, 30, 1479–1493. [Google Scholar] [CrossRef]
  94. García, O.E.; Díaz, J.P.; Expósito, F.J.; Díaz, A.M.; Dubovik, O.; Derimian, Y. Aerosol Radiative Forcing: AERONET-Based Estimates. In Climate Models; Druyan, L., Ed.; InTech: London, UK, 2012; p. 336. [Google Scholar]
  95. Alam, K.; Trautmann, T.; Blaschke, T. Aerosol Optical Properties and Radiative Forcing over Mega-City Karachi. Atmos. Res. 2011, 101, 773–782. [Google Scholar] [CrossRef]
  96. Alam, K.; Trautmann, T.; Blaschke, T.; Majid, H. Aerosol Optical and Radiative Properties during Summer and Winter Seasons over Lahore and Karachi. Atmos. Environ. 2012, 50, 234–245. [Google Scholar] [CrossRef]
  97. Sen, A.; Abdelmaksoud, A.S.; Nazeer Ahammed, Y.; Alghamdi, M.; Banerjee, T.; Bhat, M.A.; Chatterjee, A.; Choudhuri, A.K.; Das, T.; Dhir, A.; et al. Variations in Particulate Matter over Indo-Gangetic Plains and Indo-Himalayan Range during Four Field Campaigns in Winter Monsoon and Summer Monsoon: Role of Pollution Pathways. Atmos. Environ. 2017, 154, 200–224. [Google Scholar] [CrossRef]
Figure 1. Study area—Indo Gangetic Plain (IGP) and the location of AErosol RObotic NETwork (AERONET) stations (starred).
Atmosphere 09 00405 g001
Figure 2. Evaluation of estimated radiative forcing with that of AERONET radiative forcing (Wm−2) in the IGP stations. (a) Bhola (b) Dhaka University (c) Gandhi College (d) Kanpur (e) Karachi (f) Kolkata (g) Lahore (h) Lumbini (i) New Delhi (j) Pantnagar.
Atmosphere 09 00405 g002aAtmosphere 09 00405 g002b
Figure 3. Comparison of estimated radiative forcing by using MODIS Aqua derived AOD and atmospheric water vapour with AERONET radiative forcing in the stations of IGP. (a) Bhola (b) Dhaka University (c) Gandhi College (d) Kanpur (e) Karachi (f) Kolkata (g) Lahore (h) Lumbini (i) New Delhi (j) Pantnagar.
Atmosphere 09 00405 g003aAtmosphere 09 00405 g003b
Figure 4. Comparison of estimated radiative forcing by using MODIS Terra derived AOD and atmospheric water vapour with AERONET radiative forcing in the stations of IGP. (a) Bhola (b) Dhaka University (c) Gandgi Colleague (d) Kanpur (e) Karachi (f) Kolkata (g) Lahore (h) Lumbini (i) New Delgi (j) Pantnagar.
Atmosphere 09 00405 g004aAtmosphere 09 00405 g004b
Table 1. AERONET Stations in the IGP.
SNSite NameCountryLongitude (Decimal Degrees)Latitude (Decimal Degrees)Elevation (Metres)
1BholaBangladesh90.75622.2277
2Dhaka UniversityBangladesh90.39823.72834
3Gandhi CollegeIndia84.12825.87160
4IIT KGP EXT KolkataIndia88.41822.57410
5KanpurIndia80.23226.513123
6KarachiPakistan67.13624.94649
7LahorePakistan74.26431.480209
8LumbiniNepal83.28027.490110
9New Delhi India77.22228.589241
10PantnagarIndia79.52129.046241
Table 2. Regression results of year-round and seasonal models to predict atmospheric aerosol (ADRF).
Model Number of ObservationsA (Sig.) (Wm−2)B1 (Sig.) (Wm−2)B2 (Sig.) (Wm−3)Adjusted R2 Standard Error (Wm−2)
Year-round Model 5138−32.464 (0.00)−119.446 (0.00)4.471 × 10² (0.00)0.83414.390
Season Models
Winter884−23.895 (0.00)−117.876 (0.00)−4.89 × 10² (0.62)0.84614.724
Pre-monsoon1854−24.256 (0.00)−129.979 (0.00)2.232 × 10² (0.00)0.82813.184
Monsoon812−40.510 (0.00)−97.921 (0.00)4.093 × 10² (0.00)0.82511.364
Post monsoon1588−35.872 (0.00)−118.795 (0.00)5.458 × 10² (0.00)0.86214.970
Note: A is the intercept and B1 and B2 are the coefficients shown in Equation (1). Significance was tested using a t-test and p values are in brackets.
Table 3. Results of the ADRF model using all AERONET stations in the IGP by using AERONET aerosol optical depth (AOD) and atmospheric water vapour at each station.
SN StationsNumber of Observations Mean Error (Wm−2)Mean Absolute Error (Wm−2)Root Mean Square Error (RMSE) (Wm−2)Nash-Sutcliffe Efficiency (NSE)Correlation Coefficient, r
1Bhola37−7.68911.76015.4280.6080.870
2Dhaka University25310.15816.99722.9140.7230.882
3Gandhi College8330.41910.92415.1440.7820.886
4Kanpur1581−0.4059.78013.5220.8310.912
5Karachi1028−5.2558.60710.5920.8270.932
6Kolkata2722.94623.33826.2840.4020.954
7Lahore10171.28910.64614.4360.8220.909
8Lumbini1063.67916.70220.9120.8020.900
9New Delhi677.82812.96218.3010.6950.888
10Pantnagar1892.9848.81611.9110.7900.896
All Stations51380.00010.49014.3900.8300.910
Table 4. Results of multiple regression of ADRF using AERONET AOD and atmospheric water vapour in the IGP by adopting a delete one group (station data) Jackknife method.
SNAll Stations of IGP ExceptNumber of Observations NIntercept, A (Wm−2)AOD Coefficient, B1 (Wm−2)Atmospheric Moisture Coefficient, B2 (Wm−3)Adjusted R SquareStandard Error (Wm−2)
1Bhola5101−32.388−119.6084.451 × 1020.83414.382
2Dhaka University4885−32.355−118.0394.301 × 1020.83513.791
3Gandhi College4305−32.846−120.9405.113 × 1020.84214.224
4Kanpur3557−31.758−121.3904.552 × 1020.83414.749
5Karachi4110−36.430−116.1164.775 × 1020.81315.098
6Kolkata5111−32.424−119.2154.448 × 1020.83514.300
7Lahore4121−30.218−120.6023.843 × 1020.83514.352
8Lumbini5032−32.409−119.6164.527 × 1020.83514.220
9New Delhi5071−32.420−119.1844.429 × 1020.83514.331
10Pantnagar4949−32.205−119.5374.426 × 1020.83414.476
Min3557−36.430−121.3903.843 × 1020.81313.791
Max5111−30.218−116.1165.113 × 1020.84215.098
Average4624.20−32.545−119.4254.487 × 1020.83314.392
Standard Deviation553.991.5431.5130.323 × 1020.0080.344
All Stations5138−32.464−119.4464.471 × 1020.83414.390
Note: ADRF = Daily direct radiative forcing due to atmospheric aerosols (Wm−2); AERONET = Aerosol Robotic Network; AOD = Aerosol Optical Depth; IGP = Indo Gangetic Plain.
Table 5. Evaluation of Moderate Resolution Imaging Spectroradiometer (MODIS) Aqua derived AOD and atmospheric water vapour against AERONET measured AOD and atmospheric water vapour for the IGP stations.
SNRow LabelsNumber of Observations N MODIS Aqua Retrieved AODMODIS Aqua Retrieved Atmospheric Water Vapour
MEMAERMSErME (cm)MAE (cm)RMSE (cm)r
1Bhola370.0520.1240.1820.811−0.2640.4930.6170.838
2Dhaka University253−0.0720.1560.2180.7850.4450.5590.6740.865
3Gandhi College833−0.0600.1590.2230.7320.2100.5000.6690.899
4Kolkata15810.0290.1400.2070.7670.3480.4810.6450.882
5Kanpur1028−0.0780.1100.1560.7850.3130.4600.5920.847
6Karachi27−0.1070.1750.2060.6860.3830.5010.6510.839
7Lahore10170.0790.1750.2550.7760.2460.4500.6310.929
8Lumbini106−0.0830.1330.1830.898−0.4360.6020.7050.906
9New Delhi670.0230.1670.2400.5380.5180.6230.8190.930
10Pantnagar1890.0460.1240.1640.7490.1520.3940.5560.871
All Stations 5138−0.0040.1440.2100.7780.2780.4790.6380.887
Note: ME = Mean Error; MAE = Mean Absolute Error; RMSE = Root Mean Square Error; r = Pearson Correlation Coefficient.
Table 6. Evaluation of MODIS Aqua derived AOD and precipitable water vapour against AERONET measured AOD and atmospheric water vapour in four seasons in the IGP.
SNRow LabelsNumber of Observations N MODIS Aqua Retrieved AODMODIS Aqua Retrieved Atmospheric Water Vapour
MEMAERMSErME (cm)MAE (cm)RMSE (cm)r
1Winter8840.0200.1180.1800.8400.2970.4170.5230.655
2Pre monsoon1854−0.0590.1300.1850.7020.1970.4320.5620.820
3Monsoon5580.0930.2490.3360.7030.6420.8131.0150.853
4Post monsoon 18420.0110.1390.1970.8240.1750.3970.5190.780
All Stations 5138−0.0040.1440.2100.7780.2780.4790.6380.887
Table 7. Evaluation of MODIS Terra derived AOD and atmospheric water vapour against AERONET measured AOD and atmospheric water vapour for the IGP stations.
SNRow LabelsNumber of Observations NMODIS Terra Retrieved AODMODIS Terra Retrieved Atmospheric Water Vapour
MEMAERMSErME (cm)MAE (cm)RMSE (cm)r
1Bhola410.1150.1620.2180.744−0.3170.5270.6580.876
2Dhaka University2320.0140.1660.2620.7680.2620.4920.6040.819
3Gandhi College8230.0000.1430.2200.7290.1860.5130.7090.893
4Kolkata17730.0870.1490.2250.7930.3010.4740.6550.895
5Kanpur918−0.0620.1060.1620.7480.3810.4840.6160.845
6Karachi25−0.0370.1630.2250.6130.3690.5280.6380.849
7Lahore10050.1120.1950.2890.7680.1180.4250.5820.918
8Lumbini104−0.0670.1140.1660.907−0.6510.6900.7810.884
9New Delhi690.0820.1890.2560.5720.5430.6110.7760.947
10Pantnagar190−0.1780.1970.2350.690−0.4530.5430.6700.825
All Stations51800.0350.1520.2300.7810.2120.4830.6460.880
Table 8. Evaluation of MODIS Terra derived AOD and atmospheric water vapour against AERONET measured AOD and atmospheric water vapour in four seasons in the IGP.
SNRow LabelsNumber of Observations N MODIS Terra Retrieved AODMODIS Terra Retrieved Atmospheric Water Vapour
MEMAERMSErME (cm)MAE (cm)RMSE (cm)r
1Winter8860.0650.1420.2260.8210.1750.3880.4920.598
2Pre monsoon1848−0.0160.1260.1810.7250.1820.4450.5790.813
3Monsoon8331.5081.1000.6730.7130.5730.7991.0150.820
4Post monsoon 16130.0350.1490.2220.8340.0790.4150.5410.750
All Stations 51800.0350.1520.2300.7810.2120.4830.6460.880
Table 9. Evaluation of the model with AOD and Atmospheric water vapour retrieved from MODIS Aqua in the IGP.
SNRow LabelsNumber of Observations Mean Error (Wm−2)Mean Absolute Error (Wm−2)RMSE (Wm−2)Correlation Coefficient, r
1Bhola37−15.07022.61131.3710.610
2Dhaka University25320.76729.35740.3220.619
3Gandhi College8338.47823.67632.3590.603
4Kanpur1581−2.34920.92129.0950.672
5Karachi10285.46615.08320.8100.661
6Kolkata2737.42940.71545.3970.664
7Lahore1017−6.98925.95436.3370.586
8Lumbini10611.58924.62431.9640.779
9New Delhi677.41029.87841.4190.138
10Pantnagar189−1.87618.23424.7680.587
All Stations51381.73921.82230.7000.660
Table 10. Evaluation of the model with AOD and precipitable water vapour retrieved from MODIS Terra in the IGP.
SNRow LabelsNumber of Observations Mean Error (Wm−2)Mean Absolute Error (Wm−2)RMSE (Wm−2)Correlation Coefficient, r
1Bhola41−21.53228.31637.5770.452
2Dhaka University23210.63430.94542.6170.610
3Gandhi College8231.57422.49433.0570.576
4Kanpur1773−8.72221.86131.6240.675
5Karachi9184.11414.92322.0690.625
6Kolkata2528.74837.40542.5060.462
7Lahore1005−11.53627.85440.2690.573
8Lumbini1049.13723.82632.1750.762
9New Delhi69−0.38529.92941.7480.144
10Pantnagar19021.89424.39429.6380.649
All Stations 5180−2.81822.66833.0800.654
Table 11. Comparative statistical evaluation of ADRF model and Santa Barbara DISTORT Atmospheric Radiative Transfer (SBDART) model estimated monthly ADRF at Karachi and Lahore in the IGP.
StationDurationMean Error (Wm−2)Mean Absolute Error (Wm−2)Root Mean Square Error (Wm−2)Pearson Correlation Coefficient
SBDARTADRF MODELSBDARTADRF MODELSBDARTADRF MODELSBDARTADRF MODEL
KarachiAugust 2006 to July 20074.640.215.1811.288.1113.460.910.74
KarachiApril 2010 to February 20112.681.493.923.894.976.640.910.79
KarachiCombined2.050.394.748.677.1611.520.920.82
LahoreApril 2010 to Feb 2011−6.77−3.356.7714.378.8615.670.980.71

