Abstract
Submicron particle (PM1) pollution has received increased attention in recent years; however, few studies have focused on such pollution in the city of Shijiazhuang (SJZ), which is one of the most polluted cities in the world. In this study, we conducted an intensive simultaneous sampling of PM1 and PM2.5 in autumn 2016, in order to explore pollution characteristics and sources in SJZ. The results showed that the average mass concentrations of PM1 and PM2.5 were 70.51 μg/m3 and 91.68 μg/m3, respectively, and the average ratio of PM1/PM2.5 was 0.75. Secondary inorganic aerosol (SIA) was the dominant component in PM1 (35.9%) and PM2.5 (32.3%). An analysis of haze episodes found that SIA had a significant influence on PM1 pollution, NH4+ promoted the formation of pollution, and SO42− and NO3− presented different chemical mechanisms. Additionally, the results of source apportionment implied that secondary source, biomass burning and coal combustion, traffic, industry, and dust were the major pollution sources for SJZ, accounting for 45.4%, 18.9%, 15.7%, 10.3%, and 9.8% of PM1, respectively, and for 42.4%, 18.8%, 12.2%, 10.2%, and 16.4% of PM2.5, respectively. Southern Hebei, mid-eastern Shanxi, and northern Henan were the major contribution regions during the study period. Three transport pathways of pollutants were put forward, including airflows from Shanxi with secondary source, airflows from the central Beijng–Tianjin–Hebei region with fossil fuel burning source, and airflows from the southern North China Plain with biomass burning source. The systematic analysis of PM1 could provide scientific support for the creation of an air pollution mitigation policy in SJZ and similar regions.
1. Introduction
With the rapid development of the economy and acceleration of urbanization, fine particulate matter pollution is gradually attracting attention in China [1,2,3,4,5]. Issues related to submicron particles (PM1, particles with aerodynamic diameters less than or equal to 1 μm) have become more severe in recent years. According to previous studies, PM1 has been characterized by high mass concentration and high proportion in PM2.5 [6,7,8], and some major components were more distributed in PM1 than in PM1–2.5 (e.g., NH4+, SO42−, and K+), which played prominent roles in haze episode formation in China [8,9]. As a result, PM1 has had a serious impact on air quality, especially for heavy pollutions. Additionally, significant health risks of PM1 were also found in different ways, such as respiratory symptoms, carcinogenic effect, and endocrine [10,11,12,13,14]. Consequently, the mitigation of PM1 pollution deserves special attention. Before that, the chemical characteristics and sources of PM1 should be investigated, in order to provide scientific support for policy making.
Some studies have concentrated on only one or several components of PM1, such as elemental composition [15], black carbon (BC) [16], organic carbon (OC) and elemental carbon (EC) [17,18], and water-soluble inorganic ions [19]. Most studies have preferred to explore the characteristics of dominant compositions (e.g., NO3−, SO42−, NH4+, Cl−, OC, and BC) based on online monitoring, such as chemical profiles [20,21], temporal variations [22], pollution sources identified by positive matrix factorization (PMF) or principal component analysis (PCA) models [9,23], and regional contribution resolved by the Hybrid Single Particle Lagrangian Integrated Trajectory (HYSPLIT) model [24]. Only limited studies have carried out analyses based on a relatively complete spectrum of species from offline sampling [25,26]. Incomplete spectra of species limit the comprehensive understanding of chemical characteristics (including components of carbonaceous matter, ions, and elements) and the identification of the overall pollution sources. For example, K+ and typical elements (e.g., Fe, Pb, and Ni) cannot be detected by the most commonly used PM1 monitoring instrument—the ACSM (Aerosol Chemical Speciation Monitor) [17,21,23]—however, these species are the key tracers for the identification of biomass burning, and industrial and traffic sources. All in all, more detailed data regarding PM1 species is urgently needed, as they are essential to obtaining a better knowledge of submicron particulate pollution in terms of chemical characteristics and source contributions.
Alarmingly, although Shijiazhuang (SJZ) is one of the most polluted cities in China, few studies on PM1 have been conducted there, and the relevant chemical characteristics and pollution sources remain ambiguous. As the provincial capital of Hebei province, SJZ has been suffering from heavy haze pollution for a long time. The air quality of this city has consistently been ranked as the third worst nationwide in recent years, and finally dropped to last place in 2017 as of the newest statistics [27]. Despite years of emission control, there were still 71 heavily polluted days (daily PM2.5 concentration >150 μg/m3) in SJZ in 2016, with an annual average PM2.5 concentration of 99 μg/m3 [28], significantly exceeding the Chinese National Ambient Air Quality Standards (CNAAQS) for annual mean PM2.5 concentration (35 μg/m3). Furthermore, because of the high emissions and poor air quality, regional transport effects [29] and health problems [30] were also serious and intractable in this city. Therefore, making clear PM1 features in this heavily polluted city is probably important as a reference for pollution control in other similar regions worldwide.
Seasonal-scale analysis is a prevalent method for the study of aerosols due to the constraints of time and energy. Autumn is a season when heavy air pollution frequently occurs in China [31]. In this season, the representative pollution source, biomass burning, is noteworthy for its large emissions [32] and multifaceted effects [33]. Hence, in this study, an intensive campaign to sample PM1 and PM2.5 was conducted in autumn 2016 in SJZ. Detailed chemical species were further analyzed, including trace elements (TE), ions, OC, and EC. The characteristics of PM1 and PM2.5 at different levels of pollution, the sectoral and regional sources, and the transport pathways of pollutants in SJZ were then investigated. The purpose of this case study is to provide new knowledge about the characteristics of PM1 from multiple aspects in the area with heavy industry and severe haze pollutions, supporting the improvement of air quality and the establishment of emission control measures.
2. Experiments and Methodology
2.1. City Description
The city of SJZ is the provincial capital of Hebei province, with a permanent population of 10.78 million people in 2016 [34]. The industrial structure of SJZ is dominated by secondary industry (45.0%) and tertiary industry (46.8%). It is an important base of agricultural products and grain in China, such as oil plants, wheat, and cotton, providing a yield of 1.90 million tons, 2.57 million tons, and 7.70 thousand tons, respectively, in 2015 [35]. The primary industrial types include steel; metallurgy; equipment manufacturing; petrochemical; architectural material; food; and, especially, the pharmaceutical and textile industries, which occupy a vital position nationwide [34]. However, because of its coal-based, high energy consumption industrial structure, SJZ has been suffering from heavy haze pollution in recent years (Figure 1a). SJZ is located in the east of China, west of the North China Plain (NCP), southwest of the Beijing–Tianjin–Hebei (BTH) region and west of the Taihang Mountains, adjacent to two heavy industry cities (Xingtai and Hengshui) in the south and east (Figure 1b); the special geography and terrain probably cause the distinct polluted characteristics and transport pathway of SJZ.
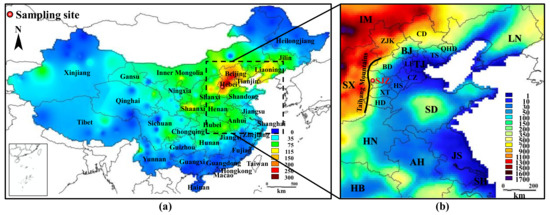
Figure 1.
The location of the sampling site in SJZ. (a) The spatial variations of PM2.5 concentration (μg/m3) in China during the monitoring period; (b) the elevation (m) distribution of the North China Plain (CD: Chengde; ZJK: Zhangjiakou; QHD: Qinhuangdao; TS: Tangshan; LF: Langfang; BD: Baoding; CZ: Cangzhou; HS: Hengshui; SJZ: Shijiazhuang; XT: Xingtai; HD: Handan).
2.2. Sampling Program
Daily 24 h (09:00 to 09:00 the next day) measurements of PM1 and PM2.5 were intensively performed between 8 October and 1 November 2016. The monitoring period was mainly in October, thus avoiding the influence of late summer and the heating season (which begins around 15 November [36]). The monitoring period involved at least three pollution process variations, as one process generally lasts three to seven days [37,38], and could basically represent the common condition in autumn. The sampling site is located in the SJZ Environmental Monitoring Center (38.02° N, 114.53° E) on the roof of a five-floor building (~16 m in height). It is surrounded by residential and commercial areas, next to roads with moderate traffic, and could basically represent the urban condition.
Samples of PM were collected with two URG systems (URG, Chapel Hill, NC, USA), one with cutoff in aerodynamic diameter at 1 μm (PM1) and the other at 2.5 μm (PM2.5), with a flow rate of 16.7 L/min. The sampling membrane included Whatmans 41 filters (Whatman Inc., Maidstone, UK) and quartz fiber filters (Whatman Inc., Maidstone, UK), which were used for the analysis of elements and ions, and OC and EC, respectively. After sampling, the filters were conserved in polyethylene plastic bags and stored in a refrigerator. The samples were finally equilibrated for 48 h and weighed at a temperature of 20 ± 5 °C and relative humidity of 40 ± 2%. The weight of the filters was determined using an electronic balance (Sartorius TB-215D) before and after sampling, with a precision of 0.01 mg. Multiple weighing steps (three or more times) were performed until the absolute deviation was less than or equal to 0.03 mg. The whole program had strict quality control to avoid sample contamination. Additionally, conventional meteorological parameters around the sampling site were synchronously monitored, including temperature, wind direction, wind speed, relative humidity, and air pressure.
2.3. Chemical Analysis
A total of 50 samples were collected, and 26 species were analyzed, including Na, Mg, Al, S, Ca, Ti, Cr, Mn, Fe, Ni, Cu, Zn, Sr, Pb, Na+, K+, NH4+, Ca2+, Mg2+, F−, Cl−, NO2−, NO3−, SO42−, OC, and EC. A total of 14 metallic elements were measured by inductively coupled plasma mass spectrometry (ICP-MS; 7500a, Thermo), and S was determined by inductively coupled plasma atomic emission spectroscopy (ICP-AES). The samples were pre-treated by the closed vessel digestion method before elemental analysis, and the relative standard deviations (RSD) were generally below 5%. For ion analysis, the ion chromatograph (IC; Metrohm 861 Advanced Compact IC) was applied, with detection limits of less than 0.04 mg/L for anions and 0.006 mg/L for cations. The RSD of each ion was less than 5%. OC and EC in PM were analyzed by the optical carbon analyzer model (DRL Model 2001A, Desert research institute, Reno, NV, USA). The detection limits of total organic carbon and total elemental carbon were 0.82 µg C/cm3 and 0.20 µg C/cm3, respectively, and the determination precision of the carbon component was below 5%. Four OC constituents (OC1, OC2, OC3, and OC4) were extracted in a helium atmosphere at temperatures of 140 °C, 280 °C, 480 °C, and 580 °C, respectively. Three EC constituents (EC1, EC2, and EC3) were extracted in a 2% oxygen/98% helium atmosphere at temperatures of 580 °C, 740 °C, and 840 °C, respectively. All of the above analytical processes underwent strict quality control to avoid sample contamination.
2.4. Positive Matrix Factorization Model
The positive matrix factorization (PMF) model is a convenient mathematical approach based on the principle of data error estimation to solve the matrix by the least square method [39]. The contribution of different sources to PM was quantified by analyzing only concentration and uncertainty data files. Because of its effectiveness and accuracy, PMF has been widely applied in the source apportionment of atmospheric pollutants [40]. In this study, Environmental Protection Agency (EPA) PMF version 5.0 was used to explore the potential sectoral sources of PM1 and PM2.5 in SJZ. The species input dataset included Na, Mg, Al, Ca, Si, Ti, Cr, Mn, Fe, Ni, Cu, Zn, Sr, Pb, S, Na+, NH4+, K+, Cl−, NO3−, SO42−, OC, and EC, and some species with abnormal values were excluded to avoid error. The uncertainties of each species were evaluated based on the rules recommended by Paatero et al. [39]. The model was run at least 100 times with different numbers of factors to obtain the optimal solution with minimum Q/Qexp. Five sources of PM were finally obtained. The run number is 100 and the Q/Qexp is approximately equal to 1.
2.5. Back Trajectory and Clustering Analysis
Hybrid Single Particle Lagrangian Integrated Trajectory (HYSPLIT) version 4.0 was used to backward track the transport pathways of pollutants for SJZ during the study period, and the ARL archives of the National Oceanic and Atmospheric Administration (NOAA) were used as the meteorological input data in this study. The back run time was 48 h with an interval of 1 h, and the tracking height varied from 100 to 6000 m above ground level. A total of 600 trajectories were used for cluster analysis and seven clusters were attained.
2.6. Potential Source Contribution Function Analysis
Potential source contribution function (PSCF) analysis is widely used to identify the regional contributions for receptor sites [41]. In this study, PM1 and its chemical composition were analyzed, based on the HYSPLIT output trajectories and the MeteoInfo version 1.4.3 model. The study domain was divided into grid cells in the range of 3.86–53.55° N, 73.66–135.04° E, with a horizontal resolution of 0.5° × 0.5°. The 25th and 75th percentile concentrations were considered as the criteria in this study, representing the generally- and heavily-polluted conditions, respectively. The PSCF value in a grid cell was calculated by counting the trajectory segment endpoints that terminate within the cell, and was defined as:
where Nij represents the number of endpoints falling in the ij cell; Mij is the number of endpoints in the same cell that corresponds to the pollutant concentration higher than a criterion set by users; and Wij (Equation (2)) is an empirical weight piecewise function defined by the average number of endpoints Nave, put forward to reduce the uncertainty produced by small value of Nij.

PSCFij = Mij / Nij · Wij
3. Results and Discussion
3.1. Chemical Characteristics of PM1 and PM2.5
3.1.1. Mass Concentration of PM
The average mass concentration of PM1 and PM2.5 during the study period in SJZ was 70.51 ± 47.30 μg/m3 and 91.68 ± 54.85 μg/m3, respectively. The maximum concentrations of PM1 and PM2.5 reached 222.34 μg/m3 and 261.60 μg/m3, respectively (Figure 2), approximately 3.0 and 3.5 times the CNAAQS for daily PM2.5 (75 μg/m3). The ratio of PM1/PM2.5 showed an increasing trend as PM1 concentration rises (Figure 3a), with a mean value of 0.75, indicating the important role PM1 played in PM2.5 pollution, especially for polluted periods. Compared with PM1 pollution in other studies (Table 1), the average mass concentration in SJZ was dramatically higher than that in other countries—cf., 4 μg/m3 in Finland [42] and 3 μg/m3 in France [43]—and other sites in China—cf., 46 μg/m3 in Nanjing [44] and 41 μg/m3 in Beijing [31]. By summarizing previous studies (Figure 3b) it becomes clear that the percentage of PM1 in PM2.5 generally rose as a function of PM1 concentration, and the ratio in SJZ was higher than in most of the cities (countries). The above evidence indicates that there is severe submicron particulate pollution in SJZ.
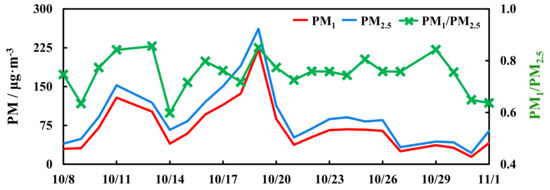
Figure 2.
Time series of daily PM concentration and PM1/PM2.5 ratio during the study period.
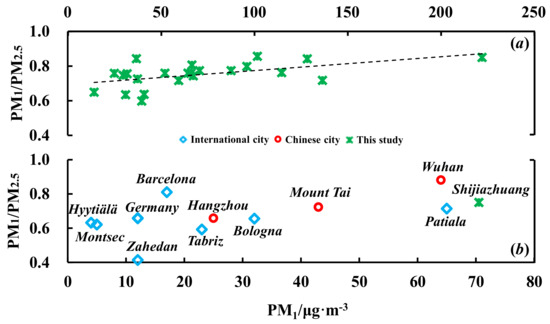
Figure 3.
The ratio of PM1/PM2.5 as a function of PM1 concentration in this study (a) and in other studies (b).

Table 1.
Average mass concentration of PM1, PM2.5, and PM1/PM2.5 ratio in autumn.
3.1.2. Characteristics of Chemical Species
The average mass concentration and fractions of 26 species in PM1 and PM2.5 from SJZ are listed in Table 2. Water-soluble inorganic ions (WSII) were the dominant component, with concentrations of 28.22 μg/m3 in PM1 and 38.52 μg/m3 in PM2.5, respectively. The secondary inorganic aerosols (SIAs) SO42−, NO3−, and NH4+ comprised the largest part of WSII, with concentrations of 9.09 μg/m3, 9.08 μg/m3, and 7.11 μg/m3 in PM1, respectively, and 11.12 μg/m3, 10.55 μg/m3, and 7.95 μg/m3 in PM2.5, respectively, implying the significant roles of SIA and secondary sources in fine and submicron particles. Levels of Cl−, which is generally identified as the tracer particle of coal burning [57], were non-negligible, with observed concentrations of 1.33 μg/m3 in PM1 and 3.69 μg/m3 in PM2.5. For TE, S showed extraordinarily high concentrations of 3.51 μg/m3 in PM1 and 3.92 μg/m3 in PM2.5. The concentrations of OC and EC were 12.71 μg/m3 and 4.99 μg/m3 in PM1, respectively, and 15.43 μg/m3 and 5.91 μg/m3 in PM2.5, respectively.
Table 2.
Average mass concentration and standard deviation of chemical species of PM during the study period.
Similar profiles were also found in mass fractions as presented in Figure 4, with the order of WSII (40.0%) > OM (28.8%) > EC (7.1%) > TE (6.5%) in PM1, and WSII (42.0%) > OM (26.9%) > TE (7.2%) > EC (6.4%) in PM2.5, which is consistent with the work of [58]. The concentration of organic matter (OM) was estimated to be 1.6 times that of OC, considering the urban condition and empirical value in SJZ [59]. The lower proportion of TE observed in PM1 was probably the result of some elements in dust, which were mainly distributed in PM1–2.5 [60]. The mass fraction ratio of NO3−/SO42− (~1.0) in SJZ PM1 was much higher than that in some cities of highly industrialized countries such as Helsinki, Finland (0.04) [61] and Zabrze, Poland (0.16) [11], however, the ratio was lower than in some megacities of China, such as Beijing (1.4) [31] and Nanjing (2.0) [44]. Additionally, a higher proportion of Cl− and lower percentage of OM was observed in SJZ than has been reported in some developed countries, such as Sapporo of Japan [62], Atlanta of USA [63] and London of the United Kingdom [64], which illustrates the difference in energy structure among countries with different developmental levels. The fact that a relatively lower percentage of TE (7.2%) and higher percentage of SIA (35.9%) were observed in SJZ than in Kanpur, India (12.8% and 25.9%) shows a clear predominance of secondary pollution in SJZ [65].
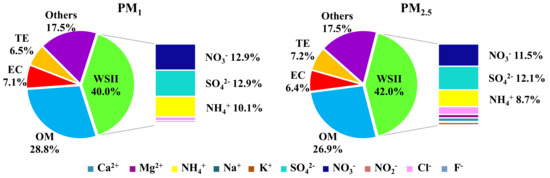
Figure 4.
The profiles of chemical components in PM1 and PM2.5. (TE: trace elements; EC: elemental carbon; OM: organic matter; WSII: water-soluble inorganic ions).
3.2. Analysis of PM1 in Haze Episodes
According to the air quality standard of 75 μg/m3 for daily PM2.5, we divided the monitoring data into two parts: non-polluted (NP) and polluted (P) levels. As is shown in Table 3, the average mass concentration of PM1 in the polluted period increased to nearly three times the value in the non-polluted period, that is, from 33.90 μg/m3 to 98.67 μg/m3, and the same variation was also found in PM2.5, the concentration of which increased from 48.06 μg/m3 in the NP period to 125.23 μg/m3 in the P period. The PM1/PM2.5 ratio presented a growth trend from 71.1% in the NP period to 78.1% in the P period, consistent with the previous analysis in Section 3.1.1. The detailed meteorological conditions for different pollution levels are summarized in Table 3. The meteorological data used in this study were obtained from field observation and from the meteorological data center of the China Meteorological Administration [66]. The lower planetary boundary layer (PBL) height and lower wind speed (WS) were averse to the diffusion of particles, and much higher relative humidity (RH) may promote the hygroscopic growth of fine particles [67] and then worsen pollution.
Table 3.
Air quality and meteorological conditions during non-polluted and polluted situations.
A comparison of chemical composition fractions in different pollution levels is presented in Figure 5. It can be seen that the dominant component in the non-polluted period was OM (41.3% in PM1, 40.4% in PM2.5), and SIA in the polluted period (35.0% in PM1, 31.8% in PM2.5). Additionally, the variations of SIA contribution from NP to P increased by 0.8% in PM1, and decreased by 0.5% in PM2.5, indicating the vital function of SIA in the formation of submicron particulate pollution. The decrease of SIA fraction in PM2.5 may be ascribed to the high proportion of unknown components (named Others in Figure 5), which was likely to be aerosol liquid water related to particle hygroscopicity, and especially to the aqueous-phase reactions of the pollutants in accumulation mode during haze episodes [68]. The percentage of OM in different diameter ranges concurrently decreased even if the mass concentration still increased, consistent with observations from the Yangtze River Delta [38], probably attributed to the extraordinarily percentages of SIA [69]. Alternatively, a weak oxidizing ability of air to organic matter during the haze period may also cause a weak formation of local secondary organic aerosols [70].
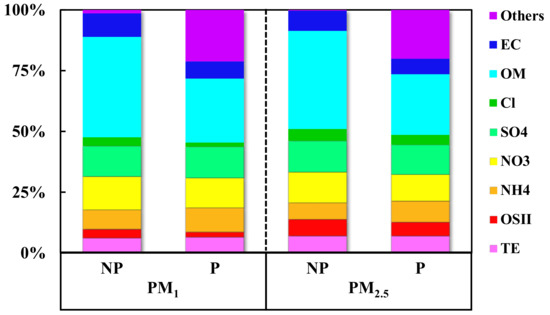
Figure 5.
The mass fractions of chemical components for different pollution levels (NP: non-polluted; P: polluted; OSII: other soluble inorganic ions; PBL: planetary boundary layer; RH: relative humidity; WS: wind speed).
A further analysis was carried out on the relationship between SIA ions in two typical haze pollution episodes during the study period (Figure 6). The first pollution period (P1) was from 9 to 14 October. Only the mass fraction of NH4+ had a relatively synchronous variation with PM1 concentration (Figure 6a), compared with SO42− and NO3−. The pollution degree had no further deterioration, indicating the contribution from accidental sources during P1. The second pollution period (P2) from 15 to 21 October was much more serious than P1, with the maximum concentration of PM1 reaching 222.34 μg/m3. As shown in Figure 6a, NH4+ and SO42− exhibited synchronous variation with PM1 concentration, implying the formation of (NH4)2SO4 and/or NH4HSO4. The [NO3−]/[SO42−] ratio of 0.90 suggested that coal combustion may be one of the main sources of heavy haze episodes in SJZ.
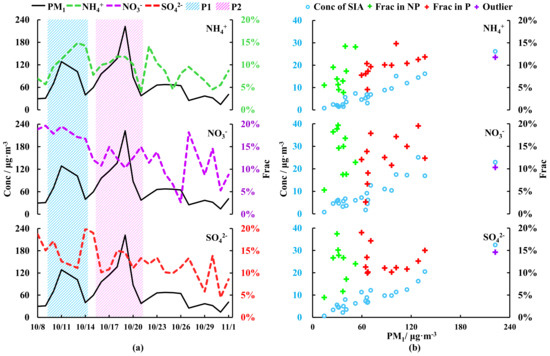
Figure 6.
Variations in the concentrations and fractions of secondary inorganic aerosol (SIA) (conc: concentration; frac: fraction). (a) The time series of SIA mass fractions related to PM1 concentration; (b) the scatter plot of mass concentration and fractions of SIA as a function of PM1 concentration.
In order to explore the chemical reaction mechanism of SIA during submicron particulate pollution in SJZ, the variations in the daily mass fractions of SIA were displayed as a function of PM1 concentration, as shown in Figure 6b. According to the criterion of PM2.5 for NP and P, the corresponding critical concentration of PM1 in this study was 60 μg/m3. For the NP period, the mass fractions of SIA (in green plus sign) varied randomly between 4 and 20%. During the polluted period (in red plus sign), the mean contribution of NH4+ and SO42– increased by 4%, and NO3− had a slightly rising trend but with large fluctuation, indicating the vital effect of ammonium and sulfate on PM1 pollution. The tendency observed in this study was generally consistent with that observed in Beijing in autumn [31], opposite to that observed for NH4+, consistent with that observed for SO42− and NO3− in Handan [6] and totally different from that observed in Lanzhou [71]. Nevertheless, an outlier (the purple plus sign) that did not well fit the overall trend appeared at the high concentration range of PM1 (>200 μg/m3), which may imply another mechanism in the heavier pollution level, although this needs more data and further study.
The above discussion suggests that ammonium played an important role in the formation of haze episodes in SJZ, probably through promoting particle aging and neutralizing acidic substances [70]. Sulfate may be the functional component to worsen the pollution. Different chemical mechanisms for sulfate and nitrate may exist in different degrees of pollution [72]. There are likely to be complicated and region-based chemical mechanisms of the secondary formation of submicron pollution, and further works based on more abundant observations are needed to explore the detailed relationships and interactions between SIA ions.
3.3. Sectoral Source Apportionment and Regional Source Identification
Source apportionment is a widely used method to explore the sectoral origins of pollutants. The whole samples of PM1 and PM2.5, from 8 October to 1 November, were analyzed by the PMF model. Between five and seven factors were tested and a five-factor solution was finally chosen (Figure 7a,b).
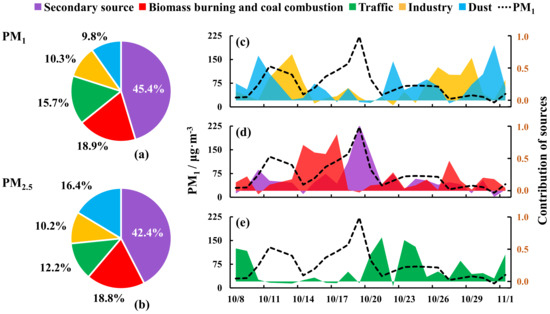
Figure 7.
Positive matrix factorization (PMF) results of sources and their contributions to PM1 (a) and PM2.5 (b), and the time series during the study period (c–e).
Factor 1 was characterized by the high loading of NH4+, NO3−, and SO42−, and was identified as secondary source (SS), accounting for the largest contribution of 45.4% to PM1, 3.0% higher than PM2.5, which probably resulted from the size distribution of smaller-diameter secondary components [60]. The time series of contributions from SS (Figure 7d) peaked in the two heavy haze periods, in accordance with the variations of PM1 concentration, confirming the major contribution of secondary transformation for PM1 pollution in SJZ.
Factor 2 was classified as the biomass burning and coal combustion source (BB&CC), with about 50% loading of K+ and Cl−, respectively. This factor was the second largest contribution source during the study period, accounting for 18.9% of PM1 and 18.8% of PM2.5. The time series of the contribution from BB&CC peaked at the pollutant accumulation process, especially for P2 (Figure 7d), confirming the contribution of CC concluded in Section 3.2. Coal is the dominant (~70%) energy consumed in SJZ [73], and biomass burning occurred frequently in this harvest season [32]. These made BB&CC sources play a vital role in the occurrence of submicron haze events in SJZ in autumn.
Factor 3 had a distinctly high loading of Cr and Ni, and can be classified as the traffic source (TR), explaining 15.7% of PM1 and 12.2% of PM2.5. Ni is an important component of three-way catalytic converters, and as a result, is widely used as a tracer of traffic sources [74]. Cr was related to driving processes such as road dust and brake wear [75]. The higher proportion of TR in PM1 may be attributed to ultrafine particles emitted from both diesel- and gasoline-powered engines [76].
Factor 4, with high loading of metallic elements such as Mg, Mn, Fe, Ni, Cu, Zn, and Pb, was classified as the industry source (IN). Mg and Zn are the dominant components of the textile industry in fine particulates [77]; Mn and Fe are associated with steel works [78]; and Ni, Cu, Zn, and Pb are related to industrial processes such as refining, mining, and metal smelting [79,80], which are the dominant industries in the cities of southern Hebei [81]. This source accounted for 10.3% of PM1 and 10.2% of PM2.5. The time series of peak factor contribution are consistent with P1 (Figure 7c) being the active source for this event.
Factor 5 was recognized as the dust source (DU), and was characterized by Na, Cr, Sr, and Na+, which commonly originate from natural sources. Na and Sr were mostly from crustal sources [80], and Na+ was probably from sea salt [82]. This source accounted for 9.8% of PM1 and 16.4% of PM2.5. The time series of DU contribution also presented a consistent variation of PM1 concentration during P1 (Figure 7c), indicating the noticeable combined effect of dust and industrial sources for mild or moderate haze pollution in SJZ.
As this is the first study to apportion source contributions to PM1 in SJZ, an overview of those determined for PM2.5 is summarized in Table 4 to evaluate the results of this study. The source profile could be explained by about five to six factors, including secondary source, industry, traffic (vehicle), coal combustion, biomass burning, and dust, primarily consistent with this study. As for the autumn source contributions, the results in this study were generally acceptable, compared with the results from Huang et al. [83] and published data from the local government [84]. The higher proportion of secondary source than the annual average level [85] may result from intensive biomass burning during the study period. The lower fraction of traffic may be attributed to stricter vehicle restriction measures during severe air pollution [34]. In contrast with the results of other PM1 studies, the contribution of secondary source was much higher than that observed in Xi’an [86], but lower for other sources, indicating a greater secondary formation of submicron pollution in SJZ than in cities in Central China. Additionally, the dust source in SJZ also deserves extra attention because of its relatively high percentage in PM1 compared with Guangzhou [7], which had an equivalent contribution of secondary source.
Table 4.
Positive matrix factorization (PMF) results of PM2.5 in Shijiazhuang obtained in previous studies.
The regional contributions to PM1 are presented in Figure 8. For the general condition (Figure 8a), local southern Hebei, mid-eastern Shanxi, and northern Henan were the major contribution regions for SJZ PM1 during the study period. The local SJZ and neighbor cities in Shanxi distinctly accounted for the main regional contribution during the polluted period (Figure 8b), which suggests that combined control plans in PM pollution should be carried out to effectively mitigate the severity of haze episodes in this area. To understand the regional distribution of the two biggest sectoral sources for SJZ (SS and BB&CC), PSCF analysis was also performed for SIA, K+, and Cl− (Figure 8c–g). For NH4+ and NO3−, neighboring cities in northern Henan may be responsible for the dominant contribution, while for SO42− some regions in Shanxi and Shandong should also be considered, probably because of the high levels of heavy industry in these areas [88]. The regions along the border of Henan and Shandong were the major contributors of K+ and Cl− during the study period and fit well with the distribution of biomass burning activities [32] and coal consumptions [73]. Furthermore, the contribution from the regions around Beijing, Langfang, and Tianjin to coal combustion should also be taken into account according to the results of the Cl− analysis.
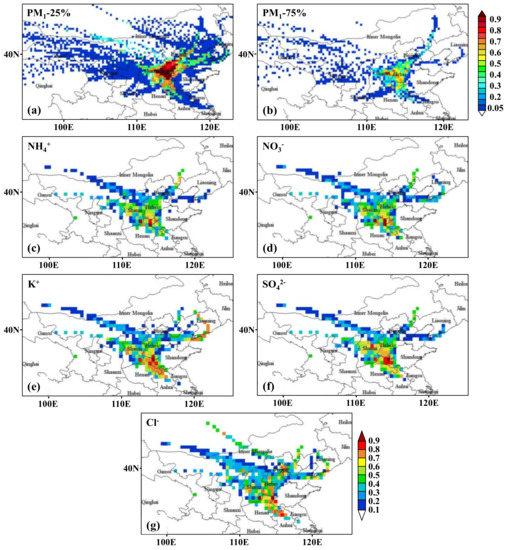
Figure 8.
Potential source contribution function (PSCF) analysis results for regional contributions to SJZ under the criterion of 25th percentage PM1 concentration (a), and 75th percentage PM1 concentration (b), NH4+ concentration (c), NO3− concentration (d), SO42− concentration (e), K+ concentration (f), and Cl− concentration (g).
3.4. Chemical Distribution and Transport Pathways
To clarify the chemical characteristics of different contribution regions, 600 PM1 trajectories were analyzed using the HYSPLIT model, and seven clusters were finally obtained (Figure 9). The corresponding PM1 concentration of each cluster was ranked in the order of Cluster 4 (C4, 93.96 μg/m3) > Cluster 5 (C5, 83.59 μg/m3) > Cluster 7 (C7, 82.58 μg/m3) > Cluster 1 (C1, 63.43 μg/m3) > Cluster 6 (C6, 63.19 μg/m3) > Cluster 3 (C3, 36.47 μg/m3) > Cluster 2 (C2, 31.28 μg/m3). C4 and C6 were the dominant clusters during the study period, with the sum of number contribution accounting for nearly 60% of the total, followed by C2 and C3; other clusters shared only a small part.
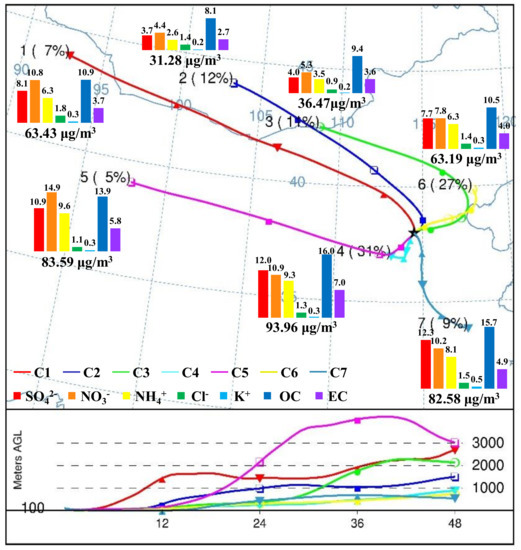
Figure 9.
Seven 48-h air particle backward trajectory clusters and the corresponding PM1 characteristics (AGL: above ground level).
C1 and C2 represented the areas located in the northwest of SJZ, including middle Hebei and most parts of Inner Mongolia province. Although the average PM1 concentration was classified at a polluted level (>60 μg/m3), the long-range transport weakened the contribution of C1 and C2 (19%), which may not be the major contribution pathways for SJZ during the study period.
C3 and C6 mainly represented the northern and northeastern contribution regions for SJZ. C3 was apparently a continuation of C6, transporting through central Inner Mongolia from north to southeast, and then traversing the BTH region from east to southwest. The curving path is likely attributable to the special terrain and location of this area as shown in Figure 1b. The proportion of OC in PM1 under these two pathways was relatively high. C6 mainly represented the mid-BTH region, involving several heavily polluted cities such as Tangshan (TS), Tianjin (TJ), Langfang (LF), and Baoding (BD). Previous studies showed the component of OC in this area was mostly emitted from fuel (e.g., coal and oil) burning [83]. Among the cities, TJ had a substantial vehicle population of 2.74 million in 2016 [89] and TS is famous for its steel production, powered by great quantities of coal burning [90]. These suggested vital contributions of fossil fuel burning sources from mid-BHT to SJZ during the study period.
C4 and C5 were the airflows from the northwest of SJZ. Similar to the relationship of C3 and C6, C5 was also a continuation of C4, from as far as Gansu and Ningxia provinces, meeting with C4 in Shanxi, and after crossing northern Hebei, finally arrived in SJZ. It was a typical pathway across the Taihang Mountains, with a transport height of over 3000 m above ground level. The concentration of SIA, OC, and EC in these two pathways were much higher than those in northern clusters, indicating a greater contribution from southern cities to SJZ. C4 mainly represented southern Hebei including local SJZ and eastern Shanxi, accounting for a higher proportion and mass concentration of PM1 than all other clusters. C4 was occupied with extremely high mass concentrations of SIA and OC, implying that secondary source from local southern Hebei and regional transport from eastern Shanxi [91] played significant roles in haze events in SJZ.
C7 was another curving pathway from the southeast of SJZ. It was probably shaped by the special terrain (plain is surrounded by mountains in west and south) of NCP, including Henan, Shandong, Anhui, and Jiangsu province (Figure 1b). As well as for SIA and OC, C7 also had a relatively higher concentration of K+ (0.53 μg/m3) compared with other clusters, and as K+ is widely used as the tracer of biomass burning source, this result indicates a considerable contribution of biomass burning from southern NCP to SJZ. This observation was consistent with the conclusion made in Section 3.3. Heavy agricultural activities in the passing regions of C7 could explain the high concentration of PM1 of C7.
In order to identify the contributions of each cluster to haze episodes in SJZ, two heavy polluted events (peak PM2.5 concentration >150 μg/m3), which happened during the study period, were chosen to analyze the detailed processes (Figure 10). Because of the lack of hourly PM1 data, hourly PM2.5 concentrations were collected from the published data of the Ministry of Environmental Protection [92] for the further analysis. P1 occurred between 16:00 on 10 October and 20:00 on 13 October, with a duration of 77 h and a peak PM2.5 concentration of 253 μg/m3 (Figure 10a). P2 occurred between 18:00 on 15 October and 14:00 on 20 October, with a duration of 117 h and a peak PM2.5 concentration of 321 μg/m3 (Figure 10b). It can clearly be seen that during the pollutant accumulation period (in red shadow), C4 and C6 were the major contribution clusters both for P1 and P2, confirming the analysis discussed above. Additionally, C5 and C7 were probably other potential transport paths for pollutants for P1 and P2, respectively, because these two pathways raised the concentration of PM2.5 from NP to P condition at the beginning. For the clear process of pollutants (in green shadow), there was a difference between P1 and P2. The relatively clean airflow from C5 decreased the PM2.5 concentration of P1. In P2, the airflow from C7 may reduce the severity of the heavy haze.
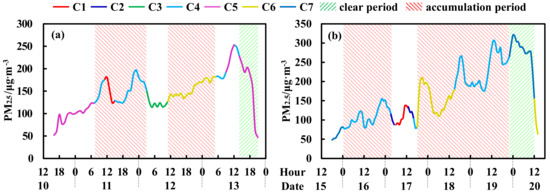
Figure 10.
The dominant contributions of seven transport pathways during the haze episodes of (a) period 1 and (b) period 2.
4. Conclusions
Submicron particulate (PM1) pollution became an increasingly serious issue with the development of research on heavy haze episodes in China. However, there have been few studies on the characteristics of PM1 pollution in Shijiazhuang (SJZ), which is one of the most polluted cities in China and in the world. Therefore, an intensive campaign to simultaneously sample PM1 and PM2.5 was conducted during autumn 2016 in SJZ.
The results show that SJZ suffers from severe submicron pollution. The average mass concentrations of PM1 and PM2.5 were found to be 70.51 ± 47.30 μg/m3 and 91.68 ± 54.85 μg/m3, respectively, higher than most sites in the world. The average ratio of PM1/PM2.5 was 0.75 during the study period in SJZ, which ranked highly compared with previous studies, and had an increasing trend as a function of PM1 concentration. WSII (especially SIA) were the dominant component in both PM1 (40.0%) and PM2.5 (42.0%), followed by OM (28.8% in PM1, 26.9% in PM2.5) and EC (7.1% in PM1, 6.4% in PM2.5). The mass fractions of TE (6.5% in PM1, 7.2% in PM2.5) were lower than those of EC in PM1, but higher in PM2.5.
SIA is found to be the key component for the formation of PM1 pollution in SJZ. The profiles of chemical compositions in non-polluted and polluted periods had similar variations in both PM1 and PM2.5 with the exception of SIA, which increased by 0.8% in PM1 and decreased by 0.5% in PM2.5, suggesting the importance of SIA in the formation of submicron particulate pollution. Further analysis of SIA in PM1 found that NH4+ promoted the occurrence of haze pollution in SJZ, while SO42− and NO3− worsened the pollution by different chemical mechanisms as the PM1 concentration rose. Different pollution levels may also be driven by different chemical mechanisms.
The first ever source apportionment of PM1 in SJZ was carried out in this study. The sectoral sources analysis showed that the major sources of haze pollution for SJZ were the following: (1) secondary source, (2) biomass burning and coal combustion, (3) traffic, (4) industry, and (5) dust, with percentages of 45.4%, 18.9%, 15.7%, 10.3%, and 9.8%, respectively, being observed in PM1, and 42.4%, 18.8%, 12.2%, 10.2%, and 16.4%, respectively, being observed in PM2.5. Regional source identification showed that local southern Hebei, mid-eastern Shanxi, and northern Henan were the dominant functional areas during the study period. Moreover, cluster analysis showed that three transport pathways, including the airflow from Shanxi with the secondary source (C4), the airflow from mid-BTH region with the fuel burning source (C6), and the airflow from southern NCP with the biomass burning source (C7), should be given more attention during combined control to weaken the severity of haze pollution in SJZ.
This study carried out a detailed and systematic analysis of submicron pollution in a heavily polluted city, which explored the chemical characteristics of PM1 and PM2.5, emphasized the importance of SIA on the mitigation of PM1 pollution, and identified the source and regional contributions for haze pollution. However, because of the limitation of the dataset, there are inevitably some uncertainties in this analysis, such as source apportionment and trajectory clustering, and, therefore, more samples would be better for more refined and precise research on PM1 pollution.
Author Contributions
Methodology, Ya.Z.; Validation, Yi.Z. and D.C.; Formal Analysis, S.L.; Resources, H.W.; Data Curation, H.Z.; Writing—Original Draft Preparation, S.L.; Writing—Review & Editing, J.L.; Visualization, S.L.; Supervision, S.C.
Funding
This research was supported by the Natural Sciences Foundation of China (No. 91644110 & 51878012), the Key Projects on Heavy Air Pollution Control (DQGG0303), and the New Talent Program of Beijing University of Technology (No. 2017-RX(1)-10).
Acknowledgments
We greatly appreciated Beijing Municipal Commission of Education and Beijing Municipal Commission of Science and Technology for supporting this work. The authors are grateful to the anonymous reviewers for their insightful comments.
Conflicts of Interest
The authors declare no conflict of interest.
References
- Han, R.; Wang, S.; Shen, W.; Wang, J.; Wu, K.; Ren, Z.; Feng, M. Spatial and temporal variation of haze in China from 1961 to 2012. J. Environ. Sci. 2016, 46, 134–146. [Google Scholar] [CrossRef] [PubMed]
- Qiao, X.; Ying, Q.; Li, X.H.; Zhang, H.L.; Hu, J.L.; Tang, Y.; Chen, X. Source apportionment of PM2.5 for 25 Chinese provincial capitals and municipalities using a source-oriented Community Multiscale Air Quality model. Sci. Total Environ. 2018, 612, 462–471. [Google Scholar] [CrossRef] [PubMed]
- Singh, A.; Bloss, W.J.; Pope, F.D. 60 years of UK visibility measurements: Impact of meteorology and atmospheric pollutants on visibility. Atmos. Chem. Phys. 2017, 17, 2085–2101. [Google Scholar] [CrossRef]
- Zhang, J.; Liu, Y.; Cui, L.L.; Liu, S.Q.; Yin, X.X.; Li, H.C. Ambient air pollution, smog episodes and mortality in Jinan, China. Sci. Rep. 2017, 7. [Google Scholar] [CrossRef] [PubMed]
- Yao, L. Causative impact of air pollution on evapotranspiration in the North China Plain. Environ. Res. 2017, 158, 436–442. [Google Scholar] [CrossRef] [PubMed]
- Li, H.; Zhang, Q.; Zhang, Q.; Chen, C.; Wang, L.; Wei, Z.; Zhou, S.; Parworth, C.; Zheng, B.; Canonaco, F.; et al. Wintertime aerosol chemistry and haze evolution in an extremely polluted city of the North China Plain: Significant contribution from coal and biomass combustion. Atmos. Chem. Phys. 2017, 17, 4751–4768. [Google Scholar] [CrossRef]
- Tao, J.; Shen, Z.X.; Zhu, C.S.; Yue, J.H.; Cao, J.J.; Liu, S.X.; Zhu, L.H.; Zhang, R.J. Seasonal variations and chemical characteristics of sub-micrometer particles (PM1) in Guangzhou, China. Atmos. Res. 2012, 118, 222–231. [Google Scholar] [CrossRef]
- Wang, Y.C.; Huang, R.J.; Ni, H.Y.; Chen, Y.; Wang, Q.Y.; Li, G.H.; Tie, X.X.; Shen, Z.X.; Huang, Y.; Liu, S.X.; et al. Chemical composition, sources and secondary processes of aerosols in Baoji city of northwest China. Atmos. Environ. 2017, 158, 128–137. [Google Scholar] [CrossRef]
- Zhang, J.K.; Cheng, M.T.; Ji, D.S.; Liu, Z.R.; Hu, B.; Sun, Y.; Wang, Y.S. Characterization of submicron particles during biomass burning and coal combustion periods in Beijing, China. Sci. Total Environ. 2016, 562, 812–821. [Google Scholar] [CrossRef] [PubMed]
- Filep, A.; Fodor, G.H.; Kun-Szabo, F.; Tiszlavicz, L.; Razga, Z.; Bozso, G.; Bozoki, Z.; Szabo, G.; Petak, F. Exposure to urban PM1 in rats: Development of bronchial inflammation and airway hyperresponsiveness. Respir. Res. 2016, 17. [Google Scholar] [CrossRef] [PubMed]
- Widziewicz, K.; Rogula-Kozlowska, W.; Rogula-Kopiec, P.; Majewski, G.; Loska, K. PM1 and PM1-bound metals during dry and wet periods: Ambient concentration and health effects. Environ. Eng. Sci. 2017, 34. [Google Scholar] [CrossRef]
- van Drooge, B.L.; Marqueno, A.; Grimalt, J.O.; Fernandez, P.; Porte, C. Comparative toxicity and endocrine disruption potential of urban and rural atmospheric organic PM1 in JEG-3 human placental cells. Environ. Pollut. 2017, 230, 378–386. [Google Scholar] [CrossRef] [PubMed]
- Singh, D.K.; Gupta, T. Source apportionment and risk assessment of PM, bound trace metals collected during foggy and non-foggy episodes at a representative site in the Indo-Gangetic plain. Sci. Total Environ. 2016, 550, 80–94. [Google Scholar] [CrossRef] [PubMed]
- Chang, L.T.; Tang, C.S.; Pan, Y.Z.; Chan, C.C. Association of heart rate variability of the elderly with personal exposure to PM1, PM1-2.5, and PM2.5-10. B. Environ. Contam. Tox. 2007, 79, 552–556. [Google Scholar] [CrossRef] [PubMed]
- Talbi, A.; Kerchich, Y.; Kerbachi, R.; Boughedaoui, M. Assessment of annual air pollution levels with PM1, PM2.5, PM10 and associated heavy metals in Algiers, Algeria. Environ. Pollut. 2018, 232, 252–263. [Google Scholar] [CrossRef] [PubMed]
- Yausheva, E.P.; Kozlov, V.S.; Belan, B.D.; Arshinov, M.Y.; Chernov, D.G.; Shmargunov, V.P. In differences in seasonal average concentrations of aerosol and black carbon and particle size distributions from the data of monitoring in tomsk and under background conditions in 2014–2015. In Proceedings of the 22nd International Symposium on Atmospheric and Ocean Optics—Atmospheric Physics, Tomsk, Russia, 30 June–3 July 2016. [Google Scholar]
- Sun, Y.; Xu, W.; Zhang, Q.; Jiang, Q.; Canonaco, F.; Prevot, A.S.H.; Fu, P.; Li, J.; Jayne, J.; Worsnop, D.R.; et al. Source apportionment of organic aerosol from 2-year highly time-resolved measurements by an aerosol chemical speciation monitor in Beijing, China. Atmos. Chem. Phys. 2018, 18, 8469–8489. [Google Scholar] [CrossRef]
- Ji, D.; Zhang, J.; He, J.; Wang, X.; Pang, B.; Liu, Z.; Wang, L.; Wang, Y. Characteristics of atmospheric organic and elemental carbon aerosols in urban Beijing, China. Atmos. Environ. 2016, 125, 293–306. [Google Scholar] [CrossRef]
- Wang, L.; Wen, T.X.; Miao, H.Y.; Gao, W.K.; Wang, Y.S. Concentrations and size distributions of water-soluble inorganic ions in aerosol particles in Taiyuan, Shanxi. Environ. Sci. 2016, 9, 3249–3257. [Google Scholar]
- Pan, Y.; Wang, Y.; Zhang, J.; Liu, Z.; Wang, L.; Tian, S.; Tang, G.; Gao, W.; Ji, D.; Song, T.; et al. Redefining the importance of nitrate during haze pollution to help optimize an emission control strategy. Atmos. Environ. 2016, 141, 197–202. [Google Scholar] [CrossRef]
- Sun, Y.; Jiang, Q.; Xu, Y.; Ma, Y.; Zhang, Y.; Liu, X.; Li, W.; Wang, F.; Li, J.; Wang, P.; et al. Aerosol characterization over the North China Plain: Haze life cycle and biomass burning impacts in summer. J. Geophys. Res. Atmos. 2016, 121, 2508–2521. [Google Scholar] [CrossRef]
- Lee, B.P.; Wang, H.; Chan, C.K. Diurnal and day-to-day characteristics of ambient particle mass size distributions from HR-ToF-AMS measurements at an urban site and a suburban site in Hong Kong. Atmos. Chem. Phys. 2017, 17, 13605–13624. [Google Scholar] [CrossRef]
- Du, W.; Zhao, J.; Wang, Y.; Zhang, Y.; Wang, Q.; Xu, W.; Chen, C.; Han, T.; Zhang, F.; Li, Z.; et al. Simultaneous measurements of particle number size distributions at ground level and 260 m on a meteorological tower in urban Beijing, China. Atmos. Chem. Phys. 2017, 17, 6797–6811. [Google Scholar] [CrossRef]
- Arndt, J.; Sciare, J.; Mallet, M.; Roberts, G.C.; Marchand, N.; Sartelet, K.; Sellegri, K.; Dulac, F.; Healy, R.M.; Wenger, J.C. Sources and mixing state of summertime background aerosol in the north-western Mediterranean basin. Atmos. Chem. Phys. 2017, 17, 6975–7001. [Google Scholar] [CrossRef]
- Caggiano, R.; Macchiato, M.; Trippetta, S. Levels, chemical composition and sources of fine aerosol particles (PM1) in an area of the Mediterranean basin. Sci. Total Environ. 2010, 408, 884–895. [Google Scholar] [CrossRef] [PubMed]
- Zhang, Y.; Lang, J.; Cheng, S.; Li, S.; Zhou, Y.; Chen, D.; Zhang, H.; Wang, H. Chemical composition and sources of PM1 and PM2.5 in Beijing in autumn. Sci Total Environ. 2018, 630, 72–82. [Google Scholar] [CrossRef] [PubMed]
- The Official Website of China National Environmental Monitoring Centre. Available online: http://www.cnemc.cn/ (accessed on 6 August 2018).
- The Official Website of Shijiazhuang Environmental Protection Bureau. Available online: http://www.sjzhb.gov.cn/ (accessed on 6 August 2018).
- Wang, Y.; Bao, S.; Wang, S.; Hu, Y.; Shi, X.; Wang, J.; Zhao, B.; Jiang, J.; Zheng, M.; Wu, M.; et al. Local and regional contributions to fine particulate matter in Beijing during heavy haze episodes. Sci. Total Environ. 2017, 580, 283–296. [Google Scholar] [CrossRef] [PubMed]
- Maji, K.J.; Arora, M.; Dikshit, A.K. Burden of disease attributed to ambient PM2.5 and PM10 exposure in 190 cities in China. Environ. Sci. Pollut. Res. 2017, 24, 11559–11572. [Google Scholar] [CrossRef] [PubMed]
- Hu, W.; Hu, M.; Hu, W.W.; Zheng, J.; Chen, C.; Wu, Y.S.; Guo, S. Seasonal variations in high time-resolved chemical compositions, sources, and evolution of atmospheric submicron aerosols in the megacity Beijing. Atmos. Chem. Phys. 2017, 17, 9979–10000. [Google Scholar] [CrossRef]
- Zhou, Y.; Xing, X.; Lang, J.; Chen, D.; Cheng, S.; Wei, L.; Wei, X.; Liu, C. A comprehensive biomass burning emission inventory with high spatial and temporal resolution in China. Atmos. Chem. Phys. 2017, 17, 2839–2864. [Google Scholar] [CrossRef]
- Chen, J.; Li, C.; Ristovski, Z.; Milic, A.; Gu, Y.; Islam, M.S.; Wang, S.; Hao, J.; Zhang, H.; He, C.; et al. A review of biomass burning: Emissions and impacts on air quality, health and climate in China. Sci. Total Environ. 2017, 579, 1000–1034. [Google Scholar] [CrossRef] [PubMed]
- The Official Website of Shijiazhuang Municipal People’s Government. Available online: http://www.sjz.gov.cn/ (accessed on 6 August 2018).
- Shijiazhuang Municipal Bureau of Statistics. Shijiazhuang Statistical Yearbook; China Statistics Press: Beijing, China, 2016. [Google Scholar]
- Shijiazhuang Municipal People’s Government. Heat Supply Regulations in Shijiazhuang. Available online: http://www.sjz.gov.cn/col/1497948667745/2013/06/05/1497954766982.html (accessed on 4 September 2018).
- Zhao, X.J.; Zhao, P.S.; Xu, J.; Meng, W.; Pu, W.W.; Dong, F.; He, D.; Shi, Q.F. Analysis of a winter regional haze event and its formation mechanism in the North China Plain. Atmos. Chem. Phys. 2013, 13, 5685–5696. [Google Scholar] [CrossRef]
- Tang, L.; Yu, H.; Ding, A.; Zhang, Y.; Qin, W.; Wang, Z.; Chen, W.; Hua, Y.; Yang, X. Regional contribution to PM1 pollution during winter haze in Yangtze River Delta, China. Sci. Total Environ. 2016, 541, 161–166. [Google Scholar] [CrossRef] [PubMed]
- Paatero, P. Least squares formulation of robust non-negative factor analysis. Chem. Intell. Lab. Syst. 1997, 37, 23–35. [Google Scholar] [CrossRef]
- Tao, J.; Zhang, L.; Cao, J.; Zhang, R. A review of current knowledge concerning PM2.5 chemical composition, aerosol optical properties and their relationships across China. Atmos. Chem. Phys. 2017, 17, 9485–9518. [Google Scholar] [CrossRef]
- Argyropoulos, G.; Samara, C.; Diapouli, E.; Eleftheriadis, K.; Papaoikonomou, K.; Kungolos, A. Source apportionment of PM10 and PM2.5 in major urban Greek agglomerations using a hybrid source-receptor modeling process. Sci. Total Environ. 2017, 601, 906–917. [Google Scholar] [CrossRef] [PubMed]
- Laakso, L.; Hussein, T.; Aarnio, P.; Komppula, M.; Hiltunen, V.; Viisanen, Y.; Kulmala, M. Diurnal and annual characteristics of particle mass and number concentrations in urban, rural and Arctic environments in Finland. Atmos. Environ. 2003, 37, 2629–2641. [Google Scholar] [CrossRef]
- Bourcier, L.; Sellegri, K.; Chausse, P.; Pichon, J.M.; Laj, P. Seasonal variation of water-soluble inorganic components in aerosol size-segregated at the puy de Dome station (1,465 m a.s.l.), France. J. Atmos. Chem. 2012, 69, 47–66. [Google Scholar] [CrossRef]
- Zhang, Y.J.; Tang, L.L.; Wang, Z.; Yu, H.X.; Sun, Y.L.; Liu, D.; Qin, W.; Canonaco, F.; Prevot, A.S.H.; Zhang, H.L.; et al. Insights into characteristics, sources, and evolution of submicron aerosols during harvest seasons in the Yangtze River delta region, China. Atmos. Chem. Phys. 2015, 15, 1331–1349. [Google Scholar] [CrossRef]
- Li, X.; Zhang, R.; Cong, X.; Cheng, L.; Liu, J.; Xu, H. Characterization of the size-segregated inorganic compounds in Lin’an, a regional atmosphere background station in the Yangtze River Delta region. Atmos. Pollut. Res. 2015, 6, 1058–1065. [Google Scholar] [CrossRef]
- Li, Y.J.; Lee, B.P.; Su, L.; Fung, J.C.H.; Chan, C.K. Seasonal characteristics of fine particulate matter (PM) based on high-resolution time-of-flight aerosol mass spectrometric (HR-ToF-AMS) measurements at the HKUST Supersite in Hong Kong. Atmos. Chem. Phys. 2015, 15, 37–53. [Google Scholar] [CrossRef]
- Gong, W.; Zhang, T.H.; Zhu, Z.M.; Ma, Y.Y.; Ma, X.; Wang, W. Characteristics of PM1.0, PM2.5, and PM10, and Their Relation to Black Carbon in Wuhan, Central China. Atmosphere 2015, 6, 1377–1387. [Google Scholar] [CrossRef]
- Zhao, T.; Yang, L.X.; Yan, W.D.; Zhang, J.M.; Lu, W.; Yang, Y.M.; Chen, J.M.; Wang, W.X. Chemical characteristics of PM1/PM2.5 and influence on visual range at the summit of Mount Tai, North China. Sci. Total Environ. 2017, 575, 458–466. [Google Scholar] [CrossRef] [PubMed]
- Pennanen, A.S.; Sillanpaa, M.; Hillamo, R.; Quass, U.; John, A.C.; Branis, M.; Hunova, I.; Meliefste, K.; Janssen, N.A.H.; Koskentalo, T.; et al. Performance of a high-volume cascade impactor in six European urban environments: Mass measurement and chemical characterization of size-segregated particulate samples. Sci. Total Environ. 2007, 374, 297–310. [Google Scholar] [CrossRef] [PubMed]
- Amato, F.; Moreno, T.; Pandolfi, M.; Querol, X.; Alastuey, A.; Delgado, A.; Pedrero, M.; Cots, N. Concentrations, sources and geochemistry of airborne particulate matter at a major European airport. J. Environ. Monit. 2010, 12, 854–862. [Google Scholar] [CrossRef] [PubMed]
- Rashki, A.; Rautenbach, C.J.D.; Eriksson, P.G.; Kaskaoutis, D.G.; Gupta, P. Temporal changes of particulate concentration in the ambient air over the city of Zahedan, Iran. Air Qual. Atmos. Health. 2013, 6, 123–135. [Google Scholar] [CrossRef]
- Nicolas, J.F.; Galindo, N.; Yubero, E.; Crespo, J.; Soler, R. PM1 variability and transport conditions between an urban coastal area and a high mountain site during the cold season. Atmos. Environ. 2015, 118, 127–134. [Google Scholar] [CrossRef]
- Bocchi, C.; Bazzini, C.; Fontana, F.; Pinto, G.; Martino, A.; Cassoni, F. Characterization of urban aerosol: Seasonal variation of mutagenicity and genotoxicity of PM2.5, PM1 and semi-volatile organic compounds. Mutation Res. Genet. Toxicol. Environ. Mutagen. 2016, 809, 16–23. [Google Scholar] [CrossRef] [PubMed]
- Gholampour, A.; Nabizadeh, R.; Naseri, S.; Yunesian, M.; Taghipour, H.; Rastkari, N.; Nazmara, S.; Faridi, S.; Mahvi, A.H. Exposure and health impacts of outdoor particulate matter in two urban and industrialized area of Tabriz, Iran. J. Environ. Sci. Health. Eng. 2014, 12, 27. [Google Scholar] [CrossRef] [PubMed]
- Ripoll, A.; Pey, J.; Minguillon, M.C.; Perez, N.; Pandolfi, M.; Querol, X.; Alastuey, A. Three years of aerosol mass, black carbon and particle number concentrations at Montsec (southern Pyrenees, 1570 m a.s.l.). Atmos. Chem. Phys. 2014, 14, 4279–4295. [Google Scholar] [CrossRef]
- Singh, A.; Rastogi, N.; Sharma, D.; Singh, D. Inter and Intra-Annual Variability in Aerosol Characteristics over Northwestern Indo-Gangetic Plain. Aerosol Air Qual. Res. 2015, 15, 376–386. [Google Scholar] [CrossRef]
- Wu, R.; Zhou, X.; Wang, L.; Wang, Z.; Zhou, Y.; Zhang, J.; Wang, W. PM2.5 Characteristics in Qingdao and across Coastal Cities in China. Atmosphere 2017, 8, 77. [Google Scholar] [CrossRef]
- Ye, Z.; Li, Q.; Liu, J.; Luo, S.; Zhou, Q.; Bi, C.; Ma, S.; Chen, Y.; Chen, H.; Li, L.; et al. Investigation of submicron aerosol characteristics in Changzhou, China: Composition, source, and comparison with co-collected PM2.5. Chemosphere 2017, 183, 176–185. [Google Scholar] [CrossRef] [PubMed]
- Turpin, B.J.; Lim, H.J. Species contributions to PM2.5 mass concentrations: Revisiting common assumptions for estimating organic mass. Aerosol Sci. Technol. 2001, 35, 602–610. [Google Scholar] [CrossRef]
- Bernardoni, V.; Elser, M.; Valli, G.; Valentini, S.; Bigi, A.; Ferrno, P.; Piazzalunga, A.; Vecchi, R. Size-segregated aerosol in a hot-spot pollution urban area: Chemical composition and three-way source apportionment. Environ. Pollut. 2017, 231, 601–611. [Google Scholar] [CrossRef] [PubMed]
- Pakkanen, T.A.; Kerminen, V.M.; Loukkola, K.; Hillamo, R.E.; Aarnio, P.; Koskentalo, T.; Maenhaut, W. Size distributions of mass and chemical components in street-level and rooftop PM1 particles in Helsinki. Atmos. Environ. 2003, 37, 1673–1690. [Google Scholar] [CrossRef]
- Agarwal, S.; Aggarwal, S.G.; Okuzawa, K.; Kawamura, K. Size distributions of dicarboxylic acids, ketoacids, alpha-dicarbonyls, sugars, WSOC, OC, EC and inorganic ions in atmospheric particles over Northern Japan: implication for long-range transport of Siberian biomass burning and East Asian polluted aerosols. Atmos. Chem. Phys. 2010, 10, 5839–5858. [Google Scholar] [CrossRef]
- Budisulistiorini, S.H.; Baumann, K.; Edgerton, E.S.; Bairai, S.T.; Mueller, S.; Shaw, S.L.; Knipping, E.M.; Gold, A.; Surratt, J.D. Seasonal characterization of submicron aerosol chemical composition and organic aerosol sources in the southeastern United States: Atlanta, Georgia, and Look Rock, Tennessee. Atmos. Chem. Phys. 2016, 16, 5171–5189. [Google Scholar] [CrossRef]
- Young, D.E.; Allan, J.D.; Williams, P.I.; Green, D.C.; Flynn, M.J.; Harrison, R.M.; Yin, J.; Gallagher, M.W.; Coe, H. Investigating the annual behaviour of submicron secondary inorganic and organic aerosols in London. Atmos. Chem. Phys. 2015, 15, 6351–6366. [Google Scholar] [CrossRef]
- Xu, P.; Zhang, J.; Ji, D.; Liu, Z.; Tang, G.; Jiang, C.; Wang, Y. Characterization of submicron particles during autumn in Beijing, China. J. Environ. Sci. (China) 2018, 63, 16–27. [Google Scholar] [CrossRef] [PubMed]
- The Website of National Meteorological Information Center. Available online: http://data.cma.cn/site/index.html (accessed on 6 August 2018).
- Ye, X.N.; Chen, J.M. Haze and particulate matter moisture absorption increased. Chin. J. Nat. 2013, 35, 337–341. [Google Scholar]
- Tan, H.; Cai, M.; Fan, Q.; Liu, L.; Li, F.; Chan, P.W.; Deng, X.; Wu, D. An analysis of aerosol liquid water content and related impact factors in Pearl River Delta. Sci. Total Environ. 2017, 579, 1822–1830. [Google Scholar] [CrossRef] [PubMed]
- Zhou, M.; Chen, C.H.; Wang, H.L.; Lou, S.R.; Qiao, L.P.; Chen, Y.R.; Li, L.; Huang, C.H.; Chen, M.H. The variation characteristics of organic and element carbon during air pollution episodes in autumn in Shanghai, China. Acta Sci. Circ. 2013, 33, 181–188. [Google Scholar]
- Zhou, M.; Chen, C.H.; Qiao, L.P.; Lou, S.R.; Wang, H.L.; Huang, H.Y.; Wang, Q.; Chen, M.H.; Chen, Y.R.; Li, L.; et al. The chemical characteristics of particulate matters in Shanghai during heavy air pollution episode in Central and Eastern China in January 2013. Acta Sci. Circ. 2013, 33, 3118–3126. [Google Scholar]
- Zhang, X.; Zhang, Y.; Sun, J.; Yu, Y.; Canonaco, F.; Prevot, A.S.H.; Li, G. Chemical characterization of submicron aerosol particles during wintertime in a northwest city of China using an Aerodyne aerosol mass spectrometry. Environ. Pollut. 2017, 222, 567–582. [Google Scholar] [CrossRef] [PubMed]
- Ge, X.; He, Y.; Sun, Y.; Xu, J.; Wang, J.; Shen, Y.; Chen, M. Characteristics and Formation Mechanisms of Fine Particulate Nitrate in Typical Urban Areas in China. Atmosphere 2017, 8, 62. [Google Scholar] [CrossRef]
- National Bureau of Statistics of China Energy Statistics Division. China Energy Statistical Yearbook; China Statistics Press: Beijing, China, 2016. [Google Scholar]
- Larese, C.; Galisteo, F.C.; Granados, M.L.; Mariscal, R.; Fierro, J.L.G.; Furio, M.; Ruiz, R.F. Deactivation of real three way catalysts by CePO4 formation. Appl. Catal. B Environ. 2003, 40, 305–317. [Google Scholar] [CrossRef]
- Pant, P.; Harrison, R.M. Estimation of the contribution of road traffic emissions to particulate matter concentrations from field measurements: A review. Atmos. Environ. 2013, 77, 78–97. [Google Scholar] [CrossRef]
- Myung, C.L.; Park, S. Exhaust nanoparticle emissions from internal combustion engines: A review. Int. J. Automot. Technol. 2012, 13, 9–22. [Google Scholar] [CrossRef]
- Chen, P.; Wang, T.; Dong, M.; Kasoar, M.; Han, Y.; Xie, M.; Li, S.; Zhuang, B.; Li, M.; Huang, T. Characterization of major natural and anthropogenic source profiles for size-fractionated PM in Yangtze River Delta. Sci. Total Environ. 2017, 598, 135–145. [Google Scholar] [CrossRef] [PubMed]
- You, S.; Yao, Z.; Dai, Y.; Wang, C.H. A comparison of PM exposure related to emission hotspots in a hot and humid urban environment: Concentrations, compositions, respiratory deposition, and potential health risks. Sci. Total Environ. 2017, 599, 464–473. [Google Scholar] [CrossRef] [PubMed]
- Cui, X.; Luan, W.; Song, Z.; Ma, Y. A study of the spatial distribution and source of heavy metals in urban soil in Shijiazhuang City. Geol. Chin. 2016, 43, 683–690. [Google Scholar]
- Lyu, Y.; Liu, L.; Guo, L.; Yang, Y.; Qu, Z.; Hu, X.; Zhang, G. Deposited atmospheric dust as influenced by anthropogenic emissions in northern China. Environ. Monit. Assess. 2017, 189. [Google Scholar] [CrossRef] [PubMed]
- Wang, L.T.; Wei, Z.; Yang, J.; Zhang, Y.; Zhang, F.F.; Su, J.; Meng, C.C.; Zhang, Q. The 2013 severe haze over southern Hebei, China: Model evaluation, source apportionment, and policy implications. Atmos. Chem. Phys. 2014, 14, 3151–3173. [Google Scholar] [CrossRef]
- Behrooz, R.D.; Esmaili-Sari, A.; Bahramifar, N.; Kaskaoutis, D.G.; Saeb, K.; Rajaei, F. Trace-element concentrations and water-soluble ions in size-segregated dust-borne and soil samples in Sistan, southeast Iran. Aeolian Res. 2017, 25, 87–105. [Google Scholar] [CrossRef]
- Huang, X.; Liu, Z.; Liu, J.; Hu, B.; Wen, T.; Tang, G.; Zhang, J.; Wu, F.; Ji, D.; Wang, L.; et al. Chemical characterization and source identification of PM2.5 at multiple sites in the Beijing-Tianjin-Hebei region, China. Atmos. Chem. Phys. 2017, 17, 12941–12962. [Google Scholar] [CrossRef]
- The Official Website of Hebei Provincial Department of Environmental Protection. Available online: http://www.hebhb.gov.cn/ (accessed on 6 August 2018).
- Liu, B.S.; Cheng, Y.; Zhou, M.; Liang, D.N.; Dai, Q.L.; Wang, L.; Jin, W.; Zhang, L.Z.; Ren, Y.B.; Zhou, J.B.; et al. Effectiveness evaluation of temporary emission control action in 2016 winter in Shijiazhuang, China. Atmos. Chem. Phys. 2018, 18, 7019–7039. [Google Scholar] [CrossRef]
- Shen, Z.; Cao, J.; Arimoto, R.; Han, Y.; Zhu, C.; Tian, J.; Liu, S. Chemical Characteristics of Fine Particles (PM1) from Xi’an, China. Aerosol Sci. Technol. 2010, 44, 461–472. [Google Scholar] [CrossRef]
- Guo, J.L. Study of Chemical Composition Features and Sources Apportionment of Atmospheric Particulate Matter during Haze in Shijiazhuang. Master Thesis, Beijing University of Chemical Technology, Beijing China, 2015. [Google Scholar]
- National Bureau of Statistics of China Industrial Statistics. China Industry Statistical Yearbook; China Statistics Press: Beijing, China, 2016. [Google Scholar]
- The Official Website of Tianjin Municipal People’s Government. Available online: http://www.tj.gov.cn/ (accessed on 6 August 2018).
- The Official Website of Tangshan Municipal People’s Government. Available online: http://www.tangshan.gov.cn/ (accessed on 6 August 2018).
- Wang, L.; Wei, Z.; Wei, W.; Fu, J.S.; Meng, C.; Ma, S. Source apportionment of PM2.5 in top polluted cities in Hebei, China using the CMAQ model. Atmos. Environ. 2015, 122, 723–736. [Google Scholar] [CrossRef]
- The Official Website of Ministry of Ecology and Environment of the People’s Republic of China. Available online: http://www.zhb.gov.cn/ (accessed on 6 August 2018).
© 2018 by the authors. Licensee MDPI, Basel, Switzerland. This article is an open access article distributed under the terms and conditions of the Creative Commons Attribution (CC BY) license (http://creativecommons.org/licenses/by/4.0/).