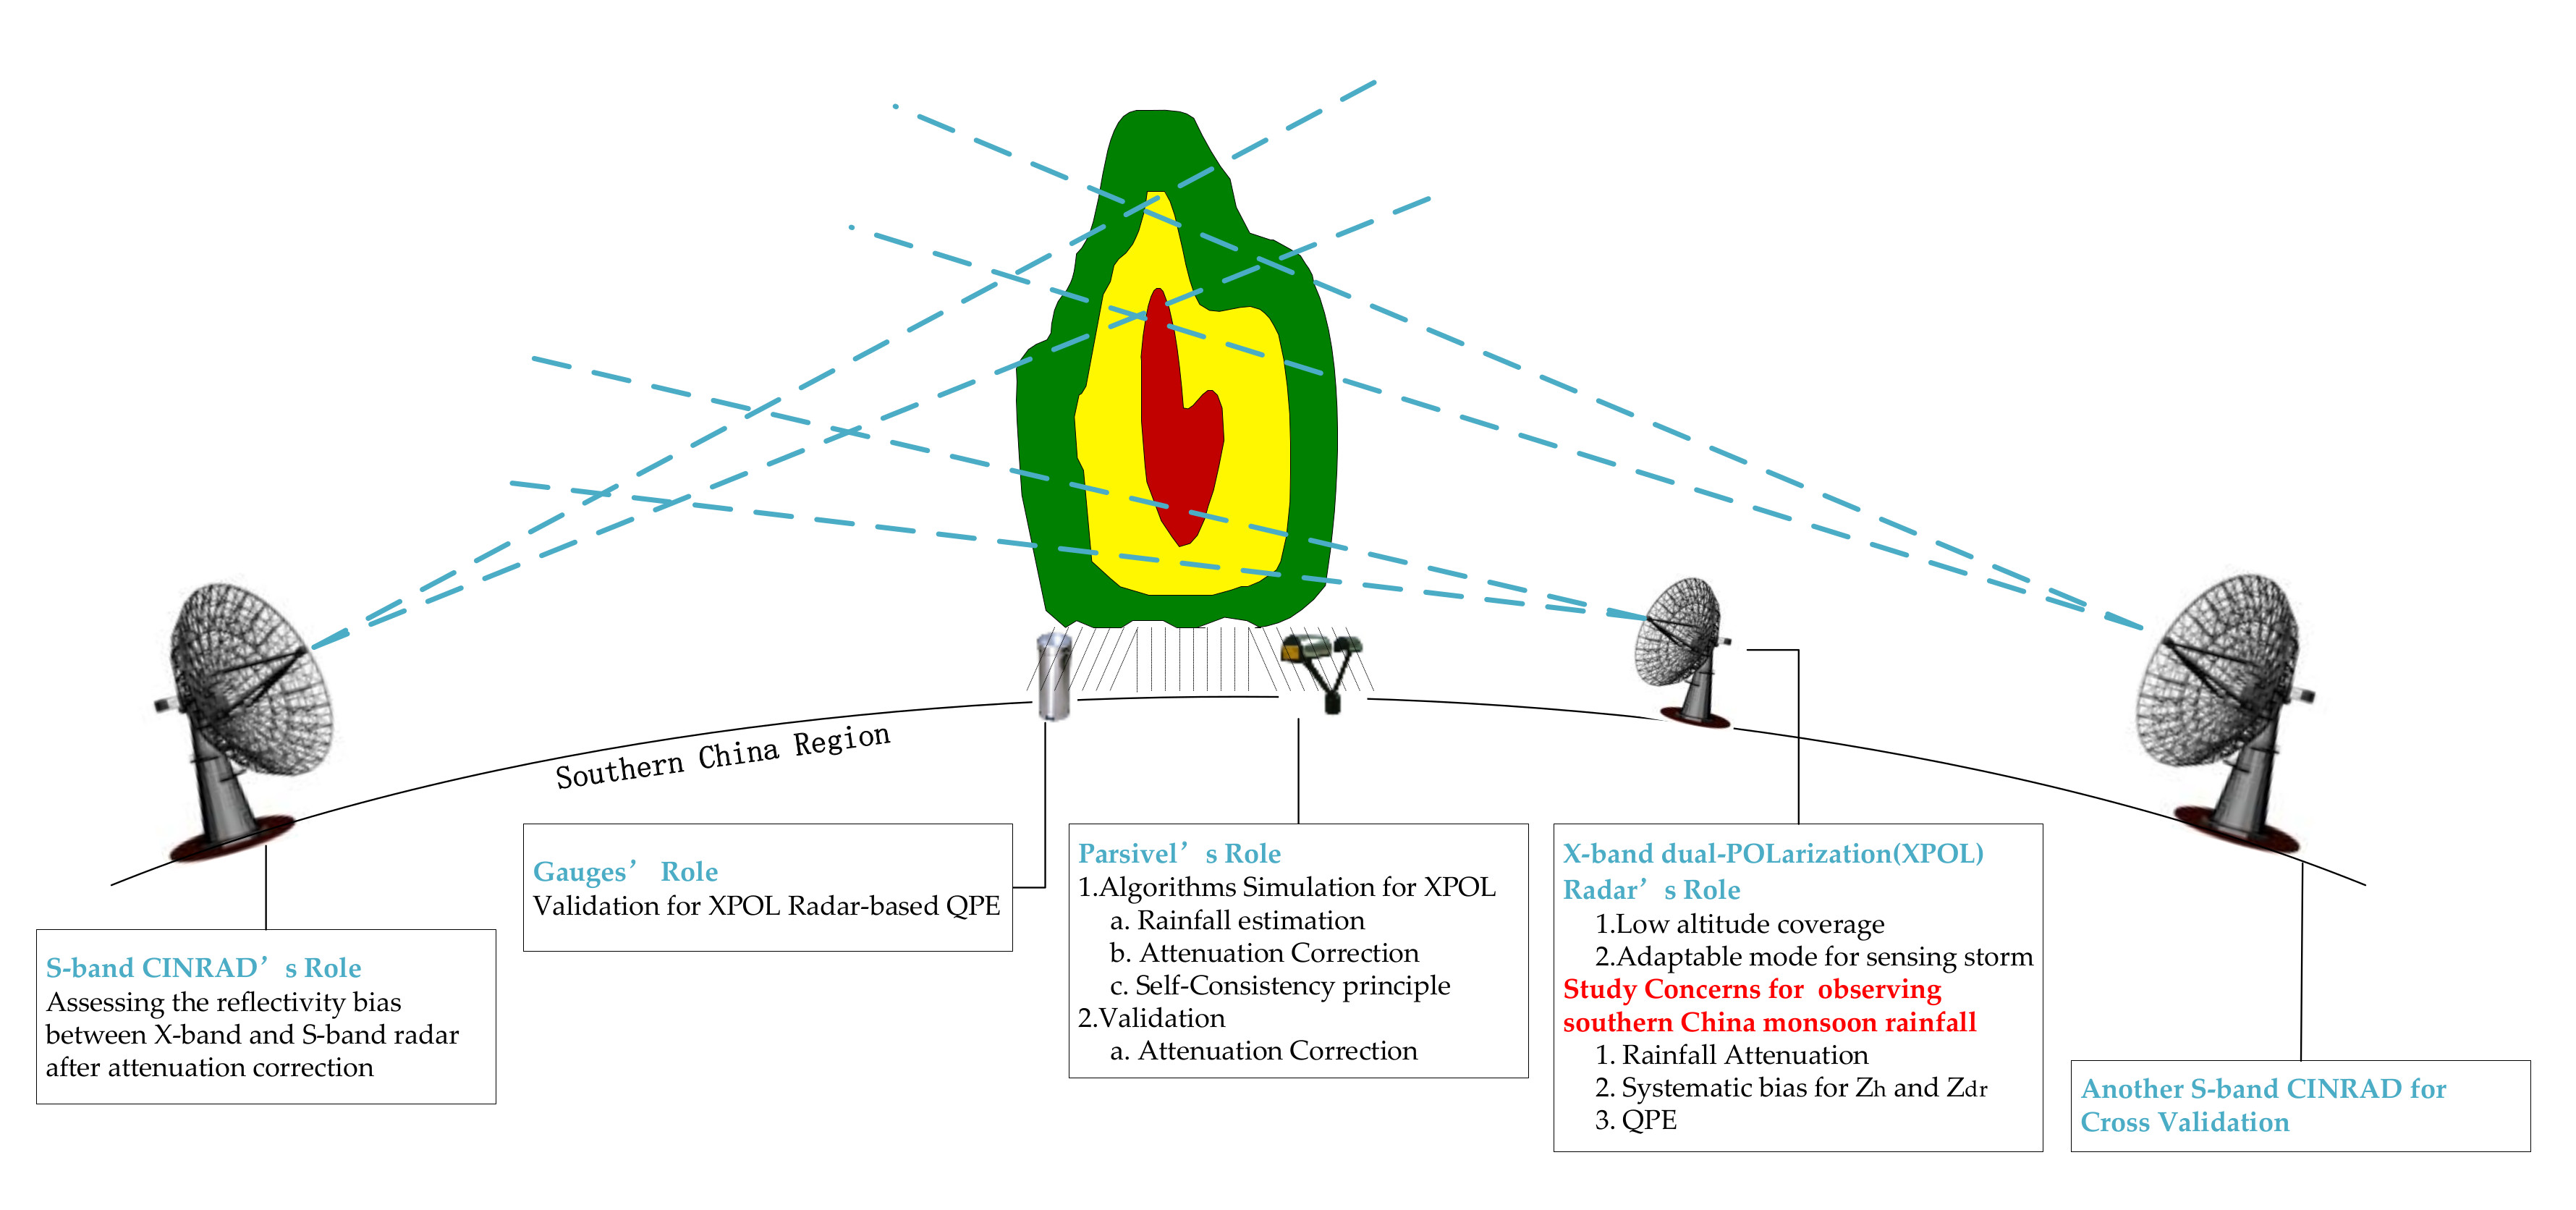
Deployment and Performance of an X-Band Dual-Polarization Radar during the Southern China Monsoon Rainfall Experiment


Abstract
:
1. Introduction
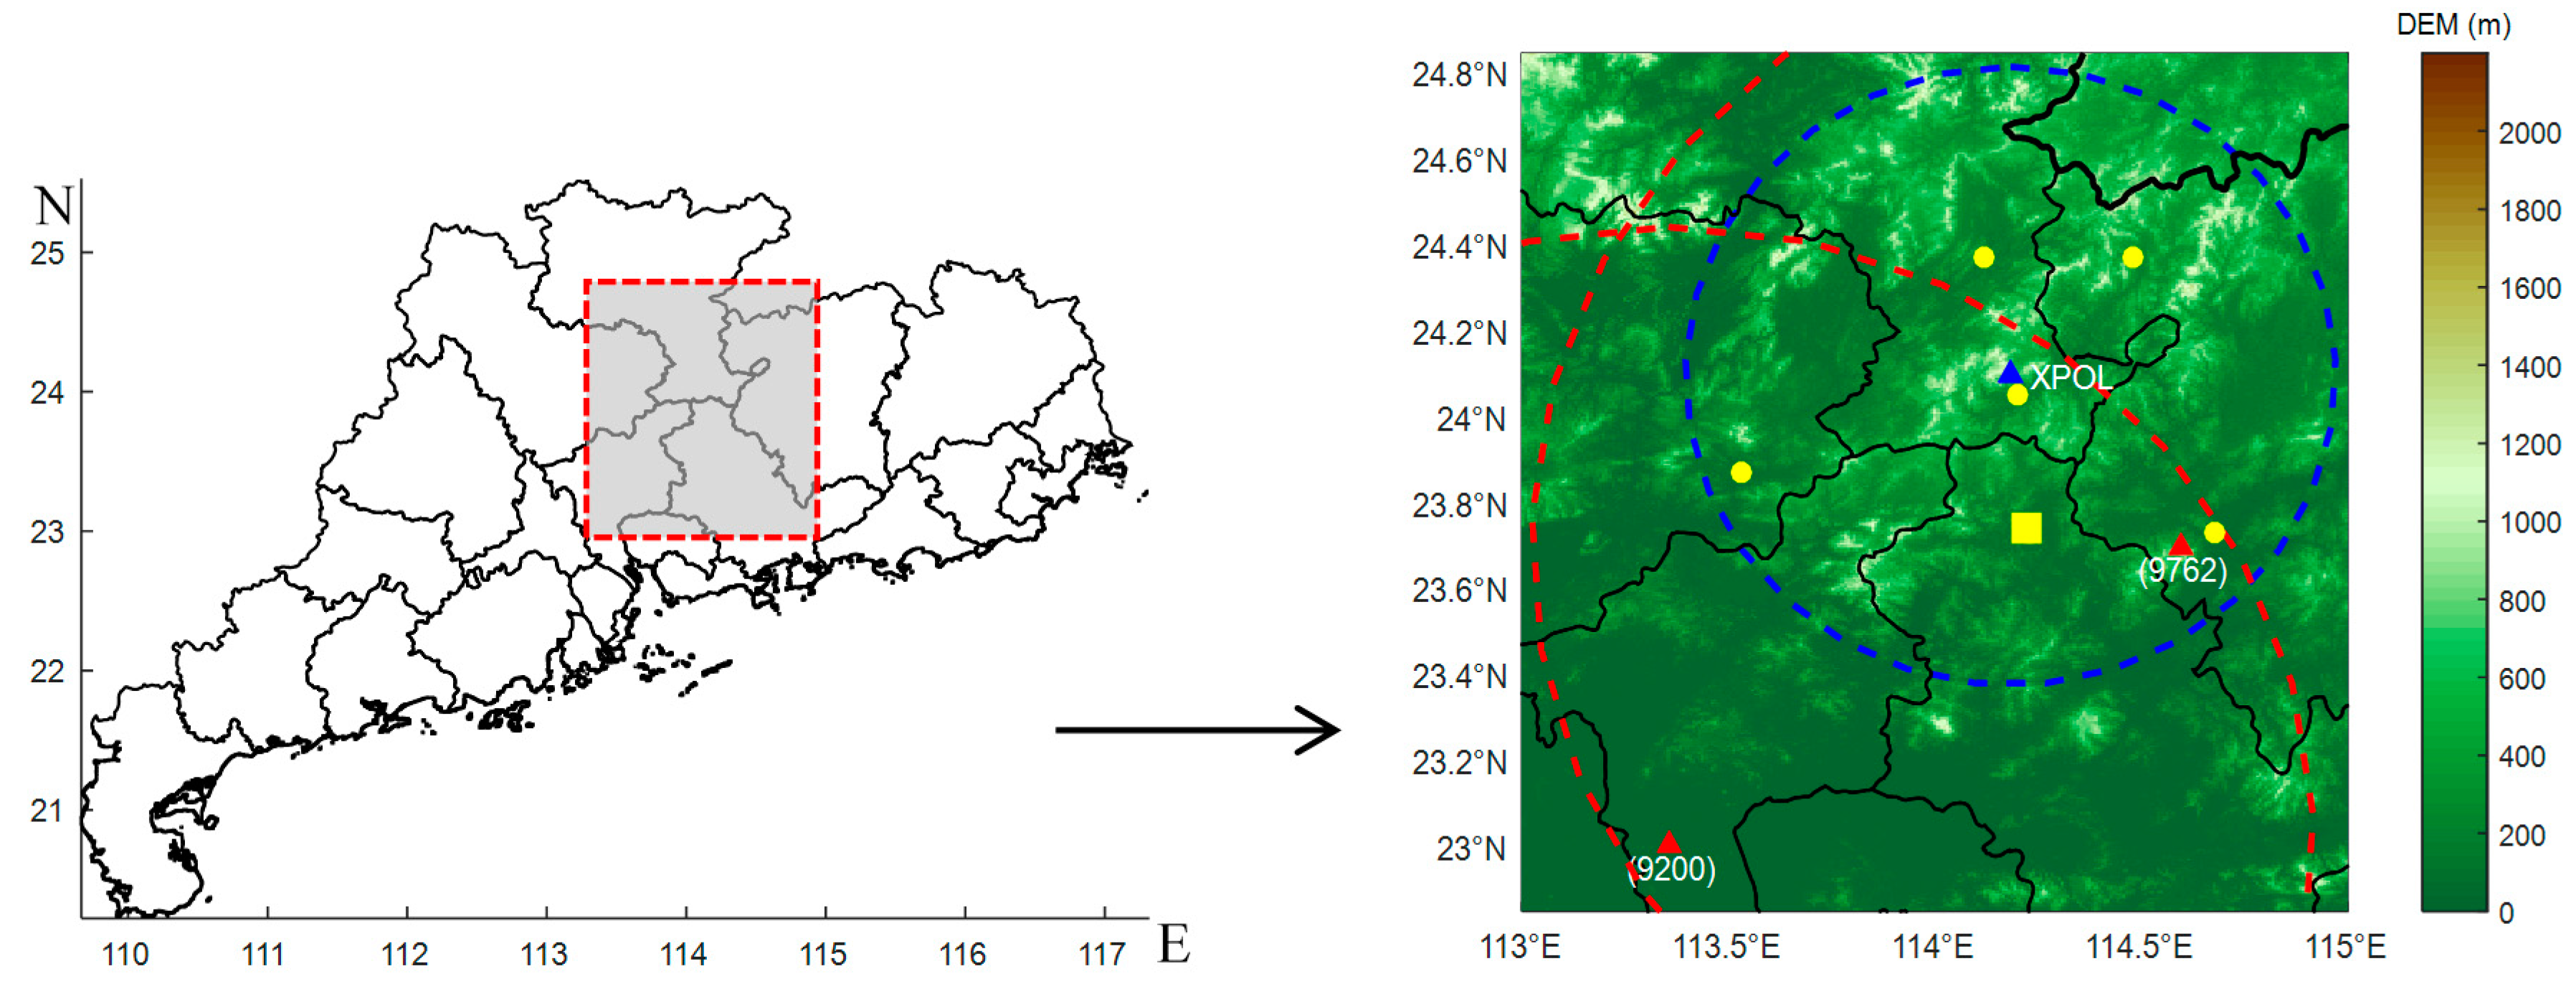
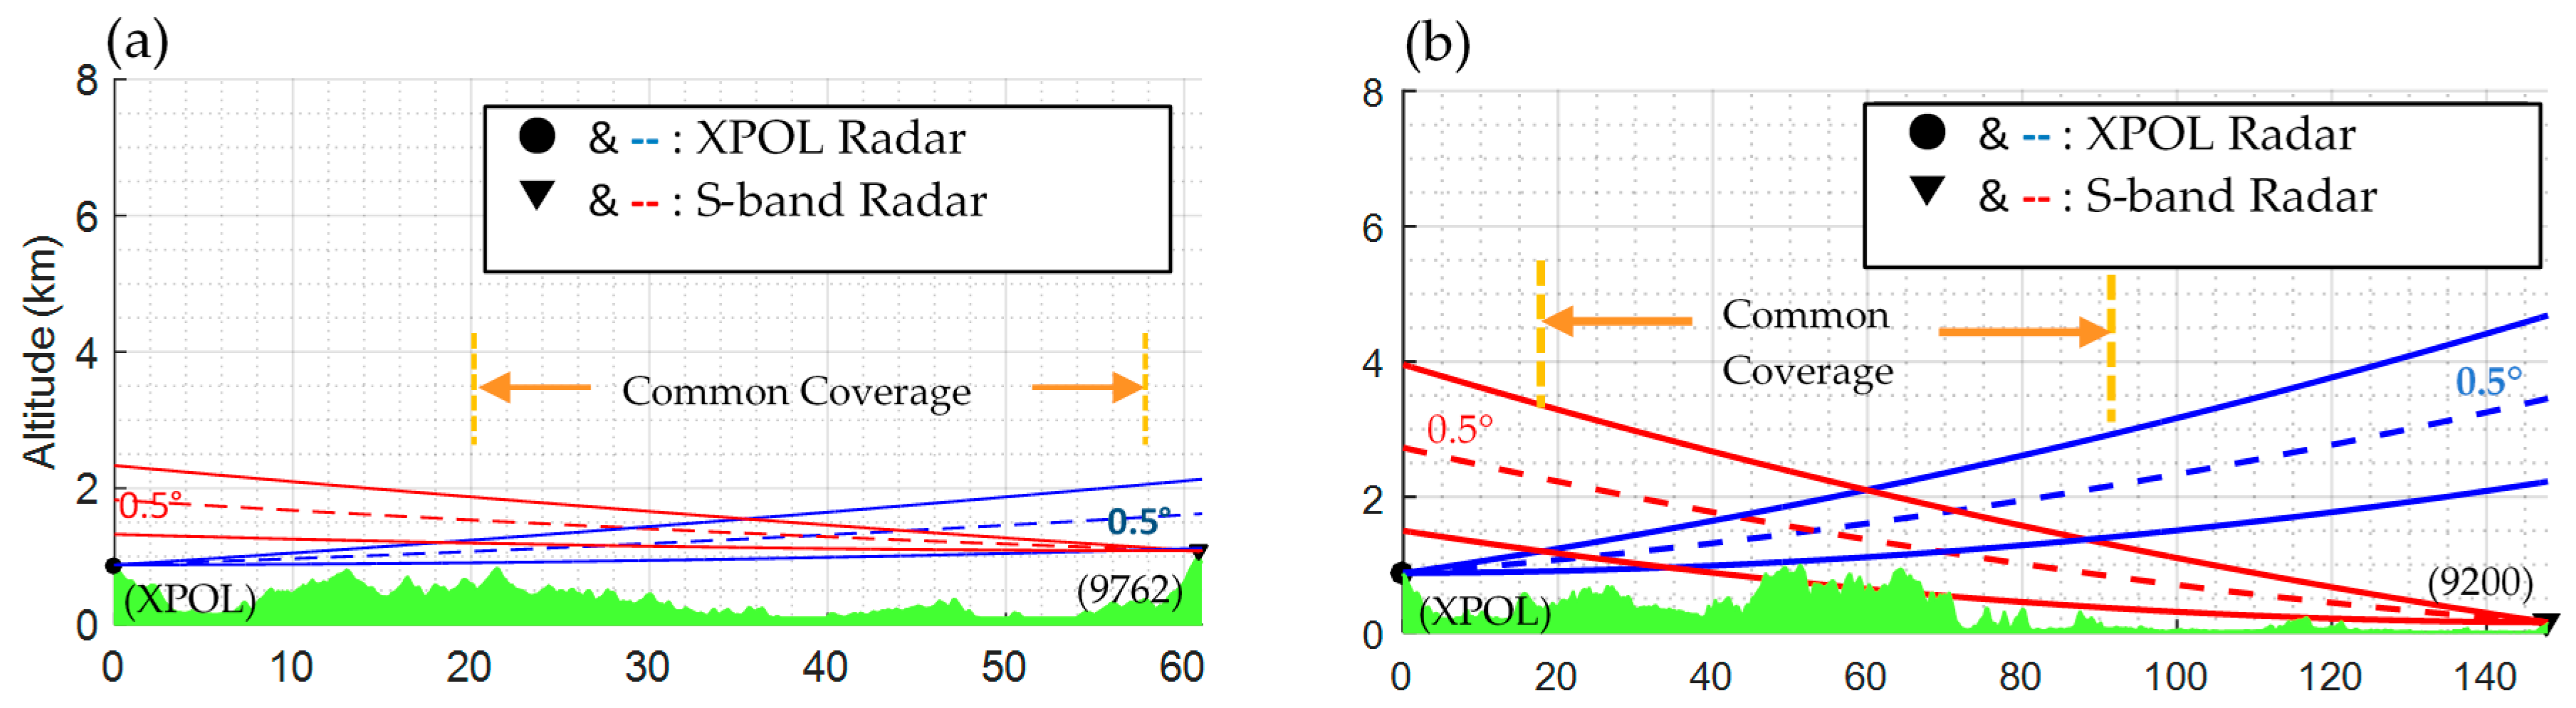
2. System Description and Deployment during SCMREX
3. Attenuation Correction and Bias Assessment
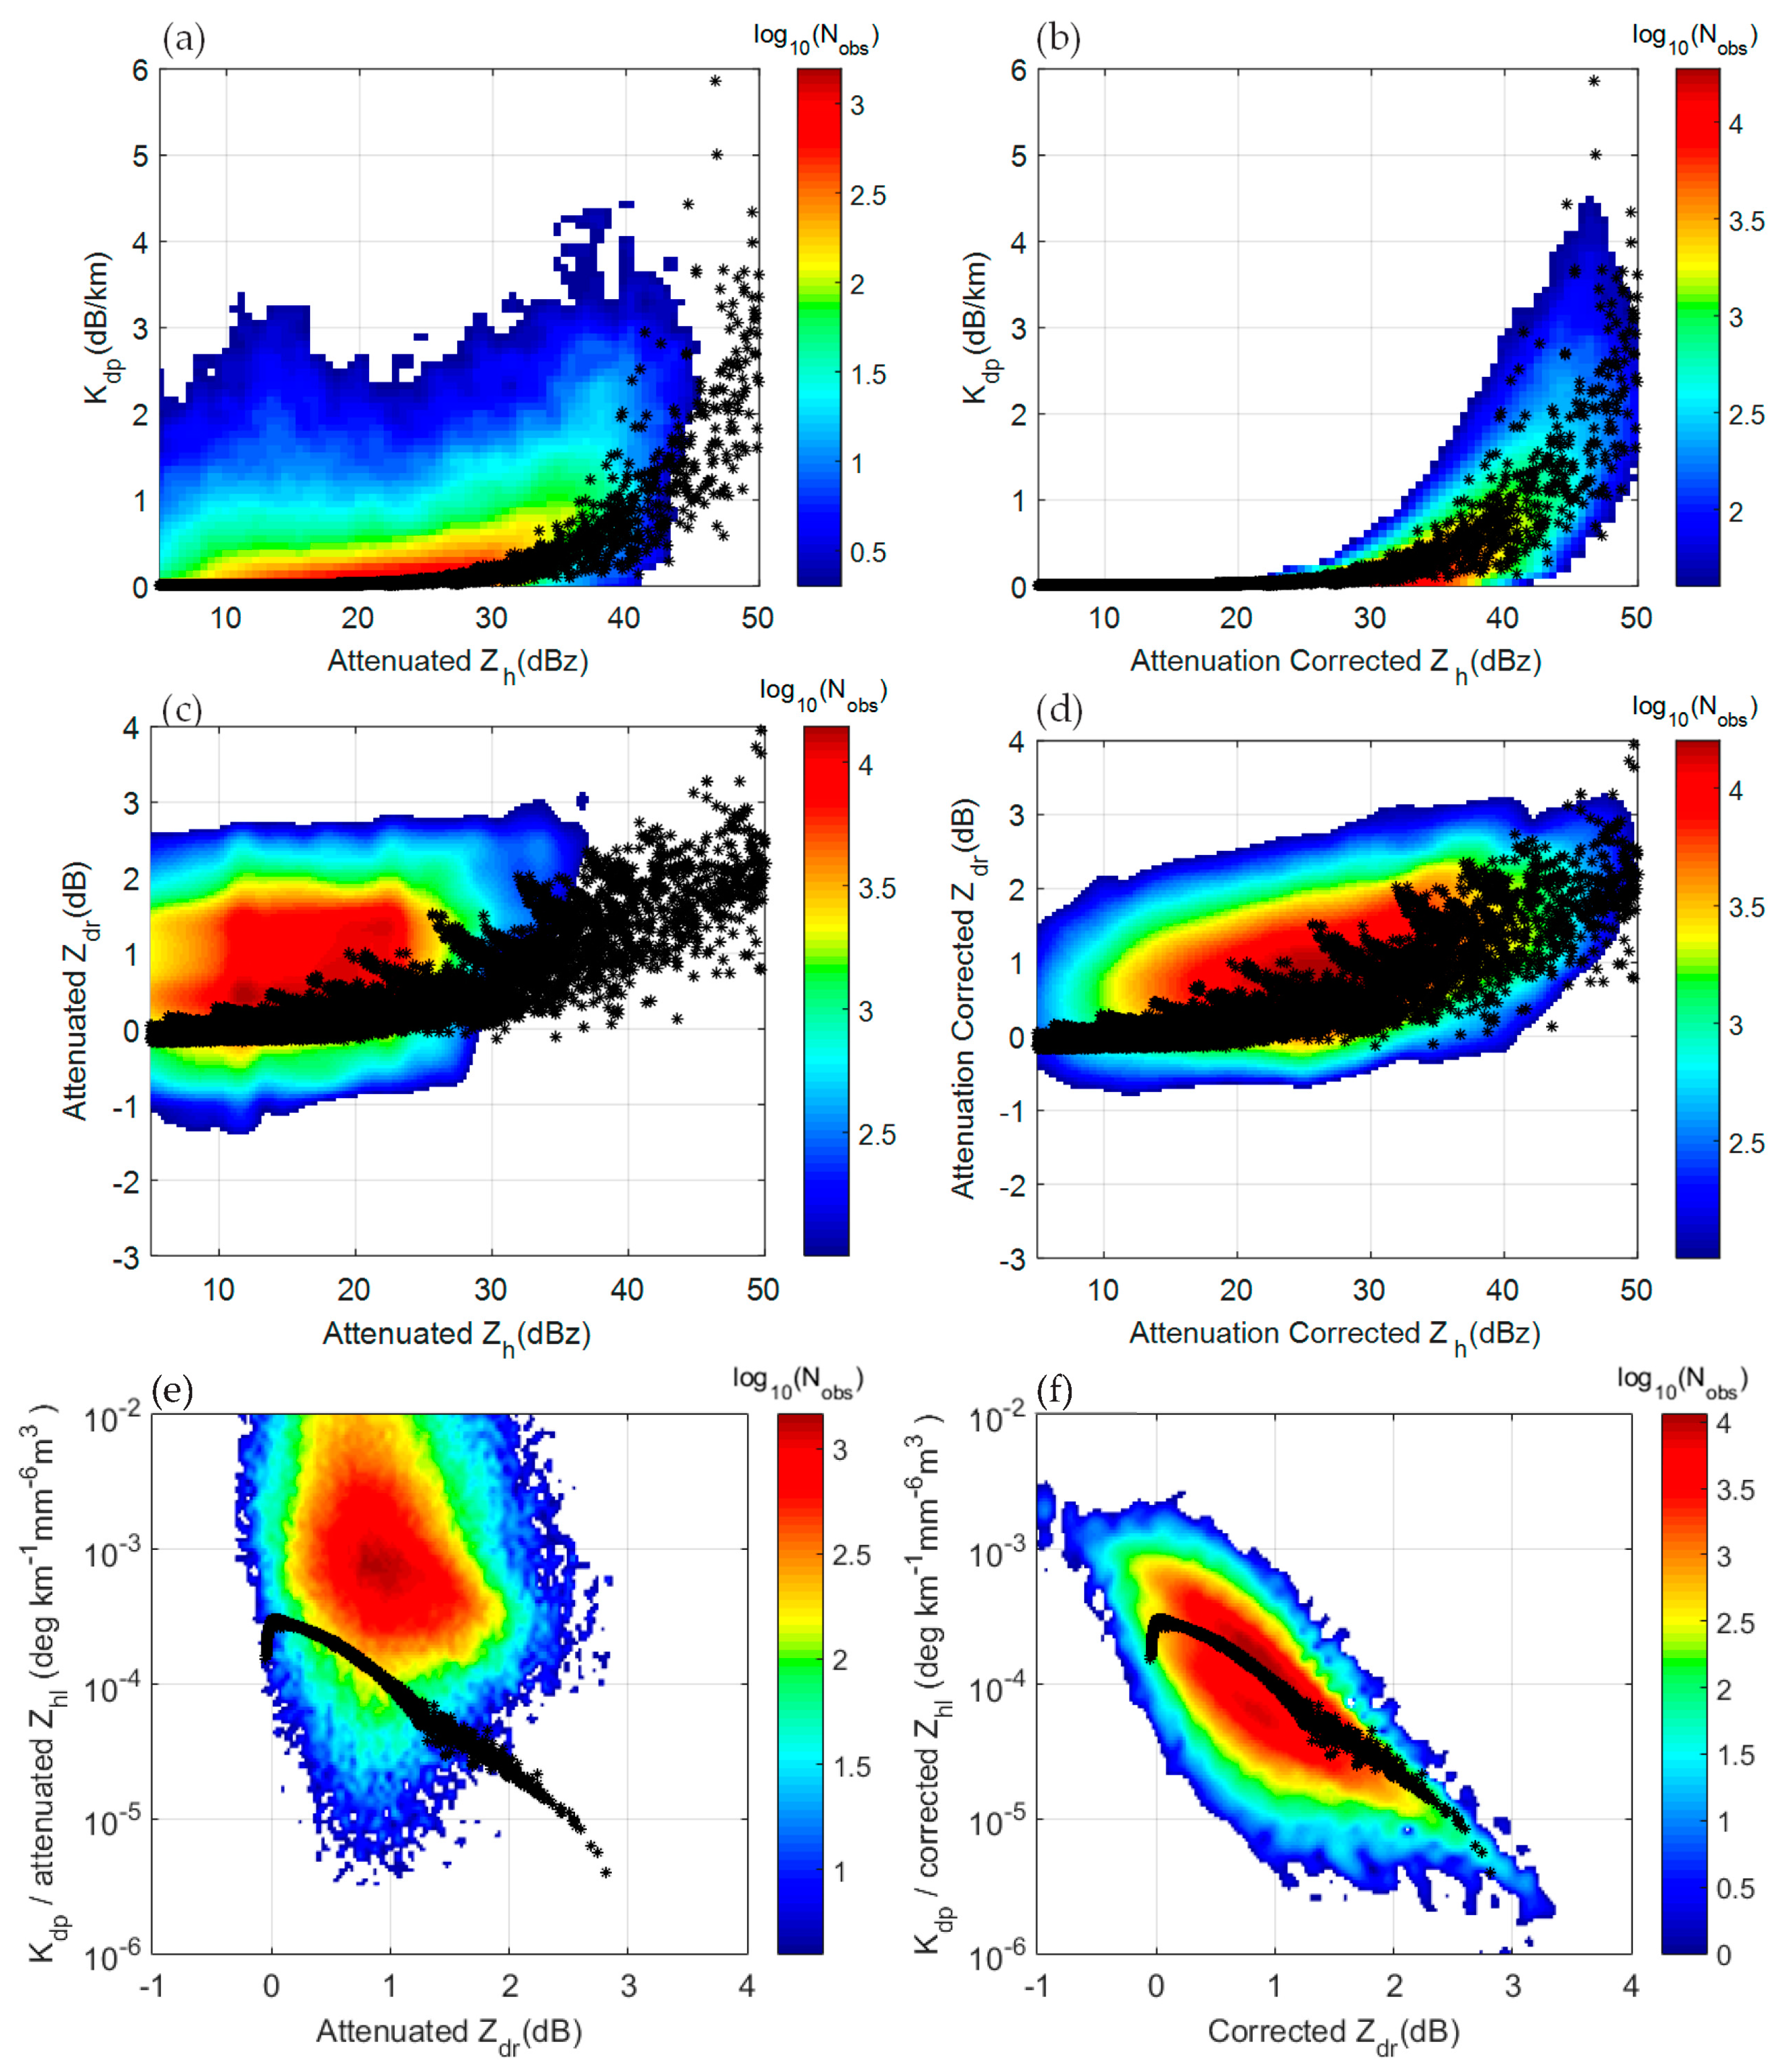
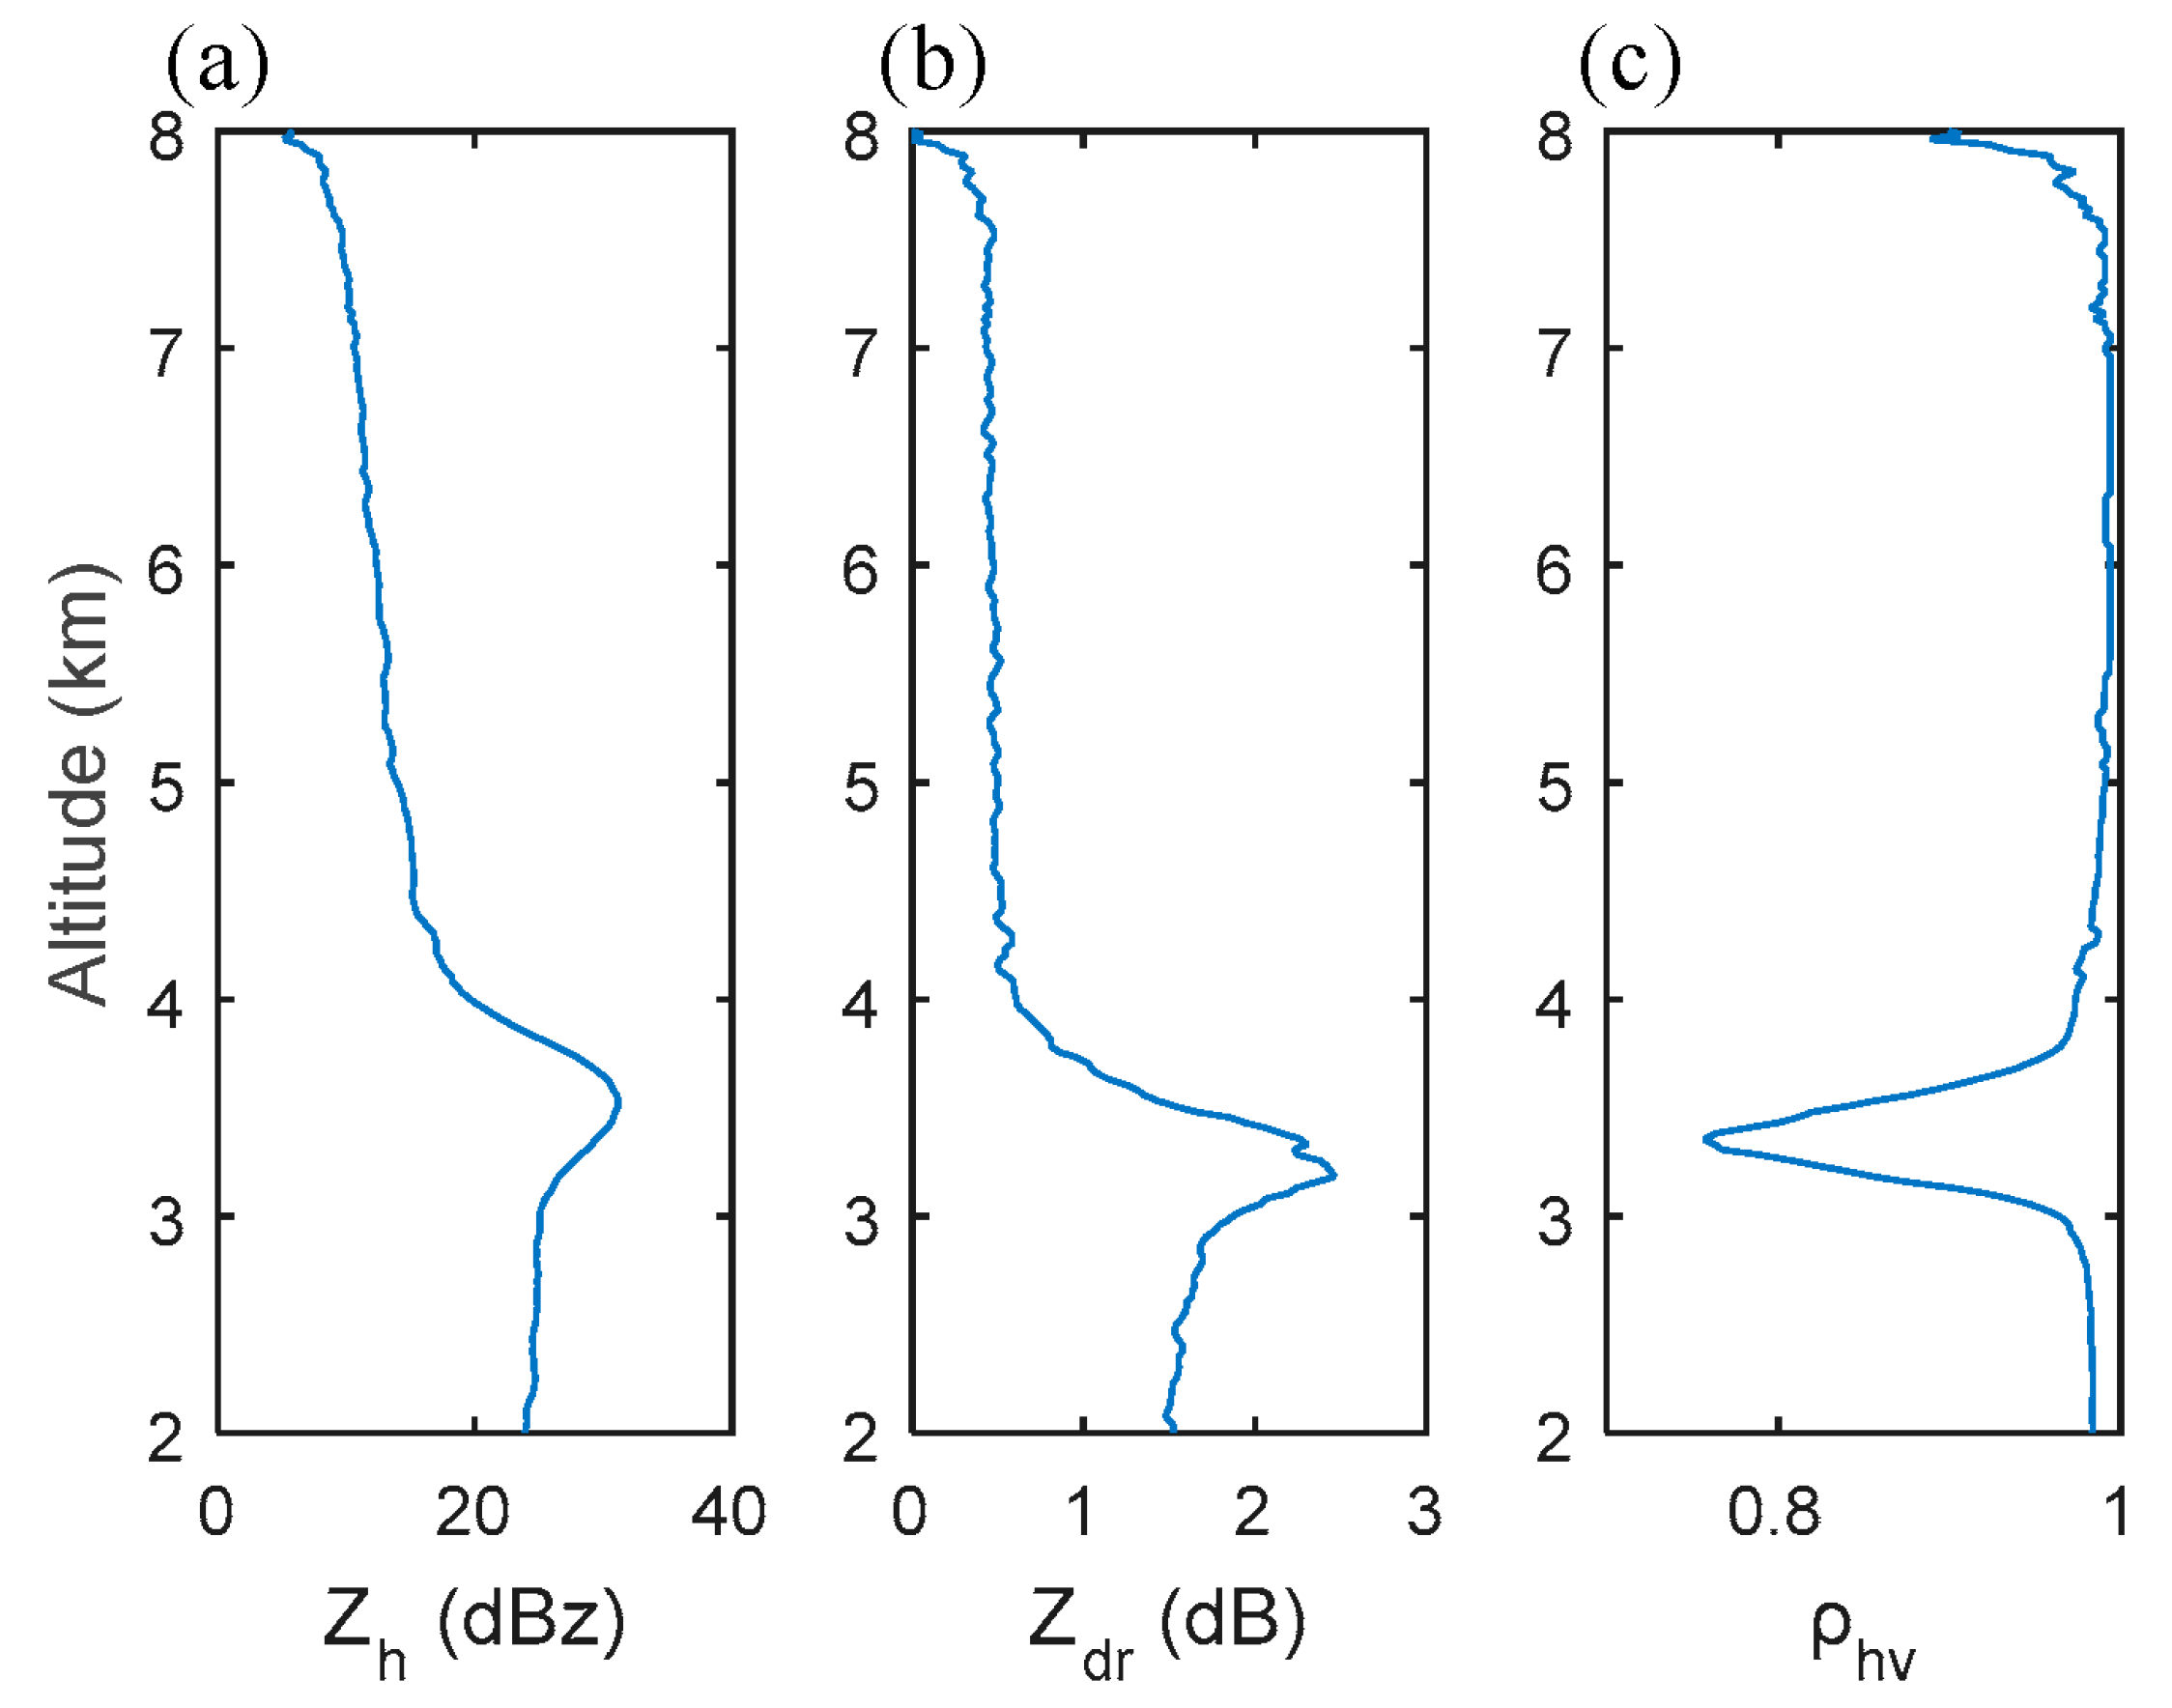
3.1. Raindrop Model and Polarimetric Radar Observables Simulation
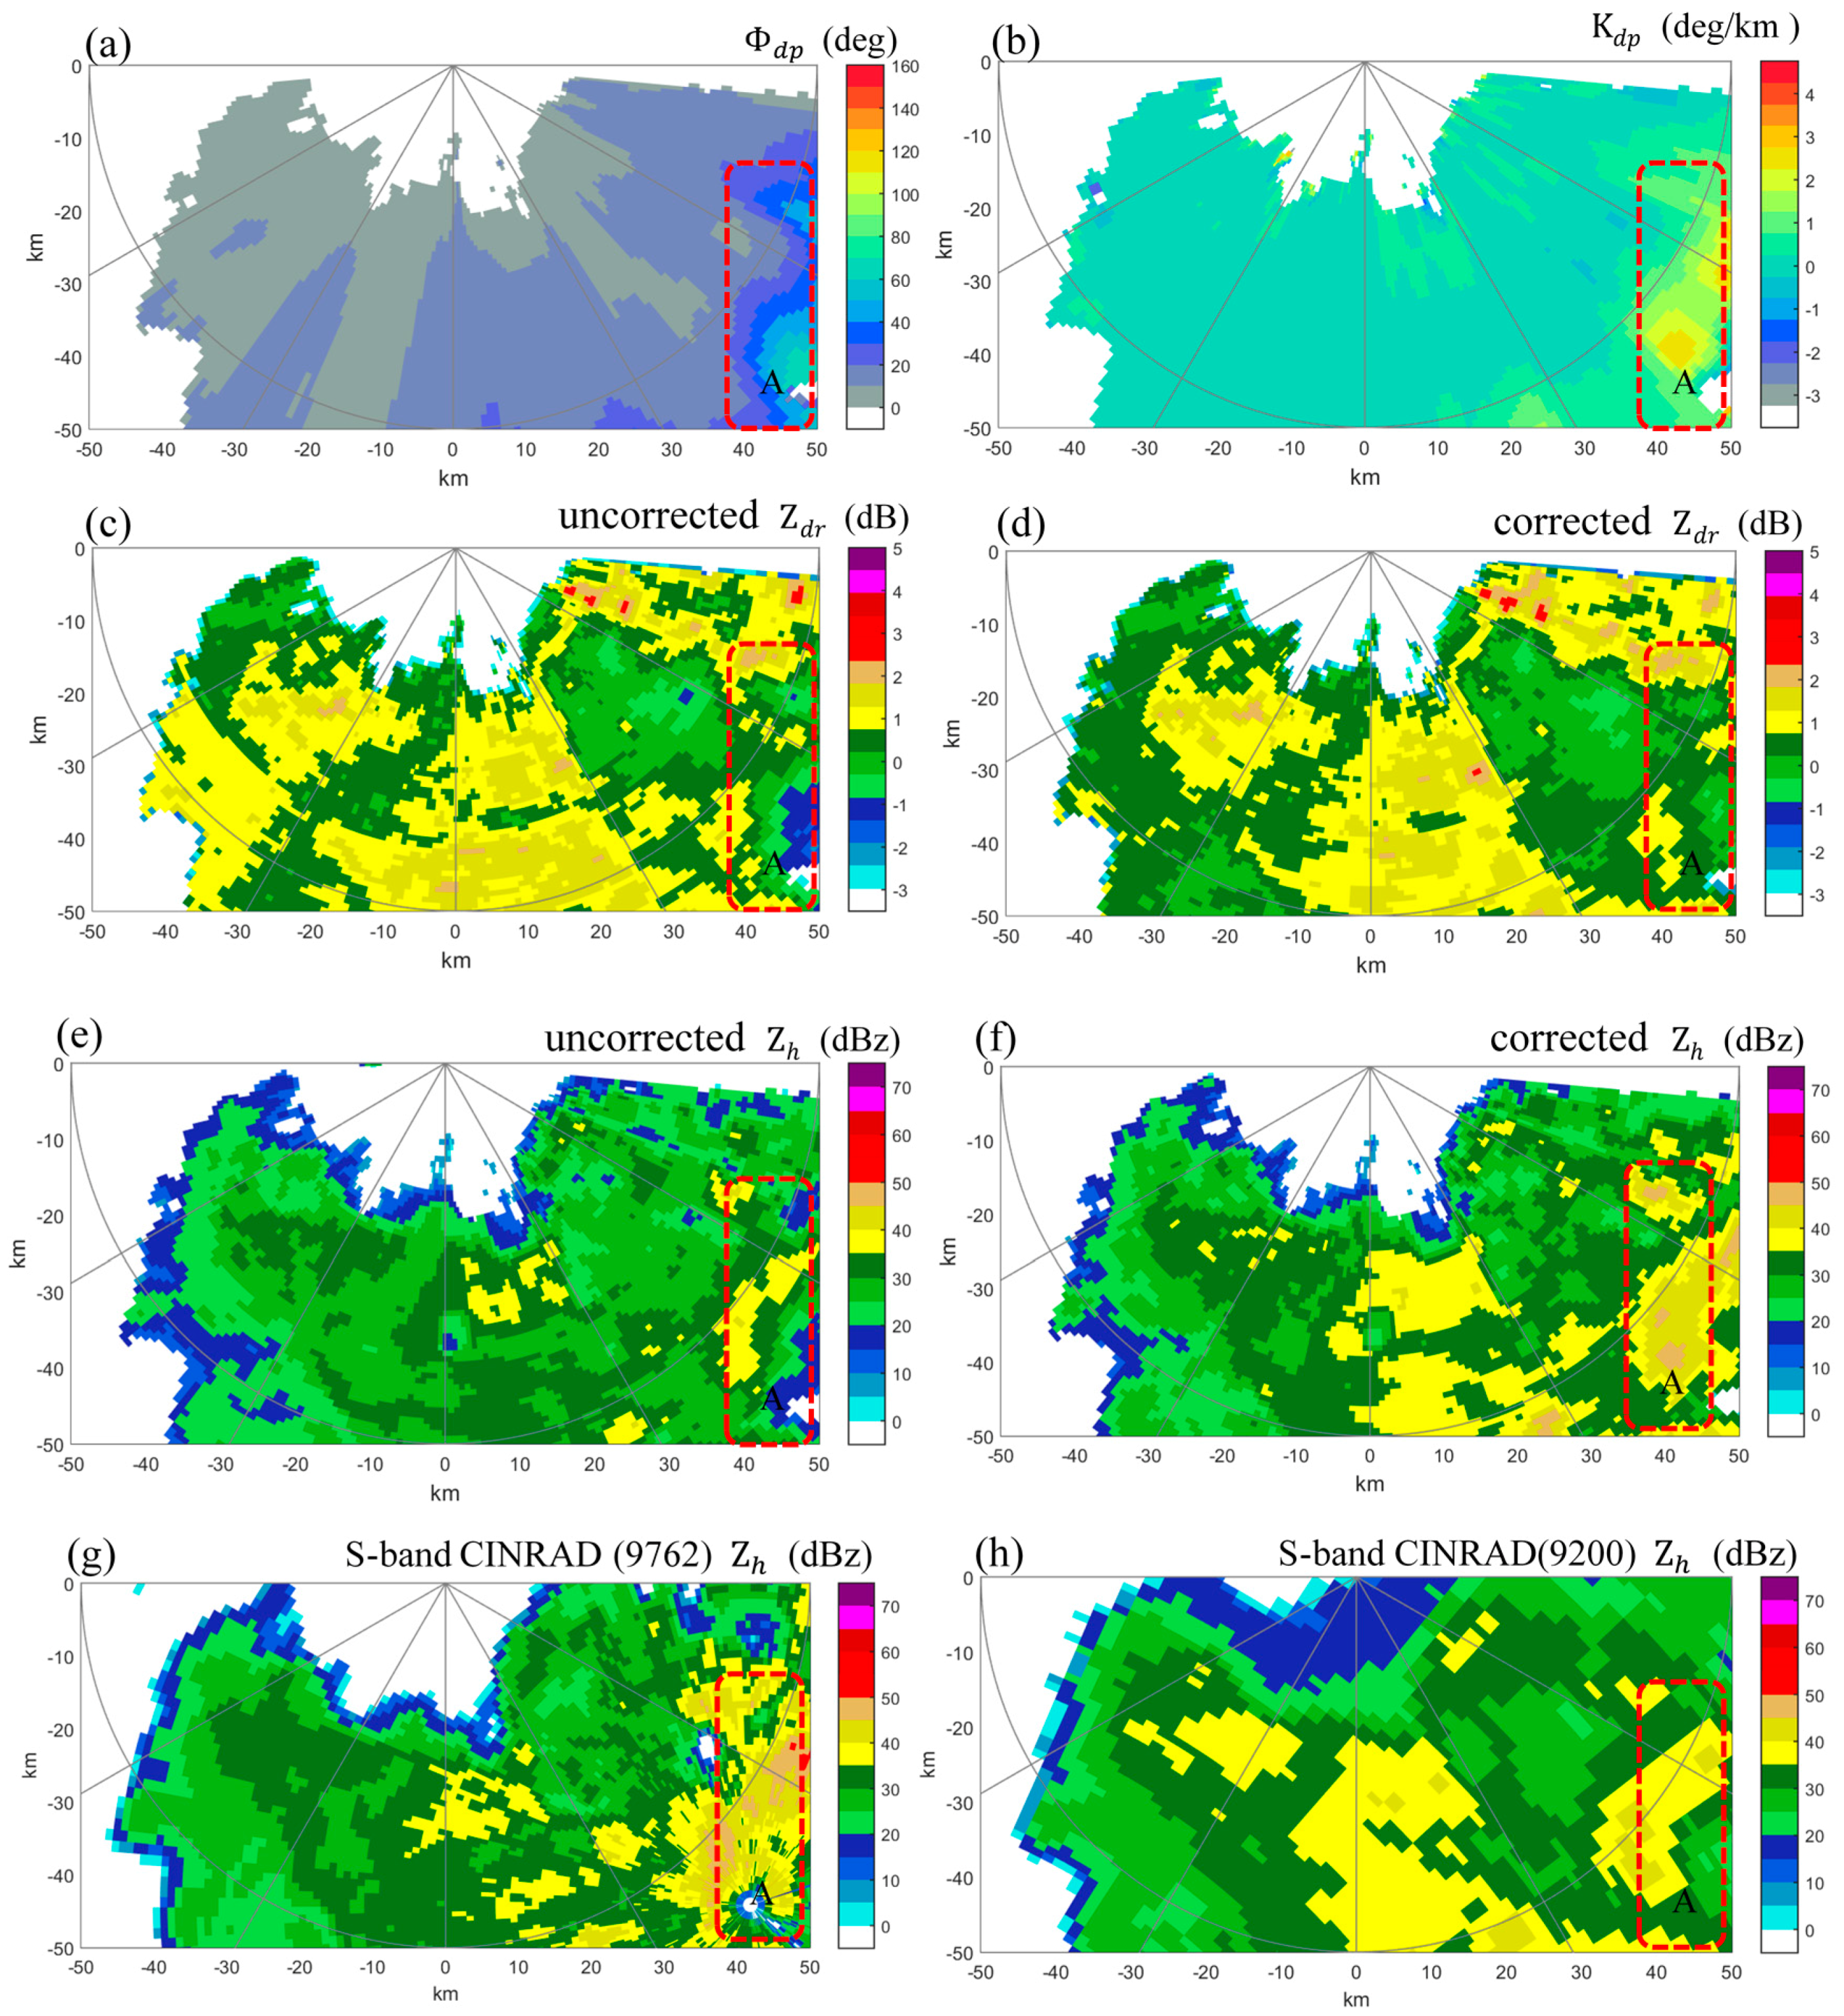
3.2. Specific Differential Phase-Based Attenuation Correction
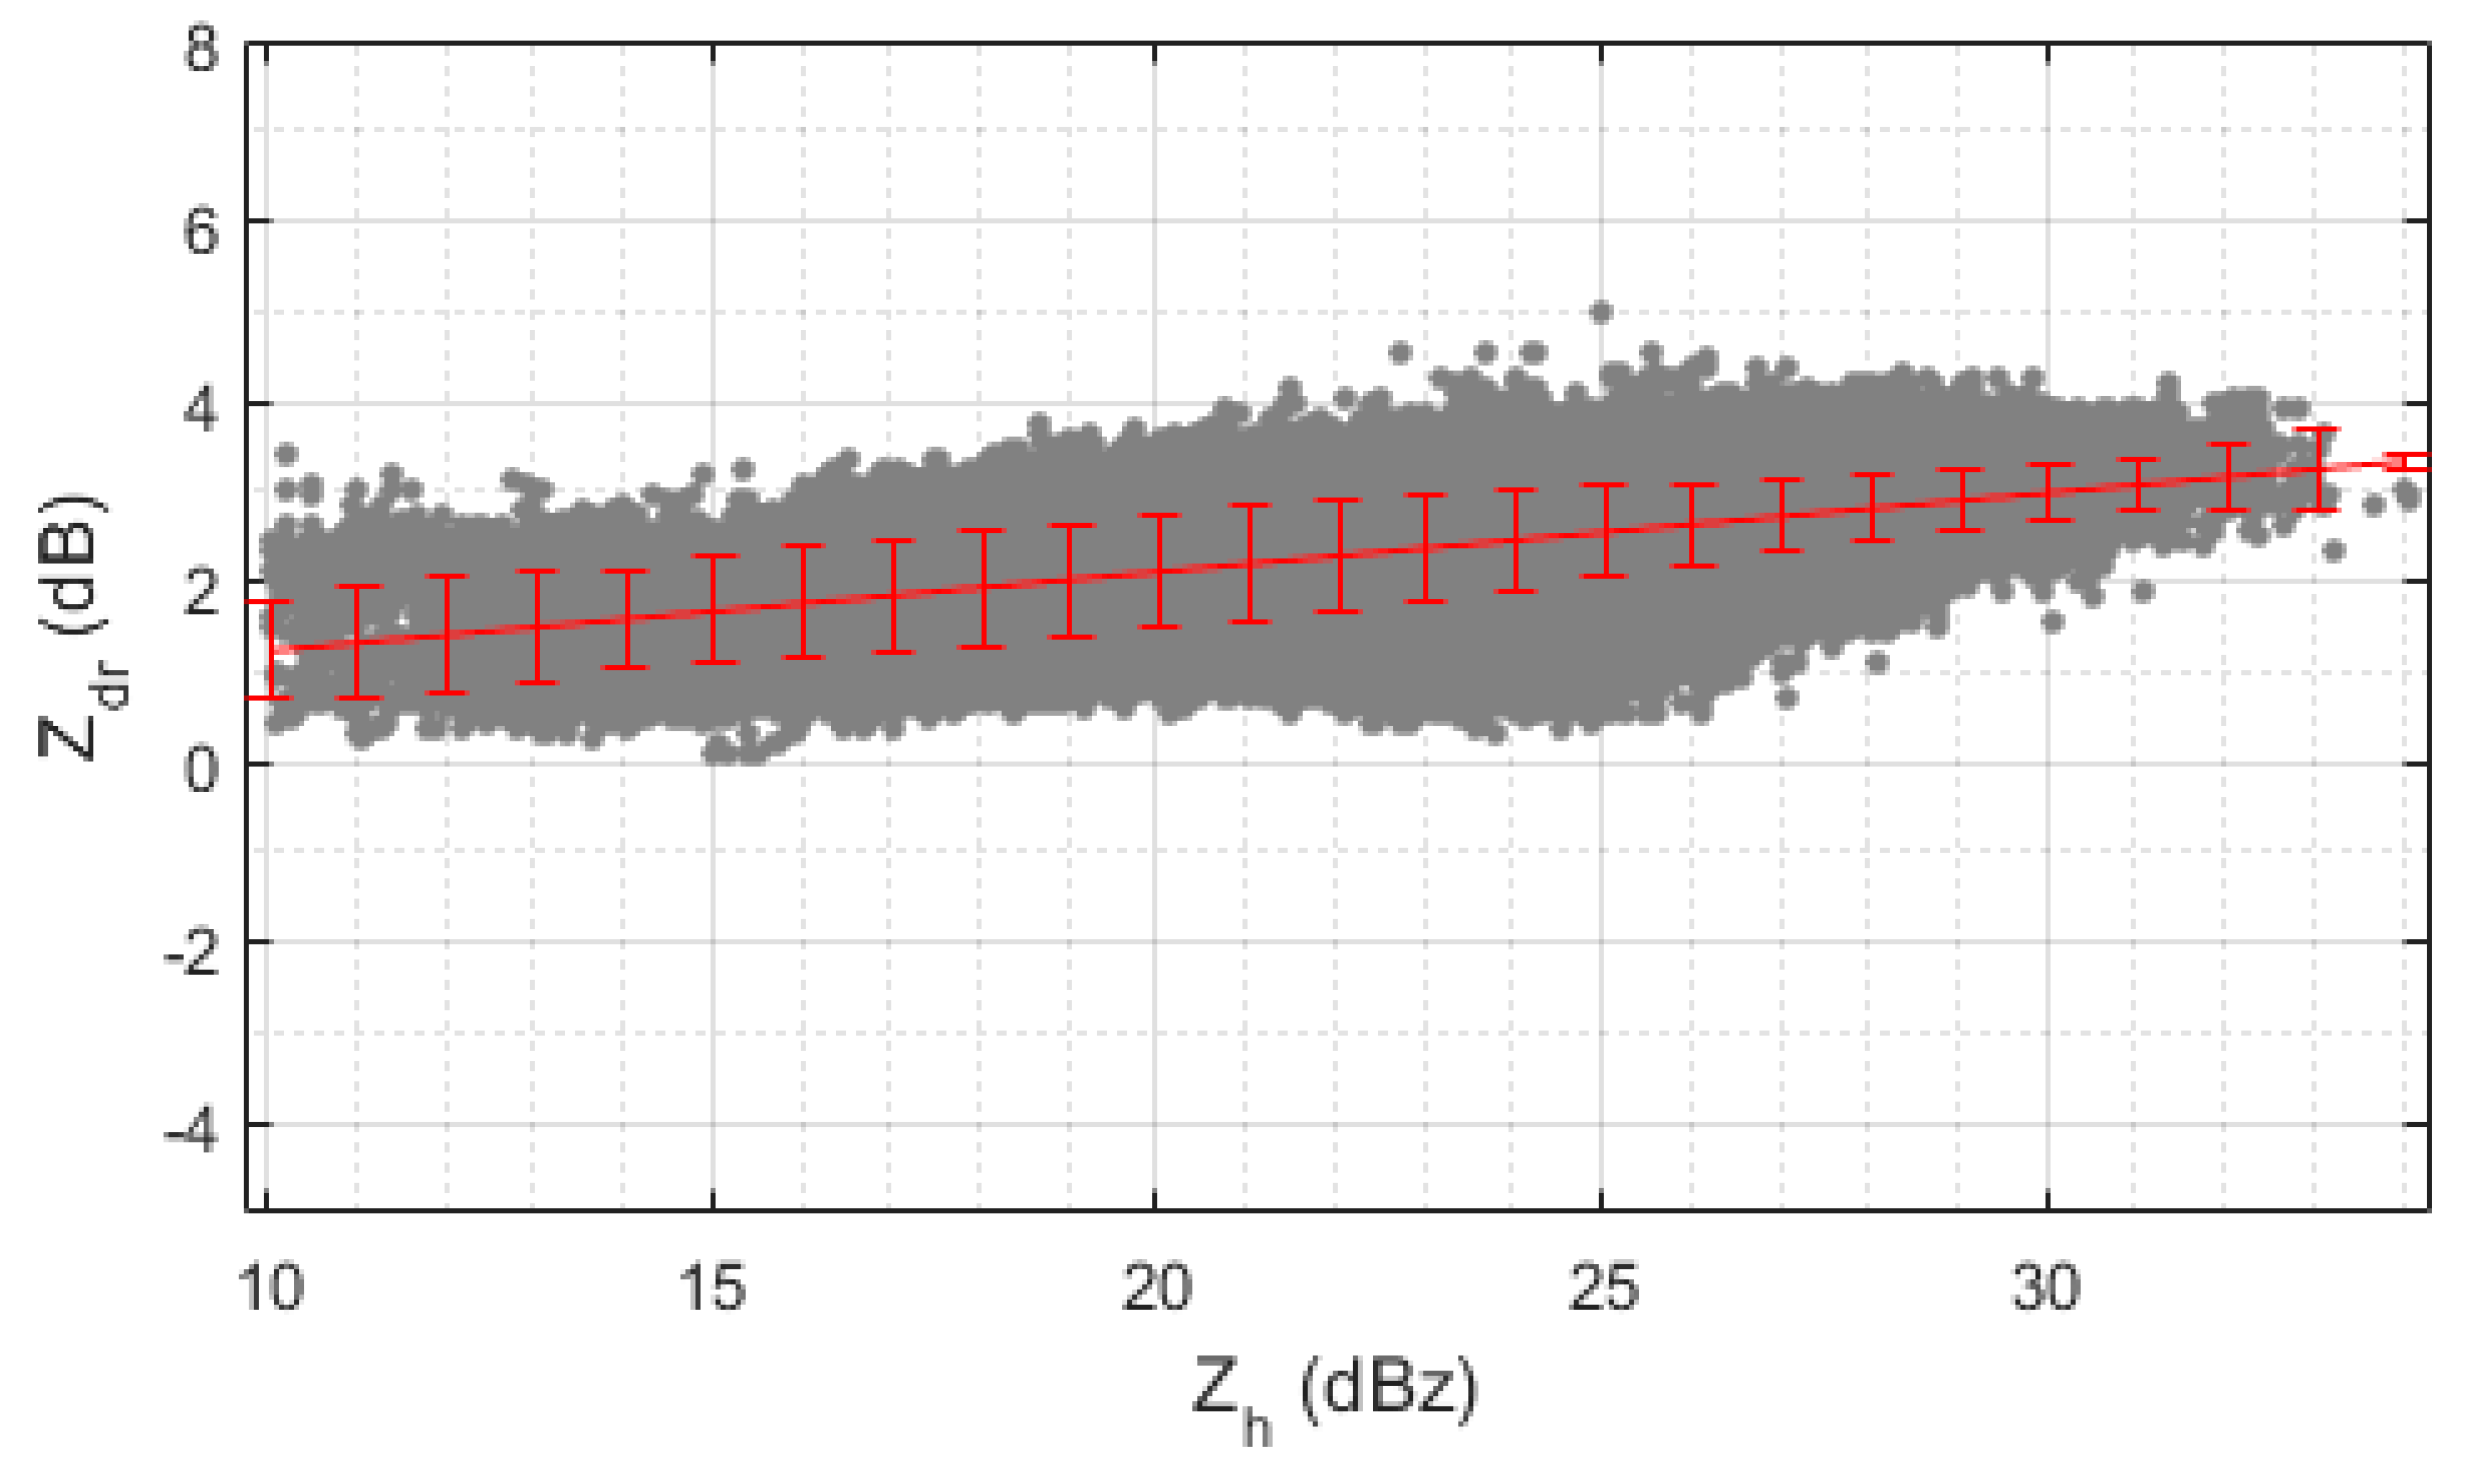
3.3. Assessment of and Measurement Biases
3.3.1. Bias Assessment
3.3.2. Bias Assessment
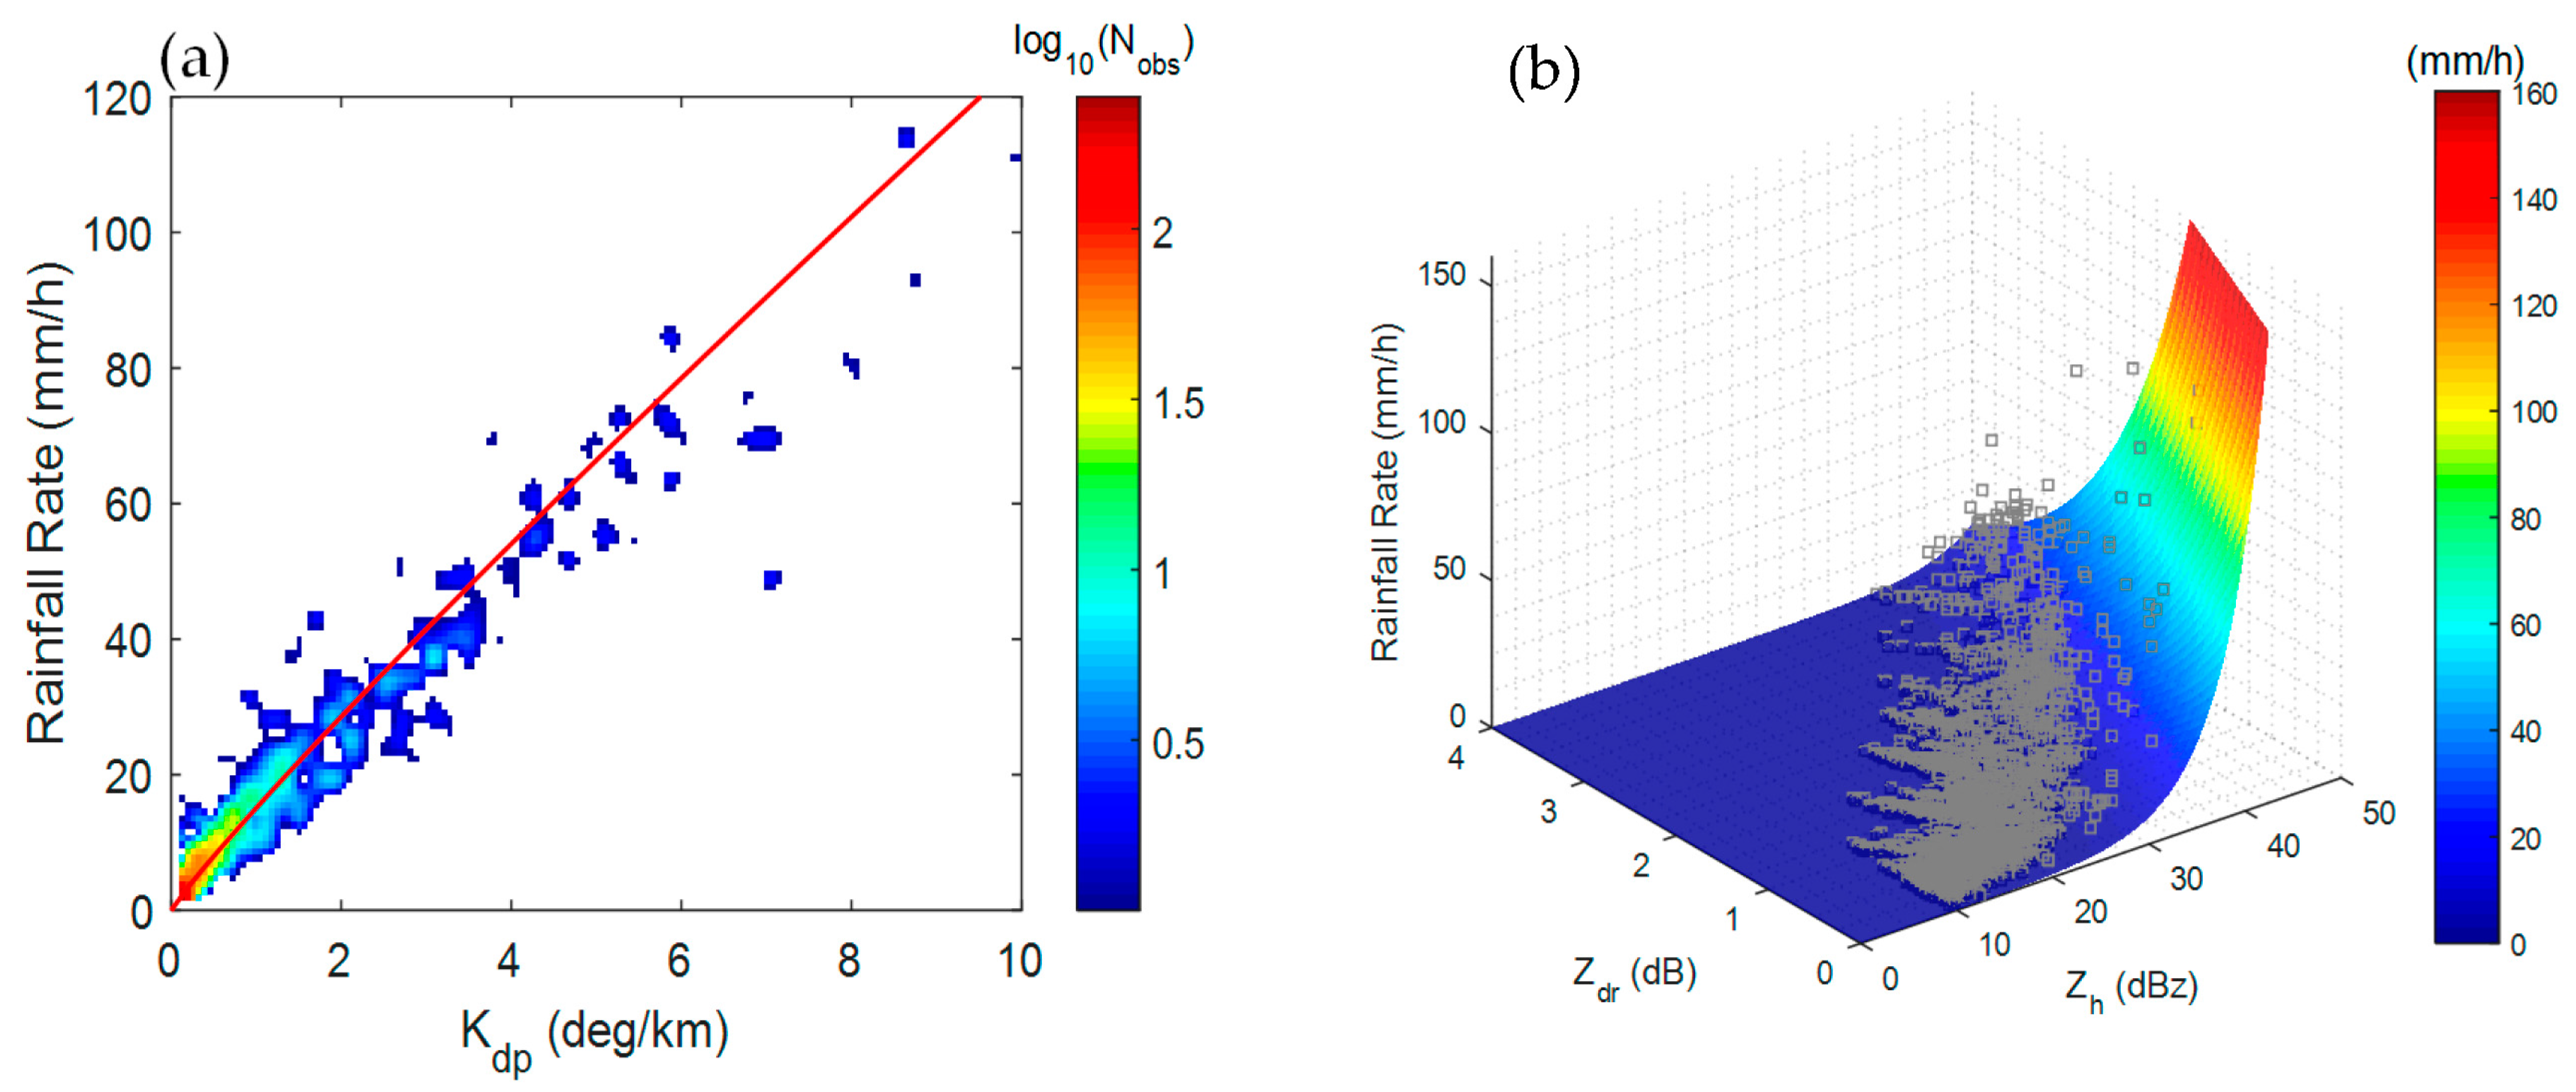
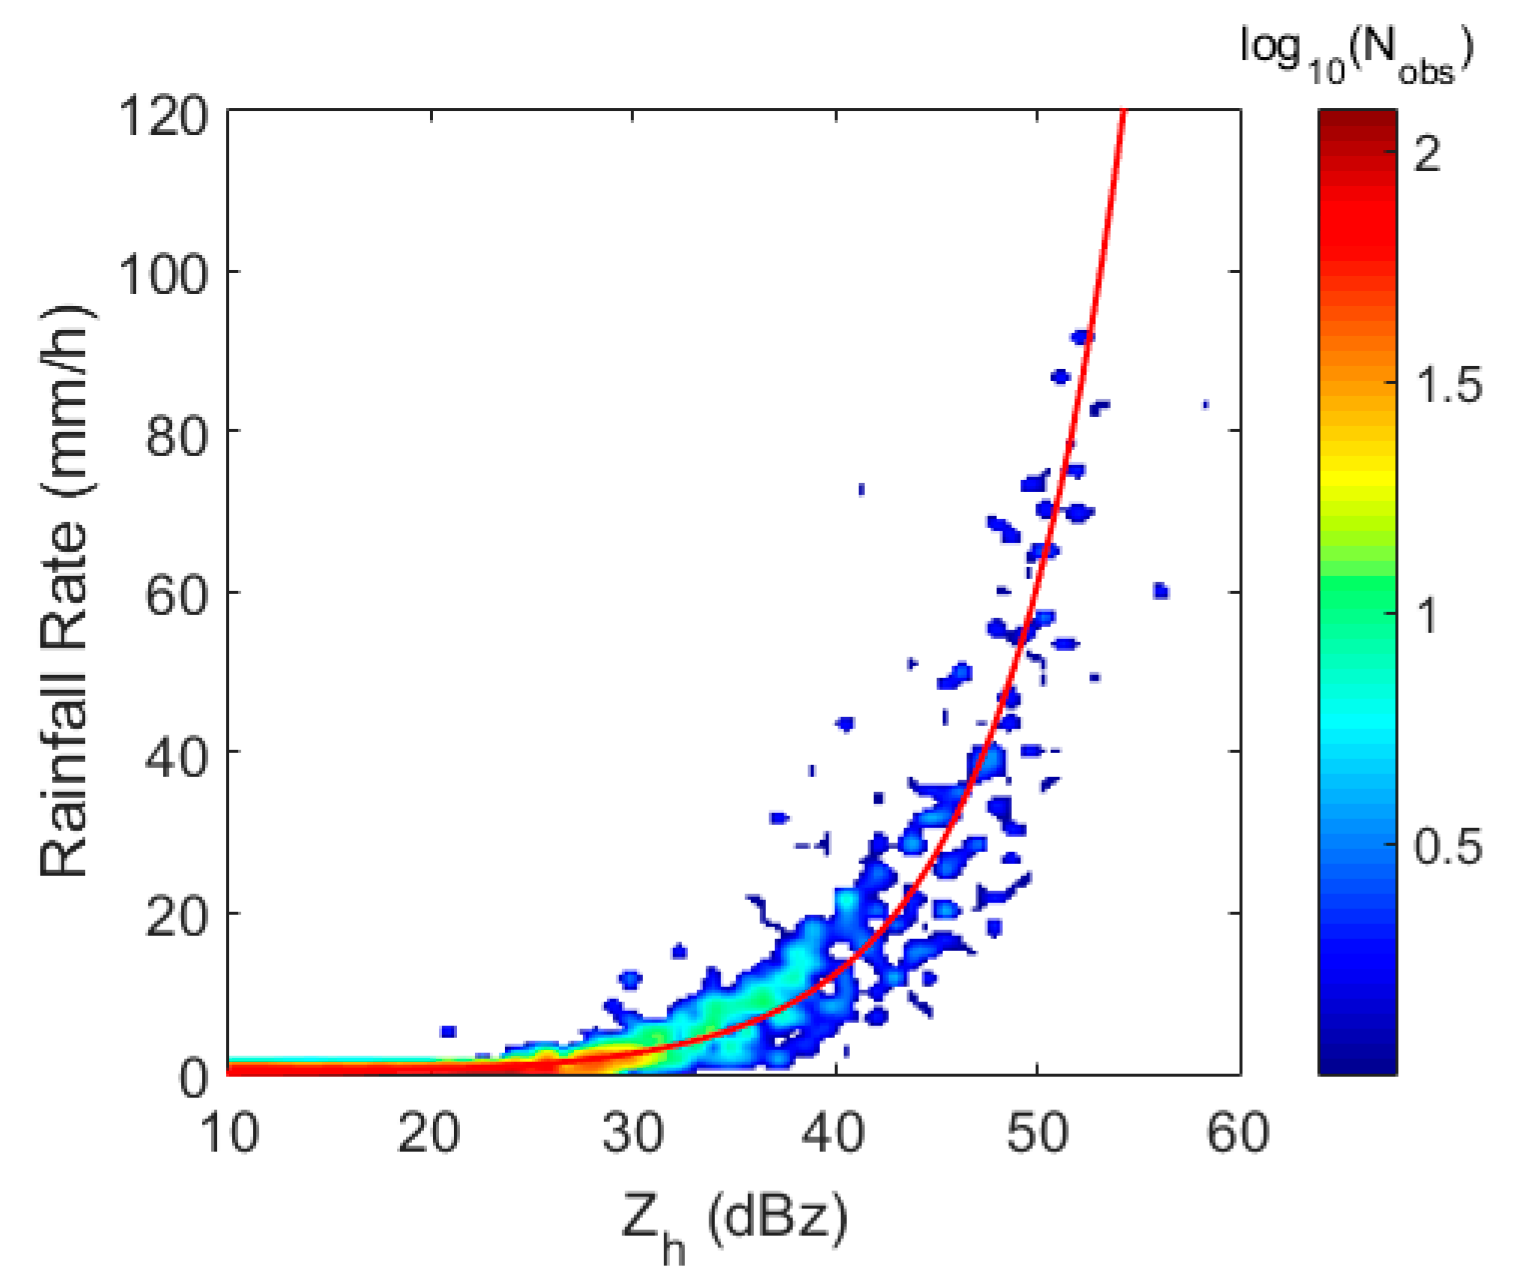
4. Rainfall Performance during SCMREX
4.1. Rainfall Algorithms
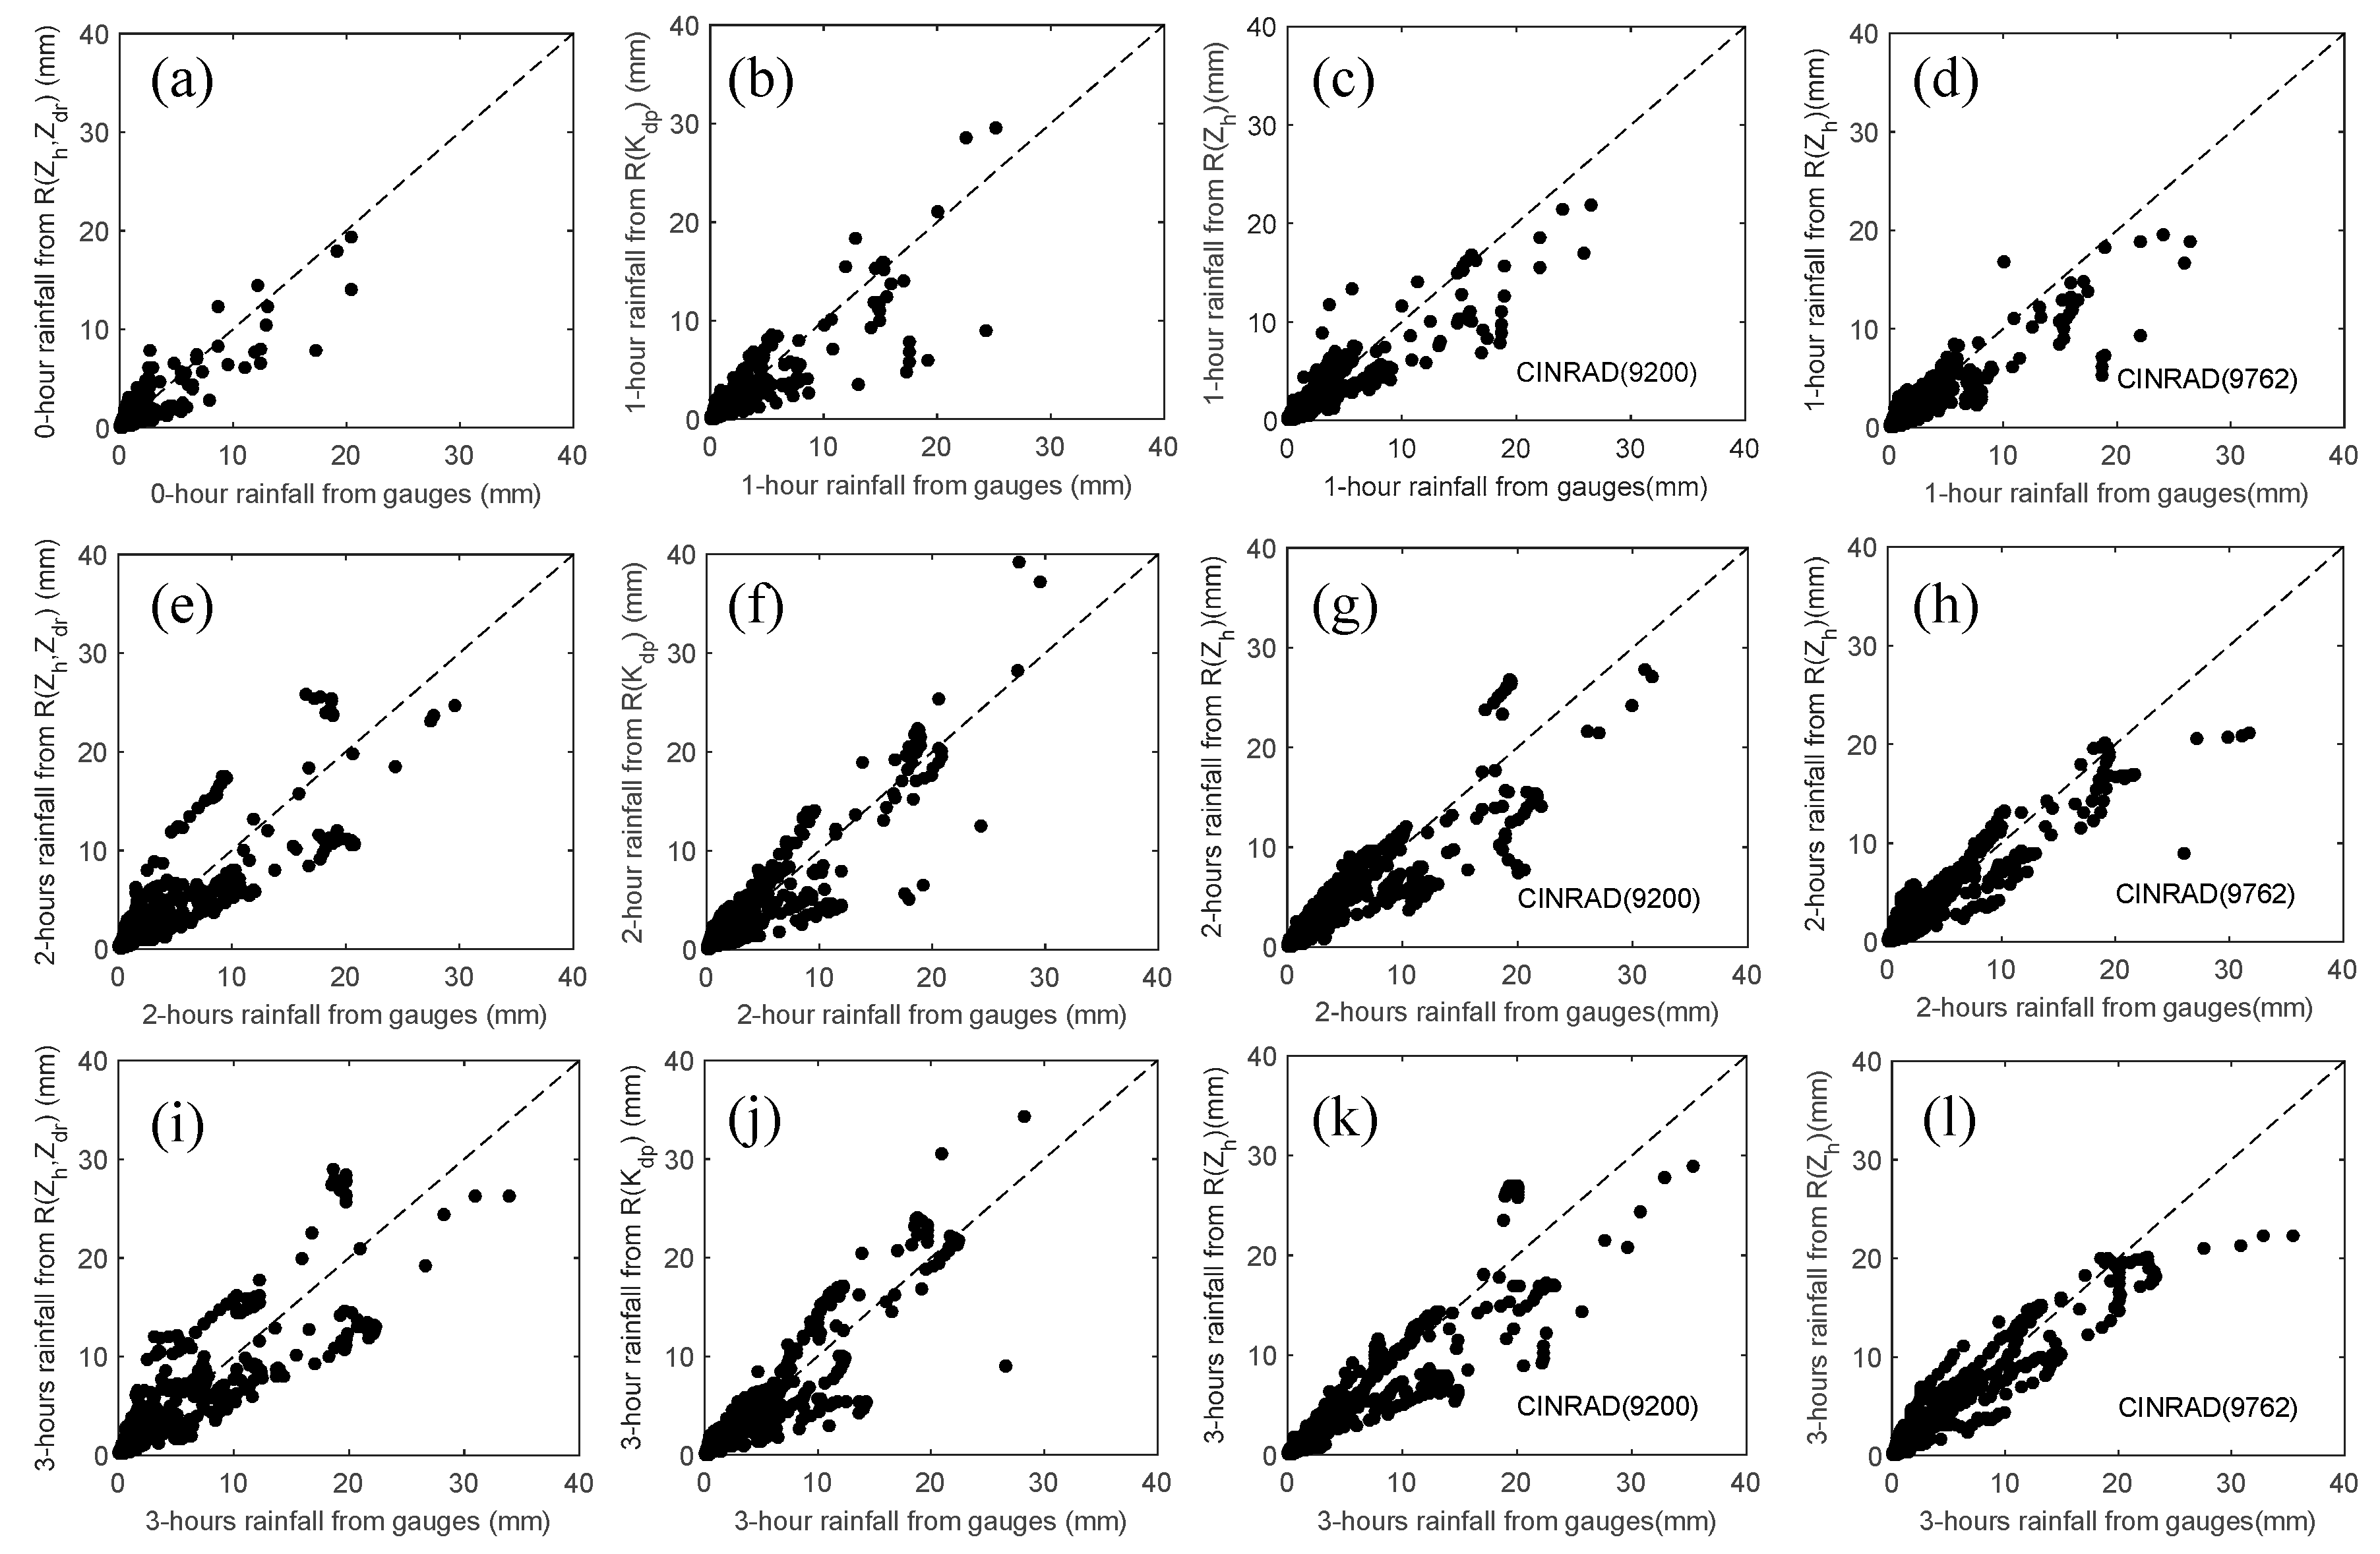
4.2. Performance Evaluation
- (1)
- The FSEs of the are 71.37%, 68.98%, and 62.22% for 1-, 2- and 3-h rainfall accumulations, respectively, and the NMBs are −13.62%, −3.1%, and 0.04%, respectively. The FSEs of the are 79.77%, 57.95%, 50.75%, for 1-, 2- and 3-h rainfall accumulations, respectively, and the NMBs are −10.65%, −4,84%, and −2.64%, respectively. The NMBs and FSEs of estimated for XPRAD are approximate to those estimated for CINRAD. The performance is further demonstrated by the combined scatter plots shown in Figure 11.
- (2)
- Although the shows slightly better performance than , the difference is not remarkable. This also implies that attenuation and bias correction are critical for X-band QPE applications.
- (3)
- It can also be seen that the FSEs of the rainfall estimate relations show a decreasing trend as the rainfall accumulation time increases from 1 h to 3 h, inversely the CORR of the rainfall estimate relations had an increasing trend. This is because the random radar measurement errors are being reduced by temporal averaging.
5. Summary and Conclusions
Acknowledgments
Author Contributions
Conflicts of Interest
References
- Luo, Y.; Zhang, R.; Wan, Q.; Wang, B.; Wong, W.K.; Hu, Z.; Xiao, Y. The Southern China Monsoon Rainfall Experiment (SCMREX). Bull. Am. Meteorol. Soc. 2017, 98, 999–1013. [Google Scholar] [CrossRef]
- McLaughlin, D.; Pepyne, D.; Philips, B.; Kurose, J.; Zink, M.; Westbrook, D.; Kollias, P. Short-Wavelength Technology and the Potential For Distributed Networks of Small Radar Systems. Bull. Am. Meteorol. Soc. 2009, 90, 1797–1817. [Google Scholar] [CrossRef]
- Chandrasekar, V.; Chen, H.; Philips, B. Principles of High-Resolution Radar Network for Hazard Mitigation and Disaster Management in an Urban Environment. J. Meteorol. Soc. Jpn. 2018, 96A. in press. [Google Scholar] [CrossRef]
- Chandrasekar, V.; Wang, Y.; Chen, H. The CASA quantitative precipitation estimation system: A five year validation study. Nat. Hazards Earth Syst. Sci. 2012, 12, 2811–2820. [Google Scholar] [CrossRef]
- Matrosov, S.Y.; Kingsmill, D.E.; Martner, B.E.; Ralph, F.M. The utility of X-band polarimetric radar for quantitative estimates of rainfall parameters. J. Hydrometeorol. 2005, 6, 248–262. [Google Scholar] [CrossRef]
- Anagnostou, M.N.; Anagnostou, E.N.; Vivekanandan, J.; Ogden, F.L. Comparison of raindrop size distribution estimates from X-band and S-band polarimetric observations. IEEE Geosci. Remote Sens. Lett. 2007, 4, 601–605. [Google Scholar] [CrossRef]
- Kim, D.-S.; Maki, M. Validation of composite polarimetric parameters and rainfall rates from an X-band dual-polarization radar network in the Tokyo metropolitan area. Hydrol. Res. Lett. 2012, 6, 76–81. [Google Scholar] [CrossRef]
- Chen, H.; Lim, S.; Chandrasekar, V.; Jang, B.-J. Urban Hydrological Applications of Dual-Polarization X-Band Radar: Case Study in Korea. J. Hydrol. Eng. 2017, 22, E5016001. [Google Scholar] [CrossRef]
- Testud, J.; Bouar, E.L.; Obligis, E.; Ali-Mehenni, M. The Rain Profiling Algorithm Applied to Polarimetric Weather Radar. J. Atmos. Ocean. Technol. 2000, 17, 332–356. [Google Scholar] [CrossRef]
- Matrosov, S.Y.; Clark, K.A.; Martner, B.E.; Tokay, A. X-band polarimetric radar measurements of rainfall. J. Appl. Meteorol. 2002, 41, 941–952. [Google Scholar] [CrossRef]
- Zrnic, D.S.; Ryzhkov, A.V. Polarimetry for weather surveillance radars. Bull. Am. Meteorol. Soc. 1999, 80, 389–406. [Google Scholar] [CrossRef]
- Park, S.; Bringi, V.; Chandrasekar, V.; Maki, M.; Iwanami, K. Correction of radar reflectivity and differential reflectivity for rain attenuation at X band. Part I: Theoretical and empirical basis. J. Atmos. Ocean. Technol. 2005, 22, 1621–1632. [Google Scholar] [CrossRef]
- Park, S.; Maki, M.; Iwanami, K.; Bringi, V.; Chandrasekar, V. Correction of radar reflectivity and differential reflectivity for rain attenuation at X band. Part II: Evaluation and application. J. Atmos. Ocean. Technol. 2005, 22, 1633–1655. [Google Scholar] [CrossRef]
- Gorgucci, E.; Chandrasekar, V.; Baldini, L. Correction of X-band radar observation for propagation effects based on the self-consistency principle. J. Atmos. Ocean. Technol. 2006, 23, 1668–1681. [Google Scholar] [CrossRef]
- Kalogiros, J.; Anagnostou, M.N.; Anagnostou, E.N.; Montopoli, M.; Picciotti, E.; Marzano, F.S. Evaluation of a new polarimetric algorithm for rain-path attenuation correction of X-band radar observations against disdrometer. IEEE Trans. Geosci. Remote Sens. 2014, 52, 1369–1380. [Google Scholar] [CrossRef]
- Mishchenko, M.I.; Travis, L.D.; Mackowski, D.W. T-matrix computations of light scattering by nonspherical particles: A review. J. Quant. Spectrosc. Radiat. Transf. 1996, 55, 535–575. [Google Scholar] [CrossRef]
- Ryzhkov, A.V.; Giangrande, S.E.; Melnikov, V.M.; Schuur, T.J. Calibration issues of dual-polarization radar measurements. J. Atmos. Ocean. Technol. 2005, 22, 1138–1155. [Google Scholar] [CrossRef]
- Trabal, J.M.; Gorgucci, E.; Chandrasekar, V.; McLaughlin, D.J. Evaluation of the self-consistency principle for calibration of the CASA radar network using properties of the observed precipitation medium. IEEE Trans. Geosci. Remote Sens. 2014, 52, 149–162. [Google Scholar] [CrossRef]
- Bringi, V.N.; Chandrasekar, V. Polarimetric Doppler Weather Radar: Principles and Applications; Cambridge University Press: Cambridge, UK, 2001; ISBN 1139429469. [Google Scholar]
- Scarchilli, G.; Gorgucci, V.; Chandrasekar, V.; Dobaie, A. Self-consistency of polarization diversity measurement of rainfall. IEEE Trans. Geosci. Remote Sens. 1996, 34, 22–26. [Google Scholar] [CrossRef]
- Andsager, K.; Beard, K.V.; Laird, N.F. Laboratory measurements of axis ratios for large raindrops. J. Atmos. Sci. 1999, 56, 2673–2683. [Google Scholar] [CrossRef]
- Beard, K.V.; Chuang, C. A new model for the equilibrium shape of raindrops. J. Atmos. Sci. 1987, 44, 1509–1524. [Google Scholar] [CrossRef]
- Barber, P.; Yeh, C. Scattering of electromagnetic waves by arbitrarily shaped dielectric bodies. Appl. Opt. 1975, 14, 2864–2872. [Google Scholar] [CrossRef] [PubMed]
- Beard, K.; Jameson, A. Raindrop canting. J. Atmos. Sci. 1983, 40, 448–454. [Google Scholar] [CrossRef]
- Bringi, V.; Chandrasekar, V.; Balakrishnan, N.; Zrnic, D. An examination of propagation effects in rainfall on radar measurements at microwave frequencies. J. Atmos. Ocean. Technol. 1990, 7, 829–840. [Google Scholar] [CrossRef]
- Jameson, A. Polarization radar measurements in rain at 5 and 9 GHz. J. Appl. Meteorol. 1991, 30, 1500–1513. [Google Scholar] [CrossRef]
- Brandes, E.A.; Ikeda, K. Freezing-level estimation with polarimetric radar. J. Appl. Meteorol. 2004, 43, 1541–1553. [Google Scholar] [CrossRef]
- Shakti, P.C.; Maki, M.; Shimizu, S.; Maesaka, T.; Kim, D.S.; Lee, D.I.; Iida, H. Correction of Reflectivity in the Presence of Partial Beam Blockage over a Mountainous Region Using X-Band Dual Polarization Radar. J. Hydrometeorol. 2013, 14, 744–764. [Google Scholar]


| Item | Value |
|---|---|
| Wavelength | X |
| Antenna Diameter/m | 2.4 |
| Antenna Gain/dBi | 44 |
| 3 dB Beam width/° | 0.95 |
| Polarized mode | Simultaneous Horizontal and Vertical Polarization (SHV) |
| Transmitted Peak Power/W | 200 |
| Bandwidth/mHz | 2 |
| Noise Figure/dB | 4 |
| Dynamic Range/dB | 95 |
| Base Data | |
| Altitude above sea level | 874 m |
| No. | Date | Duration Time (BJT, UTC + 8:00) | Rainfall Basic Characteristic | Evolving Direction | |
|---|---|---|---|---|---|
| From | To | ||||
| 1 | 20 May 2016 | 00:00–24:00 | Stratiform | Southwest | Northeast |
| 2 | 21 May 2016 | 00:00–13:00 | Convective | Southwest | Northeast |
| 3 | 28 May 2016 | 00:00–24:00 | stratiform | South | North |
| 4 | 29 May 2016 | 00:00–24:00 | Convective | Southwest | Northeast |
| 5 | 03 June 2016 | 10:30–24:00 | stratiform | West | East |
| 6 | 04 June 2016 | 00:00–24:00 | stratiform | West | East |
| 7 | 05 June 2016 | 03:00–12:21 | Convective | West | East |
| 8 | 08 June 2016 | 02:00–15:50 | Convective | Southwest | Northeast |
| 9 | 09 June 2016 | 12:57–24:00 | Convective | South | North |
| 10 | 10 June 2016 | 00:00–10:30 | Convective | South | North |
| 11 | 11 June 2016 | 02:00–24:00 | Convective | Southwest | Northeast |
| 12 | 12 June 2016 | 00:00–24:00 | Convective | Northwest | Southeast |
| 13 | 13 June 2016 | 00:00–24:00 | Stratiform | West | East |
| 14 | 14 June 2016 | 00:00–24:00 | Convective | West | East |
| 15 | 16 June 2016 | 01:30–14:30 | stratiform | Southwest | Northeast |
| 0.323 | 1.05 | 0.131 | 1.2 | 1 | −4.58 | |
| Rainfall Event No. | Mean of Bias (dB) | Standard Deviation of Bias (dB) | ||
|---|---|---|---|---|
| DAS Approach | LRLA Approch | DAS Approach | LRLA Approch | |
| 1 | 0.52 | 0.43 | 0.13 | 0.18 |
| 2 | — | 0.48 | — | 0.17 |
| 3 | 0.75 | 0.52 | 0.15 | 0.19 |
| 4 | — | 0.53 | — | 0.21 |
| 5 | 0.65 | 0.65 | 0.16 | 0.21 |
| 6 | 0.63 | 0.65 | 0.15 | 0.30 |
| 7 | — | 0.61 | — | 0.20 |
| 8 | — | 0.60 | — | 0.25 |
| 9 | — | 0.68 | — | 0.17 |
| 10 | — | 0.69 | — | 0.18 |
| 11 | — | 0.76 | — | 0.24 |
| 12 | — | 0.75 | — | 0.22 |
| 13 | 0.79 | 0.78 | 0.22 | 0.21 |
| 14 | — | 0.79 | — | 0.22 |
| 15 | 0.77 | 0.81 | 0.21 | 0.32 |
| Rainfall Event No. | Mean of Bias (dB) | Standard Deviation of Bias (dB) | ||||
|---|---|---|---|---|---|---|
| Self-Consistency | CINRAD (9200) | CINRAD (9762) | Self-Consistency | CINRAD (9200) | CINRAD (9762) | |
| 1 | 0.10 | 0.31 | 1.1 | 0.08 | 0.18 | 0.19 |
| 2 | 0.19 | 0.33 | 0.15 | 0.12 | 0.24 | 0.15 |
| 3 | 0.25 | 0.28 | 0.83 | 0.12 | 0.25 | 0.24 |
| 4 | 0.14 | 0.95 | — | 0.16 | 0.19 | — |
| 5 | 0.19 | 0.56 | 0.50 | 0.18 | 0.18 | 0.24 |
| 6 | 0.93 | 1.23 | 1.41 | 0.33 | 0.48 | 0.18 |
| 7 | 0.97 | 0.78 | 0.69 | 0.38 | 0.32 | 0.23 |
| 8 | 0.96 | 0.98 | 0.48 | 0.38 | 0.37 | 0.19 |
| 9 | 0.96 | 0.11 | 0.74 | 0.37 | 0.24 | 0.20 |
| 10 | 1.38 | — | — | 0.39 | — | — |
| 11 | 1.05 | — | — | 0.37 | — | — |
| 12 | 0.61 | 0.72 | 0.96 | 0.12 | 0.27 | 0.38 |
| 13 | 0.39 | 0.30 | 0.28 | 0.21 | 0.36 | 0.20 |
| 14 | 0.40 | — | 0.76 | 0.20 | — | 0.12 |
| 15 | 0.35 | 1.25 | 1.1 | 0.19 | 0.26 | 0.13 |
| Time Scale (Hour) | FSE (%) | NMB (%) | CORR | |||||||||
|---|---|---|---|---|---|---|---|---|---|---|---|---|
| XPRAD | XPRAD | 9200 | 9762 | XPRAD | XPRAD | 9200 | 9762 | XPRAD | XPRAD | 9200 | 9762 | |
| 1.0 | 71.37 | 79.77 | 69.75 | 72.58 | −13.62 | −10.65 | −13.84 | −11.78 | 0.87 | 0.86 | 0.92 | 0.91 |
| 2.0 | 68.98 | 57.95 | 60.45 | 51.08 | −3.10 | −4.84 | −11.12 | −4.91 | 0.89 | 0.91 | 0.91 | 0.93 |
| 3.0 | 62.22 | 50.75 | 52.11 | 41.30 | 0.04 | −2.64 | −12.55 | −2.33 | 0.90 | 0.92 | 0.91 | 0.94 |
© 2017 by the authors. Licensee MDPI, Basel, Switzerland. This article is an open access article distributed under the terms and conditions of the Creative Commons Attribution (CC BY) license (http://creativecommons.org/licenses/by/4.0/).
Share and Cite
Shi, Z.; Chen, H.; Chandrasekar, V.; He, J. Deployment and Performance of an X-Band Dual-Polarization Radar during the Southern China Monsoon Rainfall Experiment. Atmosphere 2018, 9, 4. https://doi.org/10.3390/atmos9010004
Shi Z, Chen H, Chandrasekar V, He J. Deployment and Performance of an X-Band Dual-Polarization Radar during the Southern China Monsoon Rainfall Experiment. Atmosphere. 2018; 9(1):4. https://doi.org/10.3390/atmos9010004
Chicago/Turabian StyleShi, Zhao, Haonan Chen, Venkatachalam Chandrasekar, and Jianxin He. 2018. "Deployment and Performance of an X-Band Dual-Polarization Radar during the Southern China Monsoon Rainfall Experiment" Atmosphere 9, no. 1: 4. https://doi.org/10.3390/atmos9010004
APA StyleShi, Z., Chen, H., Chandrasekar, V., & He, J. (2018). Deployment and Performance of an X-Band Dual-Polarization Radar during the Southern China Monsoon Rainfall Experiment. Atmosphere, 9(1), 4. https://doi.org/10.3390/atmos9010004