
Windthrow Variability in Central Amazonia

 ,
,  ,
, 
Abstract
:1. Introduction
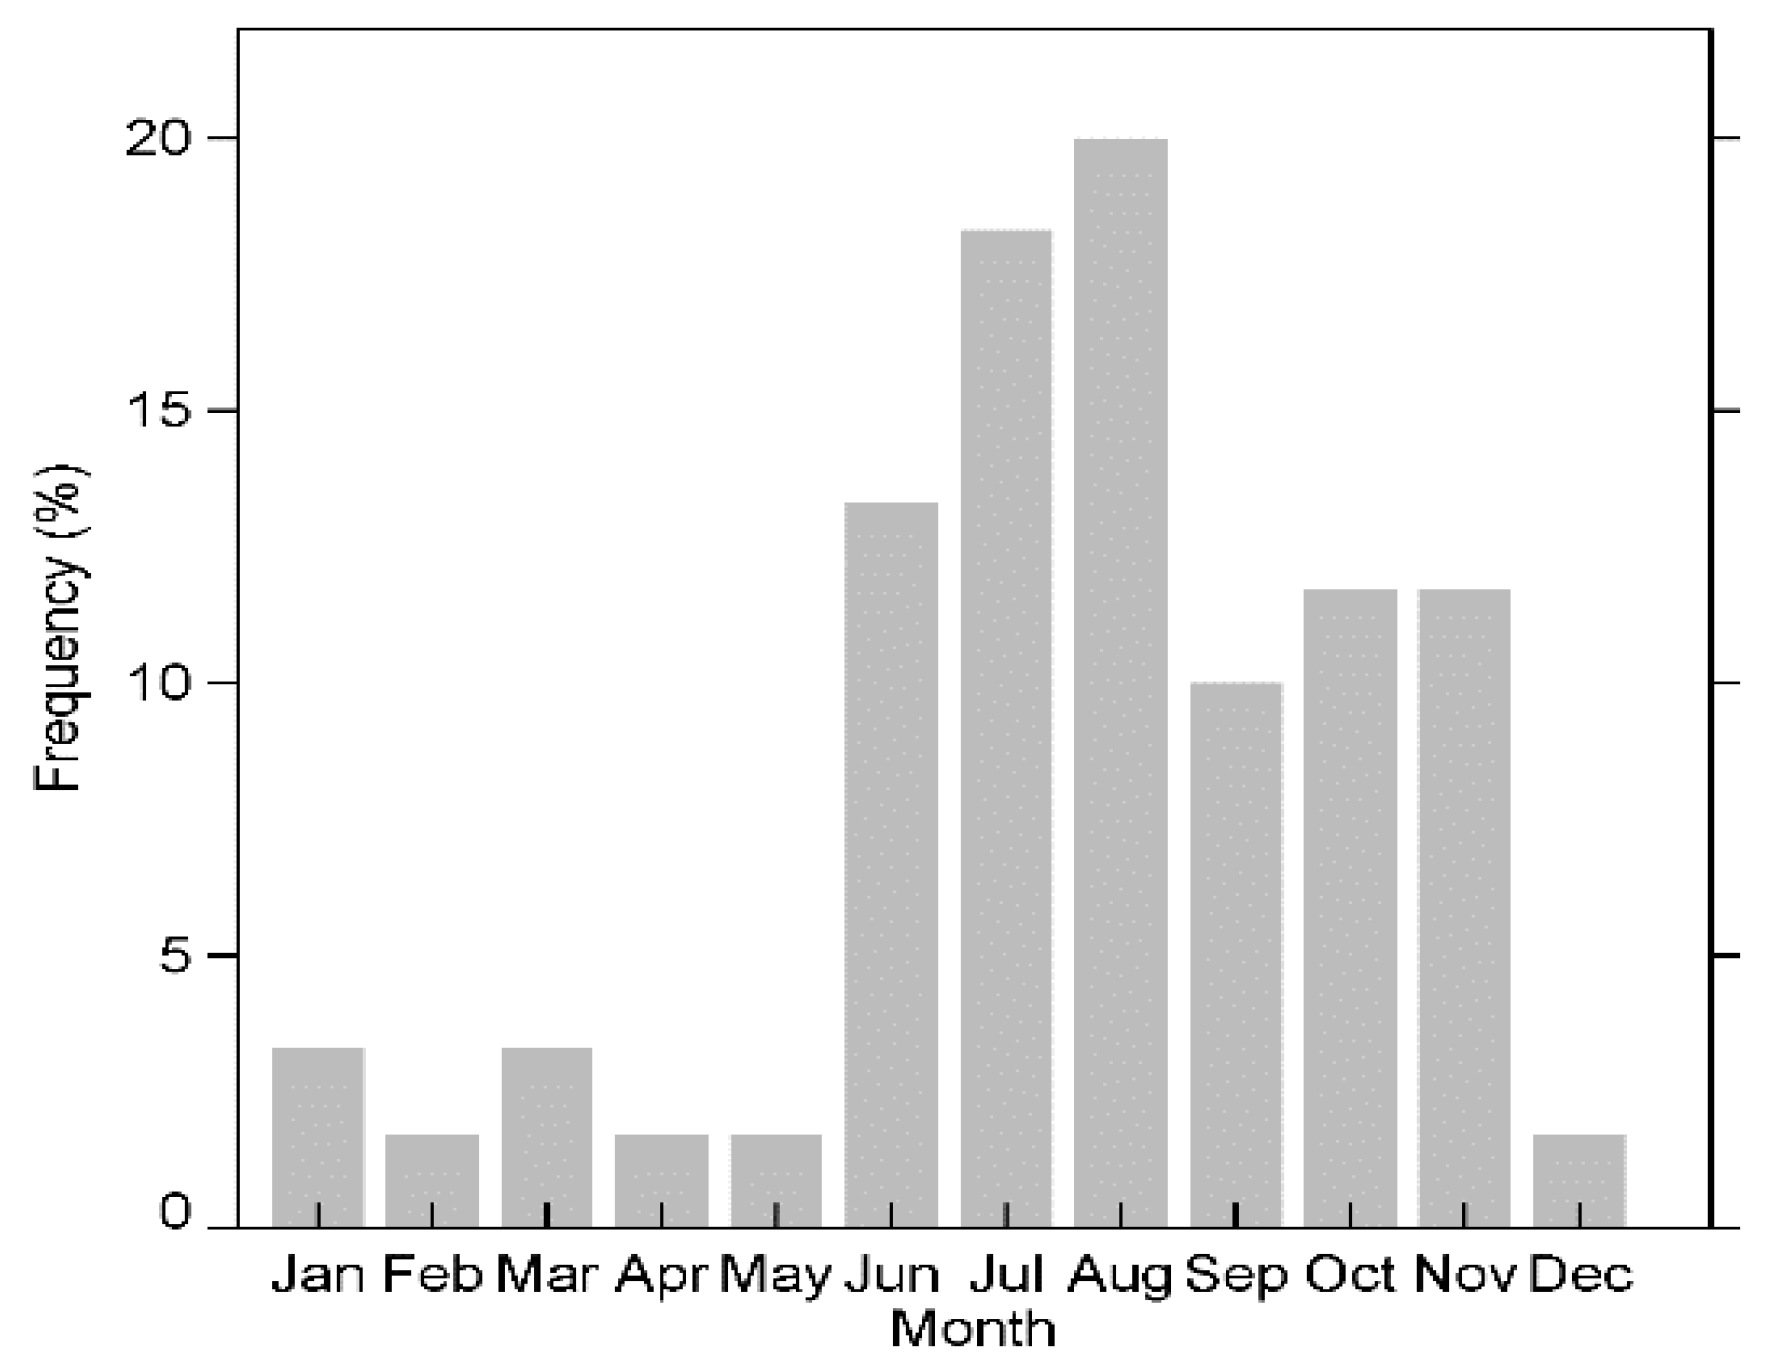
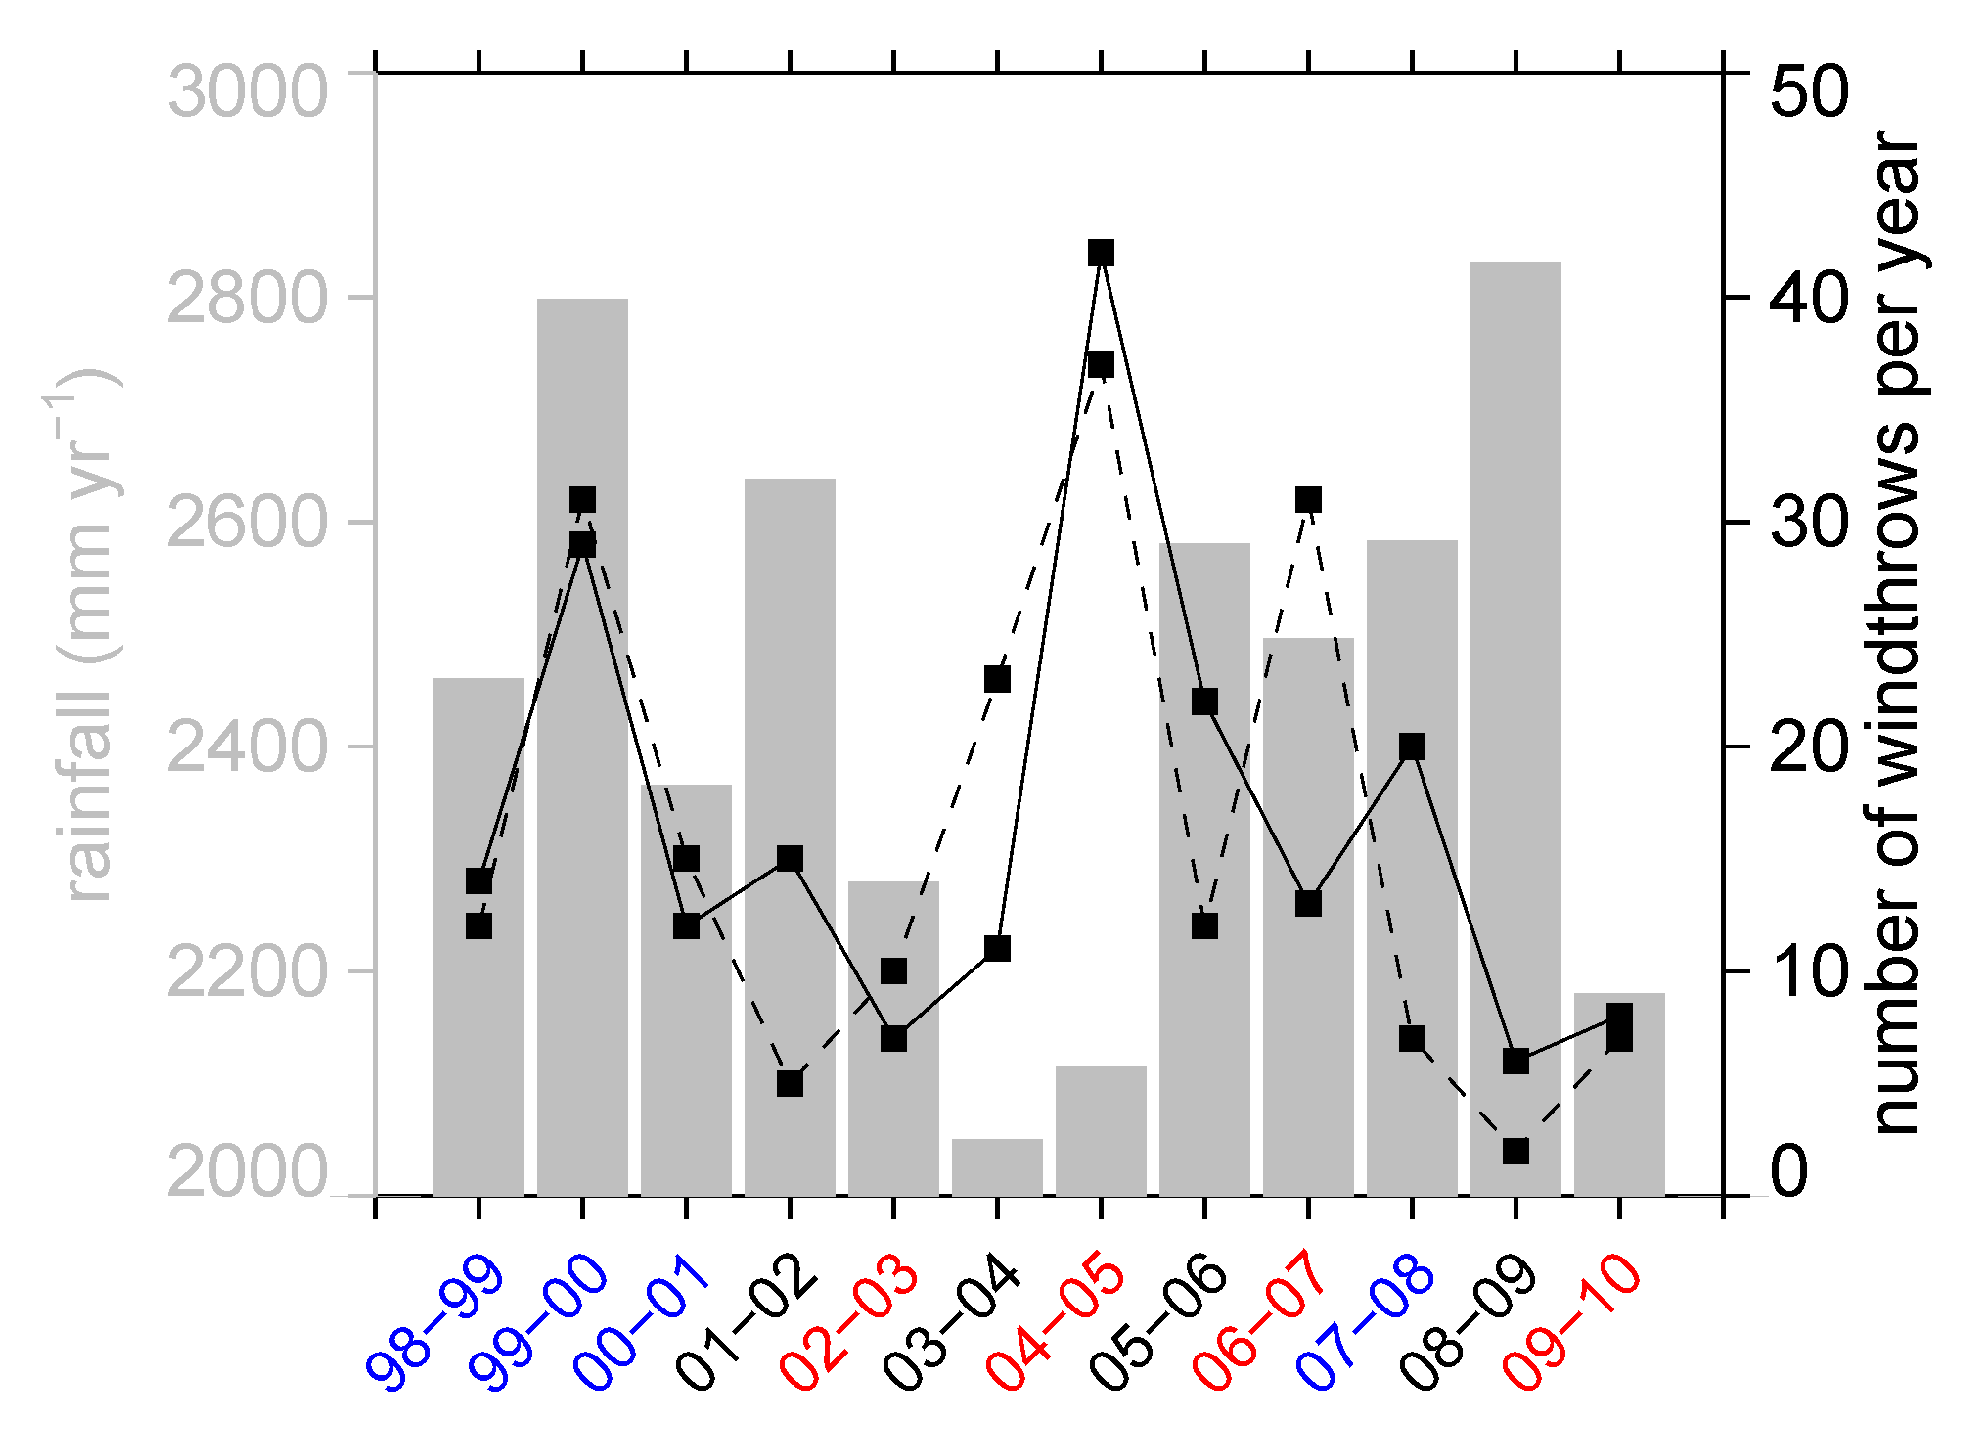
- What is the seasonal and interannual variability of windthrows?
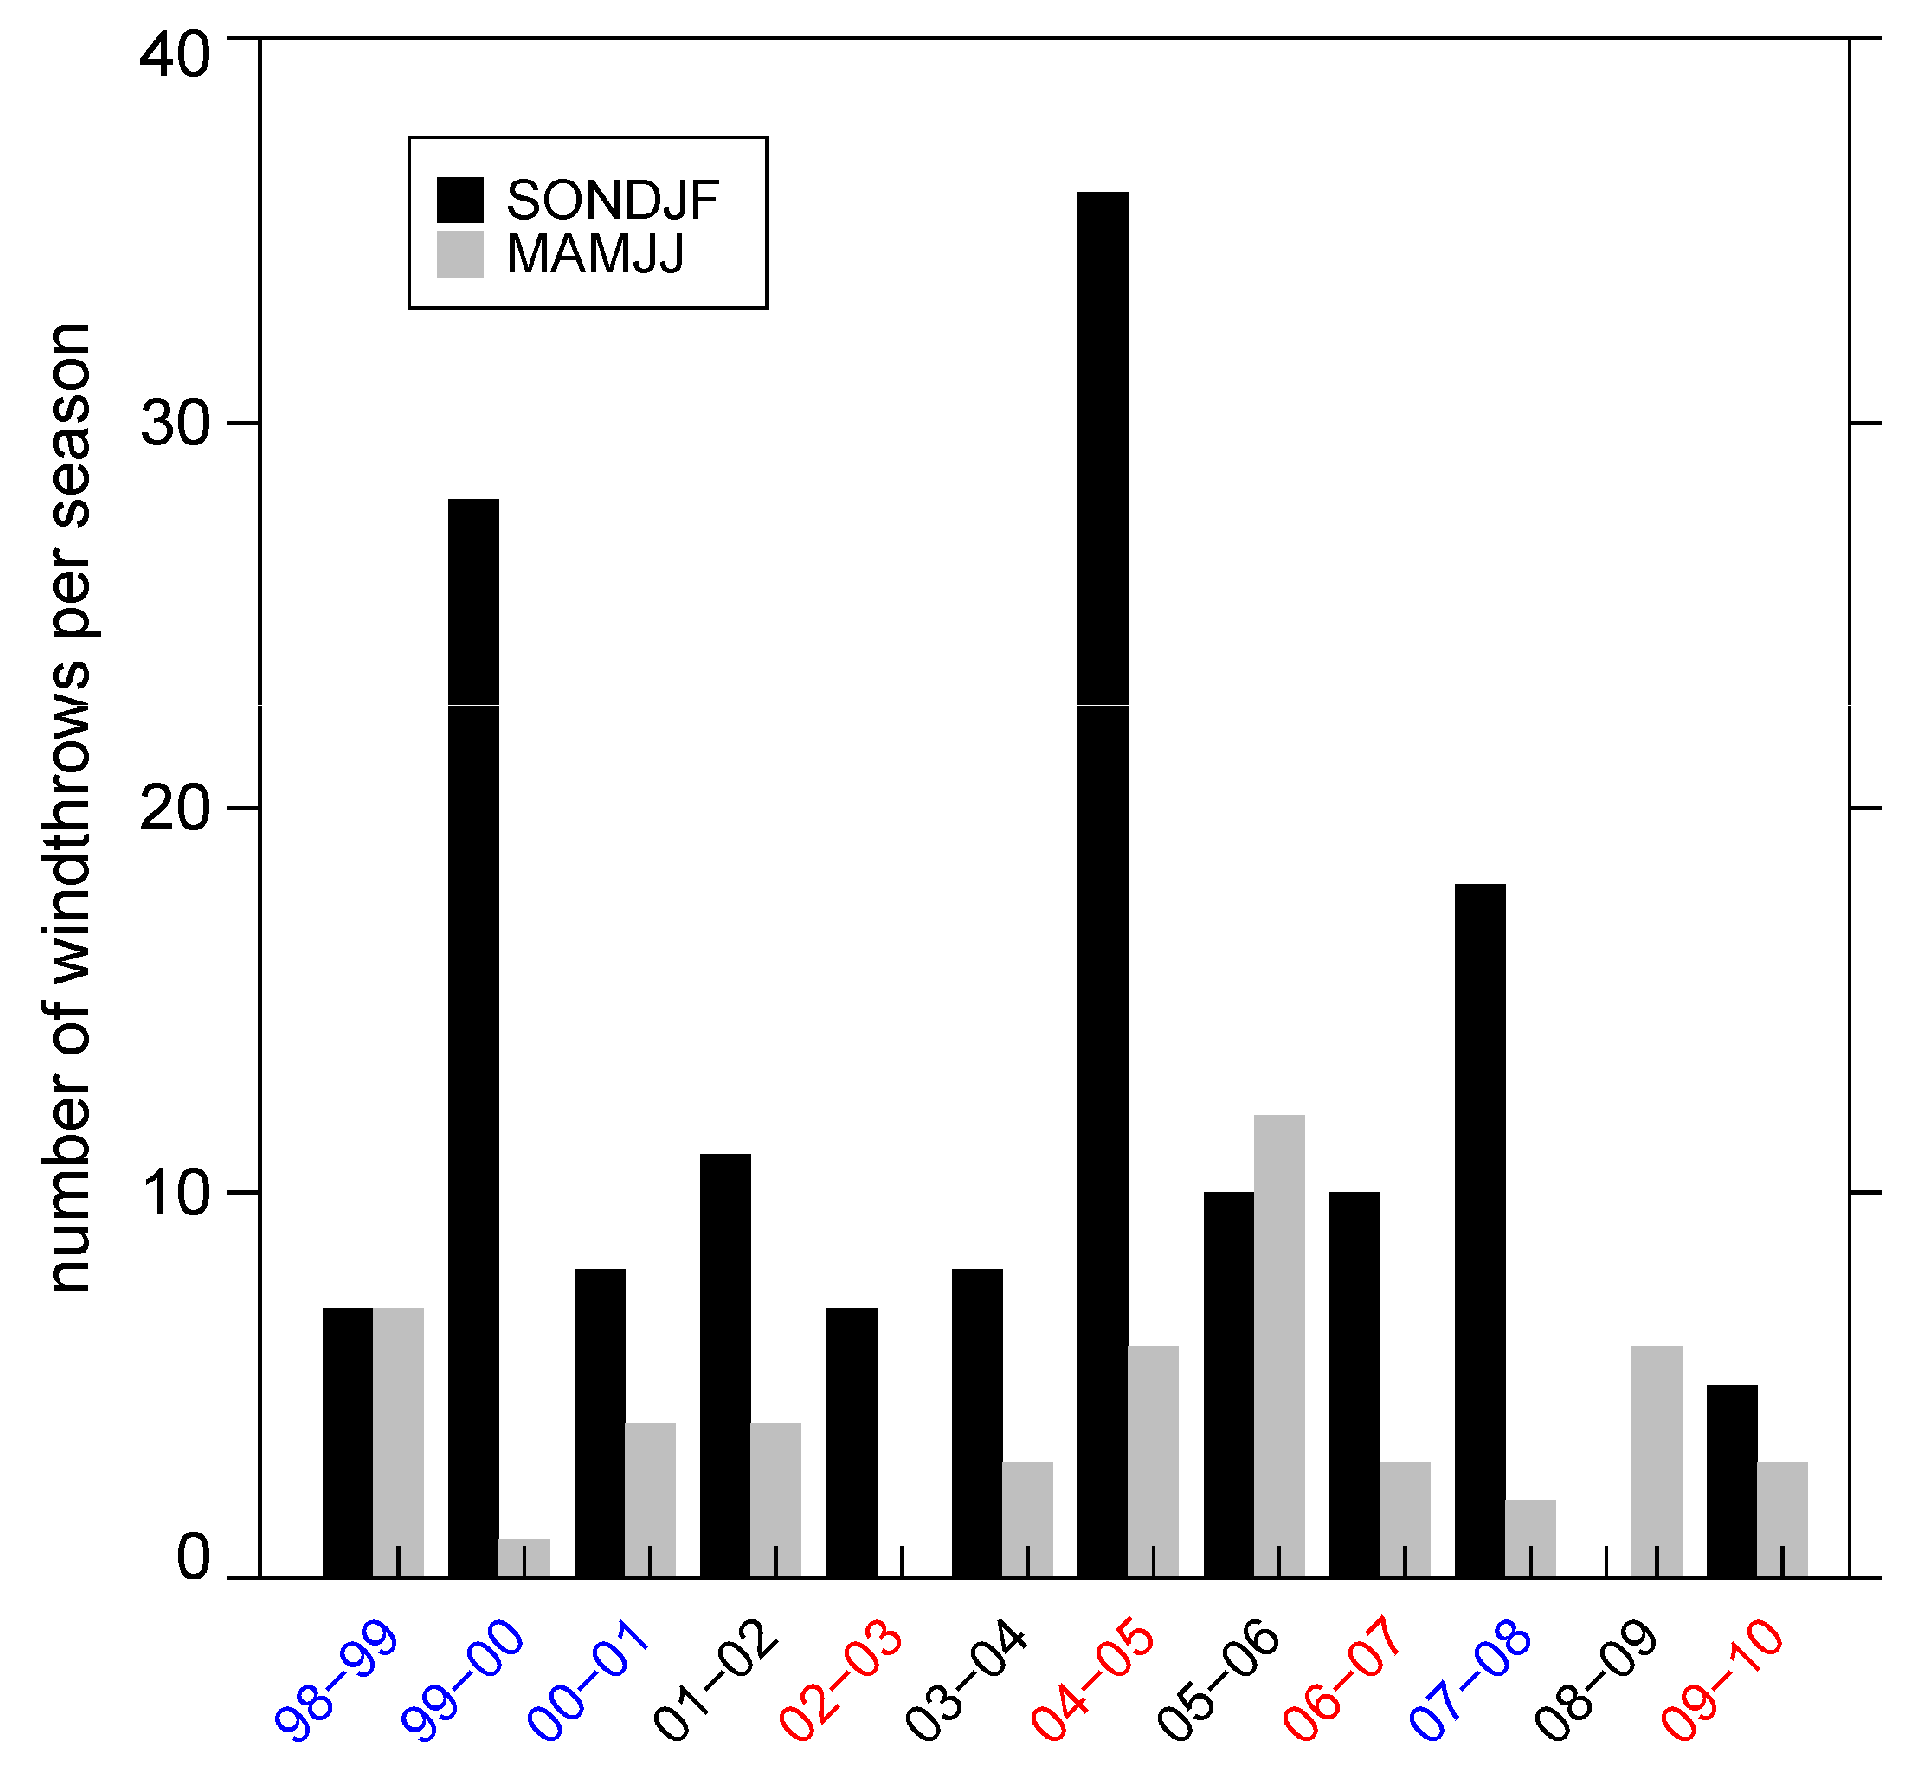
- Are windthrows associated with ENSO?
2. Data and Methods
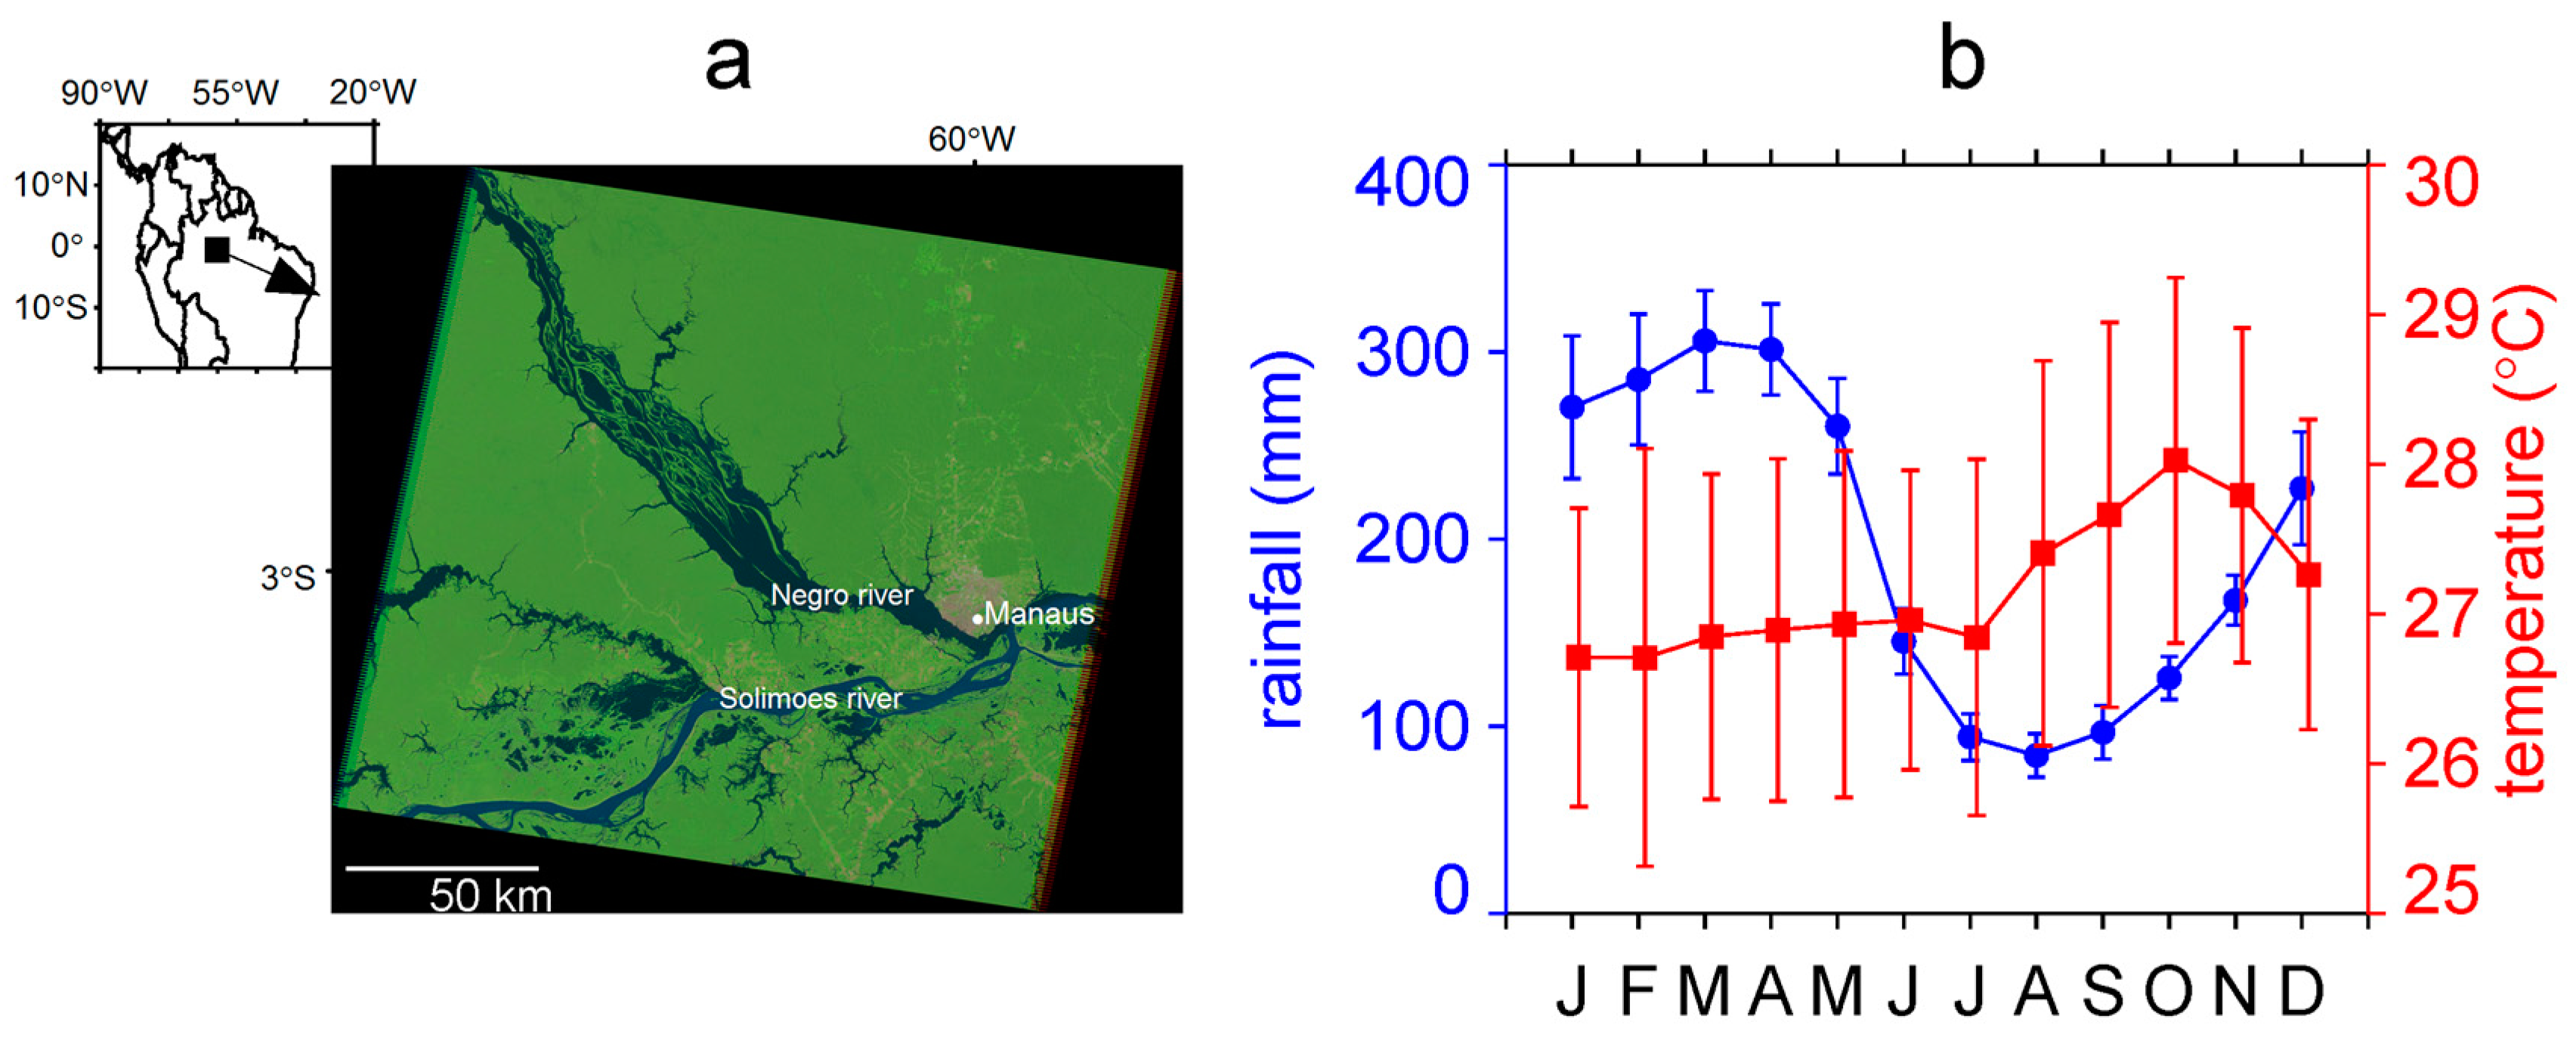
2.1. Study Area
2.2. Meteorological Data
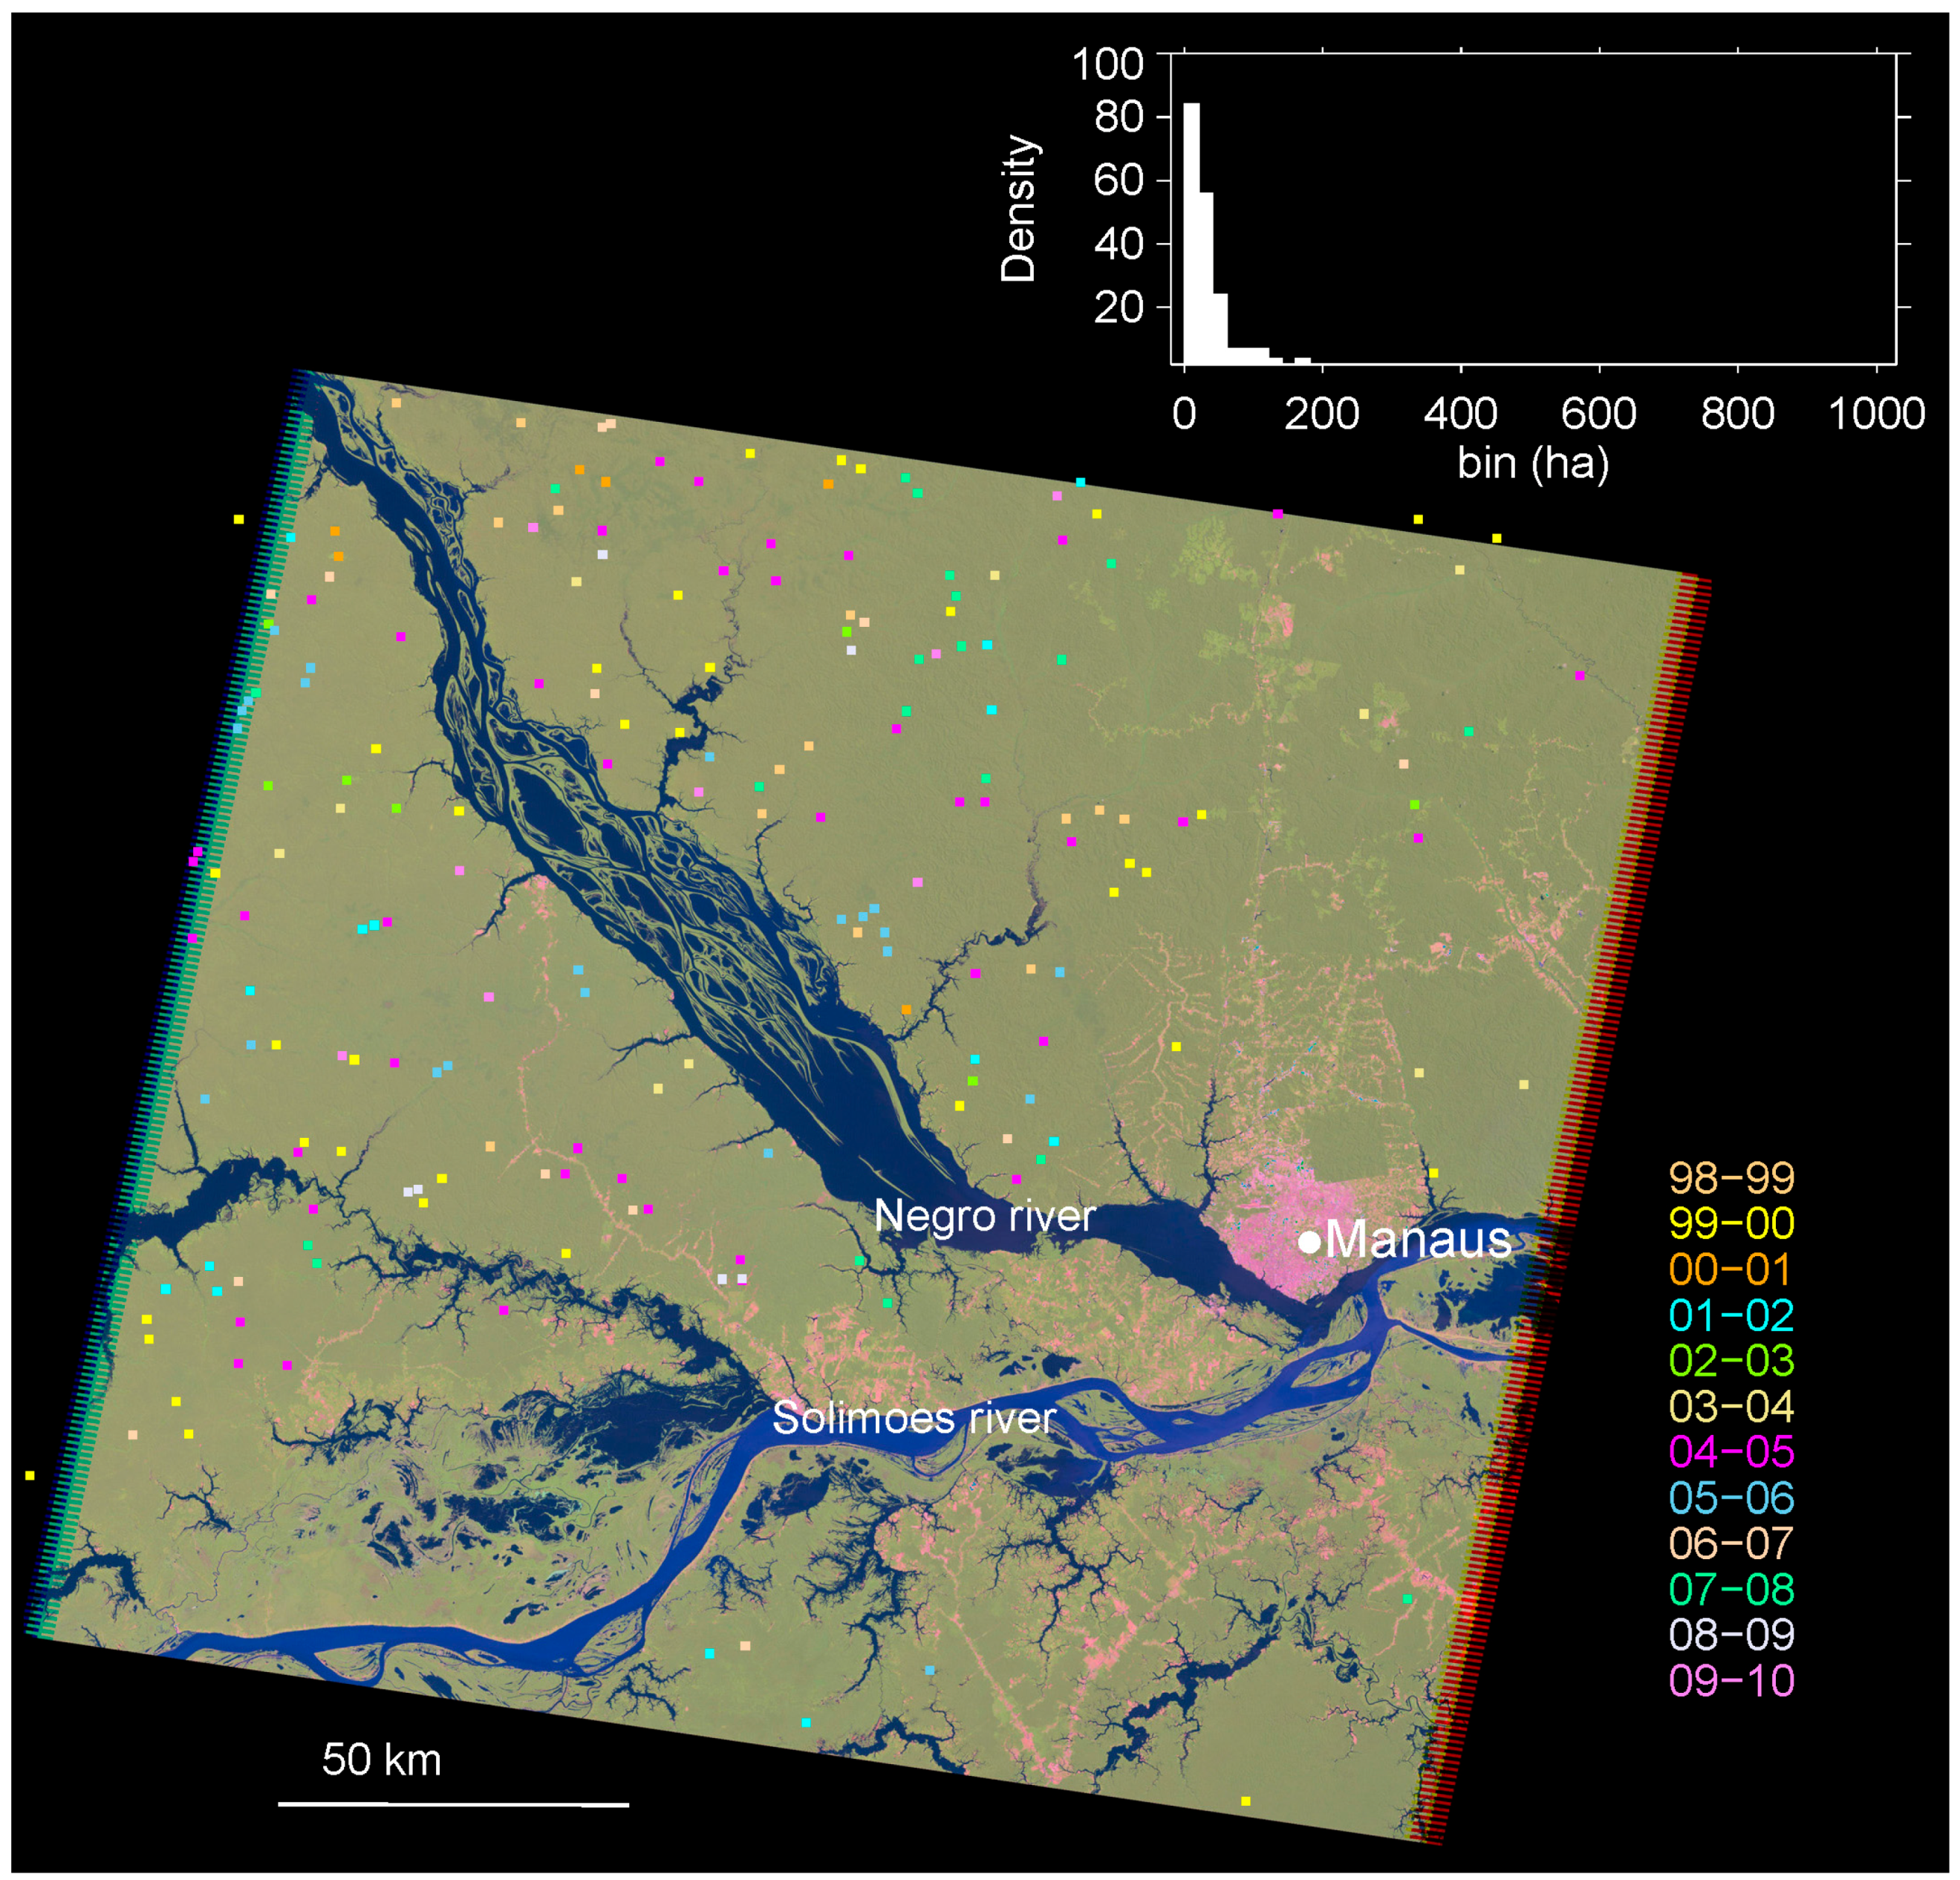
2.3. Windthrow Identification
2.4. Dating of Windthrows
2.5. ENSO Years
3. Results
4. Discussion
5. Conclusions
Supplementary Materials
Acknowledgments
Author Contributions
Conflicts of Interest
References
- Garstang, M.; White, S.; Shugart, H.H.; Halverson, J. Convective cloud downdrafts as the cause of large blowdowns in the Amazon rainforest. Meteorol. Atmos. Phys. 1998, 67, 199–212. [Google Scholar] [CrossRef]
- Fujita, T.T. The Downburst: Microburst and Macroburst; University of Chicago: Chicago, IL, USA, 1985; p. 122. [Google Scholar]
- Negrón-Juárez, R.I.; Chambers, J.Q.; Guimaraes, G.; Zeng, H.; Raupp, C.F.M.; Marra, D.M.; Ribeiro, G.H.P.M.; Saatchi, S.S.; Nelson, B.W.; Higuchi, N. Widespread Amazon forest tree mortality from a single cross-basin squall line event. Geophys. Res. Lett. 2010, 37, L16701. [Google Scholar] [CrossRef]
- Nelson, B.W.; Kapos, V.; Adams, J.B.; Oliveira, W.; Braun, O. Forest disturbance by large blowdowns in the Brazilian Amazon. Ecology 1994, 75, 853–858. [Google Scholar] [CrossRef]
- Espirito-Santo, F.D.B.; Keller, M.; Braswell, B.; Nelson, B.W.; Frolking, S.; Vicente, G. Storm intensity and old-growth forest disturbances in the Amazon region. Geophys. Res. Lett. 2010, 37, L11403. [Google Scholar] [CrossRef]
- Mitchell, S.J. Wind as a natural disturbance agent in forests: A synthesis. Forestry 2013, 86, 147–157. [Google Scholar] [CrossRef]
- Negrón-Juárez, R.I.; Chambers, J.Q.; Marra, D.M.; Ribeiro, G.H.P.M.; Rifai, S.W.; Higuchi, N.; Roberts, D. Detection of subpixel treefall gaps with Landsat imagery in Central Amazon forests. Remote Sens. Environ. 2011, 115, 3322–3328. [Google Scholar] [CrossRef]
- Chambers, J.Q.; Negron-Juarez, R.I.; Marra, D.M.; Di Vittorio, A.; Tews, J.; Roberts, D.; Ribeiro, G.H.P.M.; Trumbore, S.E.; Higuchi, N. The steady-state mosaic of disturbance and succession across an old-growth Central Amazon forest landscape. Proc. Natl. Acad. Sci. USA 2013, 110, 3949–3954. [Google Scholar] [CrossRef] [PubMed]
- Malhi, Y.; Doughty, C.; Goldsmith, G.; Metcalfe, D.B.; Girardin, C.A.J.; Marthews, T.R.; Del Aguila-Pasquel, J.; Aragao, L.E.; Brando, P.M.; Da Costa, A.L.; et al. The linkages between photosynthesis, productivity, growth and biomass in lowland Amazonian forests. Glob. Chang. Biol. 2015, 21, 2283–2295. [Google Scholar] [CrossRef] [PubMed]
- Ter Steege, H.; Pitman, N.C.A.; Sabatier, D.; Baraloto, C.; Salomao, R.P.; Guevara, J.E.; Phillips, O.L.; Castilho, C.V.; Magnusson, W.E.; Molino, J.-F.; et al. Hyperdominance in the Amazonian tree Flora. Science 2013, 342, 1243092. [Google Scholar] [CrossRef] [PubMed]
- Magnabosco Marra, D.; Chambers, J.Q.; Higuchi, N.; Trumbore, S.E.; Ribeiro, G.H.P.M.; dos Santos, J.; Negron-Juarez, R.I.; Reu, B.; Wirth, C. Large-scale wind disturbances promote tree diversity in a Central Amazon forest. PLoS ONE 2014, 9, e103711. [Google Scholar]
- Chambers, J.Q.; Robertson, A.L.; Carneiro, V.M.C.; Lima, A.J.N.; Smith, M.-L.; Plourde, L.C.; Higuchi, N. Hyperspectral remote detection of niche partitioning among canopy trees driven by blowdown gap disturbances in the Central Amazon. Oecologia 2009, 160, 107–117. [Google Scholar] [CrossRef] [PubMed]
- Dos Santos, L.T.; Magnabosco Marra, D.; Trumbore, S.; Camargo, P.B.; Chambers, J.Q.; Negron-Juarez, R.I.; Lima, A.J.N.; Ribeiro, G.H.P.M.; Dos Santos, J.; Higuchi, N. Windthrows increase soil carbon stocks in a Central Amazon forest. Biogeosci. Discuss 2015, 12, 19351–19372. [Google Scholar] [CrossRef]
- Holm, J.A.; Chambers, J.; Collins, W.D.; Higuchi, N. Forest response to increased disturbance in the Central Amazon and comparison to Western Amazonian forests. Biogeosciences 2014, 11, 5773–5794. [Google Scholar] [CrossRef]
- Intergovernmental Panel on Climate Change (IPCC). Climate Change 2013: The Physical Science Basis. Contribution of Working Group I to the Fifth Assessment Report of the Intergovernmental Panel on Climate Change; IPCC: Cambridge, UK, 2013; p. 1535. [Google Scholar]
- Nelson, B.W.; Amaral, I. Destructive wind efects detected in tm images of the Amazon basin. In Proceedings of the International Society for Photogrammetry and Remote Sensing, Rio de Janeiro, Brazil, 26–30 September 1994; Brazil’s National Institute for Space Research: Rio de Janeiro, Brazil, 1994; pp. 339–343. [Google Scholar]
- Cohen, J.; Cavalcanti, I.F.A.; Braga, R.H.M.; Neto, S.L. Squall line in the N-NE coast of South America. In Weather and Climate of Brazil; Cavalcanti, I.F.A., Ferreira, N.J., Silva, M.G.A.J., Silva Dias, M.A.F., Eds.; Oficina de Textos: Sao Paulo, Brazil, 2009; pp. 75–93. [Google Scholar]
- Greco, S.; Scala, J.; Halverson, J.; Massie, H.L.; Tao, W.K.; Garstang, M. Amazon coastal squall lines. 2. Heat and moisture transports. Mon. Weather Rev. 1994, 122, 623–635. [Google Scholar] [CrossRef]
- Alcantara, C.R.; Silva Dias, M.A.F.; Souza, E.P.; Cohen, J.C.P. Verification of the role of the low level jets in Amazon squall lines. Atmos. Res. 2011, 100, 36–44. [Google Scholar] [CrossRef]
- Cohen, J.; Dias, M.; Nobre, C.A. Environmental conditions associated with Amazonian squall lines. A case study. Mon. Weather Rev. 1995, 123, 3163–3174. [Google Scholar] [CrossRef]
- Dias, M.; Ferreira, R.N. Application of a linear spectral model to the study of Amazonian squall lines during GTE ABLE 2B. J. Geophys. Res. Atmos. 1992, 97, 20405–20419. [Google Scholar] [CrossRef]
- Cohen, J.; Silva Dias, M.A.F.; Nobre, C.A. Climatological aspect of Amazon squall lines. Climanalise Boletim de Monitoriamento e Analise Climatico 1989, 4, 34–40. [Google Scholar]
- Molion, L.; Imbuzeiro, H.; Cavalcanti, I.F.A. Intense rainfalls in the east of Amazon: February of 1980. Climanal. J. 2006, 11, 20–27. (In Portuguese) [Google Scholar]
- Espinoza, J.C.; Ronchail, J.; Lengaigne, M.; Quispe, N.; Silva, Y.; Bettolli, M.L.; Avalos, G.; Llacza, A. Revisiting wintertime cold air intrusions at the east of the Andes: Propagating features from subtropical Argentina to Peruvian Amazon and relationship with large-scale circulation patterns. Clim. Dyn. 2013, 41, 1983–2002. [Google Scholar] [CrossRef]
- Alonso, M.F.; Saraiva, J. Simulation of a squall line occurred in January 18th 2005. In Proceedings of the International Symposium on Nowcasting and Very Short Range Forecasting (WSN05), Toulouse, France, 5–9 September 2005.
- Trenberth, K.E. El niño southern oscillation (ENSO). In Reference Module in Earth Systems and Environmental Sciences; Elsevier Ltd.: London, UK, 2013. [Google Scholar]
- Andrade, E.A.; Higuchi, N. Productivity of four terra firme tree species of Central Amazonia. Acta Amazon. 2009, 39, 105–112. [Google Scholar] [CrossRef]
- Ferraz, J.; Oht, S.; Salles, P.C. Distribuição dos solos ao longo de dois transectos em floresta primária ao norte de Manaus (AM). In Pesquisas Florestais Para a Conservação da Floresta e Reabilitação de Áreas Degradadas da Amazônia; Higuchi, N., Campos, M.A.A., Sampaio, P.T.B., Santos, J., Eds.; INPA: Manaus, Brazil, 1998; pp. 111–143. [Google Scholar]
- Renno, C.D.; Nobre, A.D.; Cuartas, L.A.; Soares, J.V.; Hodnett, M.G.; Tomasella, J.; Waterloo, M.J. Hand, a new terrain descriptor using SRTM-DEM: Mapping terra-firme rainforest environments in Amazonia. Remote Sens. Environ. 2008, 112, 3469–3481. [Google Scholar] [CrossRef]
- Luizao, R.C.C.; Luizao, F.J.; Paiva, R.Q.; Monteiro, T.F.; Sousa, L.S.; Kruijt, B. Variation of carbon and nitrogen cycling processes along a topographic gradient in a central amazonian forest. Glob. Chang. Biol. 2004, 10, 592–600. [Google Scholar] [CrossRef]
- Carneiro, V.M.C.; Lima, A.J.N.; Pinto, A.C.; Santos, J.; Teixeira, L.M.; Higuchi, N. Floristic composition and structural analisis of terr firme forests in Manaus, Amazonas, Brazil. In V Congresso FlorestalNacional: A Floresta e as Gentes; Actas das Comunicações–Inventário, Modelação e Gestão: Viseu, Portugal, 2005; pp. 1–12. [Google Scholar]
- Higuchi, N.; Dos Santos, J.; Ribeiro, R.J.; Freitas, J.V.; Vieira, G.; Cornic, A. Crescimento e Incremento de Uma Floresta Amazônica de Terra-Firme Manejada Experimentalmente; INPA: Manaus, Brazil, 1997; pp. 89–132. [Google Scholar]
- Saito, S.; Sakai, T.; Nakamura, S.; Higuchi, N. Three types of seedling establishments of tree species in an Amazonian terra-firme forest. In Projeto Jacaranda Fase II: Pesquisas Florestais na Amazonia; Higuchi, N., Ed.; INPE: Manaus, Brazil, 2003; pp. 33–41. [Google Scholar]
- Lima, A.J.N.; Teixeira, L.M.; Carneiro, V.M.C.; Santos, J.; Higuchi, N. Biomass stock and structural analysis of a secondary forest in Manaus (AM) region, ten years after clear cutting followed by fire. Acta Amazon. 2007, 37, 49–54. [Google Scholar]
- Vieira, S.; de Camargo, P.B.; Selhorst, D.; da Silva, R.; Hutyra, L.; Chambers, J.Q.; Brown, I.F.; Higuchi, N.; dos Santos, J.; Wofsy, S.C.; et al. Forest structure and carbon dynamics in Amazonian tropical rain forests. Oecologia 2004, 140, 468–479. [Google Scholar] [CrossRef] [PubMed]
- Higuchi, N.; Chambers, J.Q.; Santos, J.; Ribeiro, R.J.; Pinto, A.C.; Silva, R.P.; Rocha, R.M.; Tribuzy, E.S. Carbon balance and dynamics of primary vegetation in the Central Amazon. Floresta 2004, 34, 295–304. [Google Scholar]
- Da Silva, R.P.; dos Santos, J.; Tribuzy, E.S.; Chambers, J.Q.; Nakamura, S.; Higuchi, N. Diameter increment and growth patterns for individual tree growing in Central Amazon, Brazil. For. Ecol. Manag. 2002, 166, 295–301. [Google Scholar] [CrossRef]
- Higuchi, F.G.; Siqueira, J.D.P.; Lima, A.J.N.; Figueiredo, A.; Higuchi, N. The effect of plot size on the precision of the weibull distribution of diameters in the primary forest of the Central Amazon. FLORESTA 2012, 2, 599–606. [Google Scholar] [CrossRef]
- Marengo, J.A.; Nobre, C.A.; Tomasella, J.; Oyama, M.D.; De Oliveira, G.S.; De Oliveira, R.; Camargo, H.; Alves, L.M.; Brown, I.F. The drought of Amazonia in 2005. J. Clim. 2008, 21, 495–516. [Google Scholar] [CrossRef]
- Schneider, U.; Becker, A.; Finger, P.; Meyer-Christoffer, A.; Rudolf, B.; Ziese, M. GPCC Full Data Reanalysis Version 7.0 at 0.5°: Monthly Land-Surface Precipitation from Rain-Gauges Built on GTS-Based and Historic Data; GPCC: Offenbach, Germany, 2015. [Google Scholar]
- Harris, I.; Jones, P.D.; Osborn, T.J.; Lister, D.H. Updated high-resolution grids of monthly climatic observations—The CRU TS3.10 dataset. Int. J. Climatol. 2014, 34, 623–642. [Google Scholar] [CrossRef]
- Sombroek, W. Spatial and temporal patterns of Amazon rainfall—Consequences for the planning of agricultural occupation and the protection of primary forests. Ambio 2001, 30, 388–396. [Google Scholar] [CrossRef] [PubMed]
- Huffman, G.J.; Adler, R.F.; Bolvin, D.T.; Gu, G.J.; Nelkin, E.J.; Bowman, K.P.; Hong, Y.; Stocker, E.F.; Wolff, D.B. The TRMM multisatellite precipitation analysis (TMPA): Quasi-global, multiyear, combined-sensor precipitation estimates at fine scales. J. Hydrometeorol. 2007, 8, 38–55. [Google Scholar] [CrossRef]
- NCEP. National centers for environmental prediction. Available online: http://nomad3.Ncep.Noaa.Gov/ncep_data/ (accessed on 1 December 2016).
- Google Earth Engine Team (GEE). Google Earth Engine: A Planetary-Scale Geospatial Analysis Platform. 2015. Available online: https://earthengine.Google.Com (accessed on 1 December 2015).
- Adams, J.B.; Sabol, D.E.; Kapos, V.; Almeida, R.; Roberts, D.A.; Smith, M.O.; Gillespie, A.R. Classification of multispectral images based on fractions of endmembers—Application to land-cover change in the Brazilian Amazon. Remote Sens. Environ. 1995, 52, 137–154. [Google Scholar] [CrossRef]
- Shimabukuro, Y.E.; Smith, J.A. The least-squares mixing models to generate fraction images derived from remote-sensing multispectral data. IEEE Trans. Geosci. Remote Sens. 1991, 29, 16–20. [Google Scholar] [CrossRef]
- Adams, J.B.; Gillespie, A.R. Remote Sensing of Landscapes with Spectral Images: A Physical Modeling Approach; Cambridge University Press: Cambridge, UK, 2006. [Google Scholar]
- Lu, D.; Batistella, M.; Moran, E.; Mausel, P. Application of spectral mixture analysis to Amazonian land-use and land-cover classification. Int. J. Remote Sens. 2004, 25, 5345–5358. [Google Scholar] [CrossRef]
- Huang, B.Y.; Banzon, V.F.; Freeman, E.; Lawrimore, J.; Liu, W.; Peterson, T.C.; Smith, T.M.; Thorne, P.W.; Woodruff, S.D.; Zhang, H.M. Extended reconstructed sea surface temperature version 4 (ERSST.V4). Part I: Upgrades and intercomparisons. J. Clim. 2015, 28, 911–930. [Google Scholar] [CrossRef]
- NOAA-CPC. National oceanic and atmospheric administration/national weather service/climate prediction center. Historical el niño/ la niña episodes (1950–present). Available online: http://www.Cpc.Ncep.Noaa.Gov/products/analysis_monitoring/ensostuff/ensoyears.Shtml (accessed on 1 December 2016).
- Marengo, J.A.; Tomasella, J.; Soares, W.R.; Alves, L.M.; Nobre, C.A. Extreme climatic events in the Amazon basin climatological and hydrological context of recent floods. Theor. Appl. Climatol. 2012, 107, 73–85. [Google Scholar] [CrossRef]
- Climanalise-INPE. Brazil’s National Institute for Space Research—Climanalise. January 2005. Available online: http://climanalise.Cptec.Inpe.Br./~rclimanl/boletim/# (accessed on 1 December 2016).
- Kodama, Y. Large-scale common features of subtropical precipitation zones (the Baiu Frontal Zone, the SPCZ and the SACZ).1. Characteristics of subtropucal frontal zones. J. Meteorol. Soc. Jpn. 1992, 70, 813–836. [Google Scholar]
- Liebmann, B.; Kiladis, G.N.; Marengo, J.A.; Ambrizzi, T.; Glick, J.D. Submonthly convective variability over South America and the South Atlantic convergence zone. J. Clim. 1999, 12, 1877–1891. [Google Scholar] [CrossRef]
- Kodama, Y. Large-scale common features of subtropical precipitation zones (the Baiu Frontal Zone, the SPCZ and the SACZ). 2. Conditions of the circulations for generate the STCZs. J. Meteorol. Soc. Jpn. 1993, 71, 581–610. [Google Scholar]
- Nunes, A.M.; Silva Dias, M.A.F.; Anselmo, E.M.; Morales, C.A. Severe convection features in the Amazon basin: A TRMM-based 15-year evaluation. Front. Earth Sci. 2016, 4, 37. [Google Scholar] [CrossRef]
- Marengo, J.A.; Liebmann, B.; Grimm, A.M.; Misra, V.; Dias, P.L.S.; Cavalcanti, I.F.A.; Carvalho, L.M.V.; Berbery, E.H.; Ambrizzi, T.; Vera, C.S.; et al. Recent developments on the south American monsoon system. Int. J. Climatol. 2012, 32, 1–21. [Google Scholar] [CrossRef]
- Jones, C.; Carvalho, L.M.V. Active and break phases in the South American monsoon system. J. Clim. 2002, 15, 905–914. [Google Scholar] [CrossRef]
- Zhou, J.Y.; Lau, K.M. Does a monsoon climate exist over South America? J. Clim. 1998, 11, 1020–1040. [Google Scholar] [CrossRef]
- Da Silva, A.E.; Carvalho, L.M.V. Large-scale index for South America monsoon system (LISAM). Atmos. Sci. Lett. 2007, 8, 51–57. [Google Scholar] [CrossRef]
- Liebmann, B.; Mechoso, C.R. The South American monsoon system. In The Global Monsoon System: Research and Forecast, 2nd ed.; Chang, C.P., Ding, Y., Lau, N.C., Johnson, R.H., Wang, B., Yasunari, T., Eds.; World Scientifc Publishing Co. Pte. Ltd.: Singapore, 2011; pp. 137–157. [Google Scholar]
- Carvalho, L.M.V.; Jones, C.; Liebmann, B. The South Atlantic Convergence zone: Intensity, form, persistence, and relationships with intraseasonal to interannual activity and extreme rainfall. J. Clim. 2004, 17, 88–108. [Google Scholar] [CrossRef]
- Robertson, A.W.; Mechoso, C.R. Interannual and interdecadal variability of the South Atlantic convergence zone. Mon. Weather Rev. 2000, 128, 2947–2957. [Google Scholar] [CrossRef]
- Carvalho, L.M.V.; Jones, C.; Liebmann, B. Extreme precipitation events in southeastern South America and large-scale convective patterns in the South Atlantic convergence zone. J. Clim. 2002, 15, 2377–2394. [Google Scholar] [CrossRef]
- Anagnostou, E.N.; Morales, C.A. Rainfall estimation from TOGA radar observations during LBA field campaign. J. Geophys. Res. Atmos. 2002, 107, LBA 35-1–LBA 35-14. [Google Scholar] [CrossRef]
- Albrecht, R.I.; Morales, C.A.; Dias, M. Electrification of precipitating systems over the Amazon: Physical processes of thunderstorm development. J. Geophys. Res. Atmos. 2011, 116. [Google Scholar] [CrossRef]
- Weisman, M.L.; Klemp, J.B. The dependence of numerically simulated convective storms on vertical wind shear and buoyancy. Mon. Weather Rev. 1982, 110, 504–520. [Google Scholar] [CrossRef]
- Rotunno, R.; Klemp, J.B. The influence of the shear-induced pressure-gradient on thunderstorm motion. Mon. Weather Rev. 1982, 110, 136–151. [Google Scholar] [CrossRef]
- Bennetts, D.A.; Hoskins, B.J. Conditional symmetric instability—Possible explanation for frontal rainbands. Q. J. R. Meteorol. Soc. 1979, 105, 945–962. [Google Scholar] [CrossRef]
- Emanuel, K.A. The lagrangian parcel dynamics of moist symmetric instability. J. Atmos. Sci. 1983, 40, 2368–2376. [Google Scholar] [CrossRef]
- Emanuel, K. Inertial instability and mesoscale convective systems. 1. Linear-theory of inertial instability in rotating viscous fluids. J. Atmos. Sci. 1979, 36, 2425–2449. [Google Scholar] [CrossRef]
- Xu, Q. Conditional symmetric instability and mesoscale rainbands. Q. J. R. Meteorol. Soc. 1986, 112, 315–334. [Google Scholar] [CrossRef]
- Emanuel, K. Inertial instability and meososcale convective systems. 2. Symmetric cisk in a baroclinic flow. J. Atmos. Sci. 1982, 39, 1080–1097. [Google Scholar]
- Hou, A.Y.; Kakar, R.K.; Neeck, S.; Azarbarzin, A.A.; Kummerow, C.D.; Kojima, M.; Oki, R.; Nakamura, K.; Iguchi, T. The global precipitation measurement mission. Bull. Am. Meteorol. Soc. 2014, 95, 701–722. [Google Scholar] [CrossRef]
- Nobre, C.A.; Obregon, G.; Marengo, J.A.; Fu, R.; Poveda, G. Characteristics of Amazonian climate: Main features. In Amazonia and Global Change; Keller, M., Bustamante, M., Gash, J., Silva Dias, P., Eds.; American Geophysical Union: Washington, DC, USA, 2009; pp. 149–162. [Google Scholar]
- Marengo, J.A.; Espinoza, J.C. Extreme seasonal droughts and floods in Amazonia: Causes, trends and impacts. Int. J. Climatol. 2016, 36, 1033–1050. [Google Scholar] [CrossRef]
- Espinoza Villar, J.C.; Ronchail, J.; Guyot, J.L.; Cochonneau, G.; Naziano, F.; Lavado, W.; De Oliveira, E.; Pombosa, R.; Vauchel, P. Spatio-temporal rainfall variability in the Amazon basin countries (Brazil, Peru, Bolivia, Colombia, and Ecuador). Int. J. Climatol. 2009, 29, 1574–1594. [Google Scholar] [CrossRef]
- Marengo, J.A.; Nobre, C.A.; Betts, R.A.; Cox, P.M.; Sampaio, G.; Salazar, L. Global warming and climate change in Amazonia: Climate-vegetation feedback and impacts on water resources. Amazon. Glob. Chang. 2009, 186, 273–292. [Google Scholar]
- Trumbore, S.; Brando, P.; Hartmann, H. Forest health and global change. Science 2015, 349, 814–818. [Google Scholar] [CrossRef] [PubMed]
- Folha. Rainfall killed 4 and evacuate 1145 in the country. Folha de Sao Paulo, 18 January 2005; C3. [Google Scholar]
- Folha. Rainfall produce damage in three states. Folha de Sao Paulo, 20 January 2005; C3. [Google Scholar]
- Quine, C.P.; Gardiner, B.A. Understanding how the interaction of wind and trees results in windthrow, stem breakage, and canopy gap formation. In Plant Disturbance Ecology. The Process and the Response, 1st ed.; Johnson, E.A., Miyanishi, K., Eds.; Academic Press: Burlington, MA, USA, 2007; pp. 103–155. [Google Scholar]
- Negrón-Juárez, R.I.; Chambers, J.; Hurtt, G.; Annane, B.; Cocke, S.; Powell, M.; Stott, M.; Goosem, S.; Metcalfe, D.; Saatchi, S. Remote sensing assessment of forest disturbance across complex mountainous terrain: The pattern and severity of impacts of tropical cyclone Yasi on Australian rainforests. Remote Sens. 2014, 6, 5633–5649. [Google Scholar] [CrossRef]
- Negrón-Juárez, R.I.; Baker, D.B.; Chambers, J.Q.; Hurtt, G.C.; Goosem, S. Multi-scale sensitivity of landsat and modis to forest disturbance associated with tropical cyclones. Remote Sens. Environ. 2014, 140, 679–689. [Google Scholar] [CrossRef]
- Coder, K.D. Trees and Storm Wind Load; University of Georgia: Athens, GA, USA, 2014; pp. 1–36. [Google Scholar]
- Schindler, D.; Bauhus, J.; Mayer, H. Wind effects on trees. Eur. J. For. Res. 2012, 131, 159–163. [Google Scholar] [CrossRef]
- England, A.H.; Baker, C.J.; Saunderson, S.E.T. A dynamic analysis of windthrow of trees. Forestry 2000, 73, 225–237. [Google Scholar] [CrossRef]
- Malhi, Y.; Davidson, E.A. Biogeochemestry and ecology of terrestrial ecosystem of Amazonia. In Amazonia and Global Change; Keller, M., Bustamante, M., Gash, J., Silva Dias, P., Eds.; American Geophysical Union: Washington, DC, USA, 2009; pp. 293–297. [Google Scholar]
- Davidson, E.A.; de Araujo, A.C.; Artaxo, P.; Balch, J.K.; Brown, I.F.; MM, C.B.; Coe, M.T.; DeFries, R.S.; Keller, M.; Longo, M.; et al. The Amazon basin in transition. Nature 2012, 481, 321–328. [Google Scholar] [CrossRef] [PubMed]
- Negrón-Juárez, R.I.; da Rocha, H.R.; e Figueira, A.M.S.; Goulden, M.L.; Miller, S.D. An improved estimate of leaf area index based on the histogram analysis of hemispherical photographs. Agric. For. Meteorol. 2009, 149, 920–928. [Google Scholar] [CrossRef]
- Saleska, S.; Rocha, H.; Kruijt, B.; Nobre, A. Ecosystem carbon fluxes and Amazonian forest metabolism. In Amazonia and Global Change; Keller, M., Bustamante, M., Gash, J., Silva Dias, P., Eds.; American Geophysical Union: Washington, DC, USA, 2009; pp. 389–407. [Google Scholar]
- Nobre, C.A.; Wickland, D.; Kabat, P. Large scale biosphere-atmosphere experiment in Amazonia (LBA). Glob. Chang. Newsl. 2001, 45, 2–4. [Google Scholar]
- Yoon, J.-H.; Zeng, N. An atlantic influence on Amazon rainfall. Clim. Dyn. 2010, 34, 249–264. [Google Scholar] [CrossRef]
- Ronchail, J.; Cochonneau, G.; Molinier, M.; Guyot, J.L.; Chaves, A.G.D.; Guimaraes, V.; de Oliveira, E. Interannual rainfall variability in the Amazon basin and sea-surface temperatures in the equatorial Pacific and the tropical Atlantic Oceans. Int. J. Climatol. 2002, 22, 1663–1686. [Google Scholar] [CrossRef]


© 2017 by the authors. Licensee MDPI, Basel, Switzerland. This article is an open access article distributed under the terms and conditions of the Creative Commons Attribution (CC BY) license ( http://creativecommons.org/licenses/by/4.0/).
Share and Cite
Negrón-Juárez, R.I.; Jenkins, H.S.; Raupp, C.F.M.; Riley, W.J.; Kueppers, L.M.; Magnabosco Marra, D.; Ribeiro, G.H.P.M.; Monteiro, M.T.F.; Candido, L.A.; Chambers, J.Q.; et al. Windthrow Variability in Central Amazonia. Atmosphere 2017, 8, 28. https://doi.org/10.3390/atmos8020028
Negrón-Juárez RI, Jenkins HS, Raupp CFM, Riley WJ, Kueppers LM, Magnabosco Marra D, Ribeiro GHPM, Monteiro MTF, Candido LA, Chambers JQ, et al. Windthrow Variability in Central Amazonia. Atmosphere. 2017; 8(2):28. https://doi.org/10.3390/atmos8020028
Chicago/Turabian StyleNegrón-Juárez, Robinson I., Hillary S. Jenkins, Carlos F. M. Raupp, William J. Riley, Lara M. Kueppers, Daniel Magnabosco Marra, Gabriel H. P. M. Ribeiro, Maria Terezinha F. Monteiro, Luis A. Candido, Jeffrey Q. Chambers, and et al. 2017. "Windthrow Variability in Central Amazonia" Atmosphere 8, no. 2: 28. https://doi.org/10.3390/atmos8020028
APA StyleNegrón-Juárez, R. I., Jenkins, H. S., Raupp, C. F. M., Riley, W. J., Kueppers, L. M., Magnabosco Marra, D., Ribeiro, G. H. P. M., Monteiro, M. T. F., Candido, L. A., Chambers, J. Q., & Higuchi, N. (2017). Windthrow Variability in Central Amazonia. Atmosphere, 8(2), 28. https://doi.org/10.3390/atmos8020028