Article

A Quantitatively Operational Judging Method for the Process of Large Regional Heavy Haze Event Based on Satellite Remote Sensing and Numerical Simulations

Satellite Environment Center, Ministry of Environmental Protection, State Environmental Protection Key Laboratory, Beijing 100094, China
*
Authors to whom correspondence should be addressed.
Atmosphere 2017, 8(11), 222; https://doi.org/10.3390/atmos8110222
Submission received: 13 September 2017 / Revised: 26 October 2017 / Accepted: 7 November 2017 / Published: 15 November 2017
(This article belongs to the Special Issue Regional Scale Air Quality Modelling)

Abstract

:
In recent years, large-area heavy haze pollution cases occur frequently in eastern China, especially evident in Beijing-Tianjin-Hebei and the surrounding regions. In order to operationally monitor the process of larger regional heavy haze events, a type of quantitative method based on satellite remote sensing and numerical simulations was first established and applied in multiple heavy haze processes in the research area. First, this study proposed the operational haze aerosol optical depth (HOD) method by combining Terra, Aqua satellite and WRF-NAQPM numerical simulation in haze days. Second, based on the coupled HOD data, we proposed the quantitative method for obtaining the process and severity degree for larger regional heavy haze events. Finally, this study used the method applying it to several typical heavy pollution events which occurred in Beijing-Tianjin-Hebei and its three surrounding provinces in the winter season from 1 November 2015 to 4 January 2016. The validation for HOD retrieval results showed that the couple HOD from this study have good accuracy, the linear correlation coefficient between retrieval HOD and the AERONET Beijing station data reached over 0.8, and the linear correlation coefficient between the retrieval HOD and the regional ground monitoring station PM2.5 data reached over 0.7. The applied results showed that the method in this study is feasible to reflect the whole process of heavy haze events. Analysis of the typical heavy haze pollution events showed that the set of quantitative haze judging method in this study was consistent with the meteorological conditions in haze days also verifying that the method for haze inversion and the process analysis is reliable.

1. Introduction

Beijing-Tianjin-Hebei and the surrounding provinces are the regions with the heaviest haze pollution in eastern China which seriously influences the air quality and poses hard threats to the physical health of the public, thus drawing extensive attention domestic and overseas [1,2]. In order to improve the air quality, the Chinese government has made important arrangements, such as the Air Pollution Prevention and Control Action Plan promulgated by the State Council in September 2013 [3,4].
Haze, also the so-called grey-haze [5,6], is defined by the World Meteorological Organization in meteorological phenomena as large amounts of tiny dry particles suspended in the air, which are hardly visible for the naked eye, and make the sky become turbid, causing the visibility to drop down to 5 km or even lower [7]. The large amounts of tiny dry particles are often composed of fine particulate matter PM2.5 (PM with diameters ≤ 2.5 μm), which is also an index of one of the major pollutants as stipulated in the ambient air quality standard (AAQS) of China [8]. Therefore, the haze is essentially a kind of atmospheric pollution phenomenon caused mainly by fine particulate matter [9,10,11,12,13,14], the haze and heavy haze pollution process is mainly the fine particulate matters pollution process, and the monitoring of haze process is indeed the monitoring of the fine particulate matters pollution process. Now there are about 1436 state-controlled PM2.5 ground-monitoring stations all over China [15]. However, most of the stations are located in and around the cities. Thus, if we want to know the status of haze pollution in the whole regional area, the data from the ground stations is limited. Satellite remote sensing technology and numerical simulations can make up for this deficiency to some extent due to its wide coverage.
Satellite remote sensing technology has been widely applied to monitor the distribution of pollutants in the atmosphere for reasons of the macro, dynamical and objective characteristics they possess; as of the inversion of haze aerosol via satellite remote sensing, domestic and overseas scholars have made some major progress in recent years [16,17,18]; presently a comparatively mature haze remote sensing product is the haze optical depth (HOD), which is obtained by establishing a specific haze aerosol model [19] through modification of original aerosol models on the basis of existing dark object method concerning aerosol optical depth [20,21] or the deep blue algorithm [22,23]. The HOD results from satellite remote sensing are in relatively good accuracy, but they cannot solve the problem of the lack of inversion data when the day is cloudy.
Numerical simulation technology has been widely used to predict the pollutant PM2.5 concentration and also to analyze the process of haze in recent years [24,25] since it is characteristic of high time frequency and good regional coverage, but regarding the accuracy of the pollution source list, the atmospheric field results and its inter physical and chemical mechanism, it has relatively low accuracy. Under normal conditions, its accuracy is 40%, when in heavy pollution days, low estimations often occur. In order to improve its accuracy, some mechanisms are used to obtain some improvement such as the meteorology-chemistry two-way coupled numerical model [26].
In order to obtain relatively high accuracy HOD data with full coverage on a cloudy day, the study first obtained the full coverage HOD with relatively better accuracy by combining remote sensing with numerical simulation. Furthermore, in order to solve the problem of the lack of a quantitative judging method of the process of large regional haze, this study set up a series of quantitative methods to judge the process of large regional haze and heavy haze. In order to validate that the methods proposed in this study are operational, they have been applied in Beijing-Tianjin-Hebei and the surrounding regions during frequently hazy periods from November 2015 to 4 January 2016.
We present data and methods in Section 2, results and discussion in Section 3, and conclusion in Section 4.

2. Data and Methods

2.1. Data Sources

Data sources in this study covered Beijing-Tianjin-Hebei and its three surrounding provinces Shanxi, Henan and Shandong; about 800,000 square kilometers. Data sources in inversion of the haze aerosol optical depth are from MODIS sensors of NASA’s TERRA and AQUA satellites, which pass China at 10:30 a.m. and 1:30 p.m. respectively each day, and can realize the coverage of the whole planet once every day respectively except for the equator and the low-latitude regions. The ground PM2.5 mass concentration data were obtained from the China city air quality real time published platform (http://106.37.208.233:20035/). The meteorological data come from the global 1 degree × 1 degree meteorological field analysis data, FNL (Final Operational Global Analysis) provided by the National Centers For Environmental Prediction [27] of the United States, including some meteorological information such as wind field, humidity and boundary layer height, which is obtained after assimilation of modeling results with ground observation, wireless air sounding, sounding balloon, aircraft and satellite data collected during the past six hours, with the inclusion of meteorological field analysis results of four times (00:00, 06:00, 12:00 and 18:00 UTC) daily.

2.2. Methods

2.2.1. Coupled Method for Retrieval of Haze Aerosol Optical Depth based on Satellite Remote Sensing and Numerical Simulations

The method mainly relies on haze aerosol optical depth (HOD) retrieved from satellite retrieval in non-cloudy areas, when some areas are covered by clouds, use the PM2.5 data from numerical simulations method to obtain HOD to fill in, so the HOD data of the whole area can be got finally.
In order to obtain the same resolution HOD data in our research area, we first used bilinear interpolation to change HOD data in a cloudy area with 5 km or 15 km resolution from numerical simulation models to a 1 km resolution of remote sensing. Then combing the above two results, the whole HOD data with 1 km resolution were obtained for the whole study area.
1. Retrieval of HOD based on Satellite Remote Sensing in Clear Area
The satellite retrieval procedures and methods for retrieval of haze aerosol optical depth in this article include:
First, the multi-band threshold value approach was used to eliminate cloud, clear sky pixels [20]; then FNL meteorological data of the US NCEP were employed to eliminate pixels whose relative humidity is higher than 80%; subsequently, the multi-band threshold value approach was used to identify the haze pixels; finally, the haze aerosol was determined [19], the haze aerosol optical thickness was obtained by utilizing the red band inversion based on the deep blue algorithm [22,23] and the radiation transmission model [28] (Equation (1)).
ρ TOA = ρ 0 ( μ s , μ v , ϕ ) + T ( μ s ) T ( μ v ) r [ 1 r S ]
The above equation is the basic expression of apparent reflectance ρ TOA on the top of atmosphere received by the satellites based on the atmospheric radiation transmission theory under assumption that the surface is Lambert reflector and the ambient air level is uniform; here, μ s = cos θ s , μ v = cos θ v , θ s and θ v are the solar zenith angles and the viewing zenith angles respectively, r is the Lambertian surface reflectance, S is the hemispherical reflectance at the bottom of the atmosphere, T is the atmospheric transmittance, ρ 0 the pathway radiation equivalent reflectivity of the atmosphere and ϕ the relative azimuth angle. Among them, S , ρ 0 and T are three parameters of the atmospheric conditions.
The haze optical depth inversion was actually the first to obtain the correlation of HOD with the three parameters based on the radiation transmission model under the haze aerosol mode and different atmospheric HOD, observation geometric (solar zenith angle, viewing zenith angle and relative azimuth angle) conditions; then a search table was established to carry out the earth-atmosphere decoupling by utilizing the multi-band data for the acquisition of HOD.
In atmospheric remote sensing, AOD is optical depth for aerosol, which includes many aerosol modes, such as continental, maritime, urban and so on. In this article, HOD is optical depth of haze, a specific aerosol mode, which is dominated by fine aerosol particles (the volume fraction of water-soluble is more than 65%) [19]. Therefore, HOD is a specific AOD.
The article makes use of the TEERA and AQUA red spectral band data to do inversion of haze aerosol optical depth, mainly for the purpose of avoiding errors brought by obvious errors from MODIS blue spectral band of the TEERA satellite for its strip effect, which may lead to the incomparability between results of the two satellites of TEERA and AQUA. Surface reflectance data come from historical eight-day integrated surface reflectance products of MODIS, assuming the surface reflectance of the same periods remains stable.
From MOD03 and MYD03 products (Geolocation Data Set), zenith and azimuth angle for solar and viewing are extracted in a 1 km resolution, then the relative azimuth angle is received from solar and viewing azimuth angle [29]. To unify to the angle’s data, the first band (red band) data of MODIS are extracted from MOD02 and MYD02 products (Level-1B Calibrated Geolocation Data Set), in which the resolution is aggregated to 1 km. In MOD03, MYD03, MOD02 and MYD02 products, MOD is for TERRA, and MYD is for AQUA [30].
2. Retrieval of HOD and visibility based on numerical simulations in a cloud coverage area
In numerical simulation modes PM2.5, data has a relatively better accuracy than with other output indexes. Thus, in this study we used the simulation PM2.5 result from WRF-NAQPMS mode to obtain HOD data in a cloud coverage area, where the model data is an effective supplement data source. WRF-NAQPMS are two-way coupled models. In the modes, the NAQPMS (Nested Air Quality Prediction Modeling System) is a three-dimensional system with full physical and chemical processes to describe regional and urban scale atmospheric pollution. Since 1995, NAQPMS has been widely applied in a number of scientific studies and air quality forecast practices. WRF is a type of meteorological model. The meteorological field inputs to WRF-NAQPMS were produced by WRF-ARW V3.5. The WRF-NAQPMS modeling domain includes three nested layer. The resolutions are 45 km, 15 km and 5 km, and the domains cover East Asia, China, and Beijing-Tianjin-Hebei separately. The anthropogenic emission inventory of WRF-NAQPMS in this study is MIX from Tsinghua University which support the Model Inter-Comparison Study for Asia (MICS-Asia) and the Task Force on Hemispheric Transport of Air Pollution (TF HTAP) projects, with monthly gridded emissions in 2010 at a spatial resolution of 0.25 ° × 0.25 ° [26]. For the improvement of the atmospheric conditions, the PM2.5 simulation results from WRF +NAQPMS obtain higher accuracy than the normal numerical simulation method [31].
In this study, first we selected the simulation mean results of PM2.5 mass concentration with the same resolution as WRF-NAQPMS models between 10:00 a.m. and 14:00 p.m. when TERRA and AQUA passed while some areas were covered by clouds in our research scope. Then we obtained the visibility data with linear interpolation method according to the level relationship between PM2.5 pollution level and haze severity degree in this study. Section 2.2.2 describes which are light pollution ((75 μg/m3 < PM2.5 ≤ 115 μg/m3) corresponds to light haze (3 km < visibility ≤ 5 km)), moderate pollution ((115 μg/m3 < PM2.5 ≤ 150 μg/m3) corresponds to middle haze (2 km < visibility ≤ 3 km)), heavy pollution and above ((PM2.5 > 250 μg/m3) corresponds to heavy haze (visibility ≤ 2 km)). Finally, by Equations (2) and (3) from Section 2.2.2 in this study, we got the HOD data with the same resolution as models in cloud areas.

2.2.2. Quantitative Judging Method for the Process of Large Regional Heavy Haze Event

The Definition of Haze and Haze Severity Degree

The definition of haze in this study has referred to the definition of the World Meteorological Organization [7] and standard of the national meteorological industry [32] while taking into account the feasibility and operability of haze remote sensing operational monitoring. Haze in this study is defined as a type of pollution weather phenomenon whose relative humidity is below 80% and horizontal visibility is lower than 5 km. The classification of haze put forward herein has become a routine business operation work of the Satellite Environment Center of the Ministry of Environmental Protection (SEC-MEP).
Specific approaches are first to obtain the visibility in Equation (2) on the basis of haze aerosol optical depth, which is got from Section 2.2.1, and then classify the haze into three grades according to the visibility as follows: light haze (3 km < visibility ≤ 5 km), medium haze (2 km < visibility ≤ 3 km) and heavy haze (visibility ≤ 2 km). The above three haze levels defined in our study were obtained by comprehensively considering the haze definition from WMO [7] and the haze classification level from China Meteorological Administration [32].
The visibility V could be obtained by the Koschmieder equation and the surface extinction coefficient β e [33]:
V = ln ( ε ) β e = 3.912 β e
τ = β e H a
where, ε is natural base, equal to 3.912, the whole layer optical depth of haze aerosol ( τ ) could be obtained from the remote sensing inversion result, and the aerosol elevation ( H a ) from the US FNL meteorological data.

The Definition of the Process of Large Regional Heavy Haze Event

The definition of the process of large regional heavy haze event is based on the judgment method for regional haze and heavy haze day.
(1) Judgment Method for Regional Haze and Heavy Haze Day
The mean area of the hazy in the researched region is calculated by the HOD data acquired both in the morning and in the afternoon; if the mean value of the two times exceeds half of the monitored area on a certain day, then the day is defined as a haze day. If on a hazy day, the area of heavy haze exceeds half of the hazy area or exceeds 1/4 of the researched region's area, then the day is defined as a heavy haze day.
(2) Judgment Method for the Process of Regional Haze Event
If the researched region of haze day has lasted more than three days, then a regional haze process can be defined. If there exist days before the first hazy day when just local haze occurs, which means the haze area is no less than a quarter of the total, the first day of the local haze can be marked as the starting date of the haze process. If there exist days after the last hazy day when just local haze occurs, the last date of the local haze can be marked as the ending day of the haze process. If there exists no day after the last hazy day when just local haze happens, the last haze day is then marked as the ending date of the haze formation process.
(3) Judgment Method for the Process of Regional Heavy Haze Event
If during the haze process, more than half of the hazy days are heavy haze days, it can be defined that there is a regional heavy haze process. The starting date of a heavy haze process is the first day of heavy haze and the ending date of a heavy haze process is the last day of heavy haze.

3. Results and Discussion

3.1. HOD Results Validation

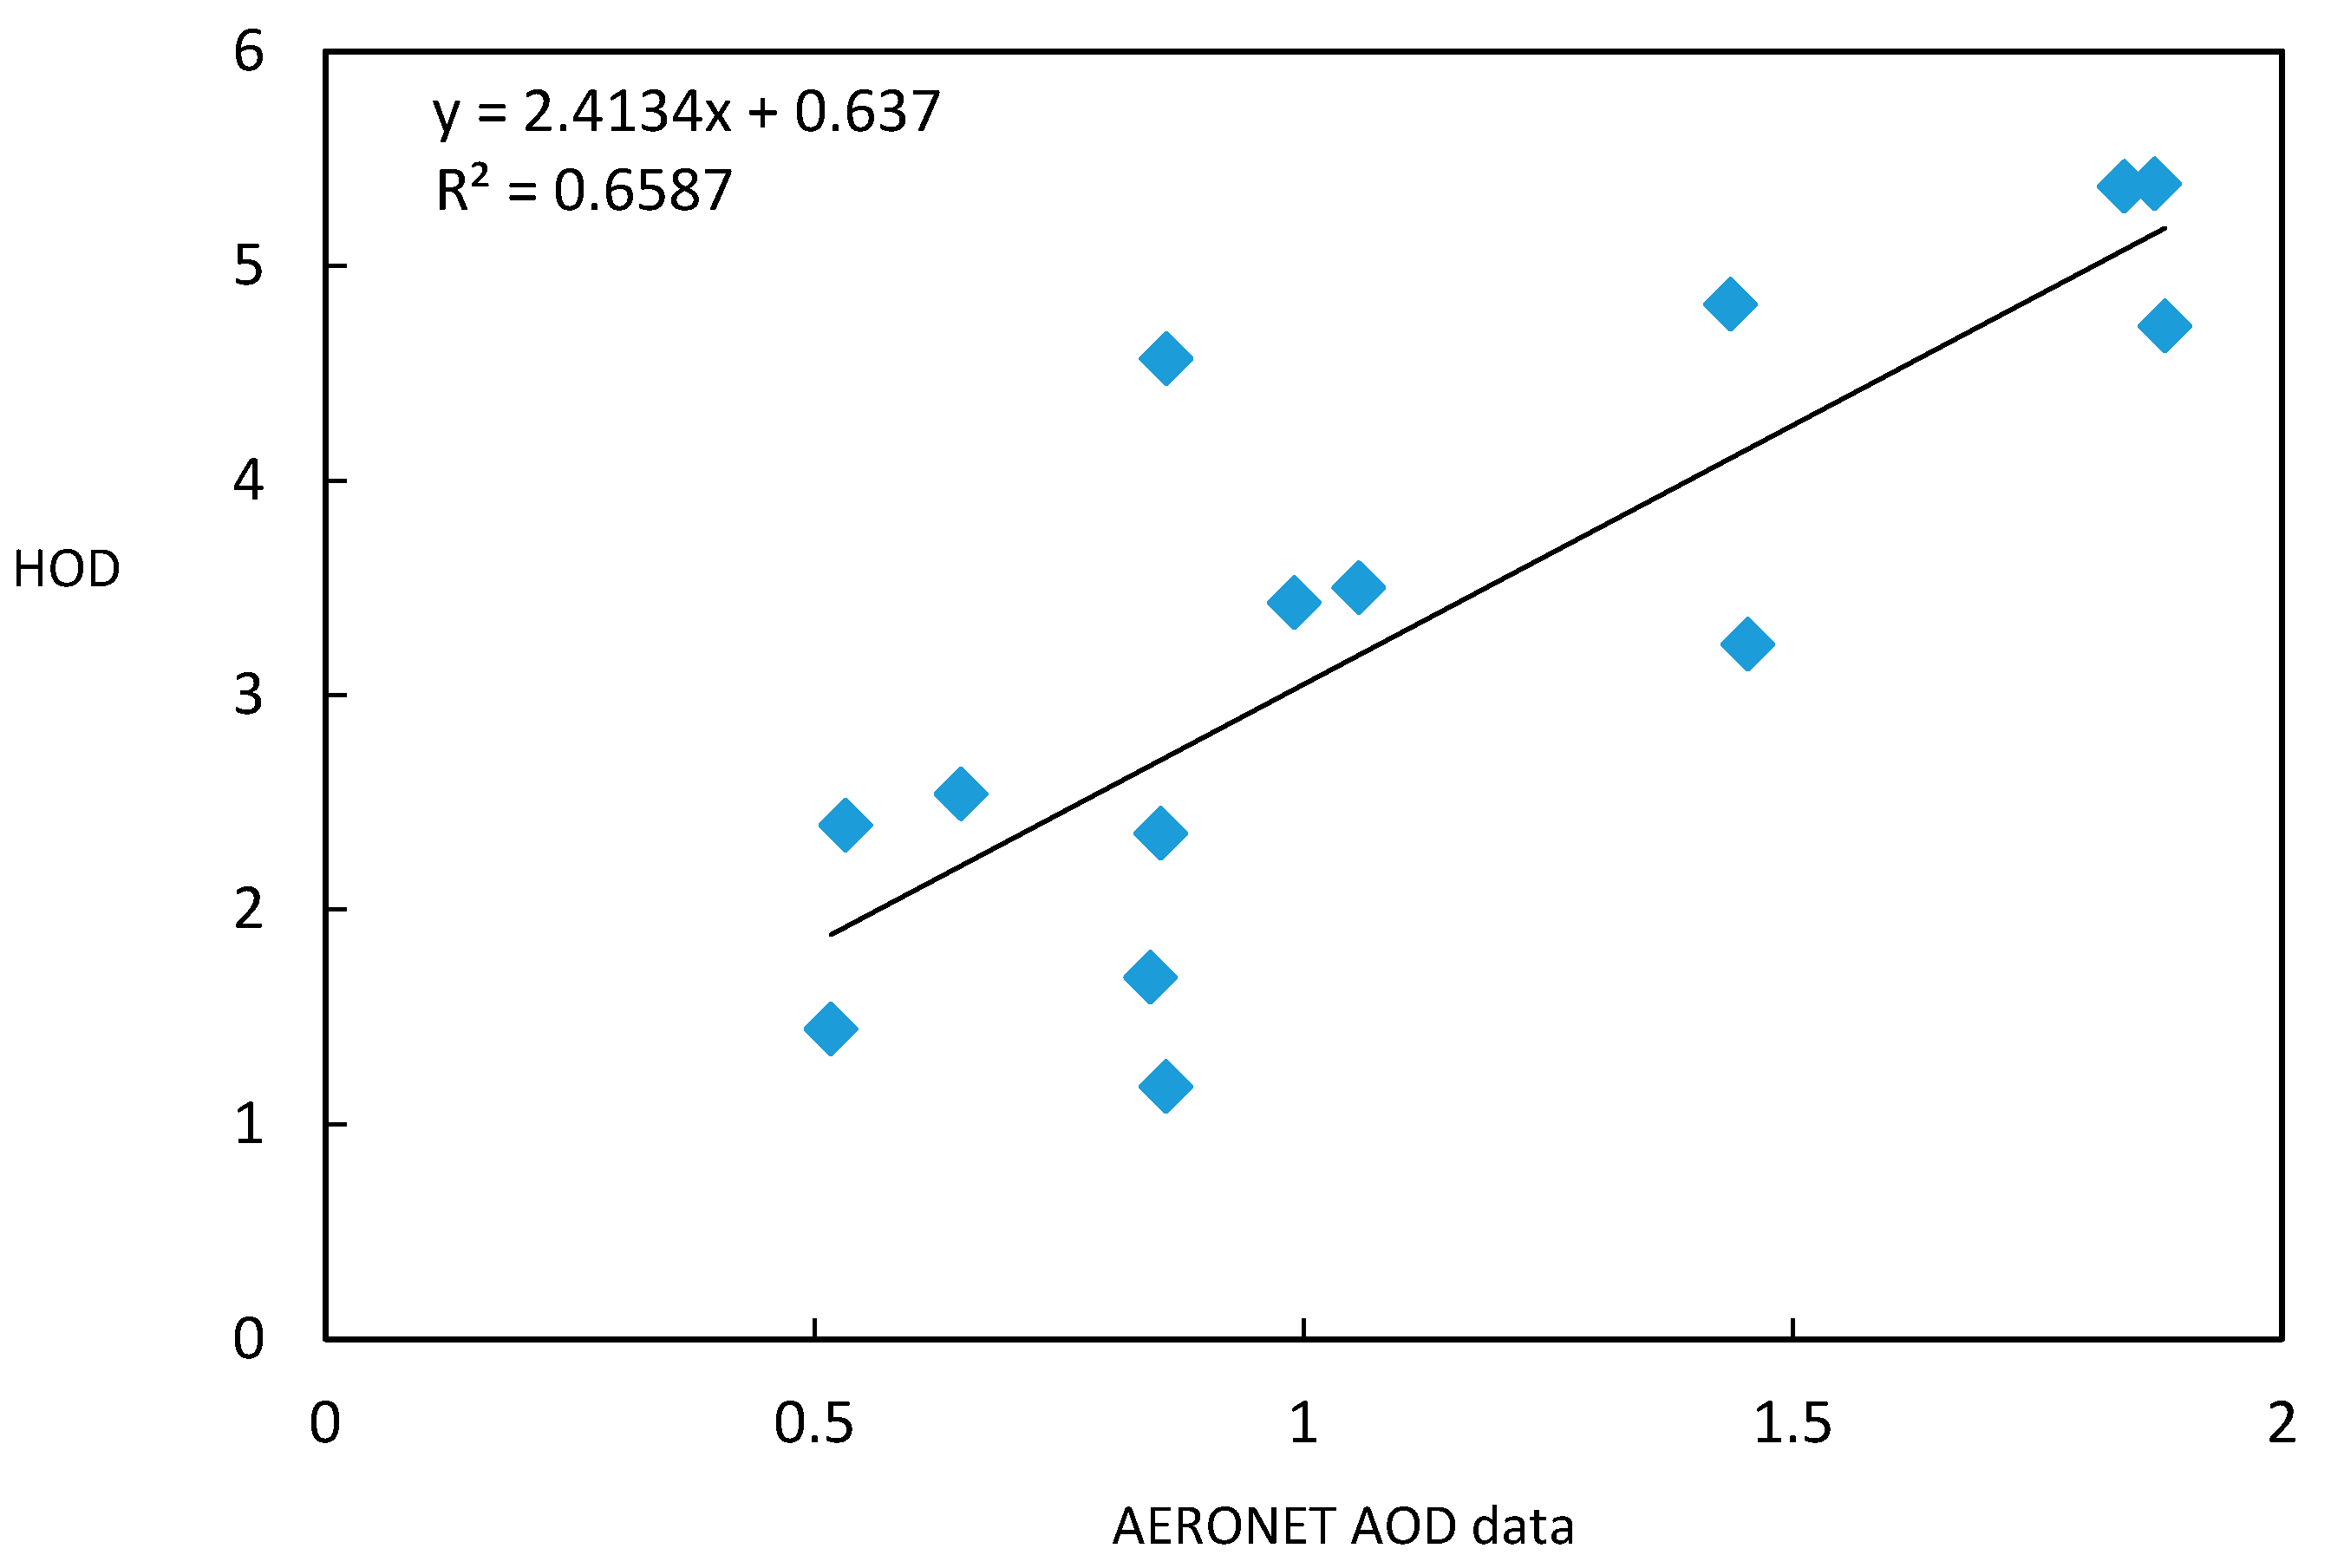
3.1.1. Validation from AERONET AOD Data

In this study, we used the AOD data from AERONET Beijing station from November 2015 to January 2016 as one data source to validate the retrieved HOD results. AERONET (Aerosol Eobotic NETwork) is a ground based aerosol monitoring network, which can provide AOD, Spectral distribution and scattering phase function of aerosol. The HOD data from this study is the AOD in 550 nm, but the AOD from AERONET are from 440 nm, 675 nm, 870 nm, 1020 nm separately, so it needs to use the Angstrom formula τ a ( λ ) = β λ α τ a ( λ ) = β λ α to transform the AERONET AOD data to HOD data in 550 nm. α is Angstrom index, β is atmospheric turbidity coefficient, λ is wavelength.
In order to reduce the instability of the atmosphere, first, the inversion HOD results of the range of 10 km around the AERONET Beijing Station were averaged. Then, the data from AERONET Beijing Station were averaged for half an hour before and after the passing of the satellite. Finally 14 pairs of effective verification data were obtained after the removal of cloud and snow pixels.
It can be seen from the validation results that the inversion HOD results of our algorithm had a good correlation with the ground observations from AERONET in Beijing (Figure 1), the correlation coefficient was greater than 0.8. However, the results obtained by this algorithm were higher than the ground observation results in total, which may result from the satellite signal reaching saturation when the aerosol optical thickness is higher than two.

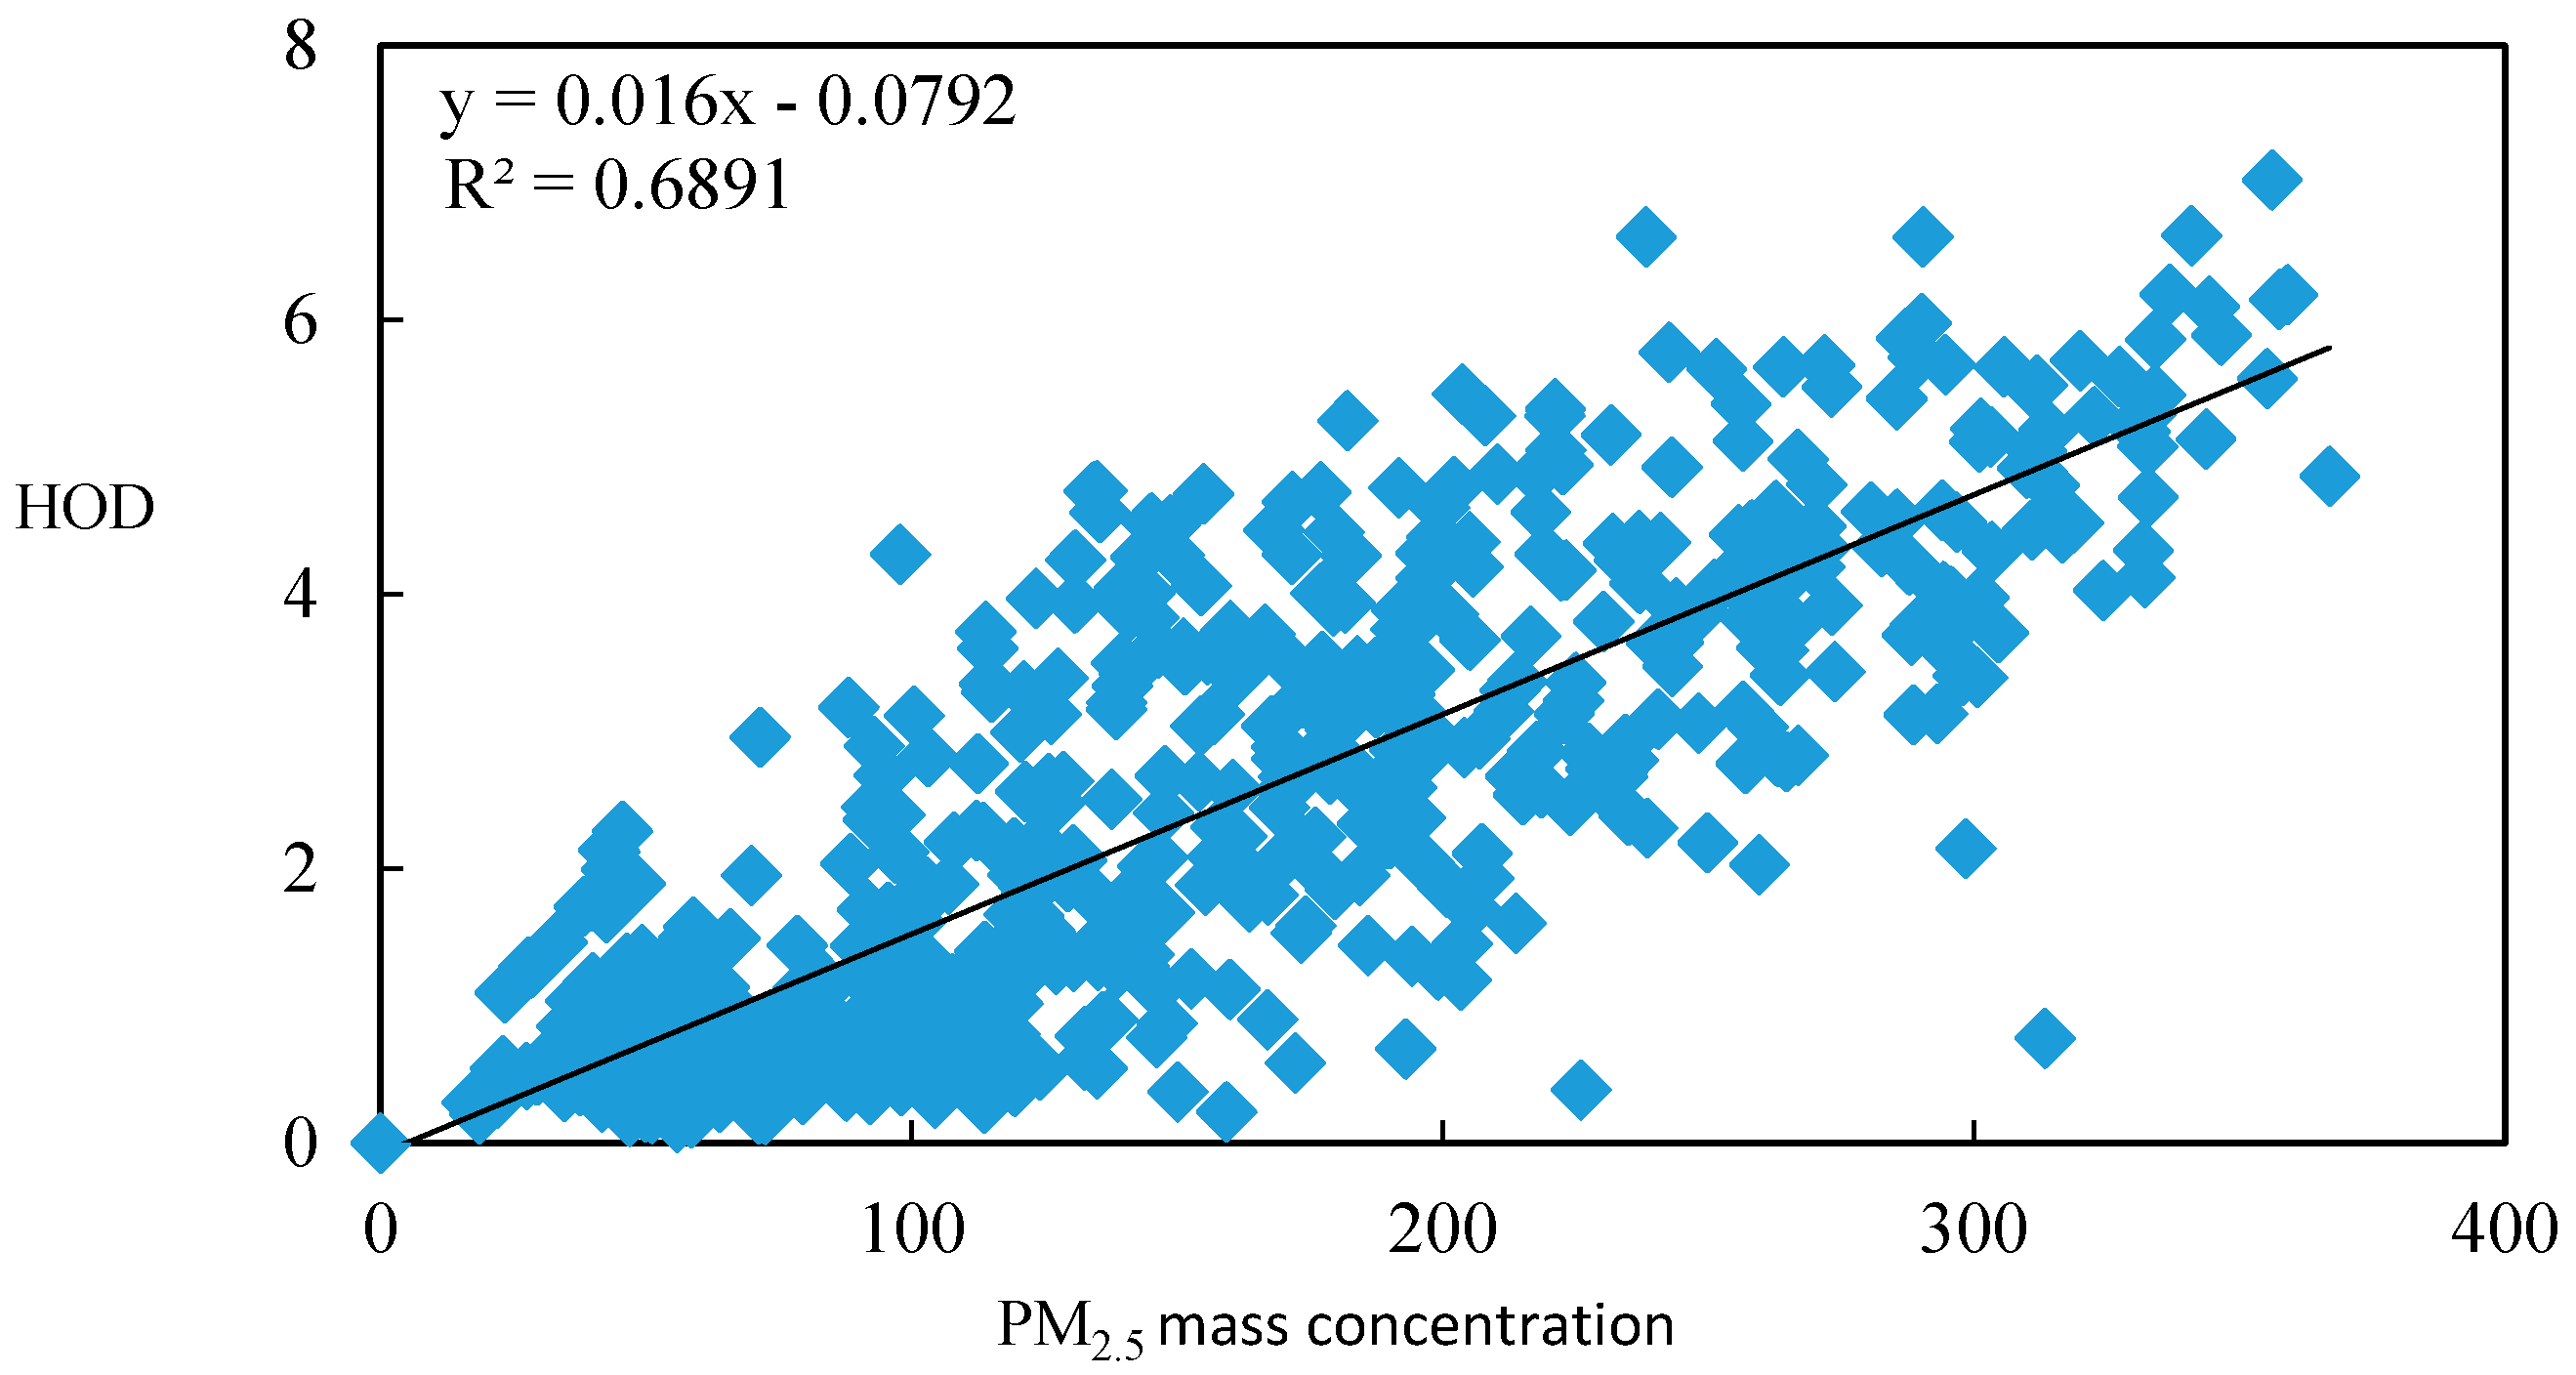
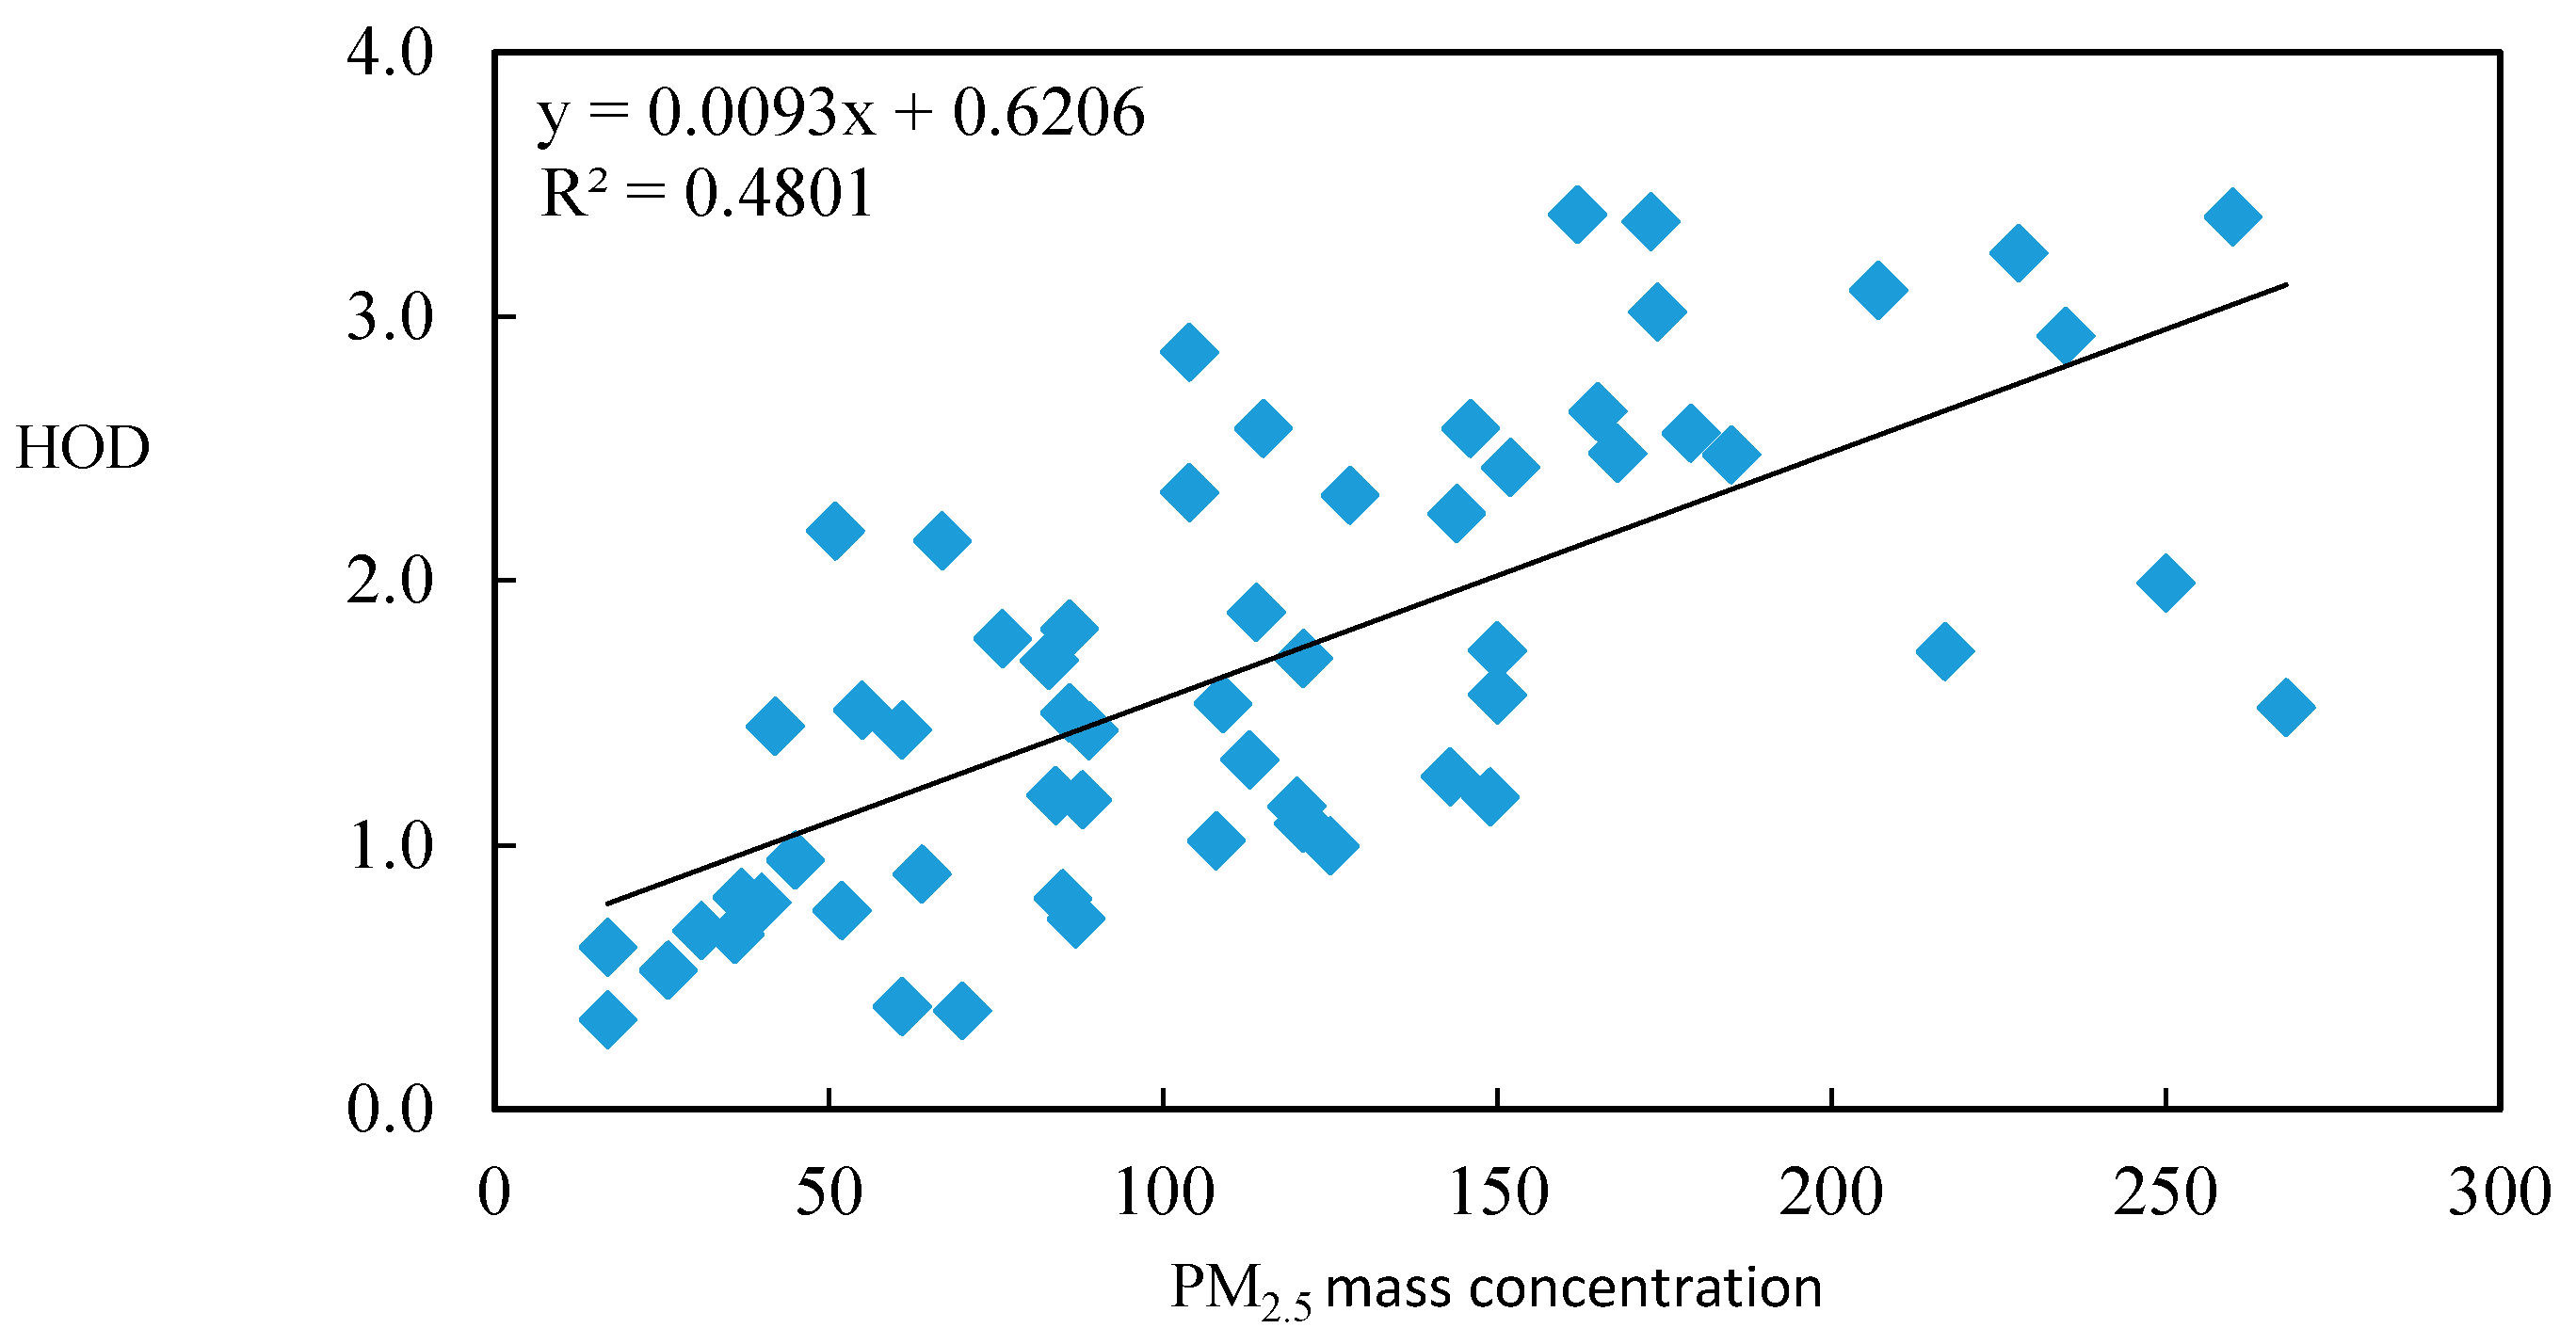
3.1.2. Validation from PM2.5 Mass Concentration Data of the Ground Observation Stations

In this study, we used the PM2.5 mass concentration data from the ground observation stations from November 2015 to January 2016 as the other data source to validate the HOD results from our algorithm. In the study 309 data from the ground observation stations located in Beijing, Tianjin and surrounding three provinces were collected.
In order to reduce the instability of the atmosphere, the inversion HOD results of the range of 10 km around the AERONET Beijing Station were averaged, the PM2.5 data from the ground observation stations were averaged during the time from 10:00 a.m. to 15:00 p.m. at local Beijing time.
First, in order to validate the HOD result in the typical heavy haze process, we took the process from 17 December 2015 to 27 December 2015 as an example, collected the PM2.5 concentration data from 309 ground observation stations in the research area as validation data, and after excluding some invalid data, 651 pairs of validation data were obtained. It can be seen from the validation results that the inversion results of this algorithm had a good correlation with the ground observations, the correlation coefficient was greater than 0.8 (Figure 2).
Then, in order to study the inversion accuracy of the algorithm in a long time series, we selected the HOD data from 1 November 2015 to 4 January 2016 as the research period. After deducting days with less effective data (pixels from remote sensing were less than 15% of the research area), we obtained data of 59 day comparison pairs of area averaged. As can be seen from Figure 3, the correlation between the inversion results of the algorithm and the ground observations was good, but the correlation coefficient was decreased to about 0.7 compared with that from 17 December 2015 to 27 December 2015. This may be due to the haze particle differences in the center of this region during a long time period. In addition, the unclean cloud pixels would also reduce the results accuracy of HOD inversion.

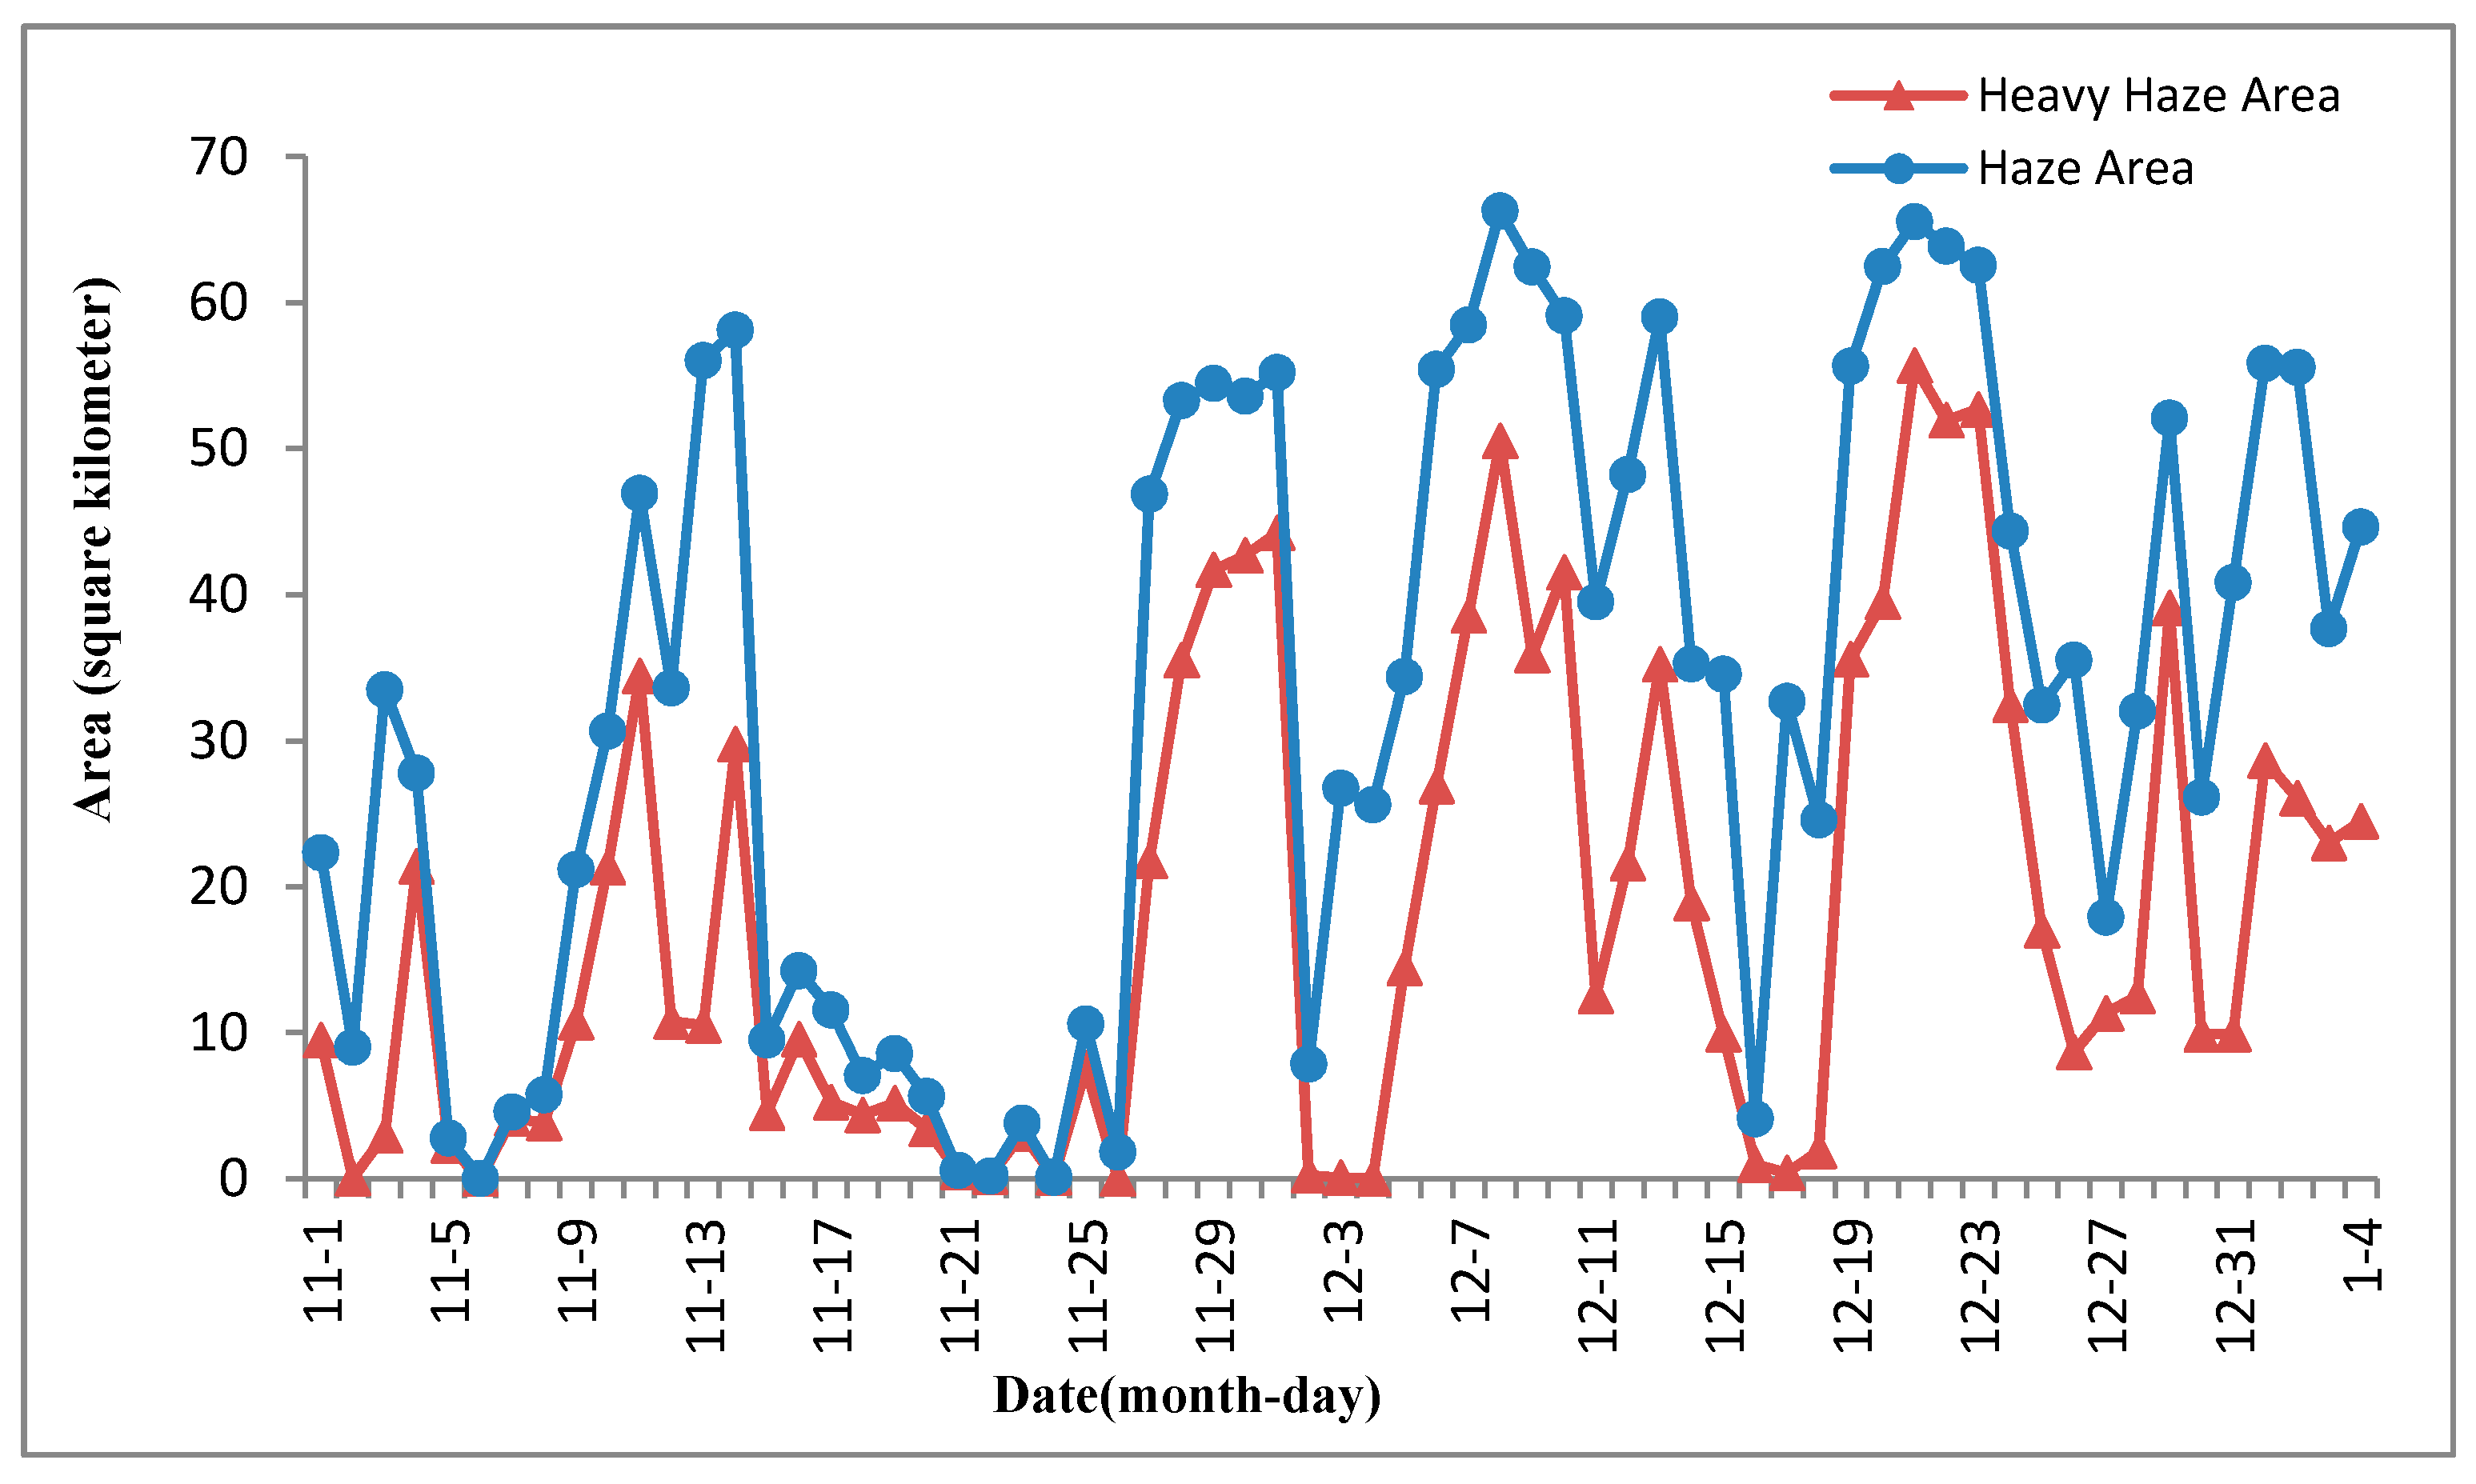
3.2. Analysis of Regional Haze Process in Long-Time Series from November 2015 to 4 January 2015

Based on the results of haze and heavy haze monitored through remote sensing, as well as the above mentioned classification of hazy day, heavy haze day, haze process and heavy haze pollution process, there were altogether five comparatively obvious haze pollution processes in Beijing-Tianjin-Hebei and its surrounding regions during the period of November 2015 to 4 January 2016 (Figure 4), and all results included heavy haze pollution processes, which were from 9 November 2015 to 14 November 2015, from 27 November 2015 to 1 December 2016, from 5 December 2016 to 12 December 2015, from 17 December 2015 to 26 December 2015 and from 28 December 2015 to 4 January 2016. Among these haze processes, the one that occurred from 5 December 2015 to 15 December 2015 was the longest, lasting 11 days, and the one from 17 December 2015 to 26 December 2015 was the heaviest during which the heavy haze lasted six days from 19 December to 24 December, with the average heavy haze area reaching 450,000 km2. The typical haze process from 17 December to 26 December was taken as the specific example to be analyzed in Section 3.3.

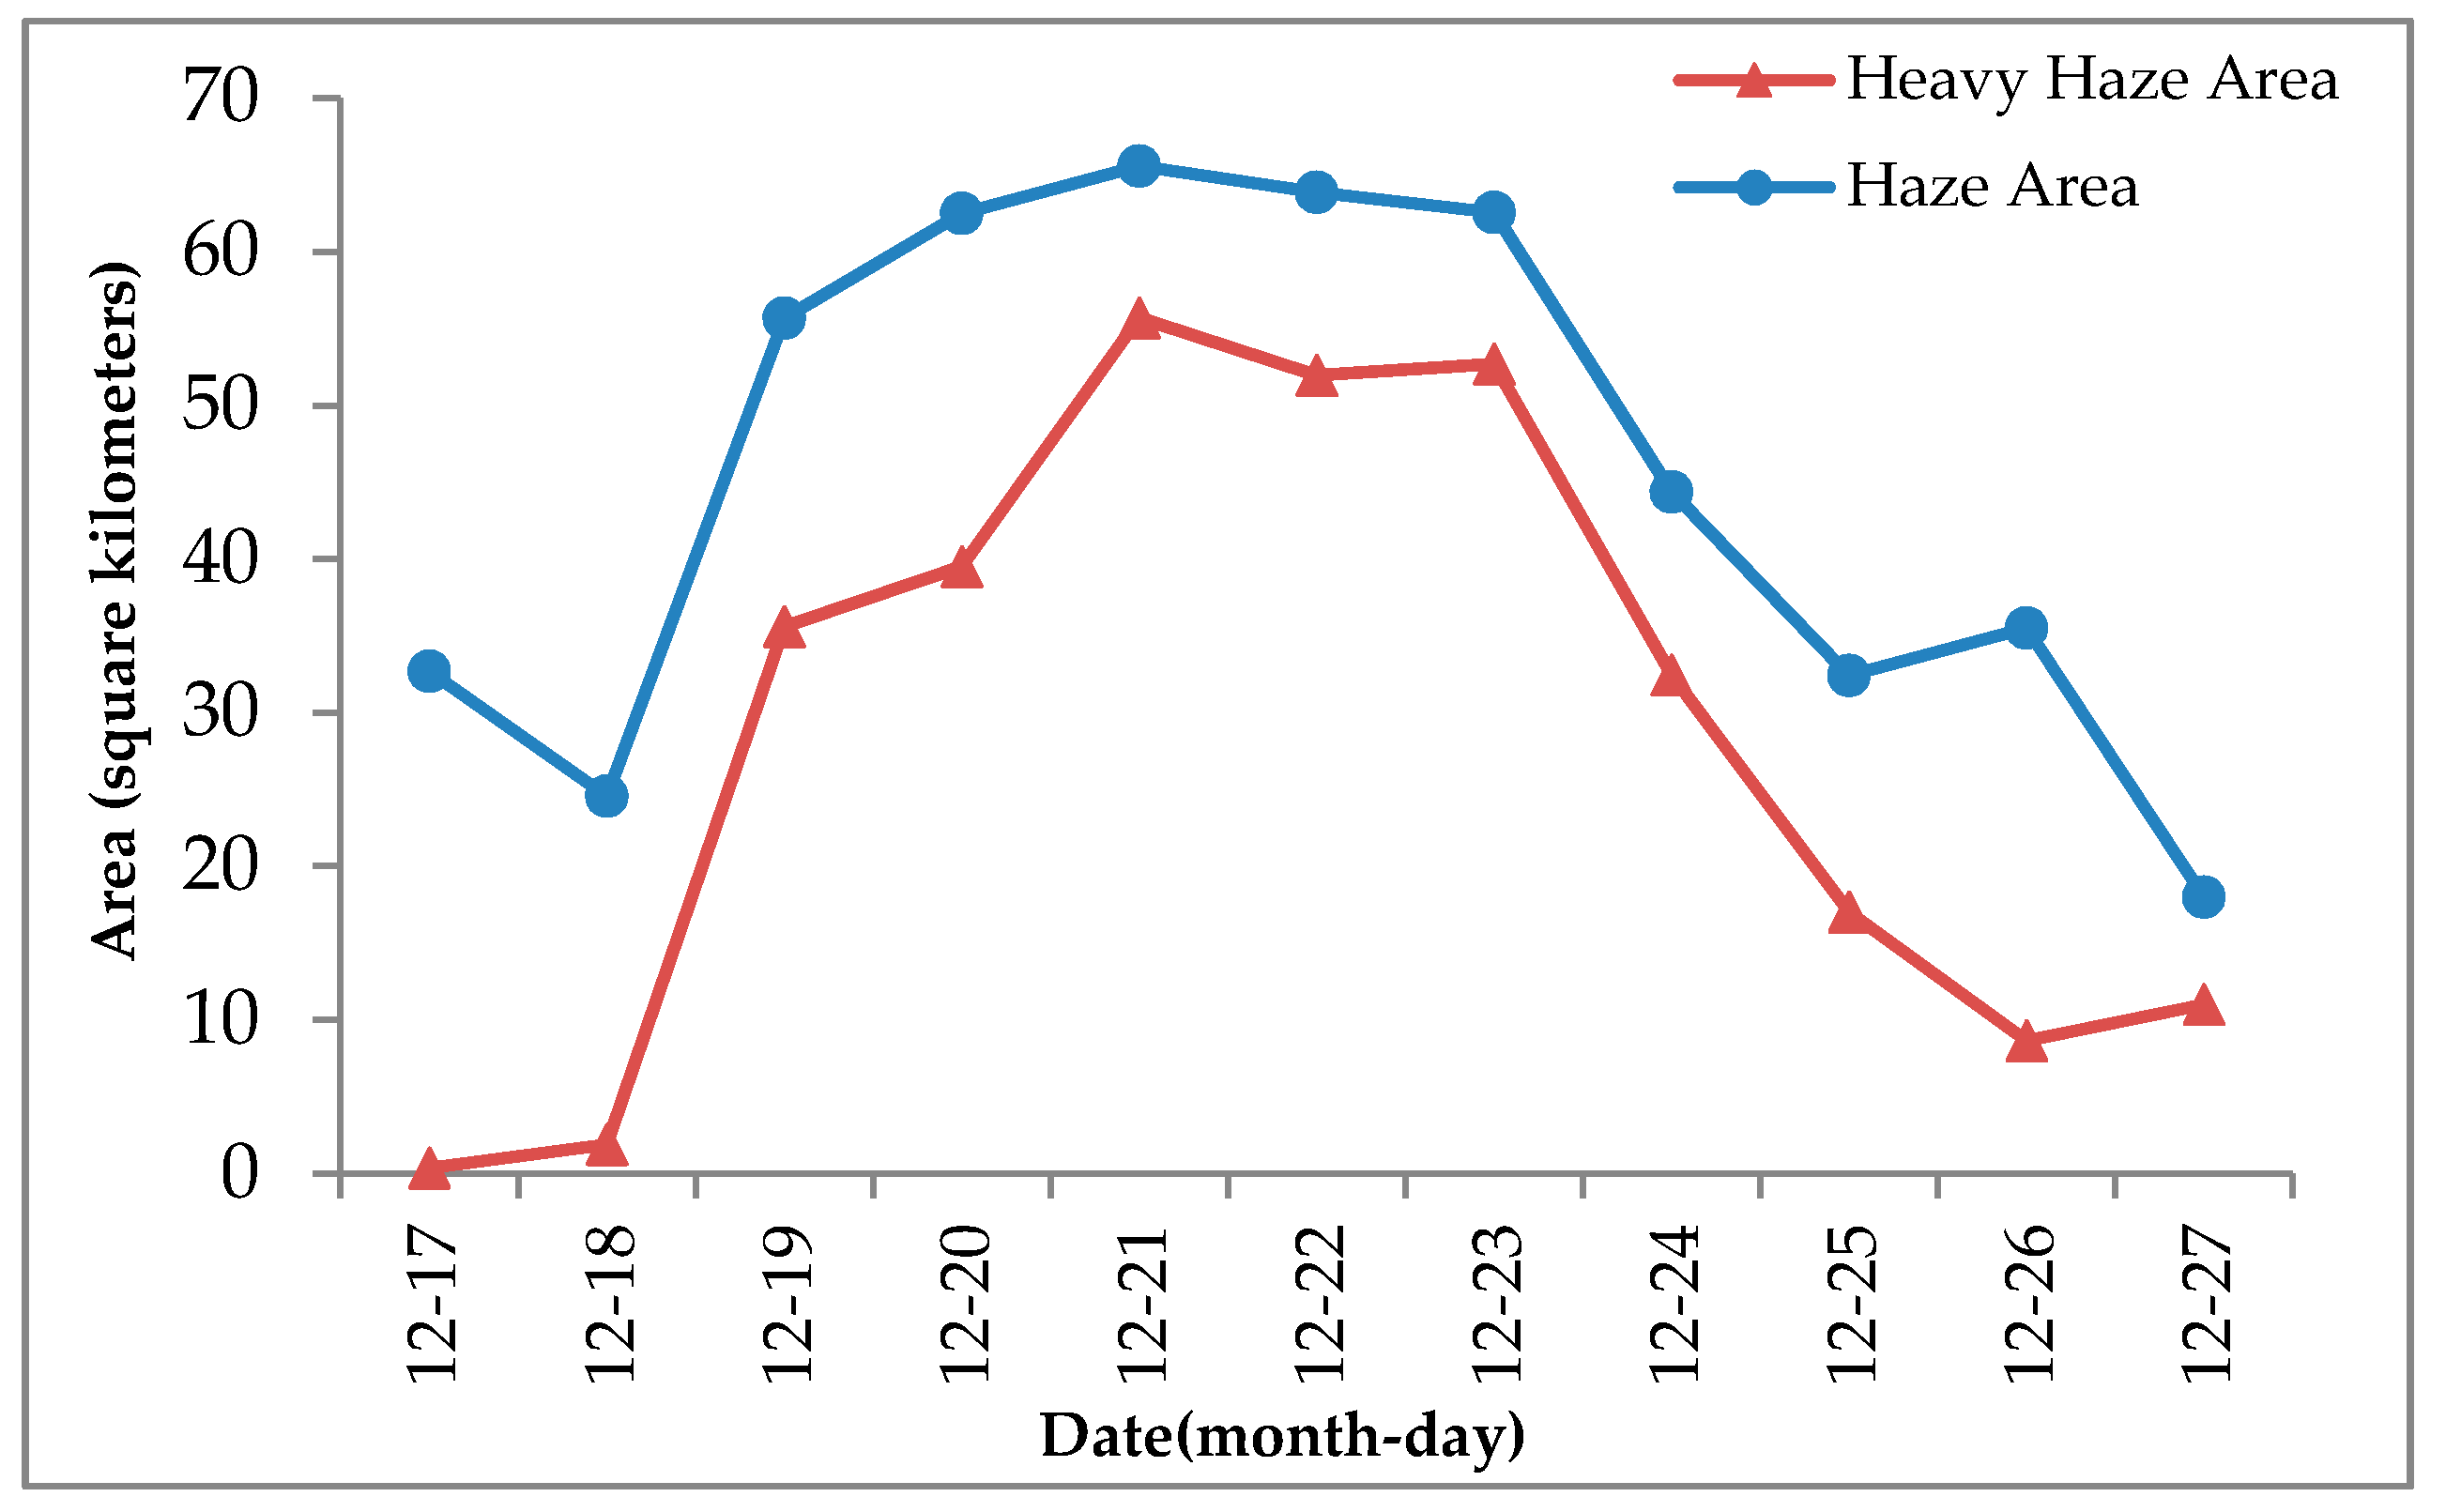
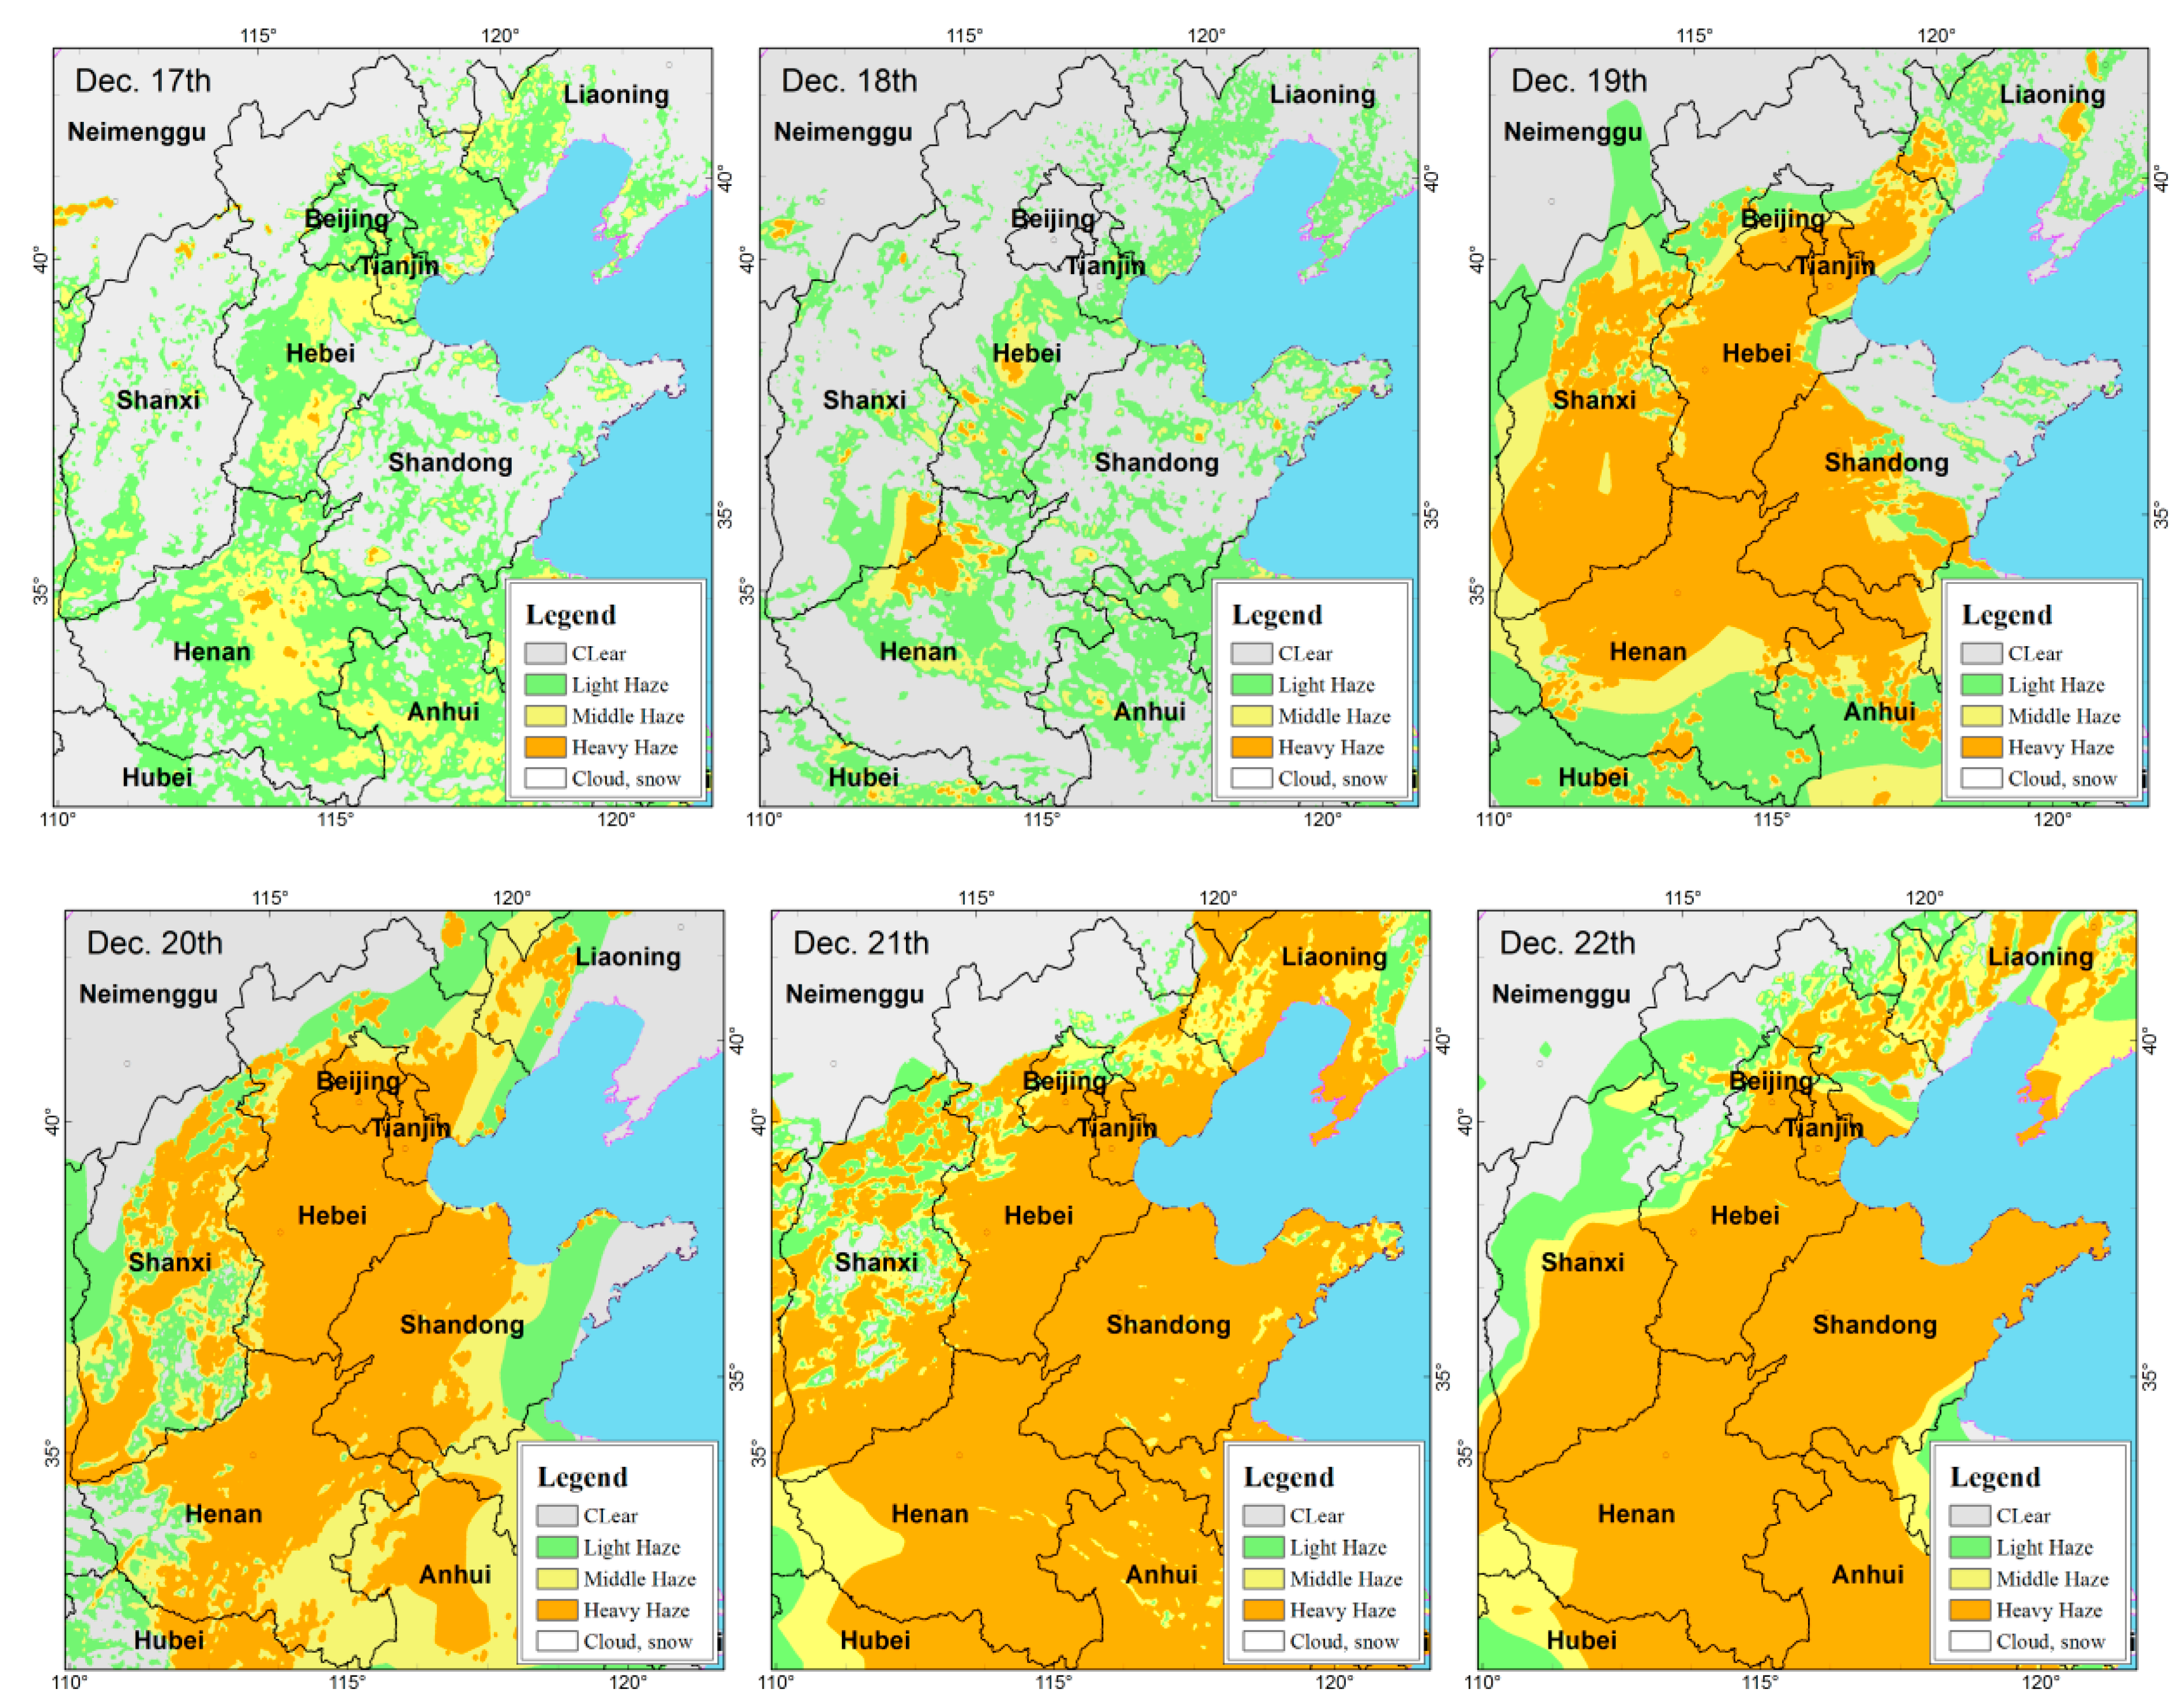
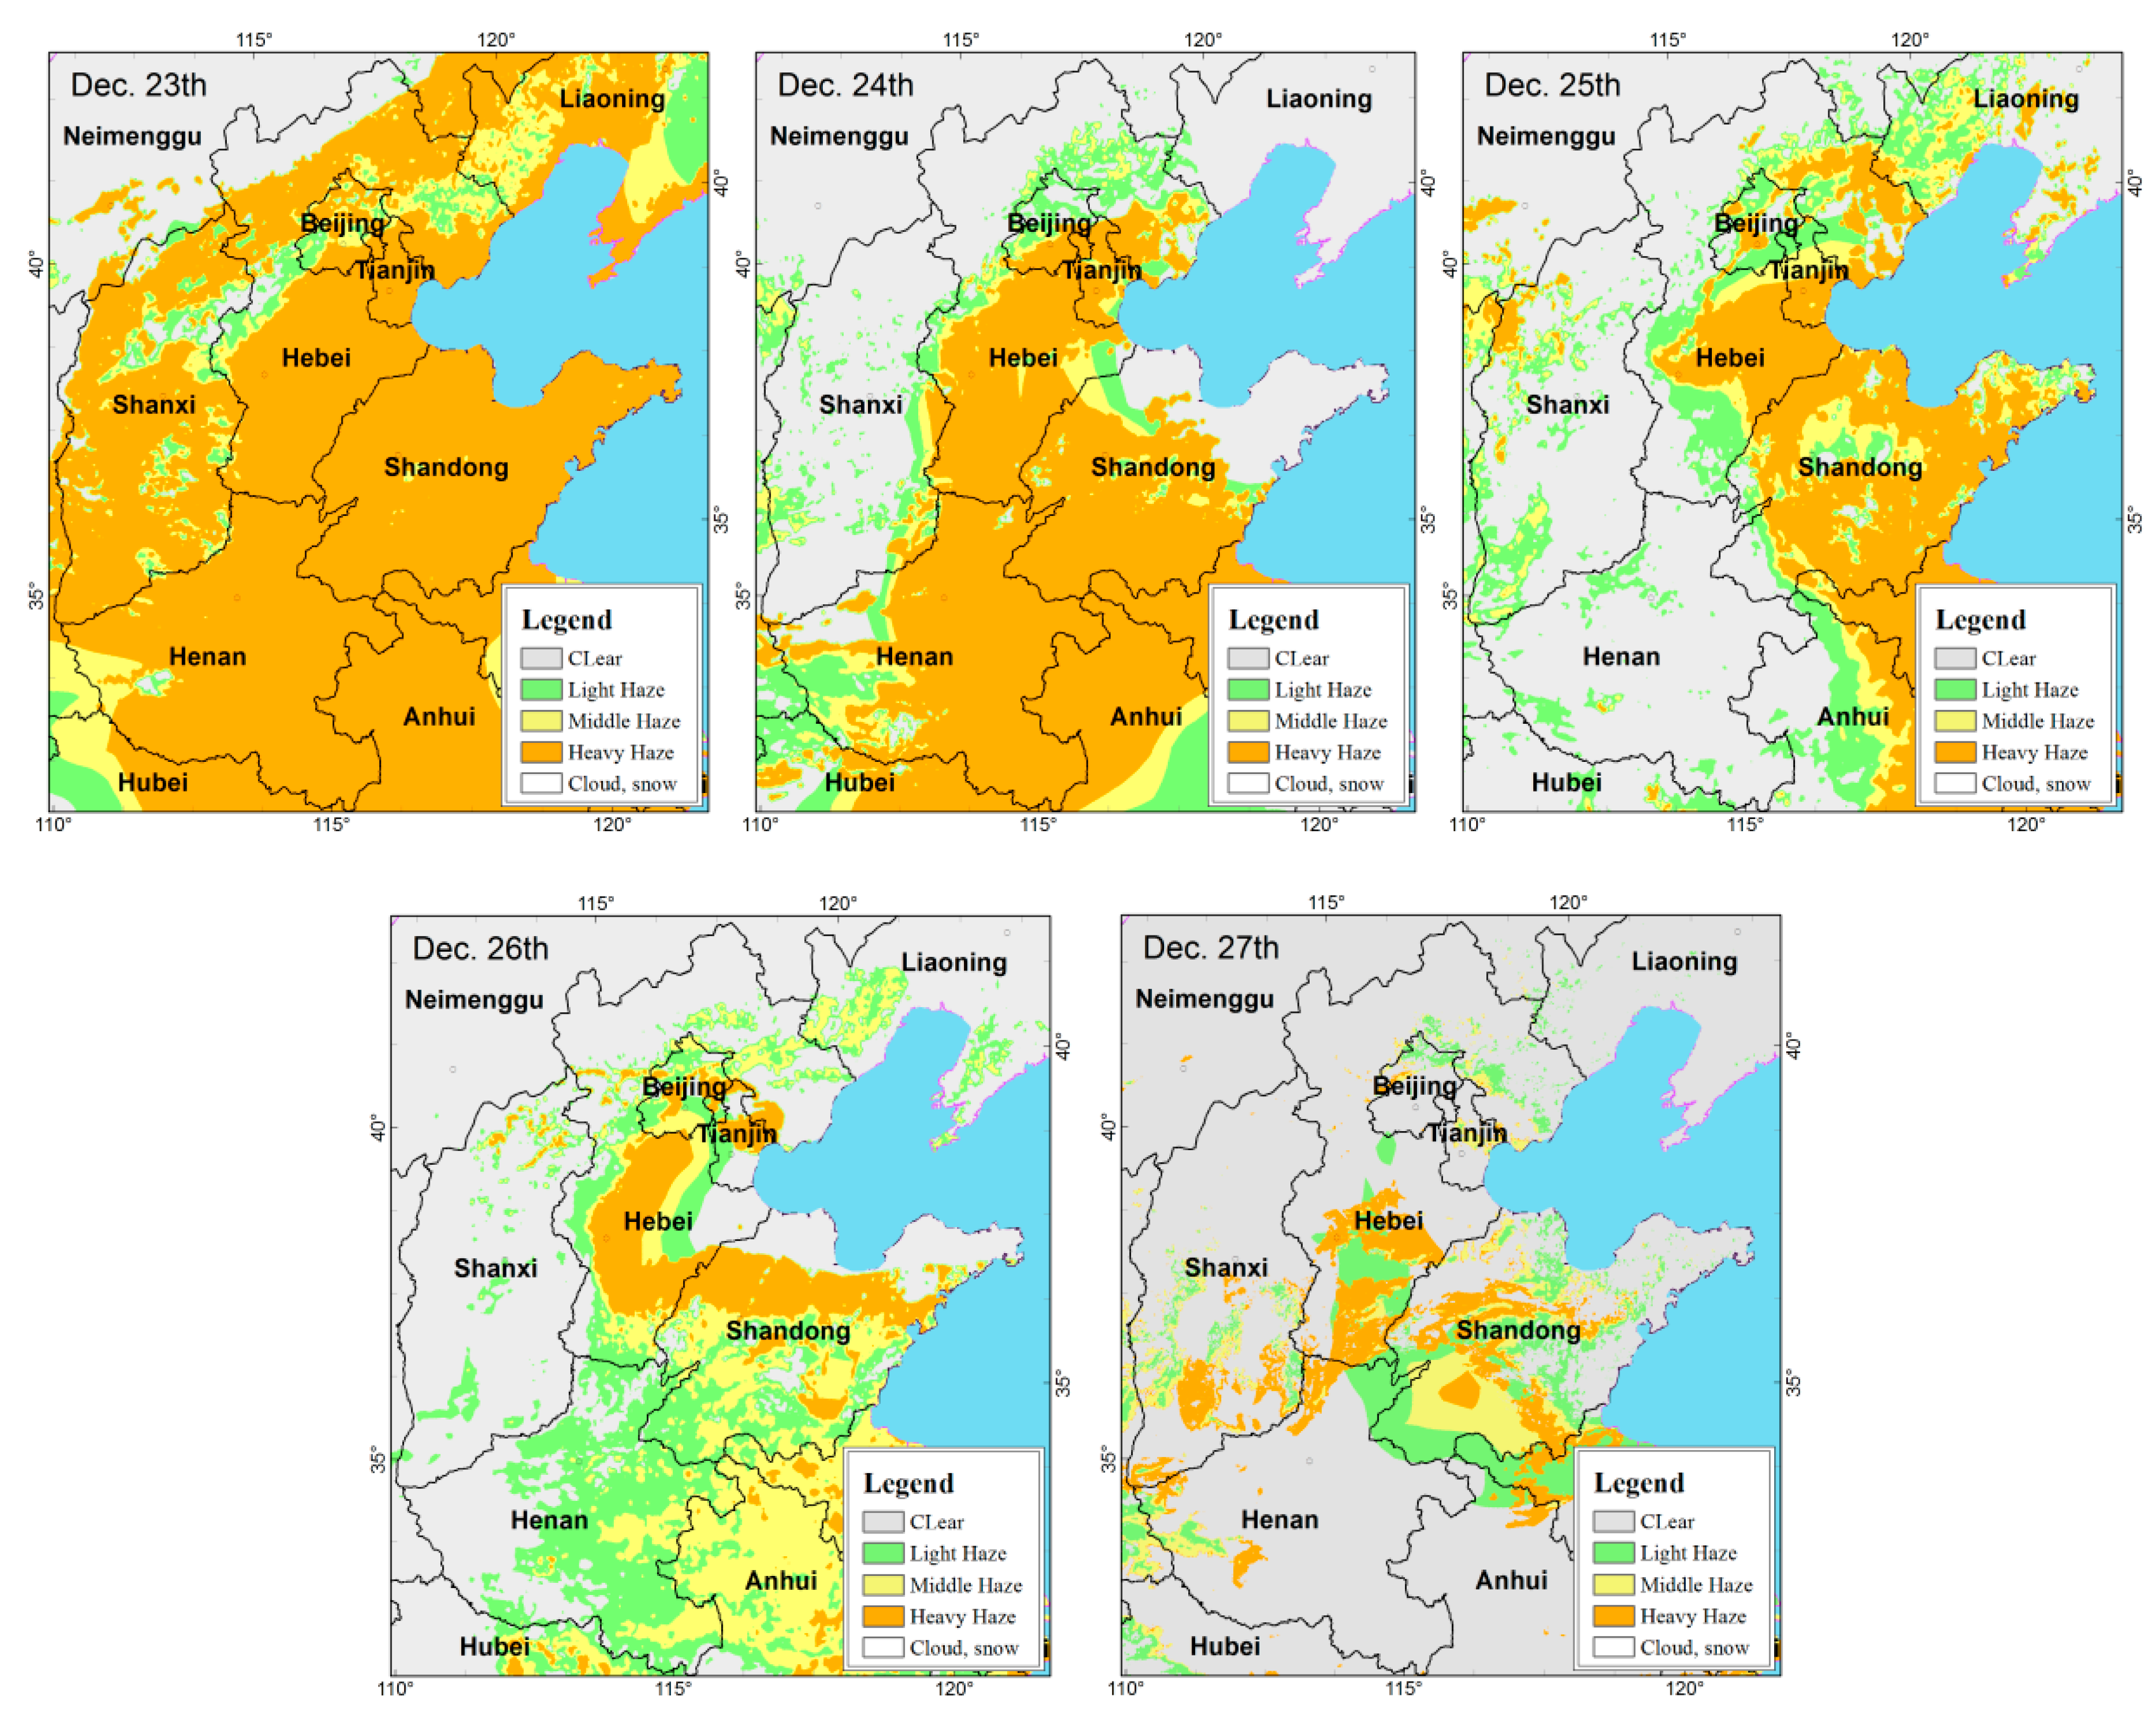
3.3. Analysis of Typical Heavy Haze Process from 19 December 2015 to 24 December 2015

Seen from the whole five haze processes included from November 2015 to 4 January, it is shown that the haze process from 19 December 2015 to 24 December 2015 was a typical heavy haze pollution process. Before the period of the whole haze process, the area of haze on 17 December and 18 December had already reached a certain degree of distribution, it being 330 and 250 km2 respectively, but with the majority being light and medium haze and a small proportion of heavy haze, taking up only 1% and 8% of the total hazy area.
The continuous six days of heavy haze from 19 December 2015 to 24 December 2015 took up more than half of the total hazy days, which can be qualified as a heavy haze pollution process. During this heavy haze period, the total haze area was 440,000–660,000 km2, taking up more than 50% of the total researched region and within 63–94%, and its heavy haze area reached 320,000–560,000 km2, taking up more than half of the total haze area and within 73–85%. During the late haze period on 25, 26 and 27 December 2015, the area of haze dropped to 320,000, 360,000 and 180,000 km2, with the heavy haze areas dropping to 170,000, 90,000 and 110,000 km2, and haze proportion in the total area was less than 25%, showing a gradual end of the whole regional haze pollution process (Figure 5 and Figure 6).
Statistical results showed that the total average areas of daily haze and heavy haze during the period were about 480 and 300,000 km2 respectively, taking up approximately 69% and 43% of the total area of the whole regions; during which the maximum values of the total area of haze and heavy haze were seen on 21 December 2015, it being 660,000 and 560,000 km2 respectively, while taking up 94% and 80% of the total regional area.

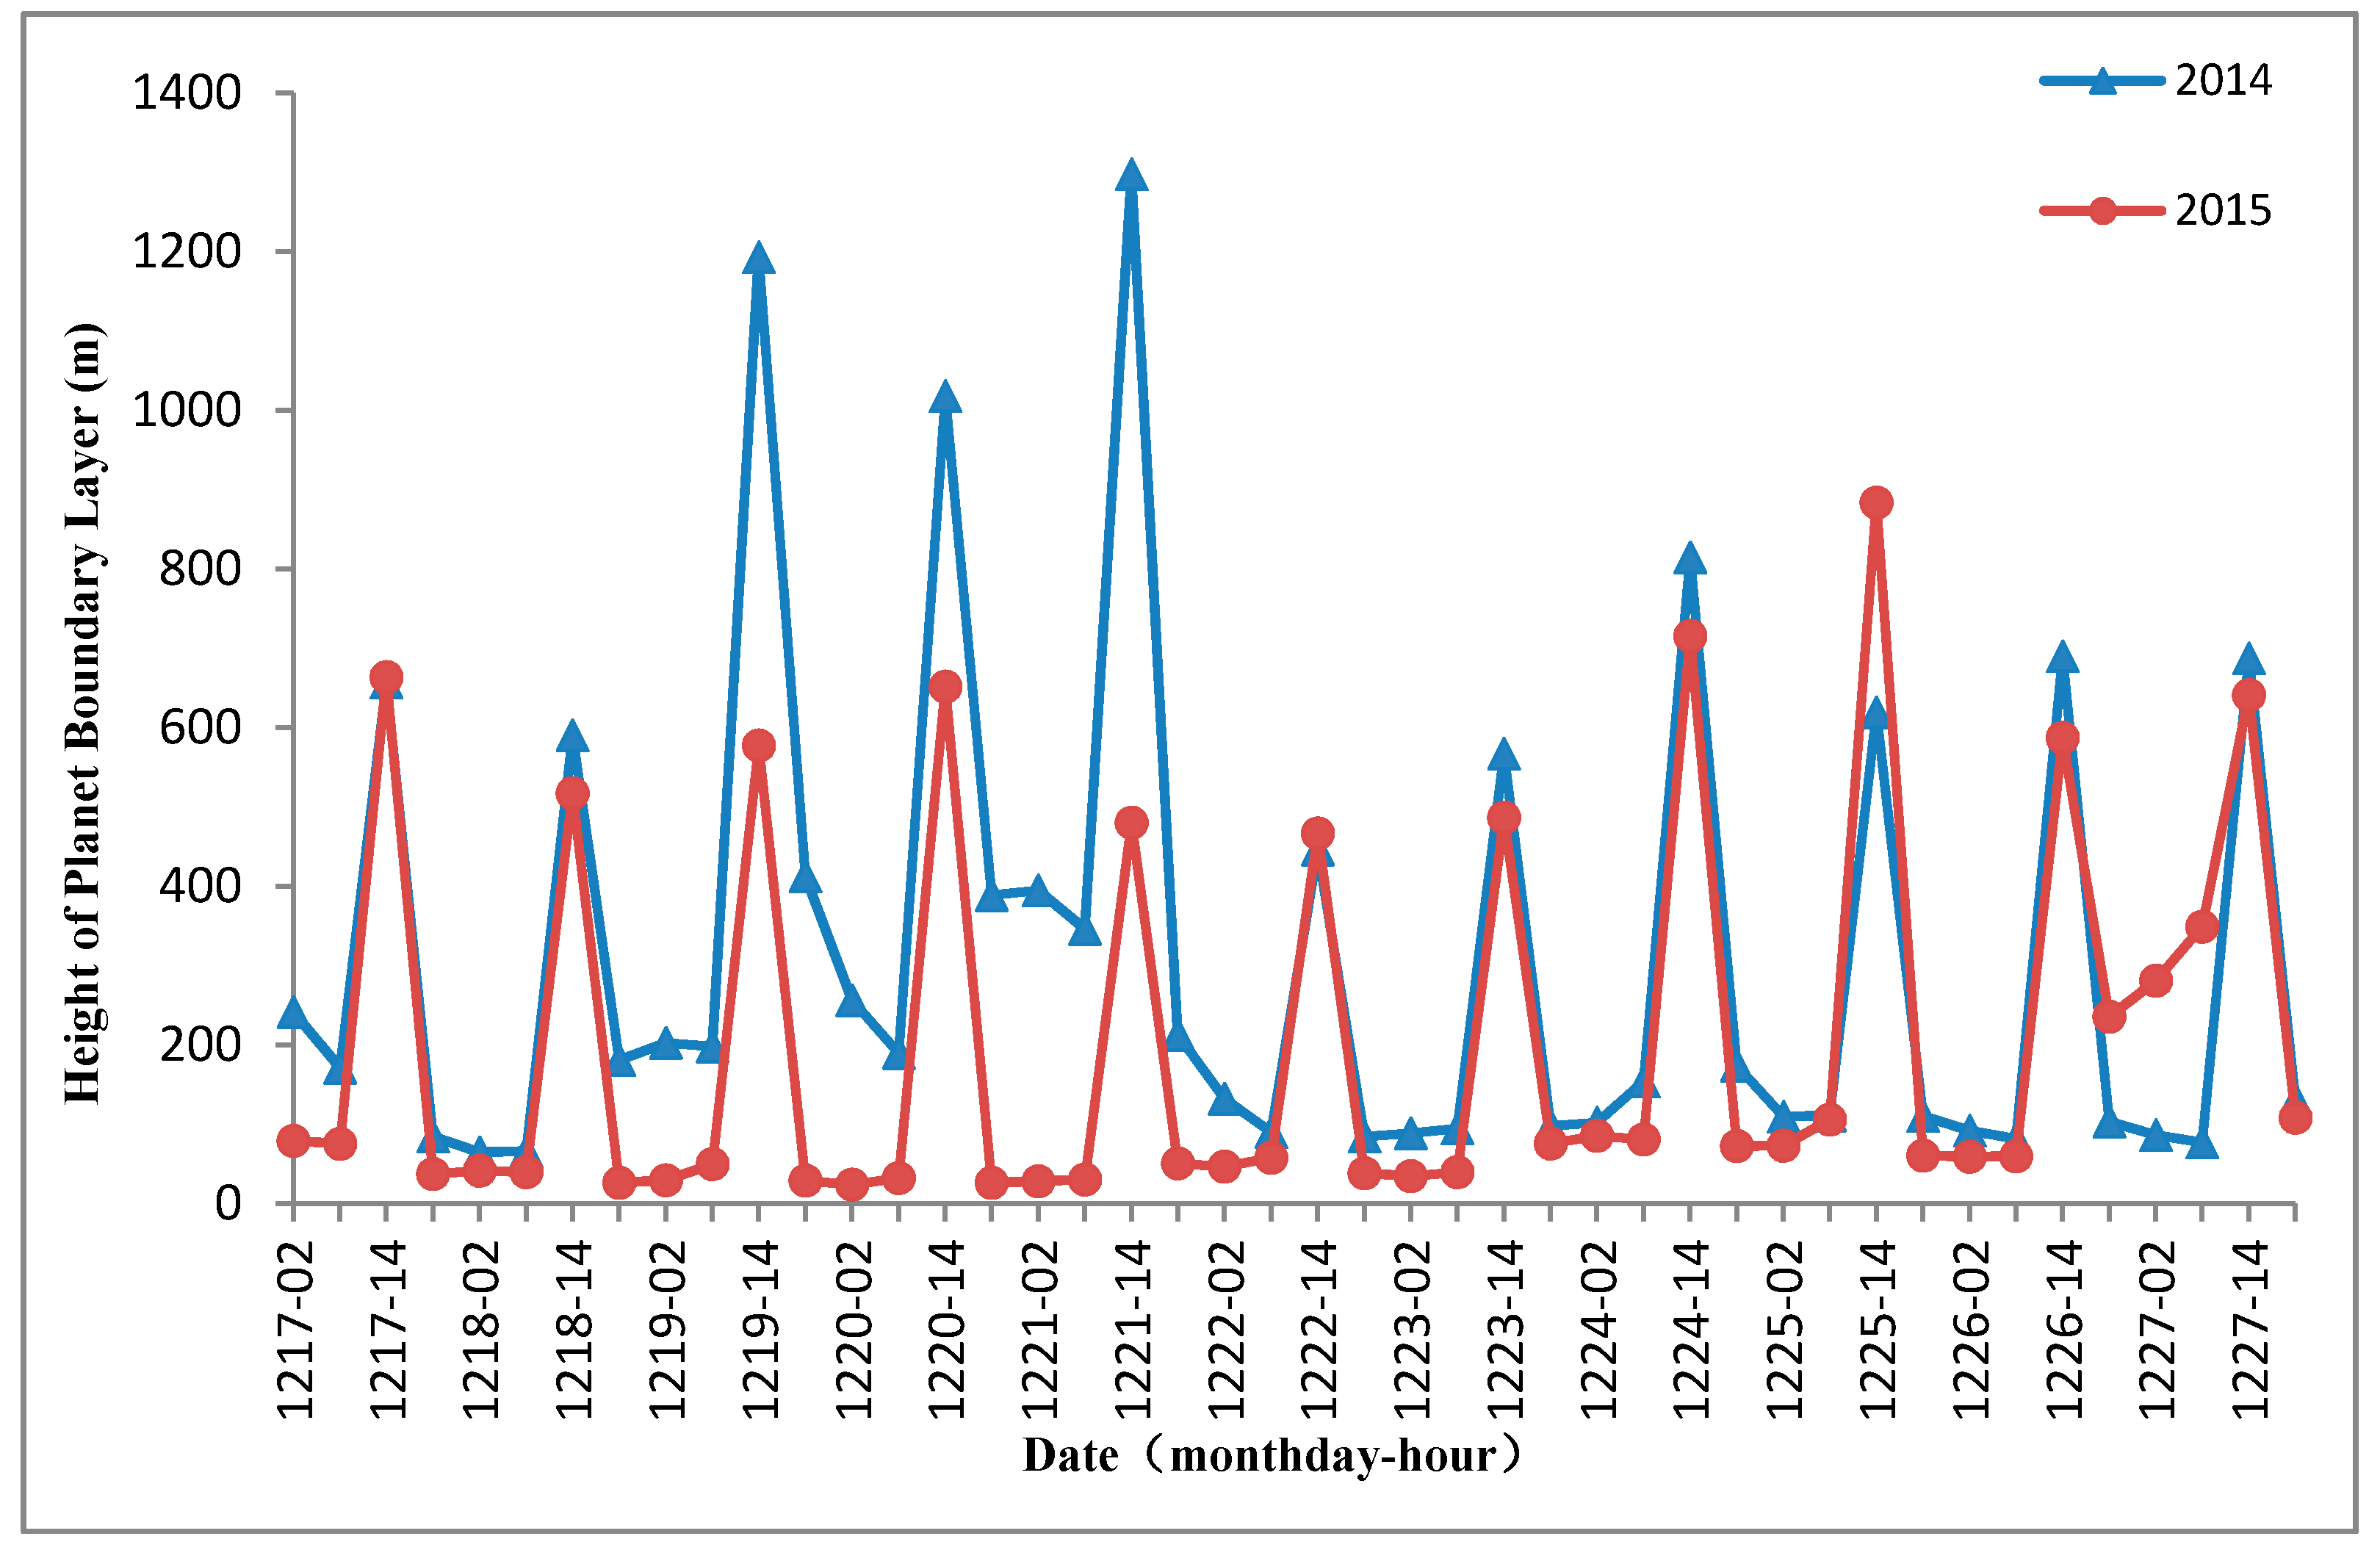
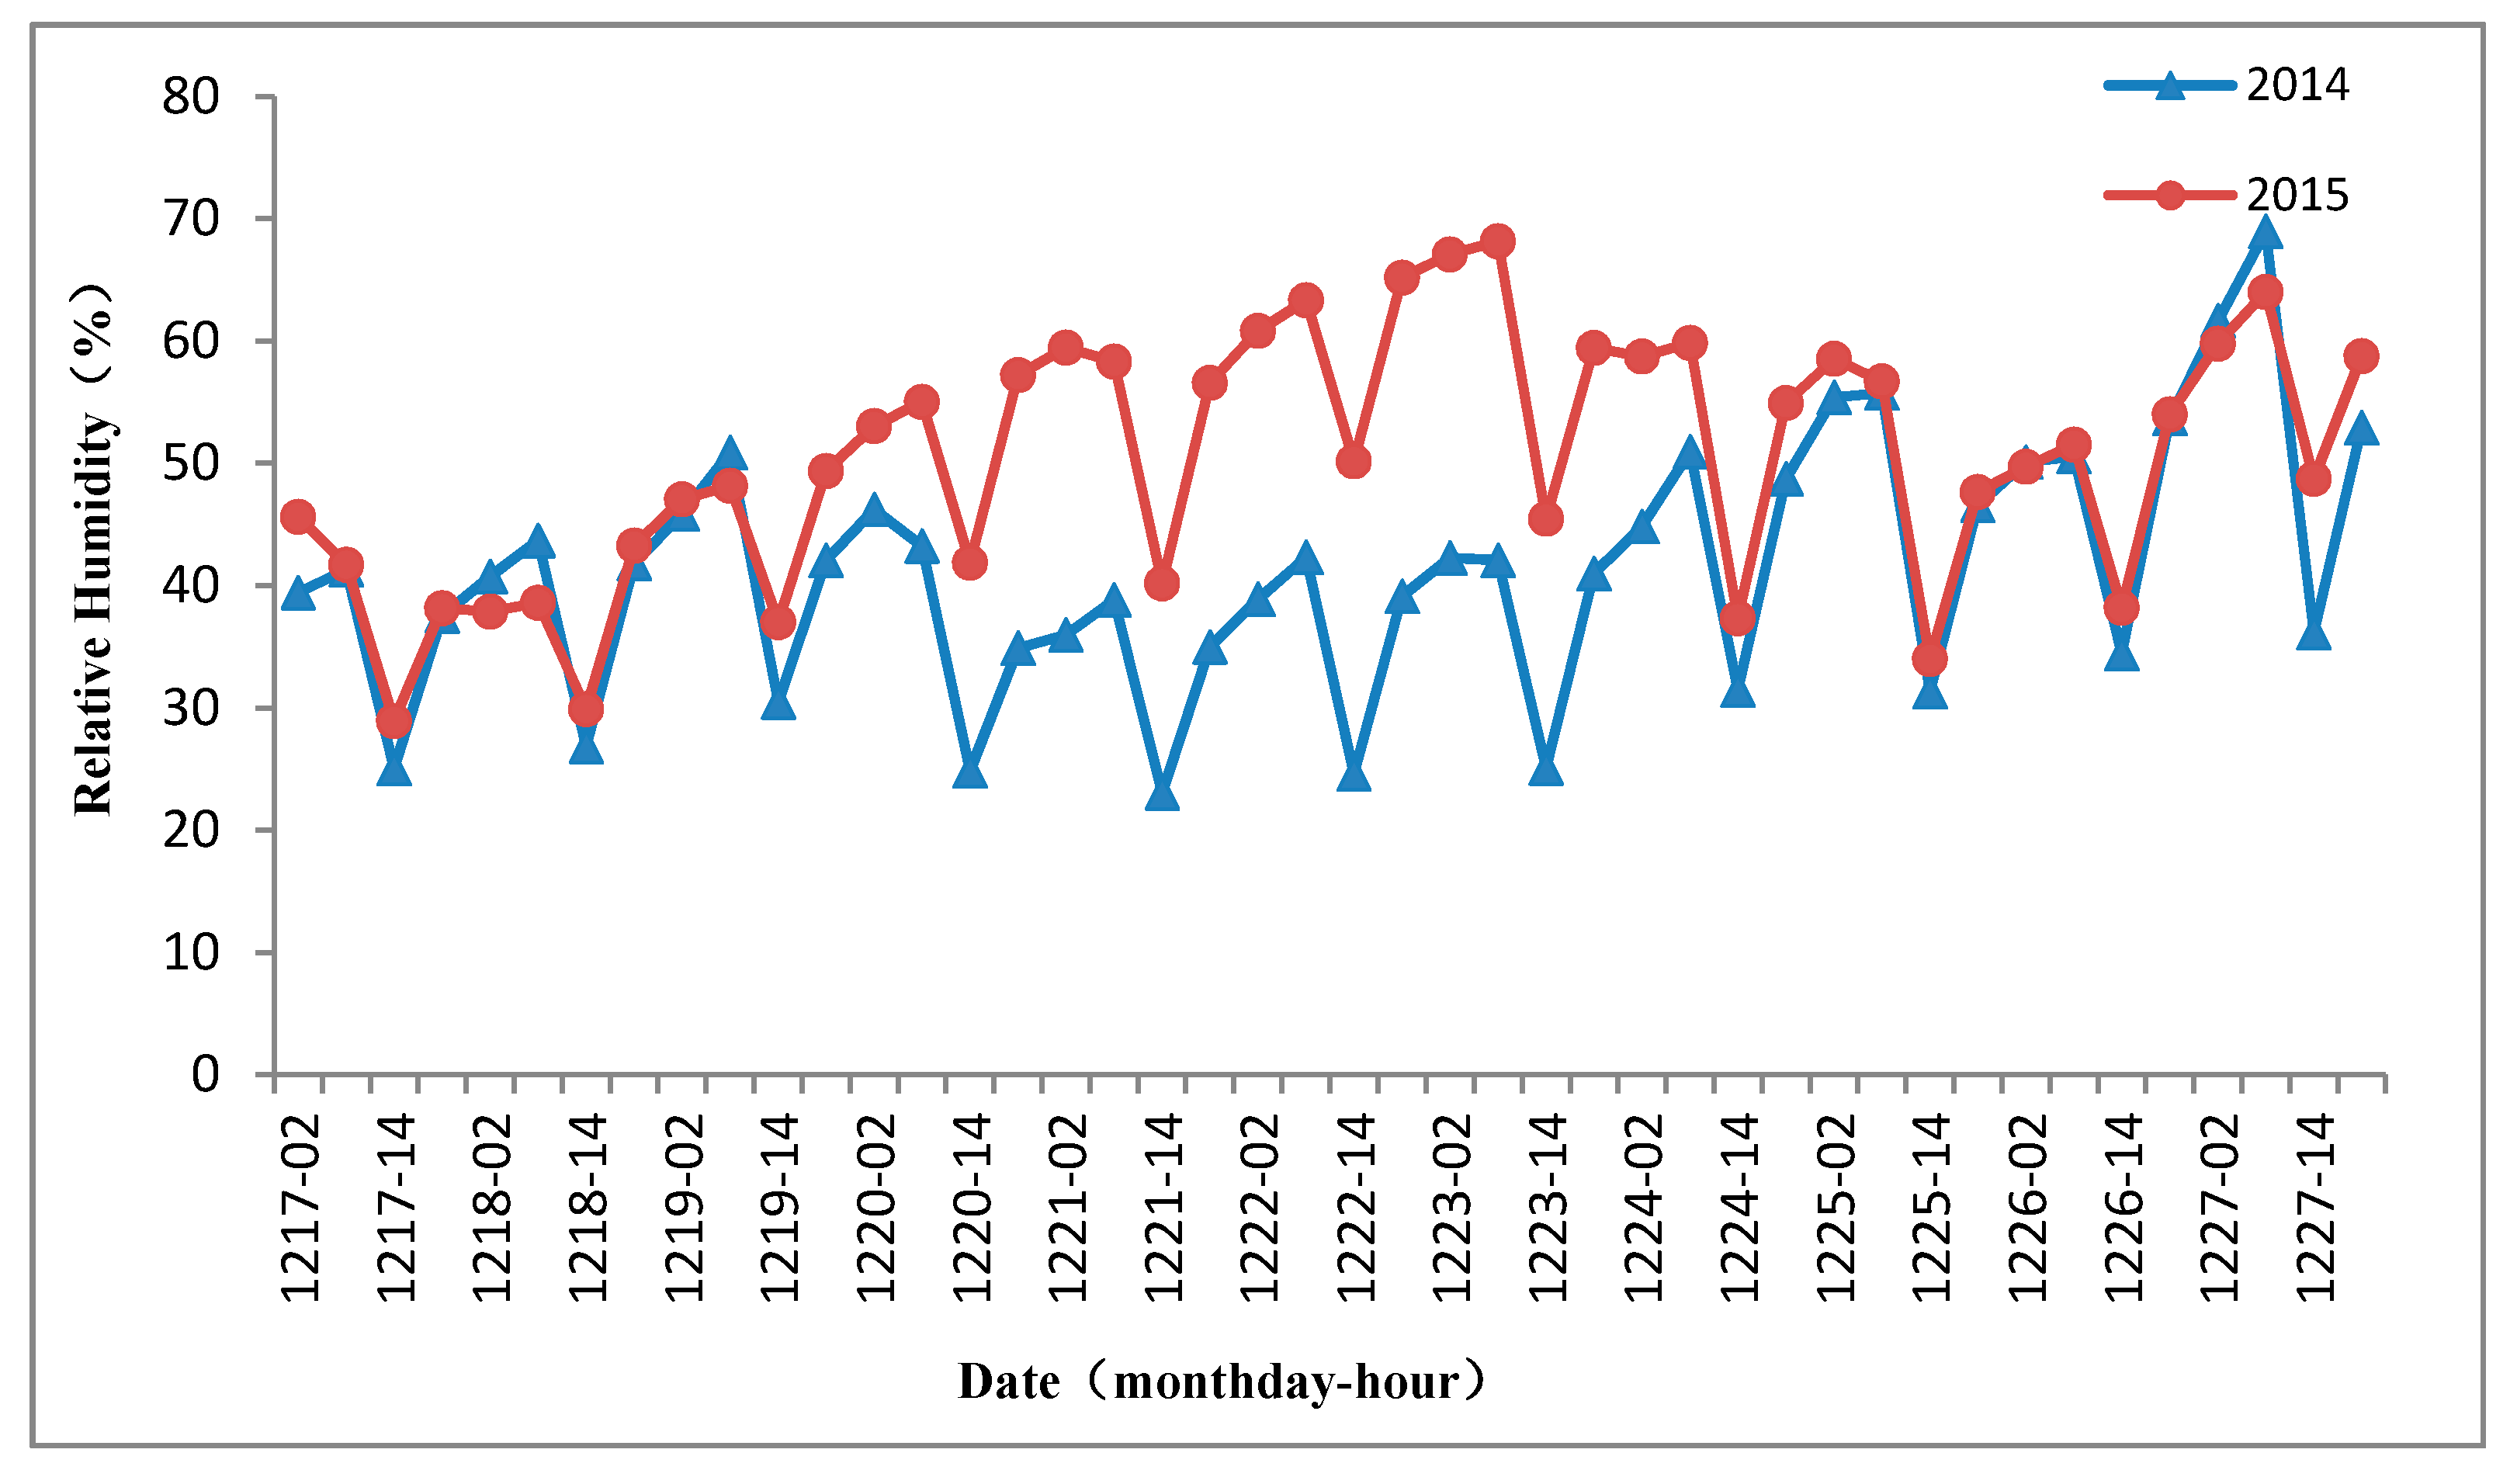
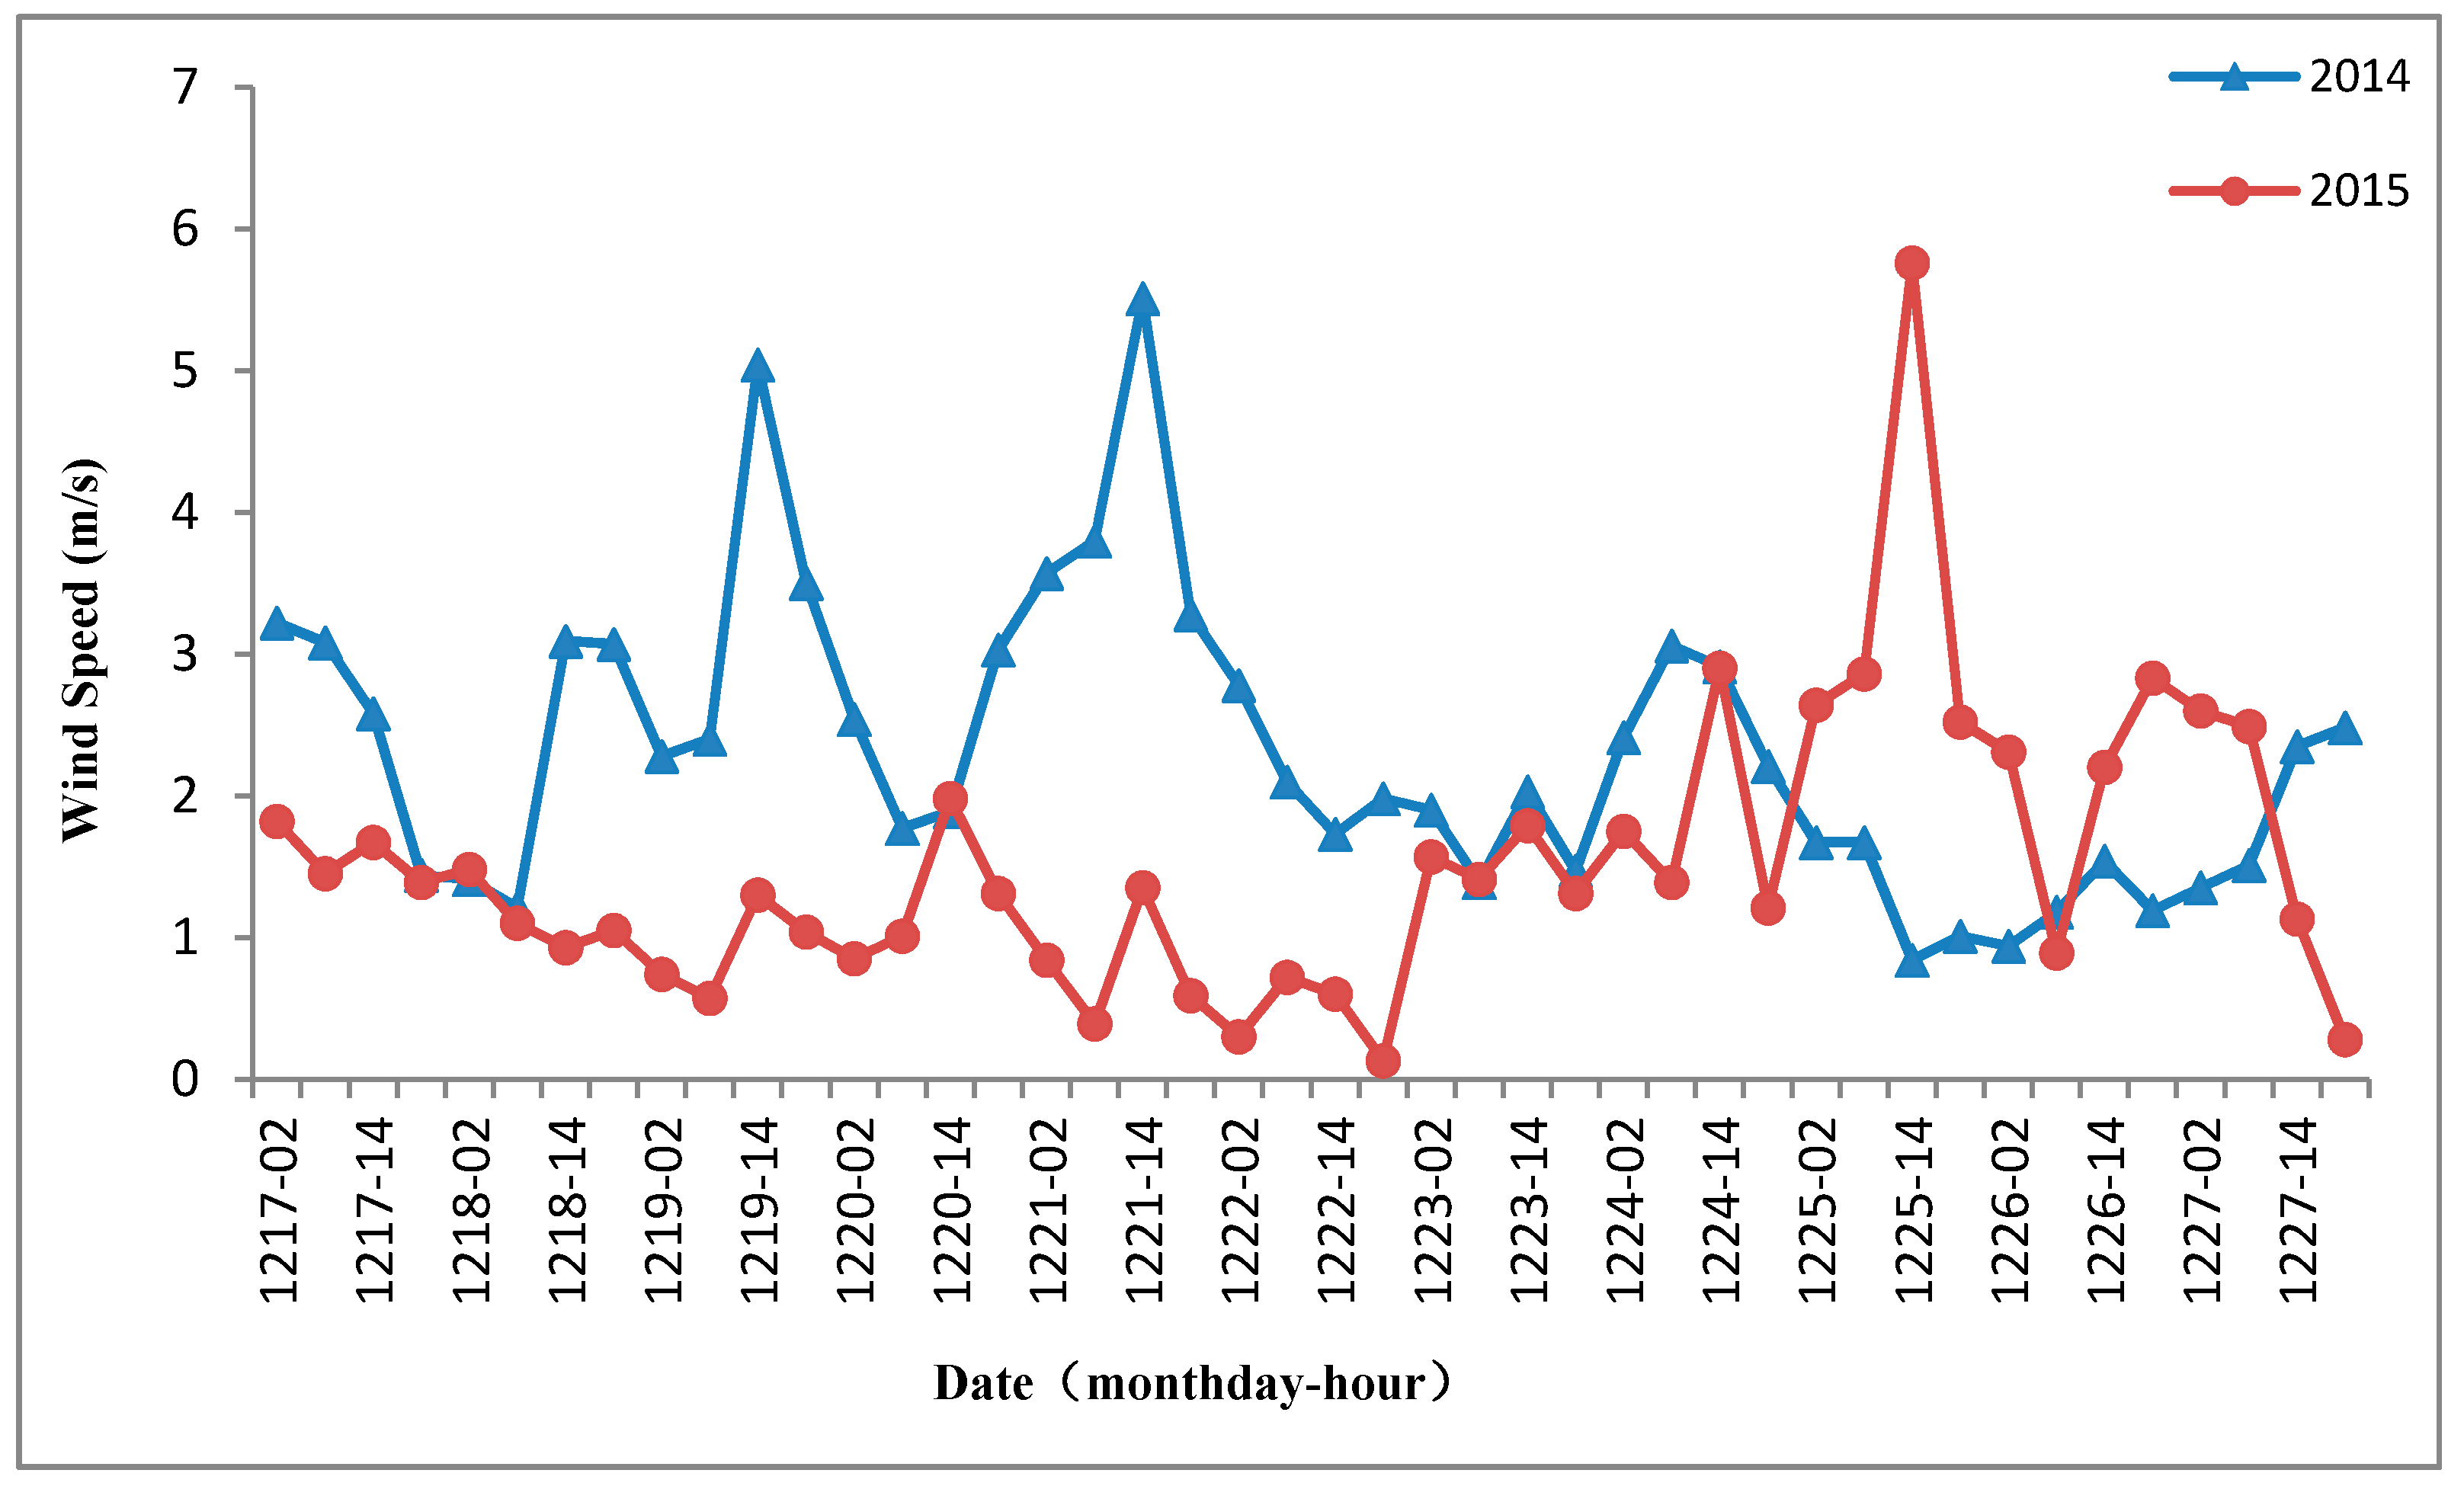
3.4. Analysis of Meteorological Conditions of Typical Heavy Haze Process

The study compared haze areas and meteorological conditions during the haze formation process, i.e., 17 December 2015 to 26 December 2015, and during the heavy haze process, i.e., 19 December to 24 December, with those during the same period in 2014 when no haze occurred.
It can be seen from the haze area results of the comparative analysis that there was not an obvious haze process during the period from 17 December 2014 to 26 December 2014 (Figure 7), while the same period in 2015 could see the haze process.
Based on the global 1 ° × 1 ° meteorological field analysis data, FNL (Final Operational Global Analysis), provided by the National Centers For Environmental Prediction of the United States, statistical procession of the three types of meteorological elements, i.e., boundary layer height, humidity and wind field that affect atmospheric diffusion during the haze process from 17 December 2015 to 26 December 2015 and the heavy haze process from 19 December 2015 to 24 December 2015, were performed to compare and analyze meteorological conditions and characteristics of the same periods but in different years when haze occurred in one year while staying absent in another.
The statistical result shows that: during the haze process from 17 December 2015 to 26 December 2015, the daily mean and maximum value of the studied region’s boundary layer heights were 197 m and 603 m respectively, while those numbers in 2014 were 129 m and 186 m higher; during the heavy haze process from 19 December to 24 December, the values were 176 m and 563 m respectively, while those in 2014 were 198 m and 327 m higher (Figure 8).
From 17 December to 26 December, the daily mean and maximum value of relative humidity were about 50% and 54% respectively, while those in 2014 were 10% lower; from 19 December to 24 December, the values were about 54% and 58%, while those in 2014 were 15% lower (Figure 9).
From 17 December to 26 December, the daily mean and maximum value of air speed were about 1.5 m/s and 2.1 m/s respectively, while those in 2014 were 0.8 m/s and 0.95 m/s higher; from 19 December to 24 December, the values were about 1.1 m/s and 1.7 m/s, while those in 2014 were 1.6 m/s and 1.9 m/s higher (Figure 10).
The statistical results above show that boundary layer height and wind speed during the hazy period were both lower than those during the non-hazy period, and the relative humidity was higher. A low boundary layer height and air speed and a high humidity at a long duration bring a long duration of almost steady weather, which goes against the horizontal and vertical diffusion of pollutants but brings up hygroscopicity of the particulate matters, easily leading to the accumulation of pollutants. In addition, wind data show that, in both the haze process and the heavy haze process, wind directions are mainly southwest, which, under influence of the southwest high-humidity airflows, may easily bring the pollutants in the comparatively heavily polluted from south part of Beijing-Tianjin-Hebei region to northward. In such light, it can be seen that unfavorable holistic meteorological conditions are one of the main reasons leading to heavy atmospheric pollutions.

4. Conclusions

When studying the atmospheric pollutions, especially the severe large regional heavy haze pollutions, it is very important for environmental managers to understand the beginning, developing and ending of the large-scale regional haze events in a practical way.
Now there are two popular ways to obtain the regional haze pollution status. One is by remote sensing technology and the other is by numerical simulations method. Remote sensing is characteristic for its relatively high accuracy in monitoring the process and severity of regional haze, but when some areas are covered by clouds, it fails to obtain valid monitoring data. The numerical simulation method has is characteristic for full coverage either temporal or spatial, but for lower accuracy. Combination of the advantages of the above two ways, this study establishes a set of haze inversion and judging methods. The main conclusions of this study are summarized as follows:
(1)
This study first established a coupled way to obtain HOD data by taking advantage of the two methods mainly based on remote sensing monitoring technologies in combination with numerical simulations. The validation for HOD retrieval results showed that the couple HOD from this study has good accuracy, the linear correlation coefficient between retrieval HOD and the AERONET Beijing station data and the PM2.5 data from the ground monitoring station were over 0.7 and 0.8 respectively.
(2)
On the basis of couple HOD method, this study first establishes a set of operationally quantitative judging methods for the process of larger regional heavy haze event, which includes the definition of haze and haze severity degree, judgment method for regional haze and heavy haze day, judgment method for the process of regional haze event, judgment method for the process of regional heavy haze event.
(3)
The applying results of the long time series haze event from December 2015 to 1 January 2016 shows that the methods put forward in this study are feasible to reflect the process of haze event, which can clearly reflect the regularity of generation, development and disappearance for the whole haze process.
(4)
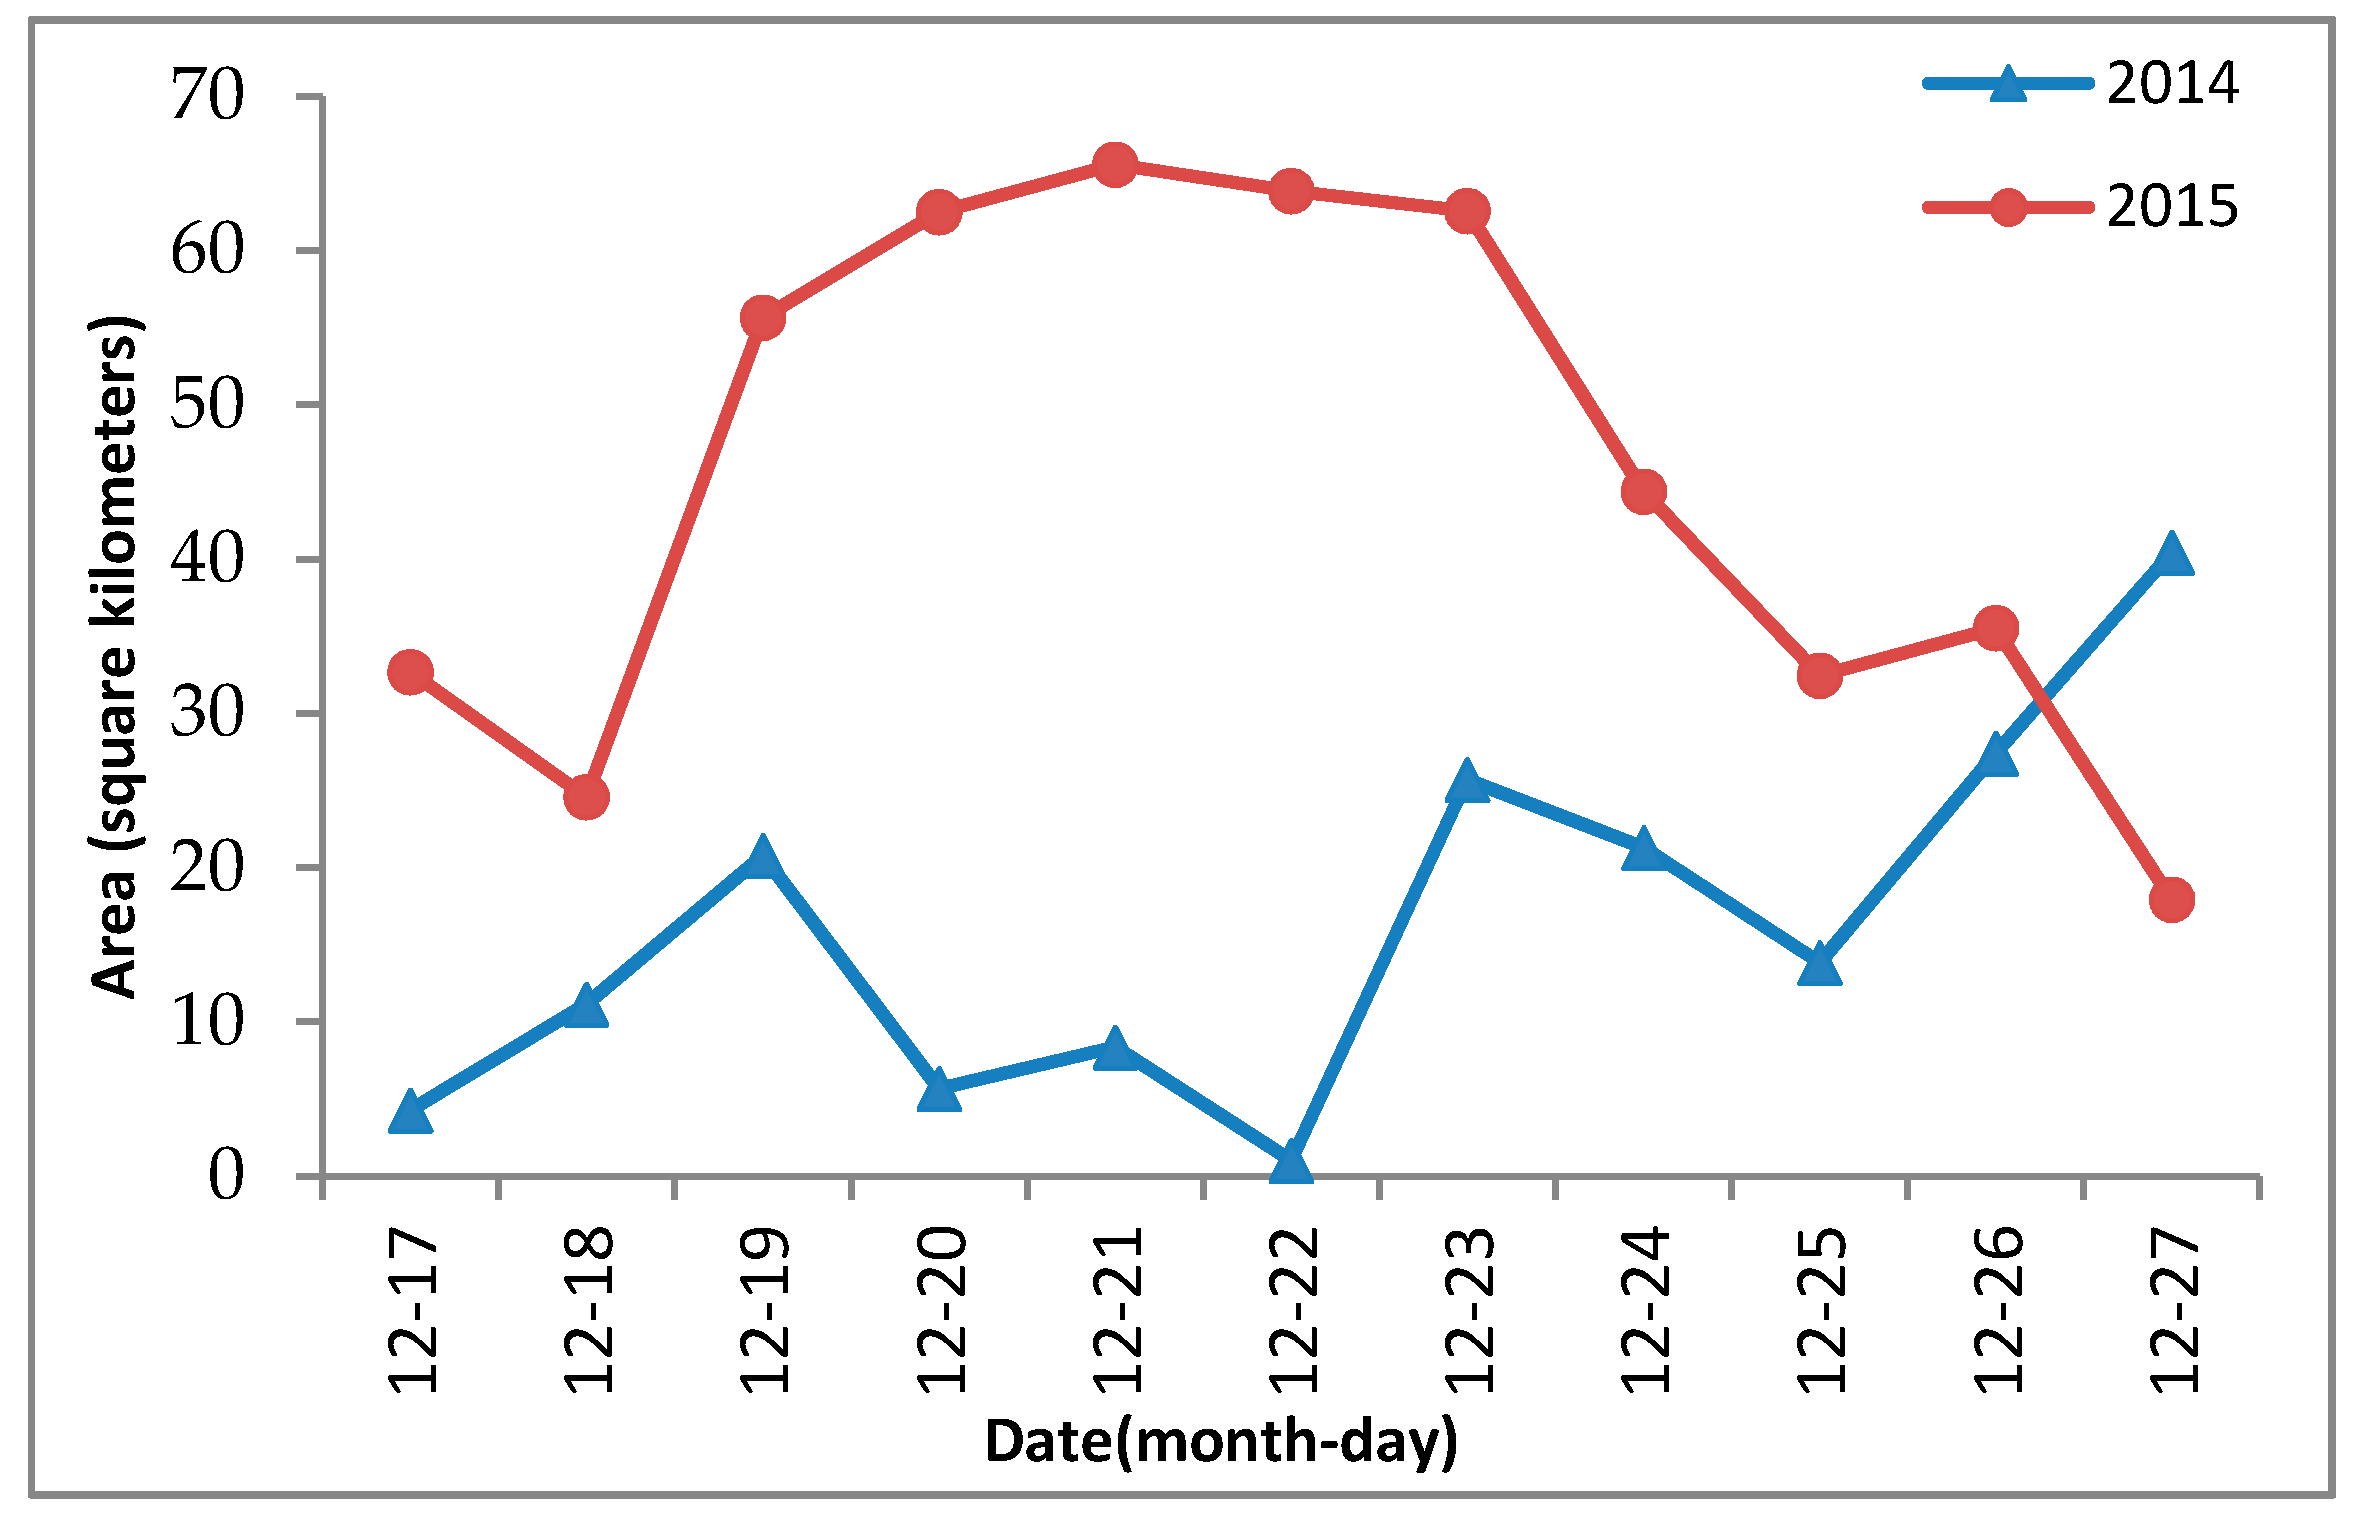
The analysis of the typical heavy haze pollution processes that occurred in Beijing–Tianjin–Hebei and the surrounding regions from 17 December 2015 to 26 December 2015 shows that, compared with no obvious haze process during the same period of the last year, the regional heavy haze occurred in such steady meteorological conditions as large-area low air speed, high humidity and low boundary layer height, from which on the other hand can be verified that the methods for haze inversion and the haze process are reliable.

Acknowledgments

This work was supported by the National Environmental protection public welfare project: Study on Mid and East China PM2.5 Monitoring and Its Business Operation Based on Satellite Remote Sensing (No: 201309011).

Author Contributions

All authors made great contributions to the work. Qiao Wang and Qing Li conceived and designed the experiments, analyzed the data and wrote the article. Zhongting Wang, Huiqing Mao performed the HOD algorithm research, and Hui Chen examined the experimental data and checked the experimental results, Chuihong Chen helped perform the statistical analysis.

Conflicts of Interest

The authors declare no conflict of interest.

References

  1. Ministry of Environmental Protection of the People’s Republic of China (MEP). Report on the State of the Environment in China in 2013. Available online: http://www.mep.gov.cn/hjzl/zghjzkgb/lnzghjzkgb/201605/P020160526564151497131.pdf (accessed on 5 October 2014). (In Chinese)
  2. Xu, P.; Chen, Y.F.; Ye, X. Haze, air pollution and health in China. Lancet 2013, 382, 2067. [Google Scholar] [CrossRef]
  3. Air Pollution Prevention and Control Action Plan. Available online: http://www.gov.cn/zwgk/2013-09/12/content_2486773.htm (accessed on 12 September 2013). (In Chinese)
  4. Ministry of Environmental Protection of the People’s Republic of China (MEP). Detailed Rules for the Implementation of the Action Plan for Preventing and Controlling Air Pollution in Beijing, Tianjin, Hebei and the Surrounding Areas. 2013; unpublished work. [Google Scholar]
  5. China Weather Network. Available online: http://www.tianqi.com/news/162366.html (accessed on 27 October 2016). (In Chinese).
  6. Weather China. Available online: http://www.weather.com.cn/static/html/article/20090310/26559.shtml (accessed on 10 March 2009). (In Chinese).
  7. World Meteorological Organization. Aerodrome Reports and Forecasts; World Meteorological Organization: Geneva, Switzerland, 2014; p. 78. [Google Scholar]
  8. Ministry of Environmental Protection. Ambient Air Quality Standard. Available online: http://kjs.mep.gov.cn/hjbhbz/bzwb/dqhjbh/dqhjzlbz/201203/t20120302_224165.htm (accessed on 10 October 2015). (In Chinese)
  9. Li, W.J.; Shao, L.Y.; Buseck, P.R. Haze types in Beijing and the influence of agricultural biomass burning. Atmos. Chem. Phys. 2010, 10, 8119–8130. [Google Scholar] [CrossRef]
  10. Li, Z.; Gu, X.; Wang, L.; Li, D.; Xie, Y.; Li, K.; Dubovik, O.; Schuster, G.; Goloub, P.; Zhang, Y.; et al. Aerosol physical and chemical properties retrieved from ground-based remote sensing measurements during heavy haze days in Beijing winter. Atmos. Chem. Phys. 2013, 13, 10171–10183. [Google Scholar] [CrossRef] [Green Version]
  11. Che, H.; Zhang, X.; Li, Y.; Zhou, Z.; Qu, J.; Hao, X. Haze trends over the capital cities of 31 provinces in China, 1981–2005. Theor. Appl. Climatol. 2009, 97, 235–242. [Google Scholar] [CrossRef]
  12. Noh, Y.M.; Muller, D.; Shin, D.H.; Lee, H.; Jung, J.S.; Lee, K.H.; Cribb, M.; Li, Z.; Kim, Y.J. Optical and microphysical properties of severe haze and smoke aerosol measured by integrated remote sensing techniques in Gwangju, Korea. Atmos. Environ. 2009, 43, 879–888. [Google Scholar] [CrossRef]
  13. Lee, K.H.; Kim, Y.J.; Kim, M.J. Characteristics of aerosol observed during two severe haze events over Korea in June and October 2004. Atmos. Environ. 2006, 40, 5146–5155. [Google Scholar] [CrossRef]
  14. Cheng, H.; Gong, W.; Wang, Z.; Zhang, F.; Wang, X.; Lv, X.; Liu, J.; Fu, X.; Zhang, G. Ionic composition of submicron particles (PM1.0) during the long-lasting haze period in January 2013 in Wuhan, central China. J. Environ. Sci. 2014, 26, 810–817. [Google Scholar] [CrossRef]
  15. China National Environmental Monitoring Center (CNEMC). Available online: http://106.37.208.233:20035/ (accessed on 12 December 2015).
  16. Chen, L.F.; Tao, J.H.; Wang, Z.F.; Li, S.S.; Han, D.; Zhang, Y. Monitoring of air quality during haze days in beijing and its surround area during Olympic Games. J. Atmos. Environ. Opt. 2009, 4, 256–265. [Google Scholar]
  17. Tao, M.; Chen, L.; Wang, Z.; Ma, P.; Tao, J.; Jia, S. A study of urban pollution and haze clouds over northern China during the dusty season based on satellite and surface observations. Atmos. Environ. 2014, 82, 183–192. [Google Scholar] [CrossRef]
  18. Gibbard, S.G.; Macintosh, B.; Gavel, D.; Max, C.E.; De Pater, I.; Roe, H.G.; Ghez, A.M.; Young, E.F.; McKay, C.P. Speckle imaging of Titan at 2 microns: Surface albedo, haze optical depth, and tropospheric clouds 1996–1998. Remote Sens. Environ. 2004, 169, 429–439. [Google Scholar] [CrossRef]
  19. Li, S.; Chen, L.; Xiong, X.; Tao, J.; Su, L.; Han, D.; Liu, Y. Retrieval of the Haze Optical Thickness in North China Plain Using MODIS Data. IEEE Trans. Geosci. Remote Sens. 2013, 51, 2528–2540. [Google Scholar] [CrossRef]
  20. Kaufman, Y.J.; Wald, A.; Remer, L.A. Remote sensing of aerosol over the continents with the aid of a 2.2 μm channel. IEEE Trans. Geosci. Remote Sens. 1997, 36, 1286–1298. [Google Scholar] [CrossRef]
  21. Levy, R.C.; Remer, L.A.; Mattoo, S.; Vermote, E.F.; Kaufman, Y.J. Second-generation operational algorithm: Retrieval of aerosol properties over land from inversion of Moderate Resolution Imaging Spectroradiometer spectral reflectance. J. Geophys. Res. Atmos. 2007, 112, D13211. [Google Scholar] [CrossRef]
  22. Hsu, C.N.; Tsay, S.C.; King, M.D.; Herman, J.R. Aerosol Properties over Bright-Reflecting. IEEE Trans. Geosci. Remote Sens. 2004, 42, 557–569. [Google Scholar] [CrossRef]
  23. Hsu, C.N.; Tsay, S.C.; King, M.D. Deep Blue Retrievals of Asian Aerosol Properties during ACE-Asia. IEEE Trans. Geosci. Remote Sens. 2006, 44, 3180–3195. [Google Scholar] [CrossRef]
  24. Huang, R.; Chen, H.; Ge, B.; Huang, S. Numerical study on source contributions to PM2.5 over Beijing-Tianjin-Hebei area during a severe haze event. Acta Scientiae Circumstantiae 2015, 35, 2670–2680. (In Chinese) [Google Scholar]
  25. Wu, Q.Z.; Wang, Z.F.; Gbaguidi, A.; Gao, C.; Li, L.N.; Wang, W. A numerical study of contributions to air pollution in Beijing during CAREBeijing-2006. Atmos. Chem. Phys. 2011, 11, 5997–6011. [Google Scholar] [CrossRef] [Green Version]
  26. Li, M.; Zhang, Q.; Kurokawa, J.; Woo, J.H.; He, K.B.; Lu, Z.; Ohara, T.; Song, Y.; Streets, D.G.; Carmichael. MIX: A mosaic Asian anthropogenic emission inventory for the MICS-Asia and the HTAP projects. Atmos. Chem. Phys. 2015, 15, 34813–34869. [Google Scholar] [CrossRef]
  27. Deng, W.; Chen, H.B.; Ma, Z.S. Decoding and Graphic Display of the NCEP FNL Global Analysis Data. Meteor. Environ. Sci. 2009, 32, 78–82. [Google Scholar]
  28. Vermote, E.F.; Tanre, D.; Deuzé, J.L.; Herman, M.; Morcrette, J.J. Second simulation of the satellite signal in the solar spectrum: An overview. IEEE Trans. Geosci. Remote Sens. 1997, 35, 675–686. [Google Scholar] [CrossRef]
  29. MODIS Level 1B Products Data Dictionary. Available online: https://mcst.gsfc.nasa.gov/sites/mcst.gsfc/files/file_attachments/M1055.pdf (accessed on 9 November 2016).
  30. Guenther, B.; Godden, G.D.; Xiong, X.; Knight, E.J.; Qiu, S.; Montgomery, H.; Hopkins, M.M.; Khayat, M.G.; Hao, Z. Prelaunch Algorithm and Data Format for the Level 1B Calibration Products for the EOS AM-1 Moderate Resolution Imaging Spectroradiometer (MODIS). IEEE Trans. Geosci. Remote Sens. 1998, 36, 1142–1151. [Google Scholar] [CrossRef]
  31. Wang, Z.; Wang, Z.; Li, J.; Zheng, H.; Yan, P.; Li, J. Development of a meteorology-chemistry two-way coupled numerical model (WRF-NAQPMS) and its application in a severe autumn haze simulation over the Beijing-Tianjin-Hebei area, China. Clim. Environ. Res. 2014, 19, 153–163. (In Chinese) [Google Scholar]
  32. PRC Meteorological Industry Standard. Observation and Forecasting Levels of Haze; China Meteorological Administration, China Meteorological Press: Beijing, China, 2010.
  33. Seng, L.F.; Shen, L.L.; Li, X.Z.; Liu, F. Studies on the Application of Empirical Formulae to the Calculation of Horizontal Visibility in Qingdao Coastal Area. Periodical Ocean Univ. Chin. 2009, 39, 877–882. [Google Scholar]
Figure 1. Validation of haze aerosol optical depth (HOD) with that from Beijing AERONET station.
Atmosphere 08 00222 g001
Figure 2. Validation of the HOD inversion results of each ground station compared with PM2.5 mass concentration from 17 December 2015 to 27 December 2015.
Atmosphere 08 00222 g002
Figure 3. Validation of the regional average HOD inversion results compared with PM2.5 mass concentration from 1 November 2015 to 4 January 2016.
Atmosphere 08 00222 g003
Figure 4. Area and process of haze from 1 November 2015 to 4 January 2016.
Atmosphere 08 00222 g004
Figure 5. Daily variation of haze area from 17 December 2015 to 27 December 2015.
Atmosphere 08 00222 g005
Figure 6. Regional distribution of haze grade from remote sensing in Beijing-Tianjin-Hebei and its surrounding regions from 17 December 2015 to 27 December 2015.
Atmosphere 08 00222 g006aAtmosphere 08 00222 g006b
Figure 7. Comparison of daily haze area from 17 December to 27 December between 2015 (haze period) and 2014 (no haze period).
Atmosphere 08 00222 g007
Figure 8. Comparison of average height of planet boundary layer from 17 December–27 December between 2014 and 2015.
Atmosphere 08 00222 g008
Figure 9. Relative humidity of Beijing-Tianjin-Hebei and its surrounding regions from 17 December to 27 December.
Atmosphere 08 00222 g009
Figure 10. Comparison of wind speed from 17 December to 27 December between 2014 and 2015.
Atmosphere 08 00222 g010

