Onshore Wind Speed Modulates Microbial Aerosols along an Urban Waterfront

 , and
, and
Abstract
1. Introduction
2. Experiments
2.1. Sampling Sites and Meteorological Context
2.2. Depositing Culturable Bacterial Aerosols and Sub-Surface Water Bacteria (First Field Campaign)
2.3. Total Microbial Aerosols (Second Field Campaign)
2.4. Bacterial Taxonomic Identification (First Field Campaign)
3. Results
4. Discussion
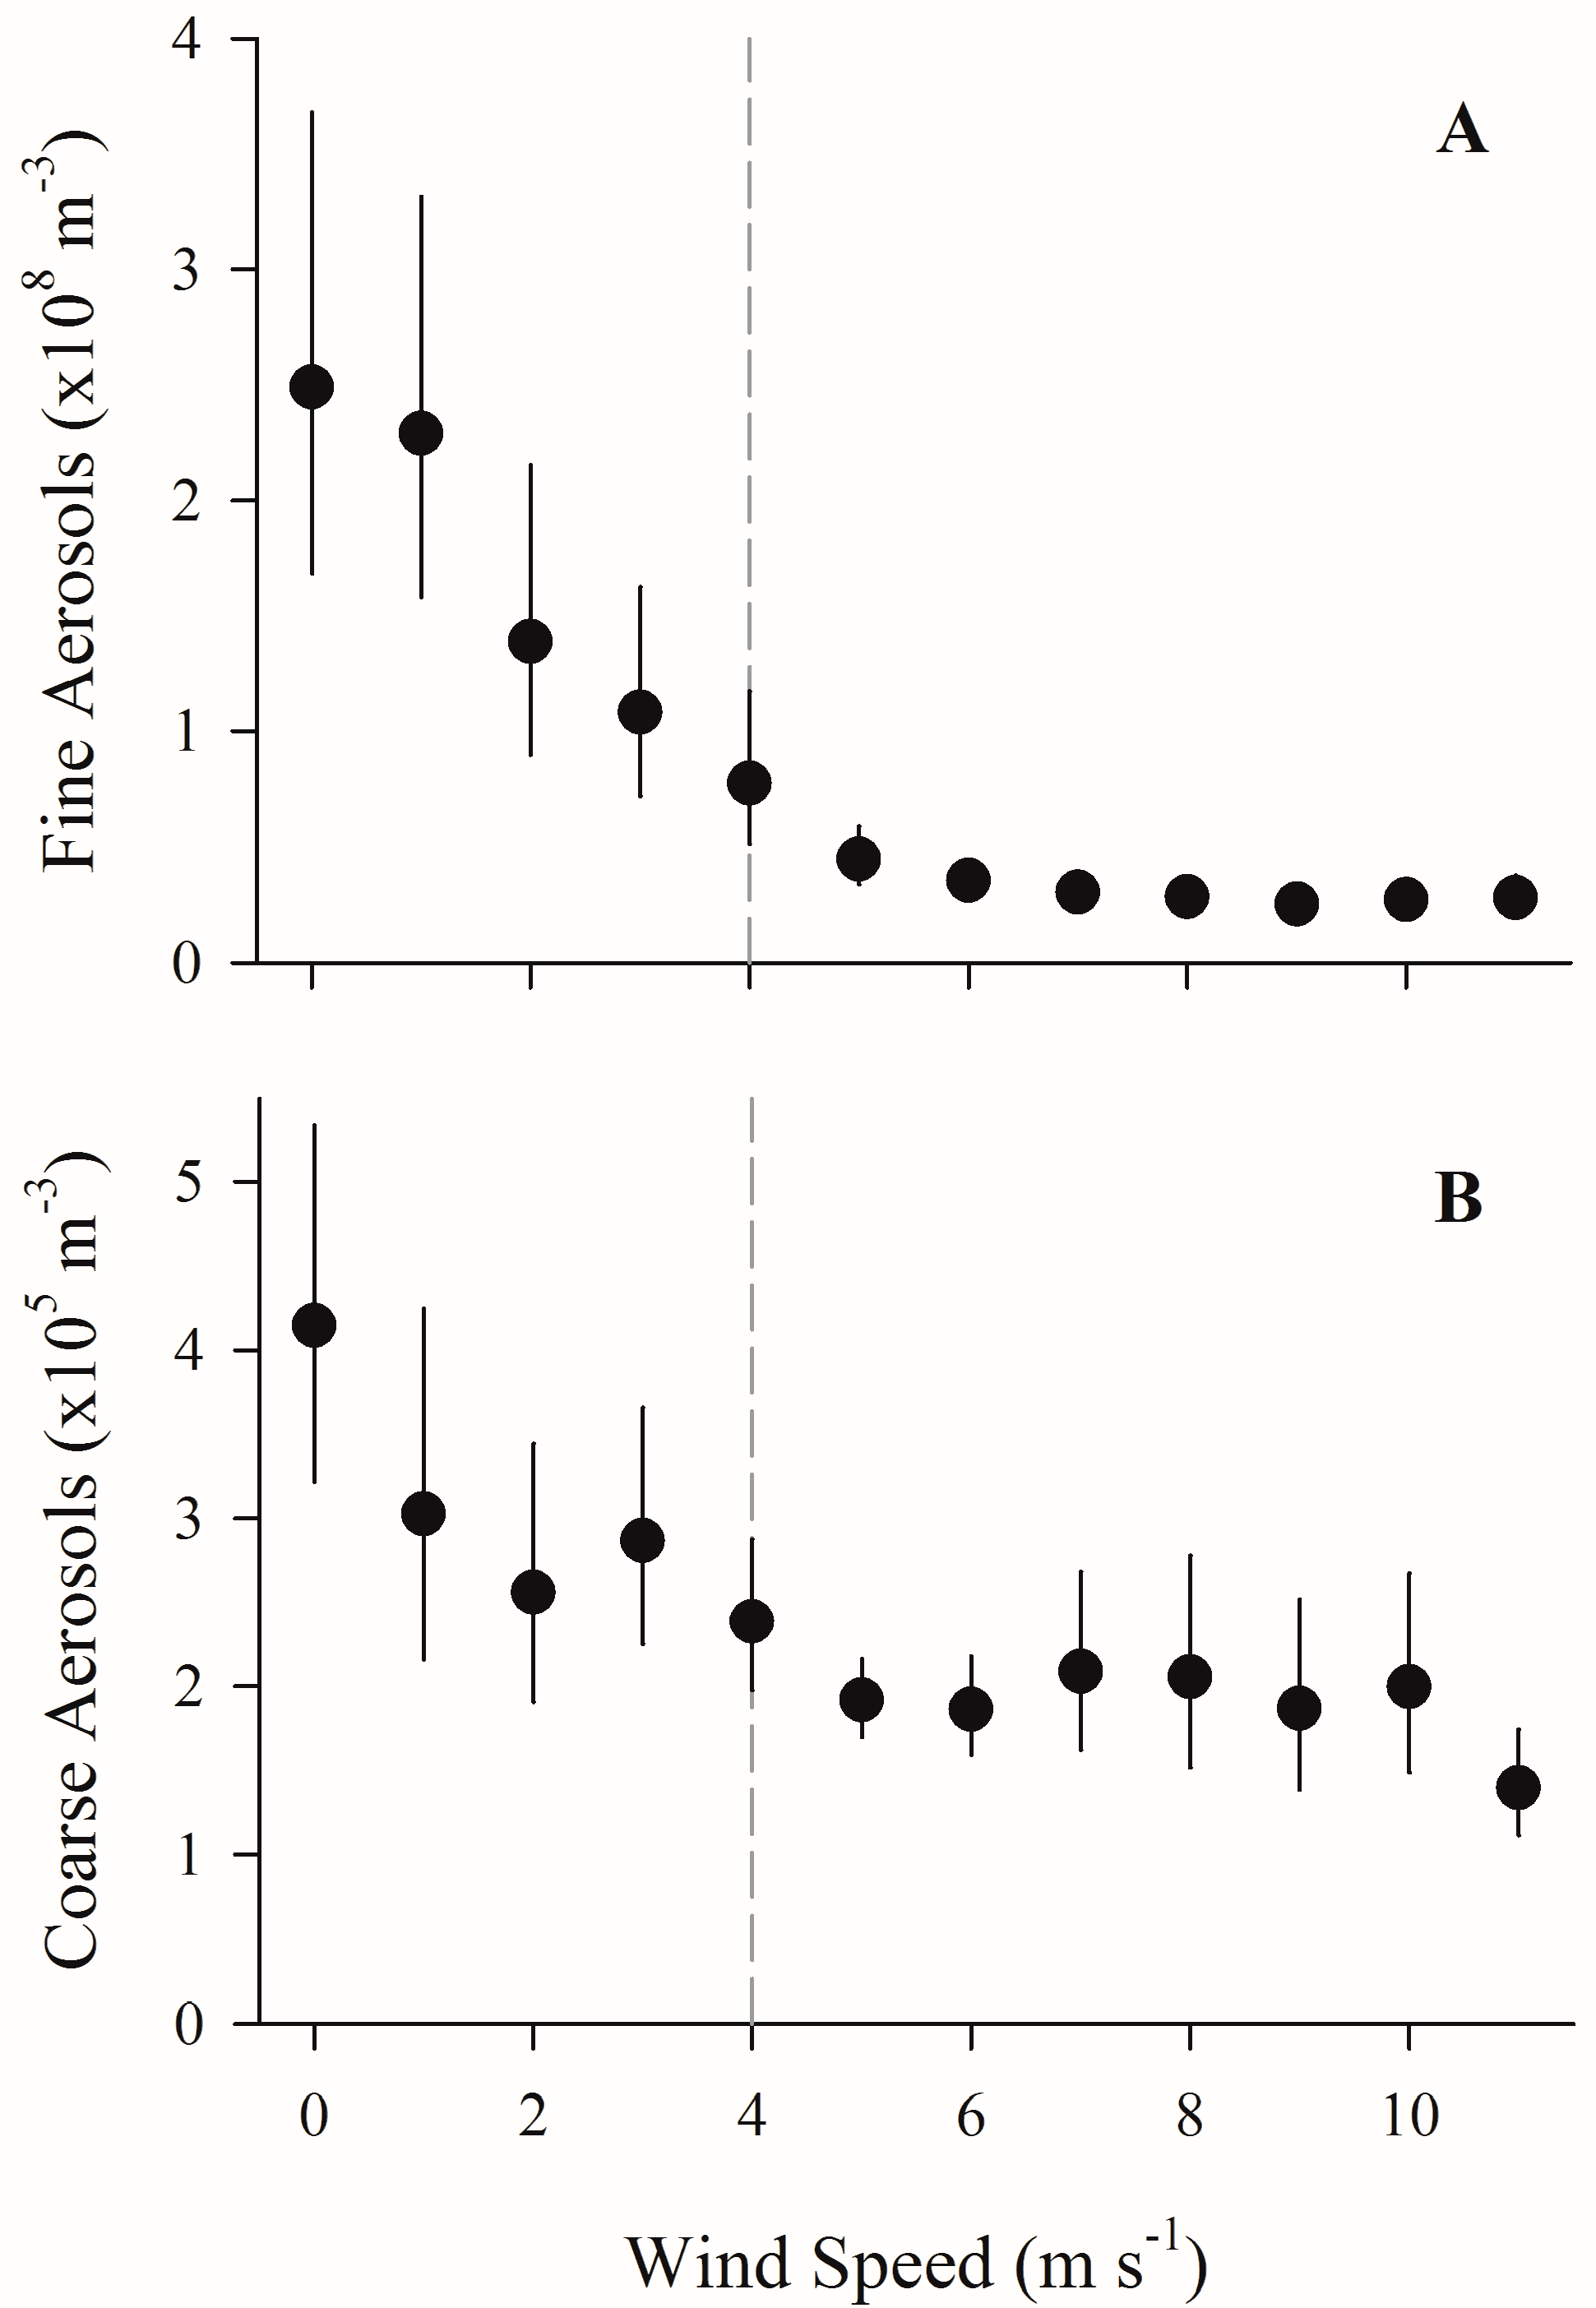
4.1. Increased Wind Speeds Increase Total and Culturable Microbial Aerosols at the Waterfront
4.2. Increased Wind Speeds Strengthen Water-Air Microbial Connection
5. Conclusions
Supplementary Materials
Acknowledgments
Author Contributions
Conflicts of Interest
References
- Seinfeld, J.H.; Pandis, S.N. Atmospheric Chemistry and Physics: From Air Pollution to Climate Change, 2nd ed.; Wiley: Hoboken, NJ, USA, 2006. [Google Scholar]
- Keene, W.C.; Maring, H.; Maben, J.R.; Kieber, D.J.; Pszenny, A.A.P.; Dahl, E.E.; Izaguirre, M.A.; Davis, A.J.; Long, M.S.; Zhou, X.L.; et al. Chemical and physical characteristics of nascent aerosols produced by bursting bubbles at a model air-sea interface. J. Geophys. Res. Atmos. 2007, 112. [Google Scholar] [CrossRef]
- Dueker, M.E.; O’Mullan, G.D. Aeration remediation of a polluted waterway increases near-surface coarse and culturable microbial aerosols. Sci. Total Environ. 2014, 184–189. [Google Scholar] [CrossRef] [PubMed]
- Dueker, M.E.; O’Mullan, G.D.; Juhl, A.R.; Weathers, K.C.; Uriarte, M. Local environmental pollution strongly influences culturable bacterial aerosols at an urban aquatic superfund site. Environ. Sci. Technol. 2012, 46, 10926–10932. [Google Scholar] [CrossRef] [PubMed]
- O’Mullan, G.D.; Dueker, M.E.; Juhl, A.R. Challenges to managing microbial fecal pollution in coastal environments: Extra-enteric ecology and microbial exchange among water, sediment, and air. Curr. Pollut. Rep. 2017, 3, 1–16. [Google Scholar] [CrossRef]
- Pope, C.A. Epidemiology of fine particulate air pollution and human health: Biologic mechanisms and who’s at risk? Environ. Health Persp. 2000, 108, 713–723. [Google Scholar] [CrossRef]
- Marks, R.; Kruczalak, K.; Jankowska, K.; Michalska, M. Bacteria and fungi in air over the gulf of gdansk and baltic sea. J. Aerosol Sci. 2001, 32, 237–250. [Google Scholar] [CrossRef]
- Lai, K.M.; Emberlin, J.; Colbeck, I. Outdoor environments and human pathogens in air. Environ. Health 2009, 8. [Google Scholar] [CrossRef] [PubMed]
- Woo, A.C.; Brar, M.S.; Chan, Y.; Lau, M.C.Y.; Leung, F.C.C.; Scott, J.A.; Vrijmoed, L.L.P.; Zawar-Reza, P.; Pointing, S.B. Temporal variation in airborne microbial populations and microbially derived allergens in a tropical urban landscape. Atmos. Environ. 2013, 74, 291–300. [Google Scholar] [CrossRef]
- Montero, A.; Dueker, M.E.; O’Mullan, G.D. Culturable bioaerosols along an urban waterfront are primarily associated with coarse particles. PeerJ 2016, 4, e2827. [Google Scholar] [CrossRef] [PubMed]
- Ravva, S.V.; Hernlem, B.J.; Sarreal, C.Z.; Mandrell, R.E. Bacterial communities in urban aerosols collected with wetted-wall cyclonic samplers and seasonal fluctuations of live and culturable airborne bacteria. J. Environ. Monit. 2012, 14, 473–481. [Google Scholar] [CrossRef] [PubMed]
- Polymenakou, P.N.; Mandalakis, M.; Stephanou, E.G.; Tselepides, A. Particle size distribution of airborne microorganisms and pathogens during an intense african dust event in the eastern mediterranean. Environ. Health Persp. 2008, 116, 292–296. [Google Scholar] [CrossRef] [PubMed]
- Corbett, S.; Rubin, G.; Curry, G.; Kleinbaum, D. The health effects of swimming at sydney beaches. Am. J. Public Health 1993, 83, 1701–1706. [Google Scholar] [CrossRef] [PubMed]
- Li, M.; Yu, X.; Kang, H.; Xie, Z.; Zhang, P. Concentrations and size distributions of bacteria-containing particles over oceans from China to the arctic ocean. Atmosphere 2007, 8, 82. [Google Scholar] [CrossRef]
- Cho, B.C.; Hwang, C.Y. Prokaryotic abundance and 16s rRNA gene sequences detected in marine aerosols on the east sea (korea). FEMS Microbiol. Ecol. 2011, 76, 327–341. [Google Scholar] [CrossRef] [PubMed]
- Motta, O.; Capunzo, M.; De Caro, F.; Brunetti, L.; Santoro, E.; Farina, A.; Proto, A. New approach for evaluating the public health risk of living near a polluted river. J. Prev. Med. Hyg. 2008, 49, 79–88. [Google Scholar] [PubMed]
- Pickup, R.W.; Rhodes, G.; Arnott, S.; Sidi-Boumedine, K.; Bull, T.J.; Weightman, A.; Hurley, M.; Hermon-Taylor, J. Mycobacterium avium subsp paratuberculosis in the catchment area and water of the river taff in South Wales, United Kingdom, and its potential relationship to clustering of crohn′s disease cases in the city of Cardiff. Appl. Environ. Microb. 2005, 71, 2130–2139. [Google Scholar] [CrossRef] [PubMed]
- Aller, J.Y.; Kuznetsova, M.R.; Jahns, C.J.; Kemp, P.F. The sea surface microlayer as a source of viral and bacterial enrichment in marine aerosols. J. Aerosol Sci. 2005, 36, 801–812. [Google Scholar] [CrossRef]
- Caller, T.A.; Doolin, J.W.; Haney, J.F.; Murby, A.J.; West, K.G.; Farrar, H.E.; Ball, A.; Harris, B.T.; Stommel, E.W. A cluster of amyotrophic lateral sclerosis in new hampshire: A possible role for toxic cyanobacteria blooms. Amyotroph. Lateral Scler. 2009, 10. [Google Scholar] [CrossRef] [PubMed]
- Bradley, W.G.; Borenstein, A.R.; Nelson, L.M.; Codd, G.A.; Rosen, B.H.; Stommel, E.W.; Cox, P.A. Is exposure to cyanobacteria an environmental risk factor for amyotrophic lateral sclerosis and other neurodegenerative diseases? Amyotroph. Lateral Scler. Frontotemporal Degener. 2013, 14, 325–333. [Google Scholar] [CrossRef] [PubMed]
- Young, S.; Juhl, A.R.; O’Mullan, G.D. Antibiotic resistant bacteria in the hudson river estuary linked to wet weather sewage contamination. J. Water Health 2013, 11, 297–310. [Google Scholar] [CrossRef] [PubMed]
- Brandi, G.; Sisti, M.; Amagliani, G. Evaluation of the environmental impact of microbial aerosols generated by wastewater treatment plants utilizing different aeration systems. J. Appl. Microbiol. 2000, 88, 845–852. [Google Scholar] [CrossRef] [PubMed]
- Carducci, A.; Tozzi, E.; Rubulotta, E.; Casini, B.; Cantiani, L.; Rovini, E.; Muscillo, M.; Pacini, R. Assessing airborne biological hazard from urban wastewater treatment. Water Res. 2000, 34, 1173–1178. [Google Scholar] [CrossRef]
- Haas, D.; Unteregger, M.; Habib, J.; Galler, H.; Marth, E.; Reinthaler, F.F. Exposure to bioaerosol from sewage systems. Water Air Soil Pollut. 2010, 207, 49–56. [Google Scholar] [CrossRef]
- Heinonen-Tanski, H.; Reponen, T.; Koivunen, J. Airborne enteric coliphages and bacteria in sewage treatment plants. Water Res. 2009, 43, 2558–2566. [Google Scholar] [CrossRef] [PubMed]
- Stewart, J.R.; Gast, R.J.; Fujioka, R.S.; Solo-Gabriele, H.M.; Meschke, J.S.; Amaral-Zettler, L.A.; del Castillo, E.; Polz, M.F.; Collier, T.K.; Strom, M.S.; et al. The coastal environment and human health: Microbial indicators, pathogens, sentinels and reservoirs. Environ. Health 2008, 7, 14. [Google Scholar] [CrossRef] [PubMed]
- Nilsson, S.; Merritt, A.S.; Bellander, T. Endotoxins in urban air in Stockholm, Sweden. Atmos. Environ. 2011, 45, 266–270. [Google Scholar] [CrossRef]
- Gangamma, S.; Patil, R.S.; Mukherji, S. Characterization and proinflammatory response of airborne biological particles from wastewater treatment plants. Environ. Sci. Technol. 2011, 45, 3282–3287. [Google Scholar] [CrossRef] [PubMed]
- Sharoni, S.; Trainic, M.; Schatz, D.; Lehahn, Y.; Flores, M.J.; Bidle, K.D.; Ben-Dor, S.; Rudich, Y.; Koren, I.; Vardi, A. Infection of phytoplankton by aerosolized marine viruses. Proc. Natl. Acad. Sci. USA 2015, 112, 6643–6647. [Google Scholar] [CrossRef] [PubMed]
- Whon, T.W.; Kim, M.S.; Roh, S.W.; Shin, N.R.; Lee, H.W.; Bae, J.W. Metagenomic characterization of airborne viral DNA diversity in the near-surface atmosphere. J. Virol. 2012, 86, 8221–8231. [Google Scholar] [CrossRef] [PubMed]
- Prussin, A.J.; Garcia, E.B.; Marr, L.C. Total concentrations of virus and bacteria in indoor and outdoor air. Environ. Sci. Technol. Lett. 2015, 2, 84–88. [Google Scholar] [CrossRef] [PubMed]
- Brodie, E.L.; DeSantis, T.Z.; Parker, J.P.M.; Zubietta, I.X.; Piceno, Y.M.; Andersen, G.L. Urban aerosols harbor diverse and dynamic bacterial populations. Proc. Natl. Acad. Sci. USA 2007, 104, 299–304. [Google Scholar] [CrossRef] [PubMed]
- Bowers, R.M.; Sullivan, A.P.; Costello, E.K.; Collett, J.L.; Knight, R.; Fierer, N. Sources of bacteria in outdoor air across cities in the midwestern united states. Appl. Environ. Microb. 2011, 77, 6350–6356. [Google Scholar] [CrossRef] [PubMed]
- Bowers, R.M.; Clements, N.; Emerson, J.B.; Wiedinmyer, C.; Hannigan, M.P.; Fierer, N. Seasonal variability in bacterial and fungal diversity of the near-surface atmosphere. Environ. Sci. Technol. 2013, 47, 12097–12106. [Google Scholar] [CrossRef] [PubMed]
- Despres, V.R.; Nowoisky, J.F.; Klose, M.; Conrad, R.; Andreae, M.O.; Poschl, U. Characterization of primary biogenic aerosol particles in urban, rural, and high-alpine air by DNA sequence and restriction fragment analysis of ribosomal rna genes. Biogeosciences 2007, 4, 1127–1141. [Google Scholar] [CrossRef]
- Fang, Z.G.; Ouyang, Z.Y.; Zheng, H.; Wang, X.K.; Hu, L.F. Culturable airborne bacteria in outdoor environments in beijing, china. Microb. Ecol. 2007, 54, 487–496. [Google Scholar] [CrossRef] [PubMed]
- Cao, C.; Jiang, W.; Wang, B.; Fang, J.; Lang, J.; Tian, G.; Jiang, J.; Zhu, T. Inhalable microorganisms in Beijing’s PM2.5 and PM10 pollutants during a severe smog event. Environ. Sci. Technol. 2014, 48, 1499–1507. [Google Scholar] [PubMed]
- Lee, C.; Sultana, C.M.; Collins, D.B.; Santander, M.V.; Axson, J.L.; Malfatti, F.; Cornwell, G.C.; Grandquist, J.R.; Deane, G.B.; Stokes, M.D.; et al. Advancing model systems for fundamental laboratory studies of sea spray aerosol using the microbial loop. J. Phys. Chem. A 2015, 119, 8860–8870. [Google Scholar] [CrossRef] [PubMed]
- Patterson, J.P.; Collins, D.B.; Michaud, J.M.; Axson, J.L.; Sultana, C.M.; Moser, T.; Dommer, A.C.; Conner, J.; Grassian, V.H.; Stokes, M.D.; et al. Sea spray aerosol structure and composition using cryogenic transmission electron microscopy. ACS Cent. Sci. 2016, 2, 40–47. [Google Scholar] [CrossRef] [PubMed]
- Blanchard, D.C. The ejection of drops from the sea and their enrichment with bacteria and other materials: A review. Estuaries 1989, 12, 127–137. [Google Scholar] [CrossRef]
- Blanchard, D.C.; Syzdek, L. Bubbles and water-to air transfer of bacteria. Bull. Am. Meteorol. Soc. 1971, 52, 1136–1141. [Google Scholar]
- Monahan, E.C.; Fairall, C.W.; Davidson, K.L.; Boyle, P.J. Observed interrelations between 10 m winds, ocean whitecaps and marine aerosols. Q. J. R. Meteorol. Soc. 1983, 109, 379–392. [Google Scholar] [CrossRef]
- Hultin, K.A.H.; Krejci, R.; Pinhassi, J.; Gomez-Consarnau, L.; Martensson, E.M.; Hagstrom, A.; Nilsson, E.D. Aerosol and bacterial emissions from baltic seawater. Atmos. Res. 2011, 99, 1–14. [Google Scholar] [CrossRef]
- Vignati, E.; de Leeuw, G.; Schulz, M.; Plate, E. Characterization of aerosols at a coastal site near vindeby (Denmark). J. Geophys. Res. Oceans 1999, 104, 3277–3287. [Google Scholar] [CrossRef]
- Dueker, M.E.; Weathers, K.C.; O’Mullan, G.D.; Juhl, A.R.; Uriarte, M. Environmental controls on coastal coarse aerosols: Implications for microbial content and deposition in the near-shore environment. Environ. Sci. Technol. 2011, 45, 3386–3392. [Google Scholar] [CrossRef] [PubMed]
- Dueker, M.E.; O’Mullan, G.D.; Weathers, K.C.; Juhl, A.R.; Uriarte, M. Coupling of fog and marine microbial content in the near-shore coastal environment. Biogeosciences 2012, 9, 803–813. [Google Scholar] [CrossRef]
- De Leeuw, G.; Neele, F.P.; Hill, M.; Smith, M.H.; Vignati, E. Production of sea spray aerosol in the surf zone. J. Geophys. Res. Atmos. 2000, 105, 29397–29409. [Google Scholar] [CrossRef]
- Jayarathne, T.; Sultana, C.M.; Lee, C.; Malfatti, F.; Cox, J.L.; Pendergraft, M.A.; Moore, K.A.; Azam, F.; Tivanski, A.V.; Cappa, C.D.; et al. Enrichment of saccharides and divalent cations in sea spray aerosol during two phytoplankton blooms. Environ. Sci. Technol. 2016, 50, 11511–11520. [Google Scholar] [CrossRef] [PubMed]
- Hatch, M.T.; Dimmick, R.L. Physiological responses of airborne bacteria to shifts in relative humidity. Bacteriol. Rev. 1966, 30, 597–602. [Google Scholar] [PubMed]
- Burrows, S.M.; Elbert, W.; Lawrence, M.G.; Poschl, U. Bacteria in the global atmosphere—Part 1: Review and synthesis of literature data for different ecosystems. Atmos. Chem. Phys. 2009, 9, 9263–9280. [Google Scholar] [CrossRef]
- Lighthart, B.; Shaffer, B.T. Increased airborne bacterial survival as a function of particle content and size. Aerosol Sci. Technol. 1997, 27, 439–446. [Google Scholar] [CrossRef]
- Fitzgerald, J.W. Approximation formulas for equilibrium size of an aerosol particle as a function of its dry size and composition and ambient relative humidity. J. Appl. Meteorol. 1975, 14, 1044–1049. [Google Scholar] [CrossRef]
- Shaffer, B.T.; Lighthart, B. Survey of culturable airborne bacteria at four diverse locations in oregon: Urban, rural, forest, and coastal. Microb. Ecol. 1997, 34, 167–177. [Google Scholar] [CrossRef] [PubMed]
- Lighthart, B.; Shaffer, B.T. Viable bacterial aerosol particle size distributions in the midsummer atmosphere at an isolated location in the high desert chaparral. Aerobiologia 1995, 11, 19–25. [Google Scholar] [CrossRef]
- Marie, D.; Brussaard, C.P.D.; Thyrhaug, R.; Bratbak, G.; Vaulot, D. Enumeration of marine viruses in culture and natural samples by flow cytometry. Appl. Environ. Microbiol. 1999, 65, 45–52. [Google Scholar] [PubMed]
- Brussaard, C.P.D. Optimization of procedures for counting viruses by flow cytometry. Appl. Environ. Microbiol. 2004, 70, 1506–1513. [Google Scholar] [CrossRef] [PubMed]
- Teske, A.; Hinrichs, K.U.; Edgcomb, V.; Gomez, A.D.; Kysela, D.; Sylva, S.P.; Sogin, M.L.; Jannasch, H.W. Microbial diversity of hydrothermal sediments in the guaymas basin: Evidence for anaerobic methanotrophic communities. Appl. Environ. Microb. 2002, 68, 1994–2007. [Google Scholar] [CrossRef]
- Drummond, A.; Ashton, B.; Buxton, S.; Cheung, M.; Cooper, A.; Heled, J.; Kearse, M.; Moir, R.; Stones-Havas, S.; Sturrock, S.; et al. Geneious, version 5.1; Available online: http://www.geneious.com (accessed on 8 November 2017).
- Cole, J.R.; Wang, Q.; Cardenas, E.; Fish, J.; Chai, B.; Farris, R.J.; Kulam-Syed-Mohideen, A.S.; McGarrell, D.M.; Marsh, T.; Garrity, G.M.; et al. The ribosomal database project: Improved alignments and new tools for rRNA analysis. Nucleic Acids Res. 2009, 37, 141–145. [Google Scholar] [CrossRef] [PubMed]
- Wang, Q.; Garrity, G.M.; Tiedje, J.M.; Cole, J.R. Naive bayesian classifier for rapid assignment of rRNA sequences into the new bacterial taxonomy. Appl. Environ. Microb. 2007, 73, 5261–5267. [Google Scholar] [CrossRef] [PubMed]
- Griffiths, W.D.; Decosemo, G.A.L. The assessment of bioaerosols—A Critical Review. J. Aerosol Sci. 1994, 25, 1425–1458. [Google Scholar] [CrossRef]
- Fahlgren, C.; Hagstrom, A.; Nilsson, D.; Zweifel, U.L. Annual Variations in the Diversity, Viability, and Origin of Airborne Bacteria. Appl. Environ. Microb. 2010, 76, 3015–3025. [Google Scholar] [CrossRef] [PubMed]
- Jones, A.M.; Harrison, R.M. The effects of meteorological factors on atmospheric bioaerosol concentrations—A review. Sci. Total Environ. 2004, 326, 151–180. [Google Scholar] [CrossRef] [PubMed]
- Wommack, K.E.; Colwell, R.R. Virioplankton: Viruses in Aquatic Ecosystems. Microbiol. Mol. Biol. Rev. 2000, 64, 69–114. [Google Scholar] [CrossRef] [PubMed]
- Lighthart, B.; Shaffer, B.T.; Marthi, B.; Ganio, L. Trajectory of Aerosol Droplets from a Sprayed Bacterial Suspension. Appl. Environ. Microb. 1991, 57, 1006–1012. [Google Scholar]
- Holgate, S.T. Innate and adaptive immune responses in asthma. Nat. Med. 2012, 18, 673–683. [Google Scholar] [CrossRef] [PubMed]
- Meyer, E.H.; Goya, S.; Akbari, O.; Berry, G.J.; Savage, P.B.; Kronenberg, M.; Nakayama, T.; DeKruyff, R.H.; Umetsu, D.T. Glycolipid activation of invariant T cell receptor(+) NK T cells is sufficient to induce airway hyperreactivity independent of conventional CD4(+) T cells. Proc. Natl. Acad. Sci. USA 2006, 103, 2782–2787. [Google Scholar] [CrossRef] [PubMed]


| Aerosols (n = 615) | Sub-Surface Water (n = 548) | |||
|---|---|---|---|---|
| # Seq | % Lib | # Seq | % Lib | |
| Acinetobacter * | 6 | 1.0% | 57 | 10.4% |
| Aeromonas * | 1 | 0.2% | 14 | 2.6% |
| Agrococcus | 14 | 2.3% | 1 | 0.2% |
| Arthrobacter * | 40 | 6.5% | 5 | 0.9% |
| Bacillus * | 110 | 17.9% | 33 | 6.0% |
| Bosea * | 2 | 0.3% | 1 | 0.2% |
| Brevundimonas * | 11 | 1.8% | 15 | 2.7% |
| Chryseobacterium * | 7 | 1.1% | 6 | 1.1% |
| Curtobacterium | 6 | 1.0% | 1 | 0.2% |
| Flavobacterium * | 2 | 0.3% | 70 | 12.8% |
| Janthinobacterium | 2 | 0.3% | 3 | 0.5% |
| Kocuria * | 18 | 2.9% | 1 | 0.2% |
| Lysinibacillus * | 2 | 0.3% | 3 | 0.5% |
| Massilia * | 13 | 2.1% | 1 | 0.2% |
| Methylobacterium * | 8 | 1.3% | 4 | 0.7% |
| Microbacterium * | 36 | 5.9% | 13 | 2.4% |
| Nocardioides | 3 | 0.5% | 1 | 0.2% |
| Novosphingobium * | 2 | 0.3% | 16 | 2.9% |
| Ochrobactrum * | 2 | 0.3% | 1 | 0.2% |
| Oxalicibacterium | 2 | 0.3% | 1 | 0.2% |
| Paenibacillus * | 5 | 0.8% | 5 | 0.9% |
| Paracoccus * | 5 | 0.8% | 3 | 0.5% |
| Pedobacter | 4 | 0.7% | 4 | 0.7% |
| Plantibacter | 1 | 0.2% | 1 | 0.2% |
| Pseudomonas * | 18 | 2.9% | 47 | 8.6% |
| Pseudoxanthomonas | 4 | 0.7% | 1 | 0.2% |
| Psychrobacter * | 5 | 0.8% | 1 | 0.2% |
| Ralstonia | 1 | 0.2% | 35 | 6.4% |
| Rhodococcus * | 19 | 3.1% | 5 | 0.9% |
| Roseomonas * | 4 | 0.7% | 2 | 0.4% |
| Sanguibacter | 3 | 0.5% | 1 | 0.2% |
| Sphingobium * | 2 | 0.3% | 4 | 0.7% |
| Sphingomonas * | 43 | 7.0% | 55 | 10.0% |
| Sphingopyxis * | 2 | 0.3% | 13 | 2.4% |
| Streptomyces * | 6 | 1.0% | 1 | 0.2% |
| Unclassified Comamonadaceae | 4 | 0.7% | 1 | 0.2% |
| Unclassified Microbacteriaceae | 15 | 2.4% | 1 | 0.2% |
| Unclassified Oxalobacteraceae | 10 | 1.6% | 1 | 0.2% |
| Variovorax | 20 | 3.3% | 2 | 0.4% |
| Total Shared | 74.5% | 78.5% | ||
© 2017 by the authors. Licensee MDPI, Basel, Switzerland. This article is an open access article distributed under the terms and conditions of the Creative Commons Attribution (CC BY) license (http://creativecommons.org/licenses/by/4.0/).
Share and Cite
Dueker, M.E.; O’Mullan, G.D.; Martínez, J.M.; Juhl, A.R.; Weathers, K.C. Onshore Wind Speed Modulates Microbial Aerosols along an Urban Waterfront. Atmosphere 2017, 8, 215. https://doi.org/10.3390/atmos8110215
Dueker ME, O’Mullan GD, Martínez JM, Juhl AR, Weathers KC. Onshore Wind Speed Modulates Microbial Aerosols along an Urban Waterfront. Atmosphere. 2017; 8(11):215. https://doi.org/10.3390/atmos8110215
Chicago/Turabian StyleDueker, M. Elias, Gregory D. O’Mullan, Joaquín Martínez Martínez, Andrew R. Juhl, and Kathleen C. Weathers. 2017. "Onshore Wind Speed Modulates Microbial Aerosols along an Urban Waterfront" Atmosphere 8, no. 11: 215. https://doi.org/10.3390/atmos8110215
APA StyleDueker, M. E., O’Mullan, G. D., Martínez, J. M., Juhl, A. R., & Weathers, K. C. (2017). Onshore Wind Speed Modulates Microbial Aerosols along an Urban Waterfront. Atmosphere, 8(11), 215. https://doi.org/10.3390/atmos8110215