Article

Assessment of Atmospheric Wet Profiles Obtained from COSMIC Radio Occultation Observations over China

1
Hubei Key Laboratory for Heavy Rain Monitoring and Warning Research, Institute of Heavy Rain, China Meteorological Administration, Wuhan 430205, China
2
Institute of Plateau Meteorology, China Meteorological Administration, Chengdu 610072, China
3
Key Laboratory of Earth and Planetary Physics, Institute of Geology and Geophysics, Chinese Academy of Sciences, Beijing 100029, China
*
Author to whom correspondence should be addressed.
Atmosphere 2017, 8(11), 208; https://doi.org/10.3390/atmos8110208
Submission received: 18 August 2017 / Revised: 21 October 2017 / Accepted: 21 October 2017 / Published: 26 October 2017
(This article belongs to the Section Meteorology)

Abstract

:
Atmosperic profiles derived from Constellation Observing System for Meteorology, Ionosphere, and Climate (COSMIC) radio occultation (RO) measurements make up for the lack of operational radiosonde soundings with a high spatiotemporal distribution, and their performance over China is assessed in this paper. COSMIC-retrieved atmospheric wet profiles from 2014 to 2015 are compared to the contemporaneous radiosonde profiles from 120 stations, and the vertical mean differences are used. The results show that the vertical mean biases of temperature, pressure and vapor pressure are −0.10 K, 0.69 hPa and −0.01 hPa, respectively, and that for refractivity is 0.17 N. Moreover, the temperature differences are positively correlated with station altitude, yet both the pressure and vapor pressure differences are negatively correlated with station latitude, as is the refractivity difference. The large temperature difference arising from the Qinghai-Tibet Plateau (QTP) region may be associated with the complex topography of the area and the limitations in the background model used in the COSMIC profile retrieval. Furthermore, negative refractivity bias between COSMIC and radiosonde data occurs below 5 km and is large in wet southern China, with a value of less than 1%. This result may be related to more humid conditions and super-refraction.

1. Introduction

Atmospheric temperature, pressure and humidity profiles are essential for meteorological research. Notably, accurate and stable long-term observations of the vertical structure of atmospheric temperature are crucial for climate change monitoring. Radiosondes are the only operational instruments that have provided these atmospheric profiles in the troposphere and lower stratosphere for more than three decades, and they have been widely used in climate studies [1,2,3,4]. However, radiosondes are launched only twice (00 and 12 UT) per day during operation, and their spatial distribution is inhomogeneous with a relatively low density, particularly over plateaus, deserts, oceans, and polar regions. Additionally, the atmospheric temperature trends estimated from radiosonde observations are sensitive to the objective selection of radiosonde samples [5,6,7,8]. The selection of radiosonde samples can result in differences in temperature trends, as radiosonde observations are obtained with various types of radiosondes manufactured by different countries. Therefore, it is critical to have accurate, consistent, and stable observations from different satellite missions to improve climate change monitoring. The Global Positioning System (GPS) radio occultation (RO) limb-sounding technique uses radio signals from the GPS satellites propagating through the Earth’s atmosphere. The GPS RO technique has the advantages of high accuracy, high precision and high vertical resolution, with no contamination from clouds, no system calibration requirement, and no instrument drift [9,10,11,12,13].These features make GPS RO particularly useful for climate studies [14,15,16,17,18,19]. Early studies have shown that GPS RO soundings from the first RO mission, GPS Meteorology (GPS/MET), agree with those from radiosondes and large-scale analyses to better than 1.5 K from 530 km of altitude [10,20,21,22,23]. Furthermore, GPS RO datasets are relatively new and are valuable sources of observational information on temperature and humidity [24,25,26,27,28,29,30].
The successful launch of the six satellites in the Constellation Observing System for Meteorology, Ionosphere, and Climate (COSMIC, also called FORMOSAT-3 in Taiwan) project in April 2006 began a new era of GPS atmospheric remote sensing [31,32,33,34,35,36,37]. COSMIC is a joint mission between Taiwan and the United States (U.S.) with the goal of demonstrating the use of constellation GPS RO data in numerical weather prediction (NWP), climate monitoring, and space weather forecasting. With the ability to perform both rising and setting occultation, COSMIC has produced approximately 2500 soundings per day with global coverage since mid-2007. However, the number of COSMIC soundings has been gradually decreasing since about 2010 as the COSMIC satellites reach the end of their designed 5-year lifetime. The median values of COSMIC-derived dry temperature differences are estimated to be better than 0.05 K from 8 km to 30 km [32,38]. According to previous studies, the temperature profiles of different radiosonde types generally agree well with those of COSMIC, with mean differences of less than 0.5 K and standard deviations of less than 2.0 K [4,11]. Because COSMIC RO can provide atmospheric temperature, pressure, and humidity profiles with a 100-m vertical resolution in all weather conditions, it makes up for the lack of operational radiosonde soundings with high spatiotemporal distributions, especially over deserts, oceans, and polar regions [4,11,29,38,39,40].
Eastern China is mostly a plains region, but plateaus and deserts occupy most areas of western China, notably, the Qinghai-Tibet Plateau (QTP), which occupies approximately one fourth of China. The QTP is a source of dynamic and thermodynamic turbulence and has a profound influence on atmospheric circulation patterns at various temporal and spatial scales [41,42,43,44,45]. Many severe weather systems that have impacted China in the past have been linked to the dynamic and thermodynamic influences of the QTP [46,47,48,49]. Simulation studies have indicated that assimilated atmospheric moisture, temperature, and pressure information over the QTP and surrounding areas is very important and useful in the forecasting of precipitation in downstream areas [50]. However, as shown in Figure 1, the spatial distribution of operational radiosonde stations, while reasonably adequate in eastern China, is rather sparse in western China, especially over the QTP. As noted above, COSMIC RO can provide atmospheric temperature, pressure, and humidity profiles in all weather conditions, thereby overcoming the lack of operational radiosonde soundings with high spatiotemporal distributions, especially in the QTP and desert areas. Although some studies have compared COSMIC RO and radiosonde observations [4,11,51,52,53], they have focused on temperature, and few comparisons of pressure and humidity have been reported over China, especially for the QTP region. In this study, using radiosonde soundings with a high vertical resolution of ~10 m, we investigate the discrepancies in atmospheric temperature, pressure, and vapor pressure profiles obtained from COSMIC RO data compared to radiosonde observations in China. This paper is organized as follows. In Section 2, we briefly describe the instruments, measurements, and methods employed. Section 3 compares the COSMIC atmospheric wet profiles with matched radiosonde soundings in China. The results are presented and discussed in Section 4, and Section 5 summarizes our findings.

2. Data and Methodology

The GPS RO limb-sounding technique for sounding the atmosphere of the Earth was first demonstrated by the proof-of-concept GPS/MET experiment in 1995–1997 [21]. Preliminary results showed that accurate vertical temperature profiles from an altitude of approximately 40 km to about 5 km can be obtained using the GPS limb-sounding technique. The COSMIC mission placed six small microsatellites into six different orbits at 700–800 km above the Earth’s surface. These satellites formed a unique low Earth orbit (LEO) constellation that receives signals from U.S. GPS satellites. By measuring the phase delay of radio waves from GPS satellites as they are occulted by the Earth’s atmosphere, accurate and precise vertical profiles of the bending angles of radio-wave trajectories are obtained for the lower atmosphere. Under the assumption of the spherical symmetry of the refractive index in the atmosphere, vertical profiles of the bending angle, and therefore the refractivity, can be derived from the raw RO measurements of the excess Doppler shift of the radio signals transmitted by GPS satellites [9,12,54]. The profiles of refractivity can then be used to generate the so-called dry and wet atmospheric profiles. For dry air, the density profiles are first calculated using the relationship between density and refractivity. The dry temperature profiles are then derived from the density profiles based on the hydrostatic equation and the ideal gas law under the assumption that the partial pressure of water vapor is zero. The wet retrieval algorithm estimates both the temperature and water vapor profiles using the 1DVar (one-dimentional variation) algorithm [39,55,56]. 1DVar seeks the optimal solution that reproduces the observed refractivity most closely while satisfying other imposed constraints, amongst many physically admissible combinations of state variables.
The COSMIC data used in this study include the atmospheric profiles of temperature, pressure, vapor pressure, and analyzed refractivity in the wetPrf (wet profile) suite of products [51]. These profiles are based on 1D variational analysis using low-resolution analysis data from the European Centre for Medium-Range Weather Forecasts (ECMWF). Gridded analysis or short-term forecasting is used to separate the pressure, temperature, and moisture contributions to refractivity. Finally, these wet profiles are interpolated to 100-m height intervals from the geometric height of sea level to 40 km.
Because operational radiosonde data are reported only at mandatoryand significant pressure levels and at a lower vertical resolution than COSMIC RO data [4], COSMIC atmospheric profiles are generally interpolated to the vertical levels of radiosonde profiles. This process results in fewer available data for COSMIC atmospheric profiles. In this study, high vertical-resolution profiles of temperature, pressure, and humidity are obtained from raw radiosonde soundings (launched twice daily at 00 and 12 UTC) with a vertical resolution of ~10 m or a 1-s temporal resolution [57]. This spatial resolution is higher than the 100-m vertical resolution of the COSMIC wetPrf profiles and can improve the analysis. Figure 1 shows the distribution and altitudes of the 120 radiosonde stations used in this study. The radiosonde profiles from 2014 to 2015 were collected and used to validate the contemporaneous COSMIC-retrieved profiles of temperature, pressure, vapor pressure, and analyzed refractivity. These radiosonde profiles were observed with the same GTS1 radiosondes manusfactured by China, which came into use as the new generation upper-air sounding sysytem in operation in China since about 2010. The accuracies of temperature, humidity, and pressure for the GTS1 radiosondes are 0.2 K, 5% and 2 hPa, respectively, with corresponding resolutions of 0.1 K, 1% and 0.1 hPa. Note that the radiosonde refractivity (N) can be calculated from the radiosonde temperature (T in K), pressure (P in hPa), and vapor pressure (e in hPa), using the following equation [39,58]:
N = 77.6 P T + 3.73 × 10 5 e T 2
The matching method of He et al. [4] is adopted in this study. Radiosonde measurements within 2 h and 300 km of COSMIC RO soundings are compared to those from the COSMIC satellites between 2014 and 2015. If no matching COSMIC profile is available, the radiosonde sounding is not used. If more than one matching COSMIC profile exists, then the COSMIC profile with lowest perigee point closest to the radiosonde station is used. Because the radiosonde data have a higher vertical resolution than COSMIC wetPrf profiles, we interpolate the radiosonde profiles to the vertical levels of the COSMIC wetPrf profiles. The biases and root mean square errors (RMSEs) between the COSMIC wetPrf profiles and the radiosonde measurements of each parameter (e.g., temperature, pressure, vapor pressure, and analyzed refractivity) are calculated. As this study is also to access the regional differences of the discrepancies between COSMIC and radiosonde measurements over China, it is better to calculate the biases and RMSEs between COSMIC and radiosonde profiles in vertical means from 0 to 40 km.

3. Results

3.1. Temperature Differences between COSMIC and Radiosonde Data

At each station, the bias between the coupled COSMIC and radiosonde temperatures is calculated at all height levels and then averaged. Figure 2 presents the vertically averaged COSMIC temperature biases compared to radiosonde observations at 120 stations in China. The number of radiosonde stations for each bias class is listed in parentheses. In general, the COSMIC temperature bias is negative in northern China and positive in southern China. Moreover, the large temperature differences mostly appear in western China, which is a high-altitude region compared to eastern China. Among the 120 stations, 118 stations (98%) have biases with magnitude less than 1.0 K. The maximum COSMIC temperature bias of 1.03 K occurs at a station on the eastern QTP, and the minimum bias of −1.45 K occurs at a station on the southern QTP. On average, the COSMIC temperature bias compared to radiosonde observations in China is −0.1 K. Additionally, a positive correlation is found between the absolute temperature bias and station altitude, with a correlation coefficient of 0.3830 at a significance level of greater than 99%. This indicates that the absolute temperature bias is positively correlated with station altitude in statistics in a certainway, but not on the whole, because many factors may impact on the temperature bias between COSMIC and radiosonde.
The temperature RMSEs between COSMIC and radiosonde data in China are shown in Figure 3. Overall, 36 stations (30%) have an RMSE less than 4 K, and 65 stations (54%) have an RMSE between 4 K and 6 K. The maximum temperature RMSE occurs at a station in the southern QTP with a value of 10.64 K. In general, the temperature RMSE is larger in western China than in eastern China, especially in the QTP. The average temperature RMSE between COSMIC and radiosonde data in China is 4.84 K. Additionally, a positive correlation is observed between the temperature RMSE and station altitude, with a correlation coefficient of 0.2414 at a significance level of greater than 99%. This implies that, as with the temperature bias, the temperature RMSE between COSMIC and radiosonde is also impacted by station altitude in a certain way.

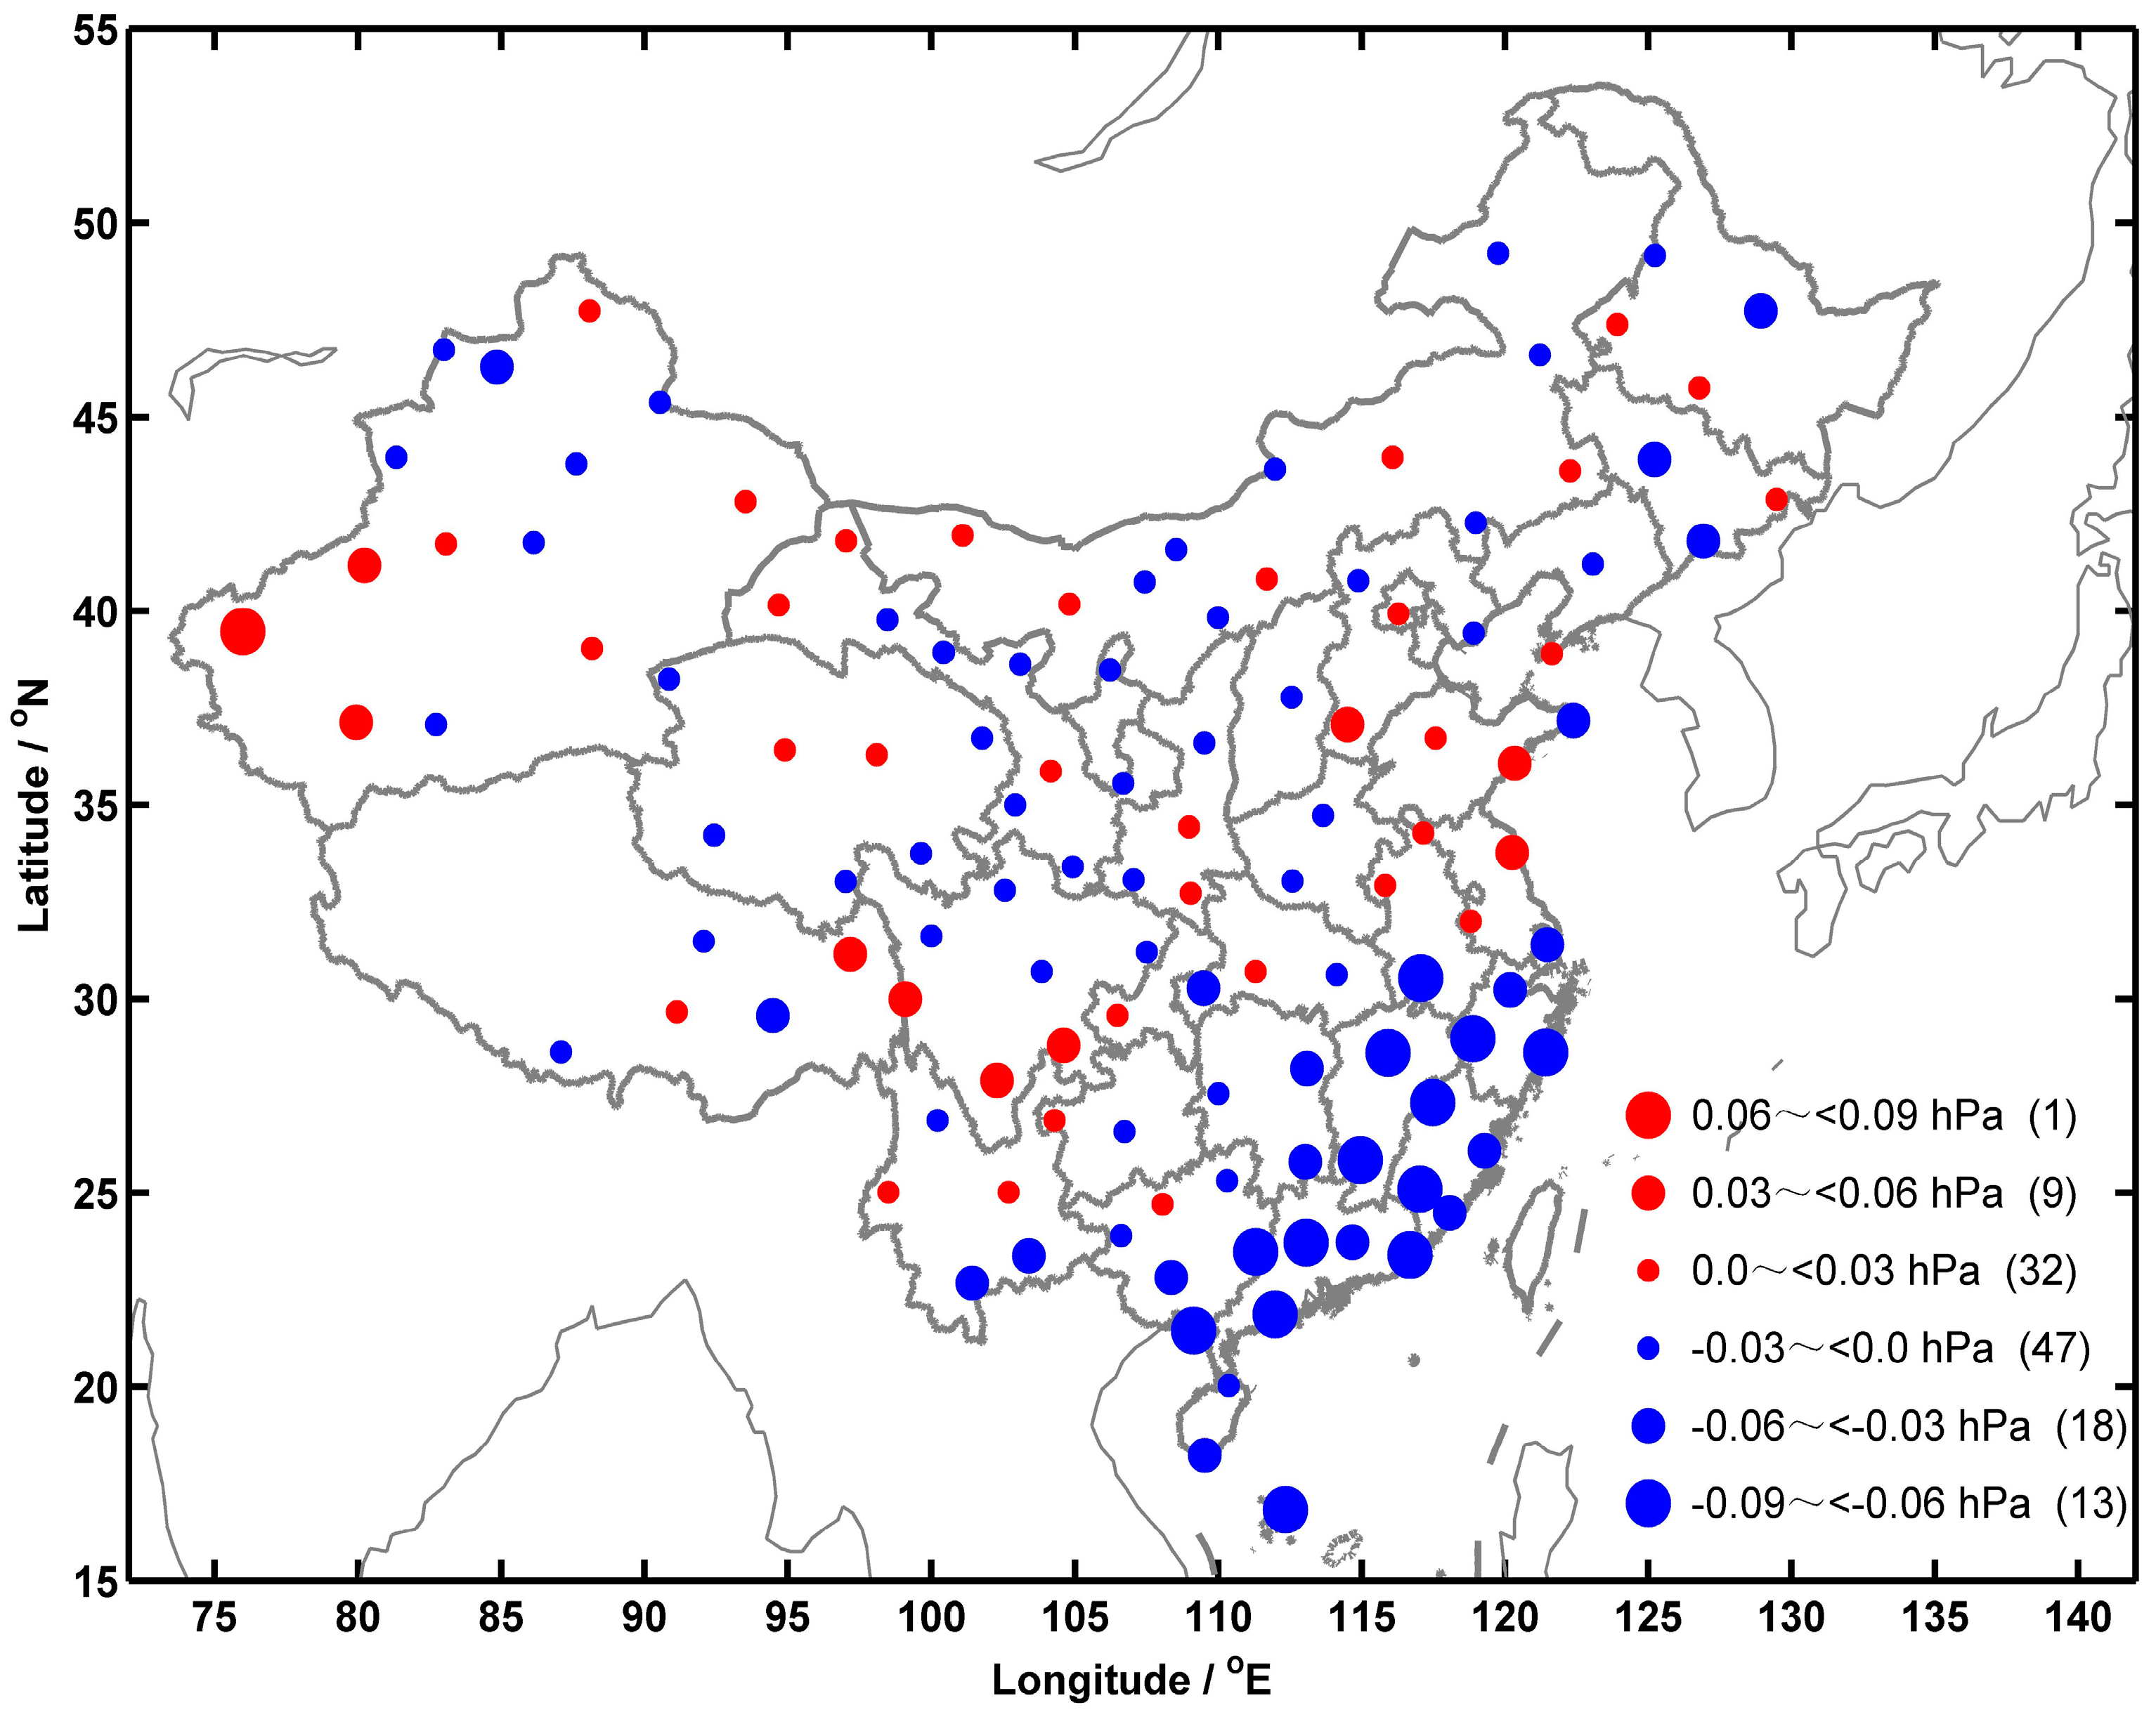
3.2. Pressure Differences between COSMIC and Radiosonde Data

As shown in Figure 4, the vertically averaged COSMIC pressure biases compared to radiosonde observations in China are mostly negative in northern China and some parts of central China, but positive in the remainder of China. All the pressure biases vary between −0.93 hPa and 3.43 hPa. Among the 120 stations, 76 stations (63%) have biases with a magnitude of less than 1 hPa, and 32 stations (27%) with a magnitude of between 1 hPa and 2 hPa. The large pressure biases mostly appear in the QTP and in southern China, and the maximum pressure bias of 3.43 hPa occurs at a station in southern China. On average, the COSMIC pressure bias in China is 0.69 hPa. Notably, the COSMIC pressure bias varies from positive to negative with increasing station latitude, and a negative correlation is found between the absolute pressure bias and the station latitude, with a correlation coefficient of −0.4558 at a significance level of greater than 99%. This indicates that station latitude is one of the impact factors on the pressure bias between COSMIC and radiosonde.
Figure 5 presents the pressure RMSEs between COSMIC and radiosonde data in China. The pressure RMSE is small in eastern China and large in southern and north-western China. There are 63 stations (53%) with an RMSE of less than 10 hPa, and 49 stations (41%) with an RMSE of between 10 hPa and 20 hPa. Like the pressure bias, the large pressure RMSEs mostly appear in southern China. The minimum pressure RMSE is 2.31 hPa, the maximum is 29.77 hPa, and the average pressure RMSE is 10.66 hPa.

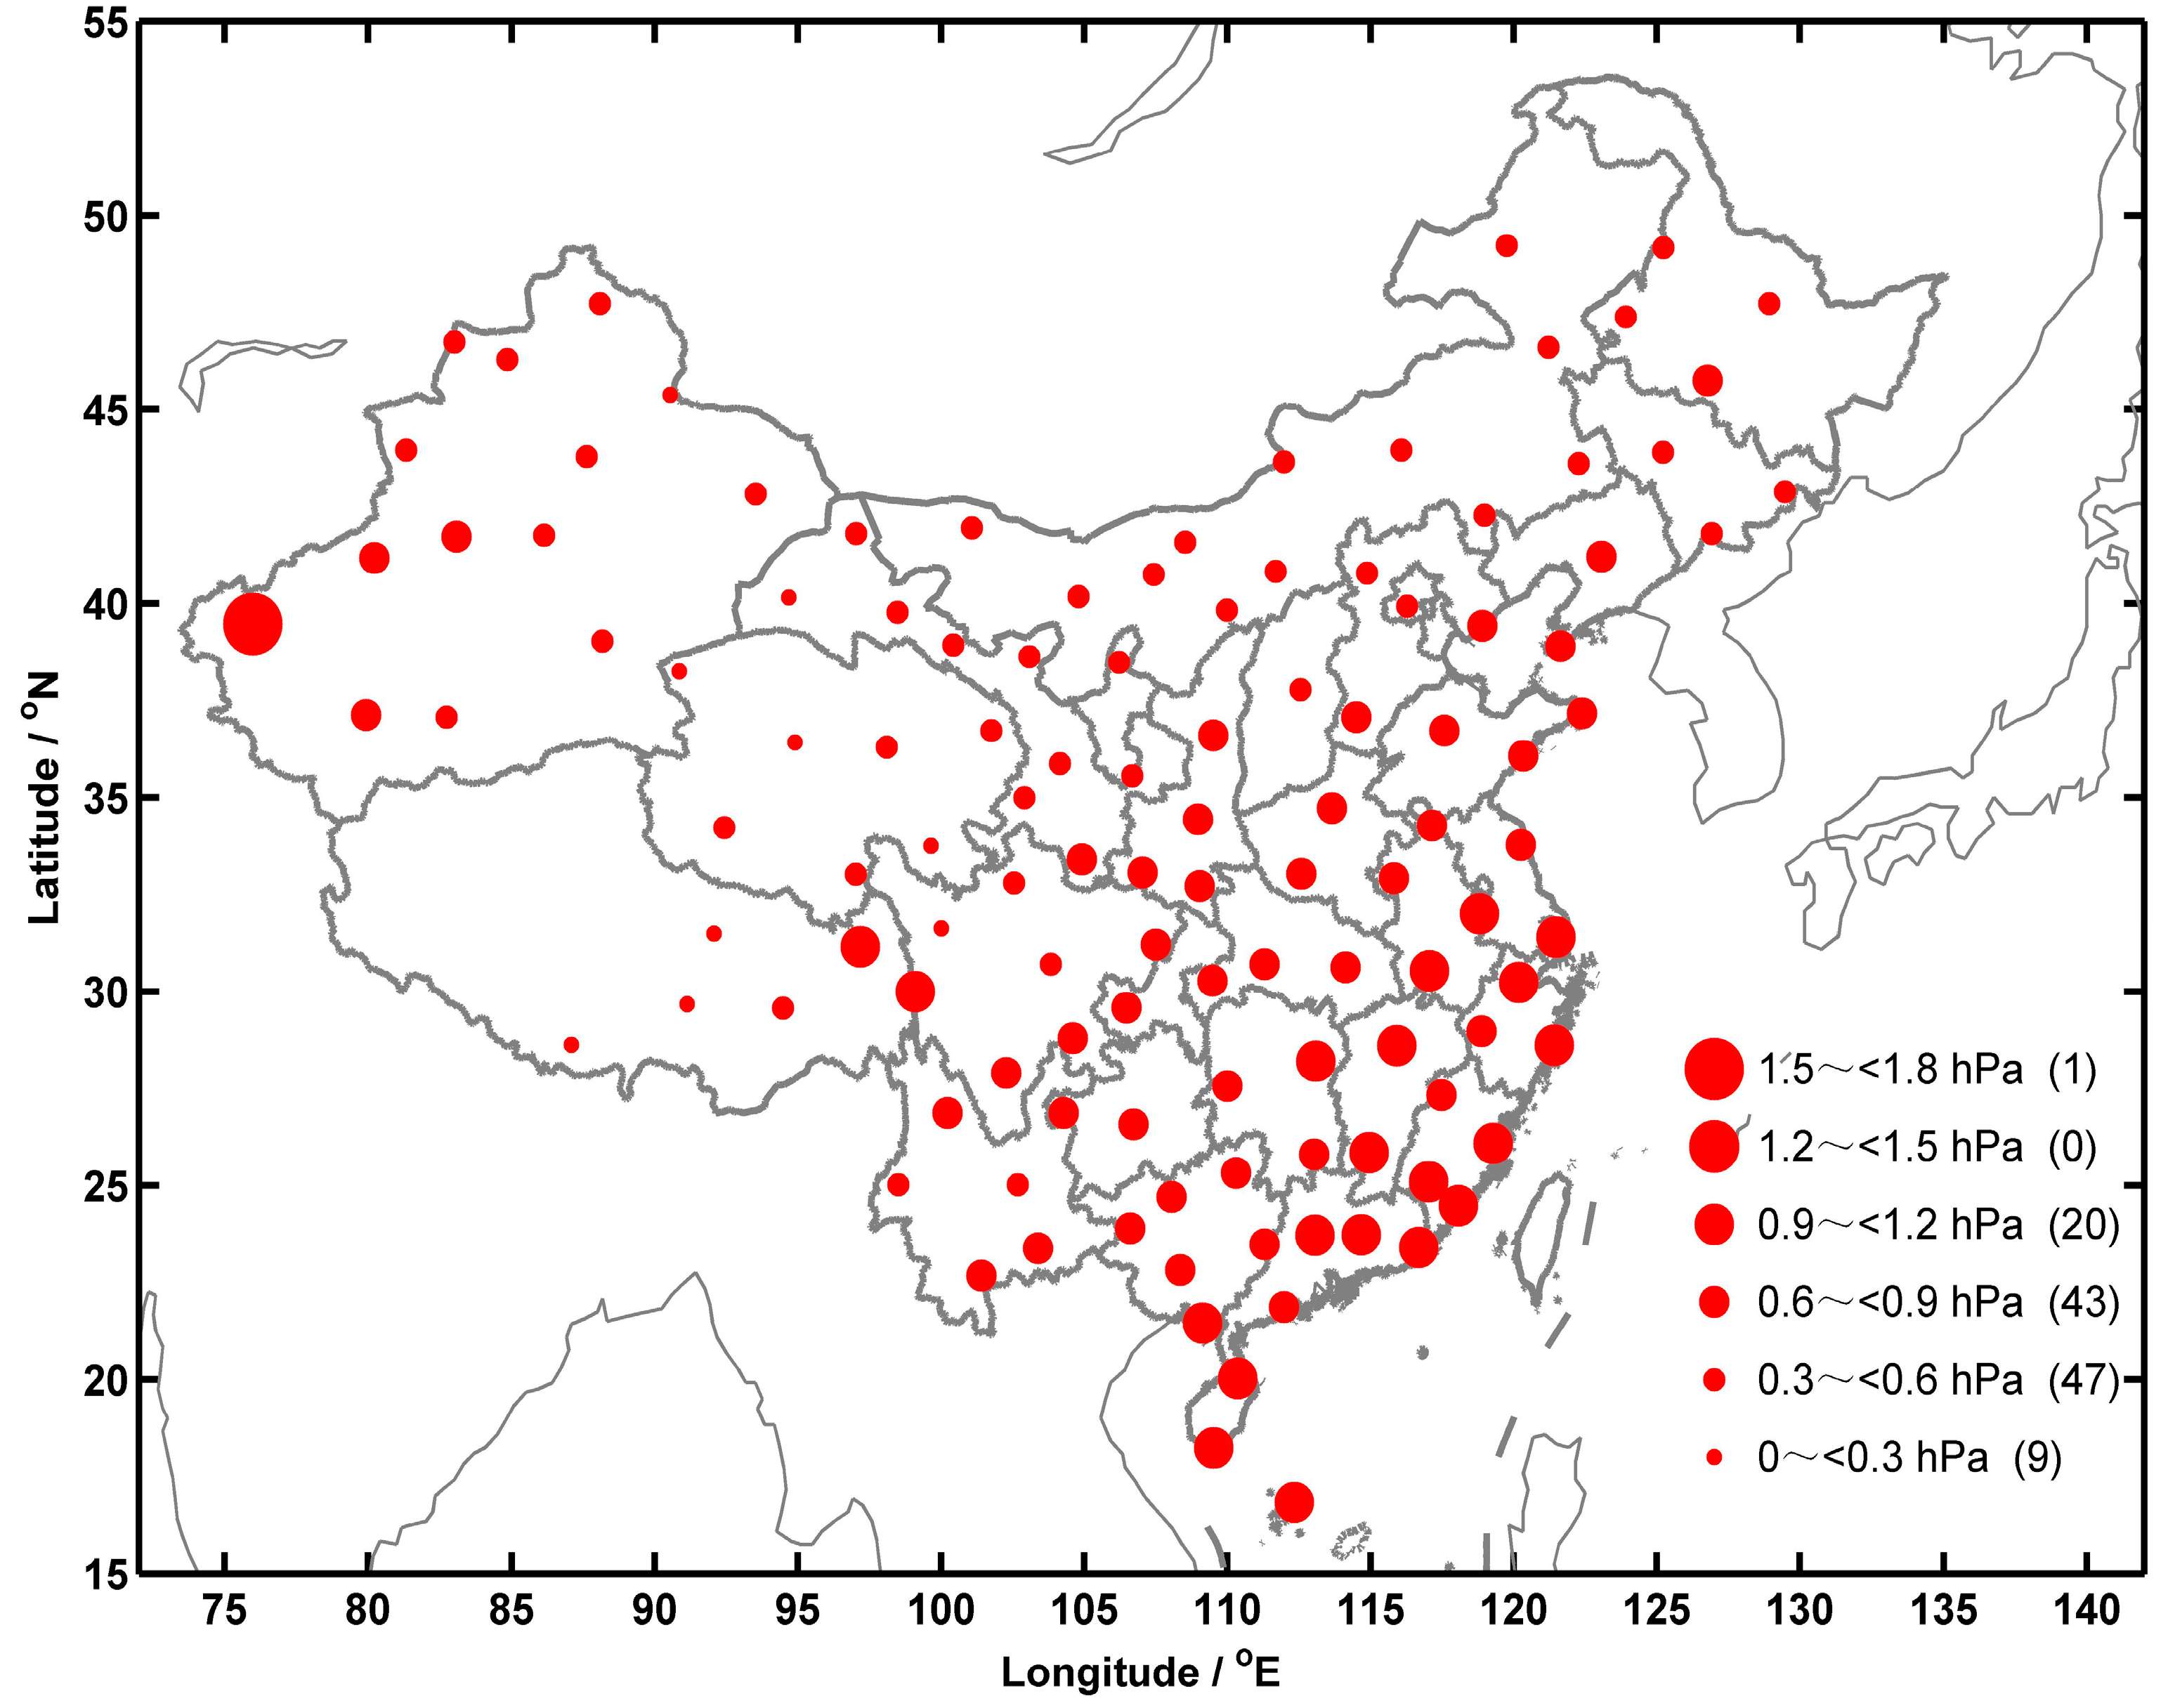
3.3. Vapor Pressure Differences between COSMIC and Radiosonde Data

The vertically averaged COSMIC vapor pressure biases compared to radiosonde observations in China are presented in Figure 6. The COSMIC vapor pressure exhibits large negative biases in southern and south-eastern China, while the maximum positive bias occurs at a station in north-western China. The vapor pressure biases are insignificant in the remainder of China. Among the 120 stations, 79 stations (66%) have biases with a magnitude of less than 0.03 hPa, and 27 stations (23%) with a magnitude of between 0.03 hPa and 0.06 hPa. The vapor pressure bias varies from −0.09 hPa to 0.09 hPa, and the average value is −0.01 hPa. Like the pressure bias, a negative correlation is found between the absolute vapor pressure bias and station latitude, with a correlation coefficient of −0.4895 at a significance level of greater than 99%.This indicates that station latitude is also one of impact factors on the vapor pressure bias between COSMIC and radiosonde.
Figure 7 presents the vapor pressure RMSEs between COSMIC and radiosonde data in China. Except for the maximum RMSE at a station in north-western China, large RMSEs mainly occur in southern China. There are 99 stations (82%) with an RMSE of less than 0.9 hPa, and 20 stations (17%) with an RMSE of between 0.9 hPa and 1.2 hPa. The minimum RMSE of 0.20 hPa occurs at a station in central QTP, while the maximum value of 1.64 hPa occurs at the westest station in China, and the average vapor pressure RMSE is 0.64 hPa. Additionally, a negative correlation exists between the vapor pressure RMSE and station altitude, with a correlation coefficient of −0.5449 at a significance level of greater than 99%. This implies that the vapor pressure RMSE between COSMIC and radiosonde is impacted by station altitude in a certain way.

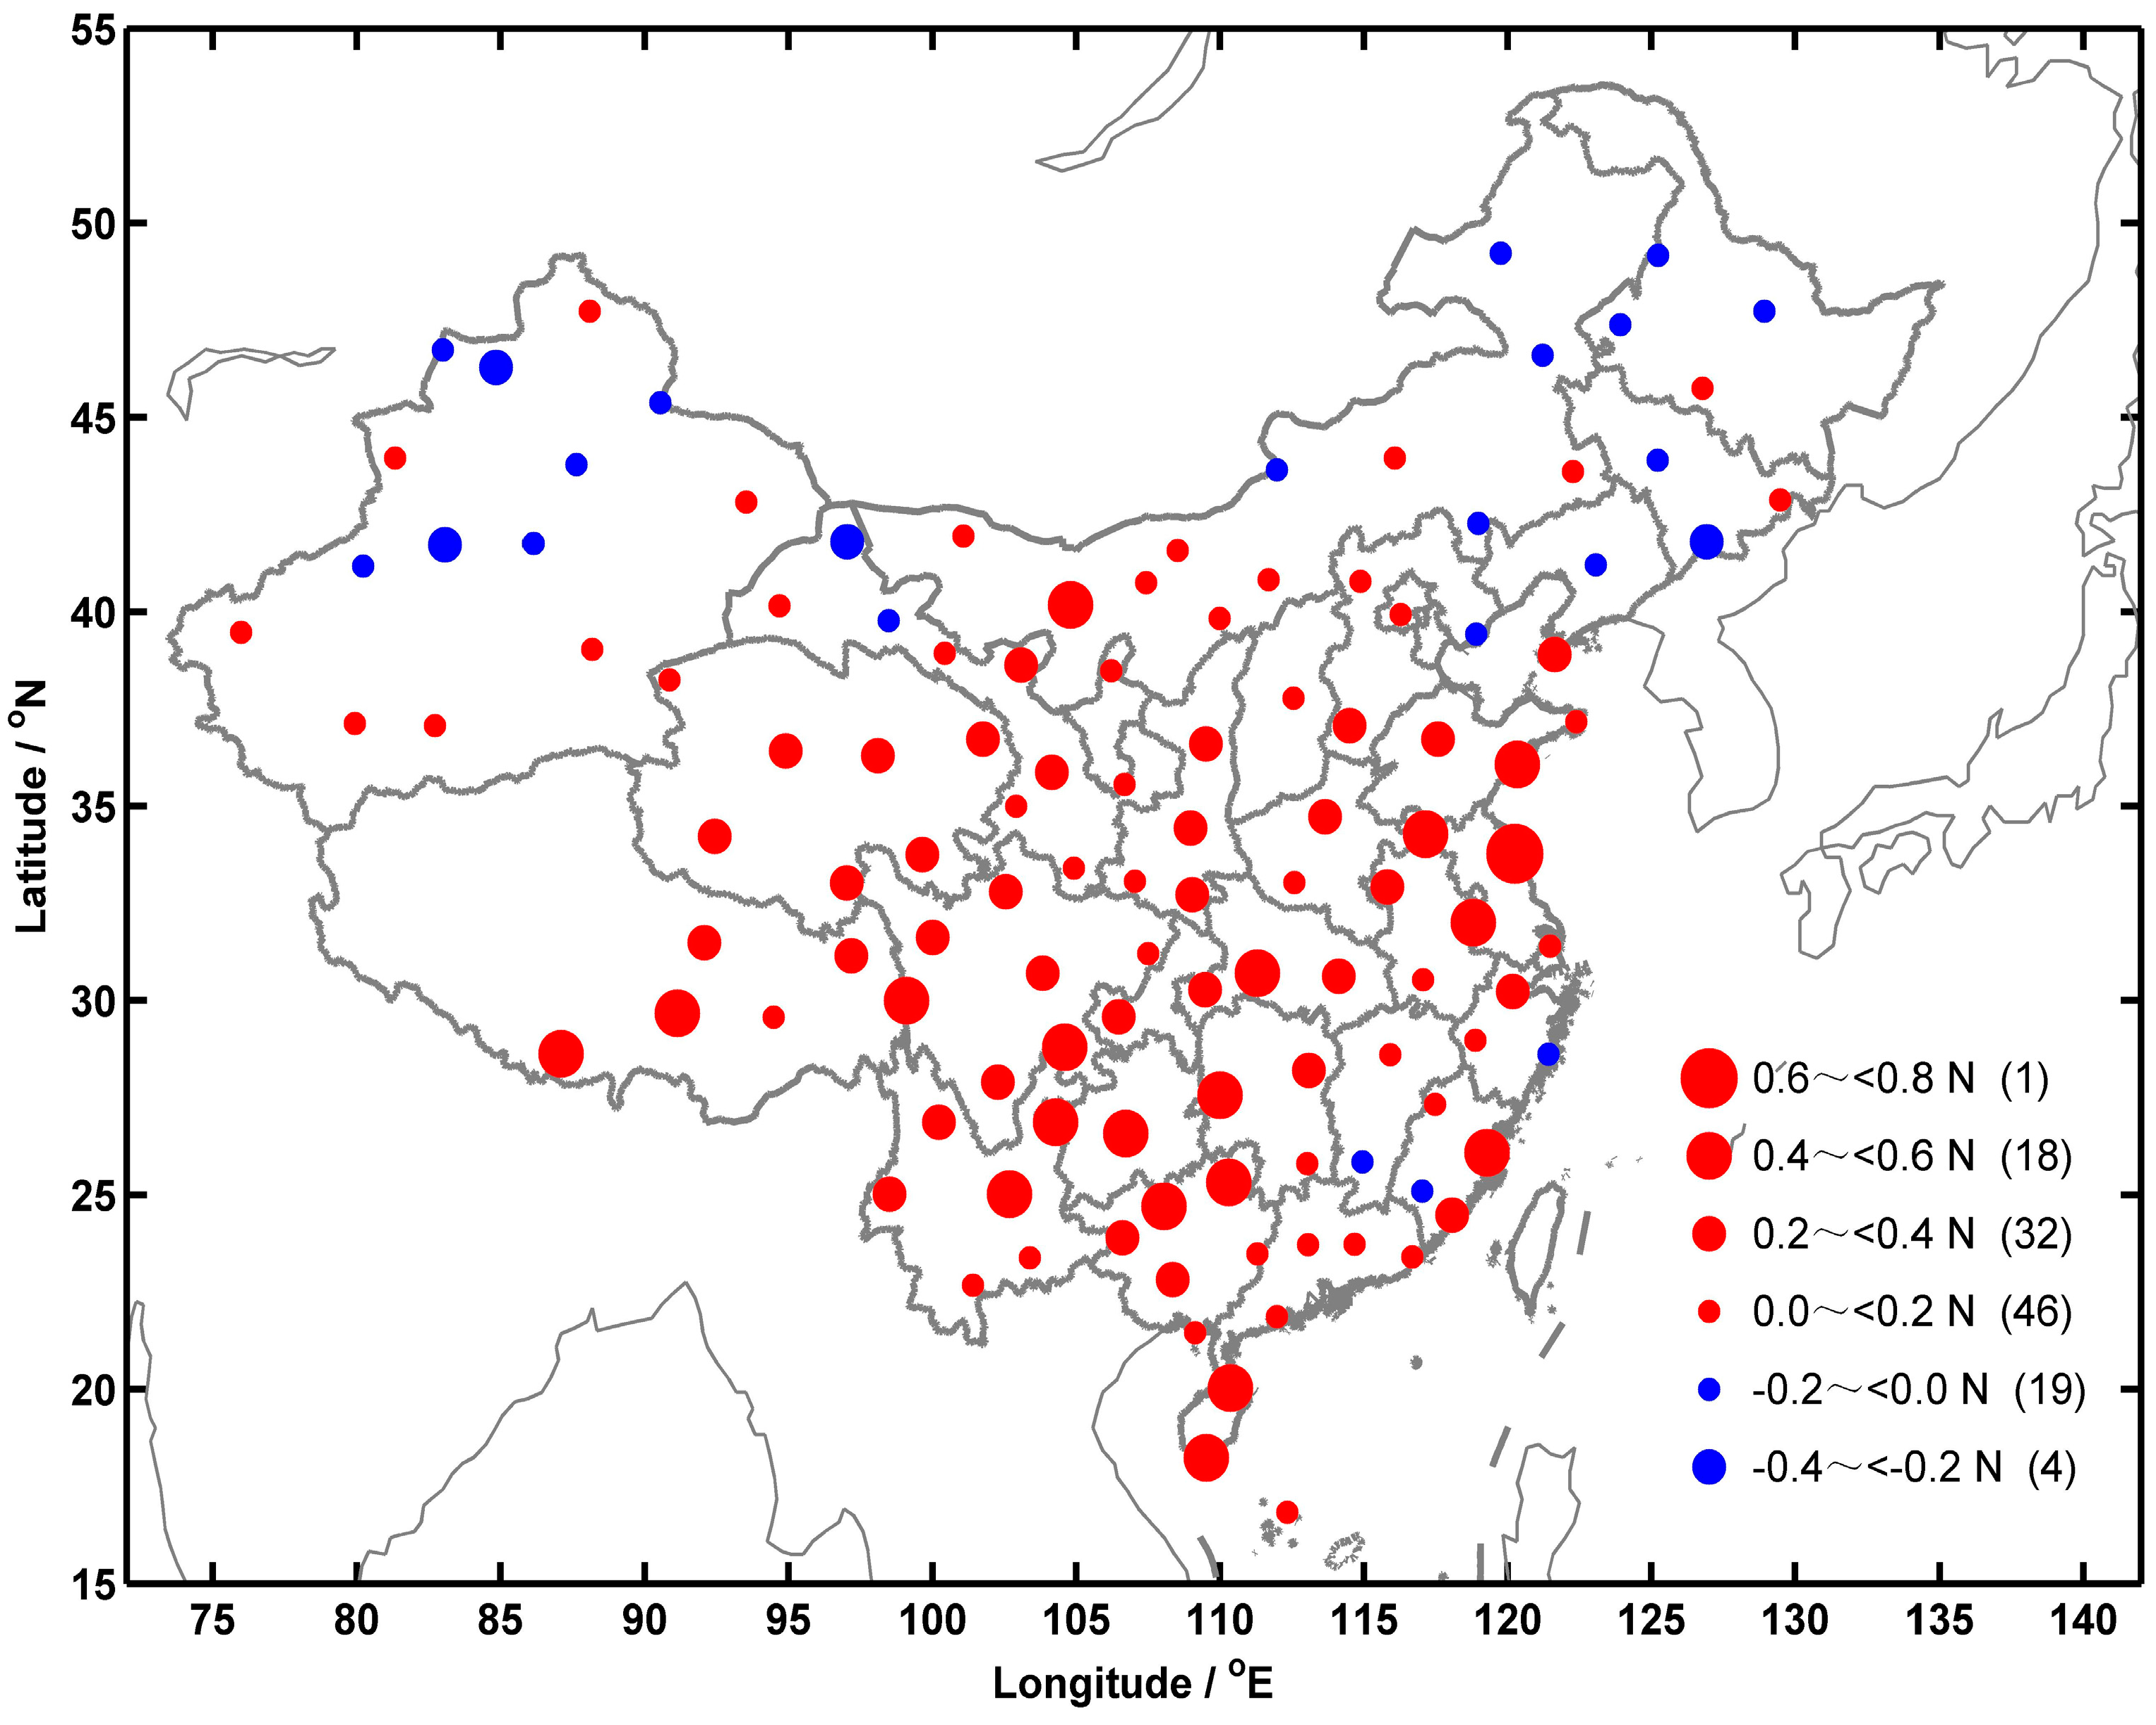
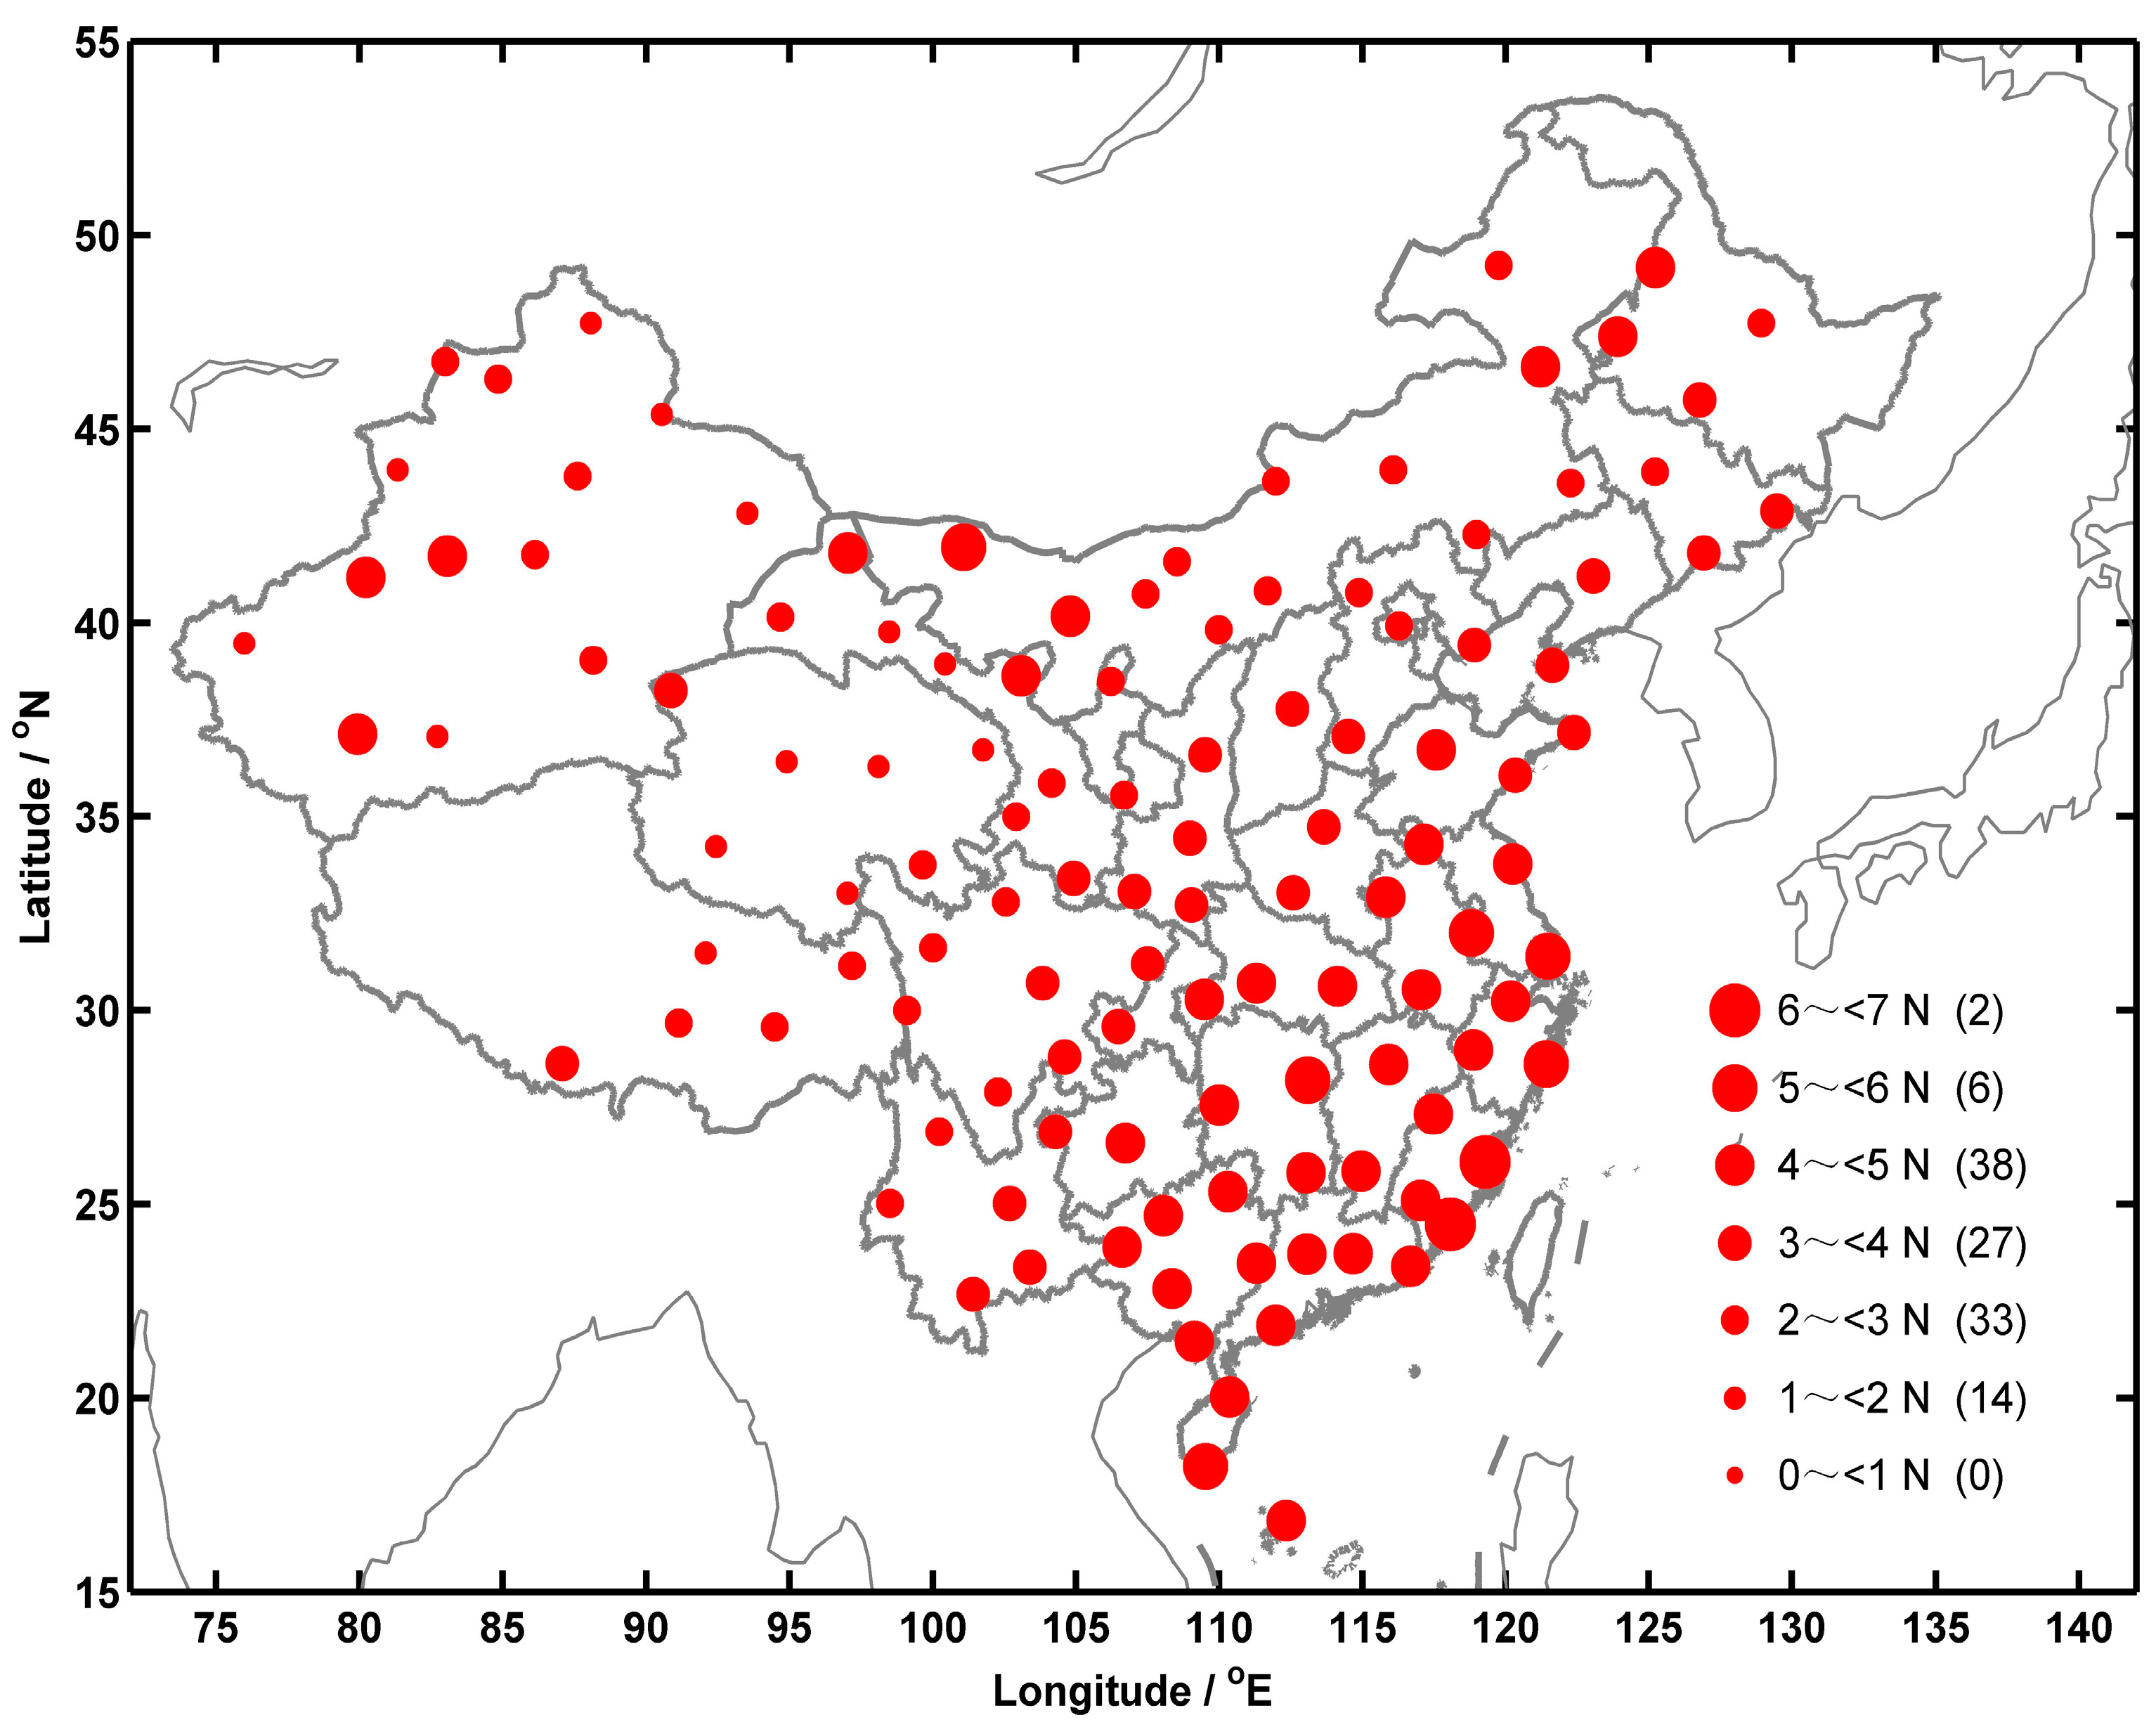
3.4. Refractivity Differences between COSMIC and Radiosonde Data

According to Equation (1), radiosonde refractivity is calculated based on the radiosonde temperature, pressure and humidity profiles, and the results are compared with the COSMIC refractivity. The vertically averaged COSMIC refractivity biases compared to radiosonde observations in China are presented in Figure 8. The refractivity biases are mainly positive; however, some negative biases occur in northern China. The positive refractivity biases are small in northern and south-eastern China and large in the remainder of China. Among the 120 stations, 65 stations (54%) have biases with a magnitudeof less than 0.2 N, and 36 stations (30%) with a magnitude of between 0.2 N and 0.4 N. The refractivity bias varies from −0.29 N to 0.63 N, with an average value of 0.17 N. A negative correlation is found between the absolute refractivity bias and station latitude, with a correlation coefficient of −0.3846 at a significance level of greater than 99%. This indicates that station latitude is one of impact factors on the refractivity bias between COSMIC and radiosonde.
Figure 9 presents the refractivity RMSEs between COSMIC and radiosonde data in China. The refractivity RMSE is generally larger in eastern China than in western China. Additionally, the refractivity RMSE varies from 1.37 N to 6.12 N. There are 47 stations (39%) with an RMSE of less than 3 N, and 65 stations (54%) with an RMSE of between 3 N and 5 N. On average, the refractivity RMSE between COSMIC and radiosonde data in China is 3.42 N. Like the vapor pressure RMSE, a negative correlation exists between the refractivity RMSE and station altitude, and the correlation coefficient is −0.6102 at a significance level of greater than 99%. Note that the refractivity RMSE also has a negative correlation with station latitude, with a correlation coefficient of −0.4505 at a significance level of greater than 99%. These results imply that both station altitude and latitude can impact the refractivity RMSE between COSMIC and radiosonde in a certain way.

4. Discussion

According to He et al. [4], the dry temperature derived from COSMIC has a bias of ‒0.03 K and an RMSE of 1.98 K compared to radiosonde observations from 12 km to 25 km in China; and below 12 km, the dry temperature is significantly lower than the actual temperature because water vapor effects become important. In our results, the average temperature difference between COSMIC and radiosonde data from 0 to 40 km in China is −0.10 K, with an RMSE of 4.84 K. These results may imply that the increase in water vapor in the troposphere increases the COSMIC cold temperature bias compared to radiosonde observations and the RMSE between them. Moreover, the absolute temperature bias between COSMIC and radiosonde data has a positive correlation with station altitude. Thus, the temperature difference between COSMIC and radiosonde data increases in the QTP, and the temperature RMSE between COSMIC and radiosonde data exhibits the same trend. Because a background atmospheric state is used in the retrieval of the temperature profile in COSMIC RO [39,59] and the model temperature bias is large in the QTP area because of its complex topography [60], the limited ability of the background may contribute to the temperature difference between COSMIC and radiosonde data, especially in the QTP region.
A few studies have compared the pressure and vapor pressure profiles of COSMIC and radiosonde data over China especially for the QTP region [51,52,53]. In this study, the COSMIC pressure has an average bias of 0.69 hPa in China, and the average RMSE is 10.66 hPa. Moreover, the absolute pressure bias between COSMIC and radiosonde data has a negative correlation with station latitude, yet this correlation is not significant for the pressure RMSE. Note that both the pressure bias and RMSE are generally larger in the QTP region than in other areas at the same latitude, and this finding may be related to the uncertainty of the model and the complex terrain in the QTP area.
For the vapor pressure, the average bias and RMSE between COSMIC and radiosonde data in China are −0.01 hPa and 0.64 hPa, respectively. As shown by Ware et al. [21], the relationship between errors in temperature and water vapor pressure, under the assumption of no errors in N or P, is as follows:
Δ e ( 2 T N 77.6 P ) 3.73 × 10 5 Δ T ,
where e is vapor pressure in hPa, T is temperature in K, N is refractivity, and P is pressure in hPa. Δe and ΔT are the errors of vapor pressure and temperature, respectively.
For typical values of N = 300, P = 1000 hPa, and T = 273 K, the following expression is valid:
Δ e 0.23 Δ T   or   Δ T 4.35 Δ e
Specifically, T would have to be known to within an accuracy of 1 K to obtain vapor pressure estimates accurate to within 0.23 hPa. Because the temperature bias is −0.10 K with an RMSE of 4.84 K in this study and there are errors in P and N, the vapor pressure bias of −0.01 hPa with an RMSE of 0.64 hPa is reasonable. Additionally, the absolute vapor pressure bias has a negative correlation with station latitude. However, the vapor pressure RMSE is negatively correlated with station altitude. The small vapor pressure RMSE in the QTP region may be due to the low vapor pressure in this area.
The COSMIC refractivity profile from 0 to 40 km exhibits little difference compared to radiosonde observations in China, and the average bias between them is 0.17 N with an RMSE of 3.42 N. As with the vapor pressure, the absolute refractivity bias has a negative correlation with station latitude, while the refractivity RMSE is negatively correlated with the station altitude. As vapor pressure is generally large in low-latitude and low-altitude areas, these findings may imply that atmospheric water vapor influences the measurement accuracy of COSMIC refractivity. Moreover, because atmospheric water vapor generally decreases with height, the vertical mean biases between COSMIC and radiosonde refractivities from 0–5 km, 5–10 km, 10–15 km and 15–20 km are performed, respectively, and the results are presented in Figure 10. It is clear that the refractivity difference between COSMIC and radiosonde data below 5 km is largest in the coastal areas of China, where the atmospheric content of water vapor is higher than in other part of China. From 5 to 10 km, as the atmospheric content of water vapor decreases and the water vapor difference between coastal areas and other areas diminishes, the refractivity bias between COSMIC and radiosonde data decreases, but is still relatively large in wet southern China. Above 10 km, atmospheric water vapor is sparse; therefore, the refractivity bias between COSMIC and radiosonde data varies minimally, and the difference between 10–15 km and 15–20 km is also insignificant. Furthermore, the atmospheric water vapor similarly affects the refractivity RMSE between COSMIC and radiosonde data. As shown in Figure 11, the refractivity RMSE between COSMIC and radiosonde data below 10 km, especially below 5 km, are larger than those above 10 km. The refractivity difference between COSMIC and radiosonde data is closely related to the atmospheric water vapor, and its spatial distribution and variation with altitude exhibit a similar pattern as that of the vapor pressure. Additionally, previous studies found a negative refractivity bias in the lower and middle troposphere [10,61,62,63]. Comparing Challenging Minisatellite Payload (CHAMP) observations with ECMWF analysis results, Hajj et al. [64] stated that the negative fractional refractivity difference was nearly 1–4% below 10 km. Anthes et al. [33] found that negative refractivity bias only occurs below 3 km for COSMIC data with a value of ~1%. Our results indicate that the negative refractivity bias of COSMIC data occurs below 5 km and mainly appears in wet regions, especially southern China, which exhibits the largest difference of −2.2 N (less than 1%). This result may imply that enhanced atmospheric absorption and water vapor refraction contributes to the large refractivity difference between COSMIC and radiosonde data in the lower troposphere [65]. Moreover, super-refraction is also likely a cause of the negative refractivity bias in this region [62].
Because a model background is used in the retrieval of COSMIC wetPrf profiles of 0–10 km, the mean bias and RMSE profiles of COSMIC retrievals compared to radiosonde are investigated to assess the impact of the background uncertainty on them. As shown in Figure 12a, the mean temperature bias becomes negative below 10 km and reaches the peak at around 5 km height, which suggests that the cold temperature bias between COSMIC and radiosondeis related to more humid conditions in the troposphere. Moreover, the worst temperature bias profile, which occurs in the QTP, has larger bias than the mean temperature bias profile at 4–7 km levels, and the mean temperature bias decreases below 4 km where most samples in the QTP are not available. As the model temperature bias is large in the QTP area because of its complex topography [60], these results may imply that the background uncertainty and the QTP’s complex terrain contribute to the larger temperature bias in the QTP region. Figure 12b indicates that the mean pressure bias between COSMIC and radiosonde is reasonable. Furthermore, the pressure bias and RMSE profiles for 28–37 N latitude regions show that the worst bias profiles mostly occur in the QTP (figures not shown). The authors tend to think it is also related to the background uncertainty and the QTP’s complex terrain, and future work is still necessary to explore this issue. The mean vapor pressure bias and RMSE between COSMIC and radiosonde increase as height decreases below 10 km, and the negative vapor pressure bias is clear below 5 km (see Figure 12c). Note that the mean bias and RMSE profiles for refractivity are in the same situation, and the negative refractivity bias occurs below 5 km (see Figure 12d). These results support the idea that the large refractivity discrepancy between COSMIC and radiosonde in the lower troposphere is related to more humid conditions and super-refraction [62,65].
Note that the sample selection and data-matching method may impact the results of comparison between COSMIC and radiosonde measurements. Table 1 presents the mean temperature bias and standard deviation (RMSE) between COSMIC and radiosonde data reported in some previous studies [4,51,66,67]. Regional differences are found in temperature bias and RMSE. Moreover, the differences in temperature bias and RMSE are also related to the data-matching method and height levels of the profile. Additionally, the larger temperature RMSE reported in this study may come from the lower troposphere and in the 30–40 km height levels, and future work is necessary in order to make a safe conclusion.

5. Conclusions

The COSMIC profiles of temperature, pressure, vapor pressure, and refractivity from 0 to 40 km are compared with radiosonde soundings in China between 2014 and 2015. Results from this study show that the average temperature difference between COSMIC and radiosonde data is −0.10 K, and the temperature difference is positively correlated with the station altitude. The temperature difference increases in the QTP region, mainly because of its complex topography and the limited ability of the model used for COSMIC profile retrieval. An average bias of 0.69 hPa is found between COSMIC and radiosonde pressure profiles. Although the pressure difference is negatively correlated with station latitude, it is generally larger in the QTP region than in other regions at the same latitude because of model uncertainty and the complex terrain in the QTP area. A small difference in vapor pressure is found between COSMIC and radiosonde data, with a bias of −0.01 hPa. As with the pressure, the vapor pressure difference is negatively correlated with station latitude.
Atmospheric water vapor influences the measurement accuracy of COSMIC refractivity. The average refractivity bias between COSMIC and radiosonde data is 0.17 N, and the refractivity difference is negatively correlated with station latitude. Moreover, the negative refractivity bias between COSMIC and radiosonde data occurs below 5 km, and the refractivity difference is large in wet southern China, with a value of less than 1%. This result may be related to more humid conditions and super-refraction.

Acknowledgments

This work was supported by the National Natural Science Foundation of China (Grant Nos. 41375057, 41375041, 41620104009, and 91637211) and the open project of the Institute of Plateau Meteorology, CMA, Chengdu, through Grant LPM2014009. The authors are grateful to the UCAR and the TACC for providing the COSMIC wetPrf products. Special thanks to all reviewers for providing a lot of useful suggestions.

Author Contributions

Guirong Xu and Xinan Yue conceived and designed the experiments; Guirong Xu performed the experiments; Guirong Xu and Xinan Yue analyzed the data; Wengang Zhang and Xia Wan contributed to data processing; and Guirong Xu wrote the paper.

Conflicts of Interest

The authors declare no conflict of interest.

References

  1. Angell, J.K. Variations and trends in tropospheric and stratospheric global temperatures, 1958–87. J. Clim. 1998, 1, 1296–1313. [Google Scholar] [CrossRef]
  2. Thompson, D.W.J.; Solomon, S. Recent stratospheric climate trends as evidenced in radiosonde data: Global structure and tropospheric linkages. J. Clim. 2005, 18, 4785–4794. [Google Scholar] [CrossRef]
  3. Thorne, P.W.; Parker, D.E.; Christy, J.R.; Mears, C.A. Uncertainties in climate trends: Lessons from upper-air temperature records. Bull. Am. Meteorol. Soc. 2005, 86, 1437–1442. [Google Scholar] [CrossRef]
  4. He, W.; Ho, S.P.; Chen, H.; Zhou, X.; Hunt, D.; Kuo, Y.H. Assessment of radiosonde temperature measurements in the upper troposphere and lower stratosphere using COSMIC radio occultation data. Geophys. Res. Lett. 2009, 36, L17807. [Google Scholar] [CrossRef]
  5. Gaffen, D.J.; Sargent, M.A.; Habermann, R.E.; Lanzante, J.R. Sensitivity of tropospheric and strato-spheric temperature trends to radiosonde data quality. J. Clim. 2000, 13, 1776–1796. [Google Scholar] [CrossRef]
  6. Christy, J.R.; Norris, W.B. What may we conclude about global tropospheric temperature trends. Geophys. Res. Lett. 2004, 31, L06211. [Google Scholar] [CrossRef]
  7. Santer, B.D.; Wigley, T.M.L.; Mears, C.; Wentz, F.J.; Klein, S.A.; Seidel, D.J.; Taylor, K.E.; Thorne, P.W.; Wehner, M.F.; Gleckler, P.J.; et al. Amplification of surface temperature trends and variability in the tropical atmosphere. Science 2005, 309, 1551–1556. [Google Scholar] [CrossRef] [PubMed]
  8. Sherwood, S.C.; Lanzante, J.R.; Meyer, C.L. Radiosonde daytime biases and late-20th Century warming. Science 2005, 309, 1556–1559. [Google Scholar] [CrossRef] [PubMed]
  9. Kursinski, E.R.; Hajj, G.A.; Schofield, J.T.; Linfield, R.P.; Hardy, K.R. Observing Earth’s atmosphere with radio occultation measurements using the Global Positioning System. J. Geophys. Res. 1997, 102, 23429–23465. [Google Scholar] [CrossRef]
  10. Rocken, C.; Anthes, R.; Exner, M.; Hunt, D.; Sokolovskiy, S.; Ware, R.; Gorbunov, M.; Schreiner, W.; Feng, D.; Herman, B.; et al. Analysis and validation of GPS/MET data in the neutral atmosphere. J. Geophys. Res. 1997, 102, 29849–29866. [Google Scholar] [CrossRef]
  11. Anthes, R.A.; Rocken, C.; Kuo, Y.H. Applications of COSMIC to meteorology and climate. Terr. Atmos. Ocean. Sci. 2000, 11, 115–156. [Google Scholar] [CrossRef]
  12. Kuo, Y.H.; Wee, T.K.; Sokolovskiy, S.; Rocken, C.; Schreiner, W.; Hunt, D.; Anthes, R.A. Inversion and error estimation of GPS radio occultation data. J. Meteorol. Soc. Jpn. 2004, 82, 507–531. [Google Scholar] [CrossRef]
  13. Lin, L.; Zou, X.; Anthes, R.; Kuo, Y.H. COSMIC GPS radio occultation temperature profiles in cloud. Mon. Weather Rev. 2010, 138, 1104–1118. [Google Scholar] [CrossRef]
  14. Leroy, S.S.; North, G.R. The application of COSMIC data to global change research. Terr. Atmos. Ocean. Sci. 2000, 11, 187–210. [Google Scholar] [CrossRef]
  15. Wang, L.; Alexander, M.J. Global estimates of gravity wave parameters from GPS radio occultation temperature data. J. Geophys. Res. 2010, 115, D21122. [Google Scholar] [CrossRef]
  16. Scherllin-Pirscher, B.; Deser, C.; Ho, S.P.; Chou, C.; Randel, W.; Kuo, Y.H. The vertical and spatial structures of ENSO in the upper troposphere and lower stratosphere from GPS radio occultation measurements. Geophys. Res. Lett. 2012, 39, L20801. [Google Scholar] [CrossRef]
  17. Santhi, Y.D.; Ratnam, M.V.; Dhaka, S.K.; Rao, S.V. Global morphology of convection indices observed using COSMIC GPS RO satellite measurements. Atmos. Res. 2014, 137, 205–215. [Google Scholar] [CrossRef]
  18. Scherllin-Pirscher, B.; Steiner, A.K.; Kirchengast, G. Deriving dynamics from GPS radio occultation: Three-dimensional wind fields for monitoring the climate. Geophys. Res. Lett. 2014, 41, 7367–7374. [Google Scholar] [CrossRef] [PubMed]
  19. Khandu; Awange, J.L.; Forootan, E. Interannual variability of temperature in the UTLS region over Ganges-Brahmaputra-Meghna river basin based on COSMIC GNSS RO data. Atmos. Meas. Tech. 2016, 9, 1685–1699. [Google Scholar] [CrossRef]
  20. Kursinski, E.R.; Hajj, G.A.; Bertiger, W.I.; Leroy, S.S.; Meehan, T.K.; Romans, L.J.; Schofield, J.T.; McCleese, D.J.; Melbourne, W.G.; Thornton, C.L.; et al. Initial results of radio occultation observations of Earth’s atmosphere using the global positioning system. Science 1996, 271, 1107–1110. [Google Scholar] [CrossRef]
  21. Ware, R.; Rocken, C.; Solheim, F.; Exner, M.; Schreiner, W.; Anthes, R.; Feng, D.; Herman, B.; Gorbunov, M.; Sokolovskiy, S.; et al. GPS sounding of the atmosphere from low earth orbit: Preliminary results. Bull. Am. Meteorol. Soc. 1996, 77, 19–40. [Google Scholar] [CrossRef]
  22. Steiner, A.K.; Kirchengast, G.; Ladreiter, H.P. Inversion, error analysis, and validation of GPS/MET occultation data. Ann. Geophys. 1999, 17, 122–138. [Google Scholar] [CrossRef]
  23. Gorbunov, M.E.; Kornblueh, L. Analysis and validation of GPS/MET radio occultation data. J. Geophys. Res. 2001, 106, 17161–17169. [Google Scholar] [CrossRef]
  24. Healy, S.B.; Wickert, J.; Michalak, G.; Schmidt, T.; Beyerle, G. Combined forecast impact of GRACE-A and CHAMP GPS radio occultation bending angle profiles. Atmos. Sci. Lett. 2007, 8, 43–50. [Google Scholar] [CrossRef]
  25. Wickert, J.; Michalak, G.; Schmidt, T.; Beyerle, G.; Cheng, C.Z.; Healy, S.B.; Heise, S.; Huang, C.Y.; Jakowski, N.; Köhler, W.; et al. GPS radio occultation: Results from CHAMP, GRACE and FORMOSAT-3/COSMIC. Terr. Atmos. Ocean. Sci. 2009, 20, 35–50. [Google Scholar] [CrossRef]
  26. Tsuda, T.; Lin, X.; Hayashi, H.; Noersomadi. Analysis of vertical wave number spectrum of atmospheric gravity waves in the stratosphere using COSMIC GPS radio occultation data. Atmos. Meas. Tech. 2011, 4, 1627–1636. [Google Scholar] [CrossRef] [Green Version]
  27. Wee, T.K.; Kuo, Y.H.; Lee, D.K.; Liu, Z.; Wang, W.; Chen, S.Y. Two overlooked biases of the advanced research WRF (ARW) model in geopotential height and temperature. Mon. Weather Rev. 2012, 140, 3907–3918. [Google Scholar] [CrossRef]
  28. Das, U.; Pan, C.J. Validation of FORMOSAT-3/COSMIC level 2 “atmPrf” global temperature data in the stratosphere. Atmos. Meas. Tech. 2014, 7, 731–742. [Google Scholar] [CrossRef] [Green Version]
  29. Vergados, P.; Luo, Z.J.; Emanuel, K.; Mannucci, A.J. Observational tests of hurricane intensity estimations using GPS radio occultations. J. Geophys. Res. 2014, 119, 1936–1948. [Google Scholar] [CrossRef]
  30. Biondi, R.; Steiner, A.K.; Kirchengast, G.; Rieckh, T. Characterization of thermal structure and conditions for overshooting of tropical and extratropical cyclones with GPS radio occultation. Atmos. Chem. Phys. 2015, 15, 5181–5193. [Google Scholar] [CrossRef]
  31. Rocken, C.; Kuo, Y.H.; Schreiner, W.; Hunt, D.; Sokolovskiy, S.; McCormick, C. COSMIC system description. Terr. Atmos. Ocean. Sci. 2000, 11, 21–52. [Google Scholar] [CrossRef]
  32. Schreiner, W.; Rocken, C.; Sokolovskiy, S.; Syndergaard, S.; Hunt, D. Estimates of the precision of GPS radio occultations from the COSMIC/FORMOSAT-3 mission. Geophys. Res. Lett. 2007, 34, L04808. [Google Scholar] [CrossRef]
  33. Anthes, R.A.; Ector, D.; Hunt, D.C.; Kuo, Y.H.; Rocken, C.; Schreiner, W.S.; Sokolovskiy, S.V.; Syndergaard, S.; Wee, T.K.; Zeng, Z. The COSMIC/FORMOSAT-3 mission: Early results. Bull. Am. Meteorol. Soc. 2008, 89, 313–333. [Google Scholar] [CrossRef]
  34. Chiu, T.C.; Liou, Y.A.; Yeh, W.H.; Huang, C.Y. NCURO data-retrieval algorithm in FORMOSAT-3 radio-occultation mission. IEEE Trans. Geosci. Remote Sens. 2008, 46, 3395–3405. [Google Scholar] [CrossRef]
  35. Huang, C.Y.; Kuo, Y.H.; Chen, S.Y.; Terng, C.T.; Chien, F.C.; Lin, P.L.; Kueh, M.T.; Chen, S.H.; Yang, M.J.; Wang, C.J.; et al. Impact of GPS radio occultation data assimilation on regional weather predictions. GPS Solut. 2010, 14, 35–49. [Google Scholar] [CrossRef]
  36. Yue, X.; Schreiner, W.S.; Lei, J.; Rocken, C.; Hunt, D.C.; Kuo, Y.H.; Wan, W. Global ionospheric response observed by COSMIC satellites during the January 2009 stratospheric sudden warming event. J. Geophys. Res. 2010, 115, A00G09. [Google Scholar] [CrossRef]
  37. Yue, X.; Kuo, Y.H.; Zeng, Z.; Wan, W. GNSS radio occultation technique for near-Earth space environment detection. Chin. J. Geophys. 2016, 59, 1161–1188. (In Chinese) [Google Scholar]
  38. Ho, S.P.; Goldberg, M.; Kuo, Y.H.; Zou, C.Z.; Schreiner, W. Calibration of temperature in the lower stratosphere from microwave measurements using COSMIC radio occultation data: Preliminary results. Terr. Atmos. Ocean. Sci. 2009, 20, 87–100. [Google Scholar] [CrossRef]
  39. Kuo, Y.H.; Sokolovskiy, S.V.; Anthes, R.A.; Vandenberghe, F. Assimilation of GPS radio occultation data for numerical weather prediction. Terr. Atmos. Ocean. Sci. 2000, 11, 157–186. [Google Scholar] [CrossRef]
  40. Wang, K.Y. Profiles of the atmospheric temperature response to the Saharan dust outbreaks derived from FORMOSAT-3/COSMIC and OMI AI. Atmos. Res. 2010, 96, 110–121. [Google Scholar] [CrossRef]
  41. Gao, Y.; Tang, M.; Luo, S.; Shen, Z.; Li, C. Some aspects of recent research on the Qinghai-Xizang Plateau meteorology. Bull. Am. Meteorol. Soc. 1981, 62, 31–35. [Google Scholar] [CrossRef]
  42. Ye, D. Some characteristics of the summer circulation over the Qinghai-Xizang (Tibet) Plateau and its neighborhood. Bull. Amer. Meteorol. Soc. 1981, 62, 14–19. [Google Scholar] [CrossRef]
  43. Yanai, M.; Song, Z. Seasonal heating of the Tibetan Plateau and its effects on the evolution of the Asian summer monsoon. J. Meteorol. Soc. Jpn. 1992, 70, 319–351. [Google Scholar] [CrossRef]
  44. Wu, G.; Liu, Y. Summertime quadruplet heating pattern in the subtropics and the associated atmospheric circulation. Geophys. Res. Lett. 2003, 30, 1201. [Google Scholar] [CrossRef]
  45. Xu, X.; Lu, C.; Shi, X.; Gao, S. World water tower: An atmospheric perspective. Geophys. Res. Lett. 2008, 35, L20815. [Google Scholar] [CrossRef]
  46. Tao, S.; Ding, Y. Observational evidence of the influence of the Qinghai-Xizang (Tibet) Plateau on the occurrence of heavy rain and severe convective storms in China. Bull. Am. Meteorol. Soc. 1981, 62, 23–30. [Google Scholar] [CrossRef]
  47. Reiter, D.R. Where we are and where we are going in mountain meteorology. Bull. Am. Meteorol. Soc. 1982, 63, 1114–1122. [Google Scholar] [CrossRef]
  48. Shi, C.; Jiang, J.; Fang, Z. A study on the features of severe convection cloud clusters causing serious flooding over Changjiang River Basin in 1998. Clim. Environ. Res. 2000, 5, 279–286. [Google Scholar]
  49. Xu, X.; Lu, C.; Shi, X.; Ding, Y. Large-scale topography of China: A factor for the seasonal progression of the Meiyu rainband. J. Geophys. Res. 2010, 115, D02110. [Google Scholar] [CrossRef]
  50. Peng, S.; Xu, X.; Shi, X.; Wang, D.; Zhu, Y.; Pu, J. The early-warning effects of assimilation of the observations over the large-scale slope of the “World Roof” on its downstream weather forecasting. Chin. Sci. Bull. 2009, 54, 706–710. [Google Scholar] [CrossRef]
  51. Wang, B.R.; Liu, X.Y.; Wang, J.K. Assessment of COSMIC radio occultation retrieval product using global radiosonde data. Atmos. Meas. Tech. 2013, 6, 1073–1083. [Google Scholar] [CrossRef]
  52. Vergados, P.; Mannucci, A.J.; Ao, C.O.; Jiang, J.H.; Su, H. On the comparisons of tropical relative humidity in the lower and middle troposphere among COSMIC radio occultations and MERRA and ECMWF data sets. Atmos. Meas. Tech. 2015, 8, 1789–1797. [Google Scholar] [CrossRef]
  53. Shangguan, M.; Matthes, K.; Wang, W.; Wee, T.K. Validation of COSMIC water vapor data in the upper troposphere and lower stratosphere using MLS, MERRA and ERA-Interim. Atmos. Meas. Tech. Discuss. 2016, 1–28. [Google Scholar] [CrossRef]
  54. Zou, X.; Vandenberghe, F.; Wang, B.; Gorbunov, M.E.; Kuo, Y.H.; Sokolovskiy, S.; Chang, J.C.; Sela, J.G.; Anthes, R.A. A ray-tracing operator and its adjoint for the use of GPS/MET refraction angle measurements. J. Geophys. Res. 1999, 104, 22301–22318. [Google Scholar] [CrossRef]
  55. Healy, S.B.; Eyre, J. Retrieving temperature, water vapor and surface pressure information from refractivity-index profiles derived by radio occultation: A simulation study. Q. J. R. Meteorol. Soc. 2000, 126, 1661–1683. [Google Scholar] [CrossRef]
  56. Palmer, P.I.; Barnett, J.; Eyre, J.; Healy, S. A non-linear optimal estimation inverse method for radio occultation measurements of temperature, humidity, and surface pressure. J. Geophys. Res. 2000, 105, 17513–17526. [Google Scholar] [CrossRef]
  57. Xu, G.; Xi, B.; Zhang, W.; Cui, C.; Dong, X.; Liu, Y.; Yan, G. Comparison of atmosheric profiles between microwave radiometer retrievals and radiosonde soundings. J. Geophys. Res. 2015, 120. [Google Scholar] [CrossRef]
  58. Smith, E.K.; Weintraub, S. The constants in the equation for atmospheric refractive index at radio frequencies. J. Res. Natl. Bur. Stand. 1953, 50, 39–41. [Google Scholar] [CrossRef]
  59. Kuo, Y.H.; Zou, X.; Huang, W.; Chang, J.C. One-dimensional retrieval of temperature and moisture profiles from GPS/MET radio occultation soundings. In Proceedings of the U.S.-Taiwan Bilateral COSMIC Science Workshop, Taipei, Taiwan, 26–28 February 1998. [Google Scholar]
  60. Holtslag, A.A.M.; Svensson, G.; Baas, P.; Basu, S.; Beare, B.; Beljaars, A.C.M.; Bosveld, F.C.; Cuxart, J.; Lindvall, J.; Steeneveld, G.J.; et al. Stable atmospheric boundary layers and diurnal cycles: Challenges for weather and climate models. Bull. Am. Meteorol. Soc. 2013, 94, 1691–1706. [Google Scholar] [CrossRef]
  61. Ao, C.O.; Meehan, T.K.; Hajj, G.A.; Mannucci, A.J.; Beyerle, G. Lower troposphere refractivity bias in GPS occultation retrievals. J. Geophys. Res. 2003, 108, 4577. [Google Scholar] [CrossRef]
  62. Sokolovskiy, S. Effect of superrefraction on inversions of radio occultation signals in the lower troposphere. Radio Sci. 2003, 38, 1058. [Google Scholar] [CrossRef]
  63. Beyerle, G.; Schmidt, T.; Wickert, J.; Heise, S.; Rothacher, M.; Konig-Langlo, G.; Lauritsen, K.B. Observations and simulations of receiver-induced refractivity biases in GPS radio occultation. J. Geophys. Res. 2006, 111, D12101. [Google Scholar] [CrossRef]
  64. Hajj, G.A.; Ao, C.O.; Iijima, B.A.; Kuang, D. CHAMP and SAC-C atmospheric occultation results and intercomparisons. J. Geophys. Res. 2004, 109, D06109. [Google Scholar] [CrossRef]
  65. Sokolovskiy, S.; Rocken, C.; Schreiner, W.; Hunt, D. On the uncertainty of radio occultation inversions in the lower troposphere. J. Geophys. Res. 2010, 115, D22111. [Google Scholar] [CrossRef]
  66. Sun, B.; Reale, A.; Seidel, D.J.; Hunt, D.C. Comparing radiosonde and COSMIC atmospheric profile data to quantify differences among radiosonde types and the effects of imperfect collocation on comparison statistics. J. Geophys. Res. 2010, 115, D23104. [Google Scholar] [CrossRef]
  67. Zhang, K.; Fu, E.; Silcock, D.; Wang, Y.; Kuleshov, Y. An investigation of atmospheric temperature profiles in the Australian region using collocated GPS radio occultation and radiosonde data. Atmos. Meas. Tech. 2011, 4, 2087–2092. [Google Scholar] [CrossRef] [Green Version]
Figure 1. The distribution and elevations of radiosonde stations in China.
Atmosphere 08 00208 g001
Figure 2. The COSMIC temperature biases compared to radiosonde observations in China. The red dots are positive biases, and the blue dots are negative biases. The number of radiosonde stations for each bias class is listed in parentheses.
Atmosphere 08 00208 g002
Figure 3. The temperature RMSEs between COSMIC and radiosonde data in China. The number of radiosonde stations for each RMSE class is listed in parentheses.
Atmosphere 08 00208 g003
Figure 4. The COSMIC pressure biases compared to radiosonde observations in China. The red dots are positive biases, and the blue dots are negative biases. The number of radiosonde stations for each bias class is listed in parentheses.
Atmosphere 08 00208 g004
Figure 5. The pressure RMSEs between COSMIC and radiosonde data in China. The number of radiosonde stations for each RMSE class is listed in parentheses.
Atmosphere 08 00208 g005
Figure 6. The COSMIC vapor pressure biases compared to radiosonde observations in China. The red dots are positive biases, and the blue dots are negative biases. The number of radiosonde stations for each bias class is listed in parentheses.
Atmosphere 08 00208 g006
Figure 7. The vapor pressure RMSEs between COSMIC and radiosonde data in China. The number of radiosonde stations for each RMSE class is listed in parentheses.
Atmosphere 08 00208 g007
Figure 8. The COSMIC refractivity biases compared to radiosonde observations in China. The red dots are positive biases, and the blue dots are negative biases. The number of radiosonde stations for each bias class is listed in parentheses.
Atmosphere 08 00208 g008
Figure 9. The refractivity RMSEs between COSMIC and radiosonde data in China. The number of radiosonde stations for each RMSE class is listed in parentheses.
Atmosphere 08 00208 g009
Figure 10. The COSMIC refractivity biases compared to radiosonde observations in China for different altitudes. (a) H ≤ 5 km; (b) 5 km < H ≤ 10 km; (c) 10 km < H ≤ 15 km; (d) 15 km < H ≤ 20 km. The red dots are positive biases, and the blue dots are negative biases. The number of radiosonde stations for each bias class is listed in parentheses.
Atmosphere 08 00208 g010
Figure 11. The refractivity RMSEs between COSMIC and radiosonde data in China for different altitudes. (a) H ≤ 5 km; (b) 5 km < H ≤ 10 km; (c) 10 km < H ≤ 15 km; (d) 15 km < H ≤ 20 km. The number of radiosonde stations for each RMSE class is listed in parentheses.
Atmosphere 08 00208 g011
Figure 12. The mean (red), best (green) and worst (blue) bias and RMSE profiles of COSMIC retrievals compared to radiosonde. The solid lines indicate the biases and the dotted lines are for RMSE. (a) Temperature; (b) pressure; (c) vapor pressure; (d) refractivity.
Atmosphere 08 00208 g012
Table 1. The mean temperature biases and RMSEs between COSMIC and radiosonde data reported in some previous studies.
AuthorsData-Matching Method
(Δh, Distance)
Height LevelsMean Temperature Bias/KMean Temperature RMSE/KRegion
He et al. (2009)2 h, 300 km12–25 km<0.5<2.0Global
Sun et al. (2010)6 h, 250 km850–10 hPa0.151.5–2.0Global
Zhang et al. (2011)3 h, 300 km950–30 hPa0.371.24Australia
Wang et al. (2013)1 h, 100 km925–10 hPa−0.091.72Global
This study2 h, 300 km0–40 km−0.104.84China

