Review

A Review of Parametric Descriptions of Tropical Cyclone Wind-Wave Generation

Department of Infrastructure Engineering, University of Melbourne, Parkville VIC 3010, Melbourne, Australia
Atmosphere 2017, 8(10), 194; https://doi.org/10.3390/atmos8100194
Submission received: 18 August 2017 / Revised: 22 September 2017 / Accepted: 28 September 2017 / Published: 5 October 2017
(This article belongs to the Special Issue Tropical Cyclones and Their Impacts)

Abstract

:
More than three decades of observations of tropical cyclone wind and wave fields have resulted in a detailed understanding of wave-growth dynamics, although details of the physics are still lacking. These observations are presented in a consistent manner, which provides the basis to be able to characterize the full wave spectrum in a parametric form throughout tropical cyclones. The data clearly shows that an extended fetch model can be used to represent the maximum significant wave height in such storms. The shape stabilizing influence of nonlinear interactions means that the spectral shape is remarkably similar to fetch-limited cases. As such, the tropical cyclone spectrum can also be described by using well-known parametric models. A detailed process is described to parameterize the wave spectrum at any point in a tropical cyclone.

1. Introduction

Tropical cyclones, hurricanes, or typhoons represent the major meteorological forcing events in many tropical and sub-tropical regions. The intense winds generated by the spatially compact and well-formed vortex structures of such systems generate large and potentially destructive ocean surface waves. As the wind field varies rapidly in space and time (in both magnitude and direction) in such systems, it would initially seem that understanding the resulting wave fields would be a daunting task. It is true that such systems do represent a challenging test of our understanding of the physical processes that are active. The fact that the tropical cyclone wind field vortex can be parameterized in a relatively simple form has, however, led to a range of studies that have attempted to describe the wave field in a similarly parametric form.
Over a period of more than 20 years, a range of studies have investigated the tropical cyclone wave field using in situ buoy data, numerical model studies, and satellite and aircraft-based remote sensing systems. The number and scope of these studies means that they have not only investigated the spatial distributions of waves in tropical cyclones, but how these distributions change as the parameters describing the tropical cyclone wind field change. In addition, our understanding of the central role that nonlinear interactions play in determining the shape of the ocean wave spectrum has advanced significantly over this period. As a result, it is possible to form a consistent description of, not only the spatial distribution of integral parameters such as significant wave height and the peak wave period in tropical cyclones, but also the full directional spectrum.
This review paper aims to bring together this broad range of studies and develop a consistent parametric description of the wave field in tropical cyclones, as well as outline the physical processes responsible for the observed spectral evolution. It will also indicate the gaps in our understanding of the wave fields generated by these intense meteorological systems.
The arrangement of the paper is as follows. The structure of the tropical cyclone wind field is described in Section 2, followed by a review of the many studies aimed at determining the spatial distribution of tropical cyclone waves in Section 3. The structure of the one-dimensional spectrum is discussed in Section 4, followed by the directional distribution of wave energy in Section 5. The physical processes responsible for the observed structure of tropical cyclone wave spectra is discussed in Section 6, together with how these have been implemented in modern spectral wave models. Finally, discussion and conclusions are presented in Section 7.

2. Tropical Cyclone Wind Field

Although the spatial distribution of individual tropical cyclones varies, numerous studies [1,2,3,4,5,6,7,8,9] have represented the mature tropical cyclone wind field as a translating vortex. Although there are differences between these forms, a commonly used model is that of Holland [1].
U g = [ A B ( p n p 0 ) exp ( A / r B ) ρ a r B + r 2 f c 2 4 ] 1 / 2 r f c 2
where U g is the gradient wind speed (outside the atmospheric boundary layer) defined at a radius r from the centre of the storm. The Coriolis parameter is represented by f c , ρ a is the air density, p 0 is the central pressure, and p n is the ambient atmospheric pressure far from the storm. The parameters A and B can be related in terms of the radius to maximum winds, R as
R   =   A 1 / B
The dimensionless parameter, B defines the shape of the wind field vortex. Rather than the wind direction rotating around the centre of the vortex in a circular manner, it typically spirals in towards the centre of the storm. Following Shea and Gray [10], it can be assumed that the inflow angle is approximately 25°. Observations [1,11] indicate that the wind field structure is asymmetric, with stronger winds to the right (Northern hemisphere) of the storm propagation direction (note that for the remainder of the paper, it is assumed that Northern Hemisphere storms are considered). Although the degree of asymmetry varies between storms, to first order, this can be represented by adding the vector speed of forward movement ( V f m ) to the vortex wind speed (i.e., increases the winds on the right of the storm and decreases them on the left).
Although the Holland wind field model (1) has been extensively used in many wind and wave studies, it has the limitation that it is, by definition, a vortex not embedded in any background flow. As a result, at large values of r , the model tends to underestimate observed winds. Thompson and Cardone [12] found that the performance of the Holland model at large r could be improved by the addition of a second outer vortex of the same form as in model (1). The aim here is not to create a second tropical cyclone eye or eye wall. Rather, there is a primary vortex with radius R 1 and parameters B 1 and p 0 1 which largely defines the vortex and then a second larger vortex with radius R 2 and parameters B 2 and p 0 2 . Typically, p 0 1 < p 0 2 and the central pressure is p 0 = p 0 1 + p 0 2 . The second vortex acts to slow the rate of decay of the wind speed at large values of r . McConochie et al. [13] demonstrated an improvement in outer scale wind fields using this double Holland vortex approach. Of course, the disadvantage of this approach is the requirement to determine additional wind field parameters, which is often problematic.
Figure 1 shows examples of the wind fields created using both a single and double Holland vortex. The parameters used are: p 0 = 950 HPa , p n = 1005   HPa , R = 30 km , B = 1.75 and V f m = 5 ms 1 and p 0 1 = 955 HPa , p 0 2 = 1000 HPa , R 1 = 30 km , R 2 = 300 km , B 1 = 1.75 and B 2 = 2.2 . As can be seen in the Figure, the addition of the second vortex has the desired impact of broadening the vortex (enhancing large radius winds), whilst maintaining a realistic tropical cyclone vortex.
In order to calculate wind fields at a standard reference height of 10 m, U 10 , the gradient wind speed, U g needs to be corrected assuming a boundary layer profile and a surface roughness [1]. The structure of the atmospheric boundary layer is an area of very significant research and sophisticated approaches are generally beyond the application of most tropical cyclone wave modelling. Rather, the wind speed is generally corrected using a constant factor in the range C b = 0.7 to 0.8 (i.e., U 10 =   C b U g ) [14].
Further, some care needs to be exercised in the interpretation of the averaging period for the wind speed produced by such a model. The wave modelling community is typically not precise in the definition of the wind speed, U 10 which is used in wave prediction. However, as such wind speeds usually come from buoy or satellite data, it is typically a 10 min mean. Holland [1] also specifies a 10 min mean in the development of the model (1). However, it is not uncommon in the tropical cyclone community, particularly in the United States, to use a maximum sustained wind (1 min mean), V 10 1 , where the subscript refers to the reference height (10 m) and the superscript, the averaging period (1 min).
The respective values of wind velocity can be related by the specification of a gust factor [15,16].
U 10   =   V 10 1 / G f
A range of values have been proposed for G f , with a good summary provided by Liu et al. [17]. Powell et al. [15] and Powell and Houston [15] recommended G f = 1.11 , which has been used in wave modelling applications by Tolman et al. [18] and Ardhuin et al. [19]. Harper [20] identifies a similar value, G f = 1.08 .

3. Spatial Distribution of Significant Wave Height

The earliest attempts to parameterize the tropical cyclone wave field assumed it would essentially mirror the wind field [21,22,23,24]. However, increasingly, data from in situ measurements [25,26,27,28,29,30,31], remote sensing [32,33,34,35,36,37,38,39,40], and numerical modelling [17,41,42,43,44] demonstrated a more complex spatial distribution of waves.
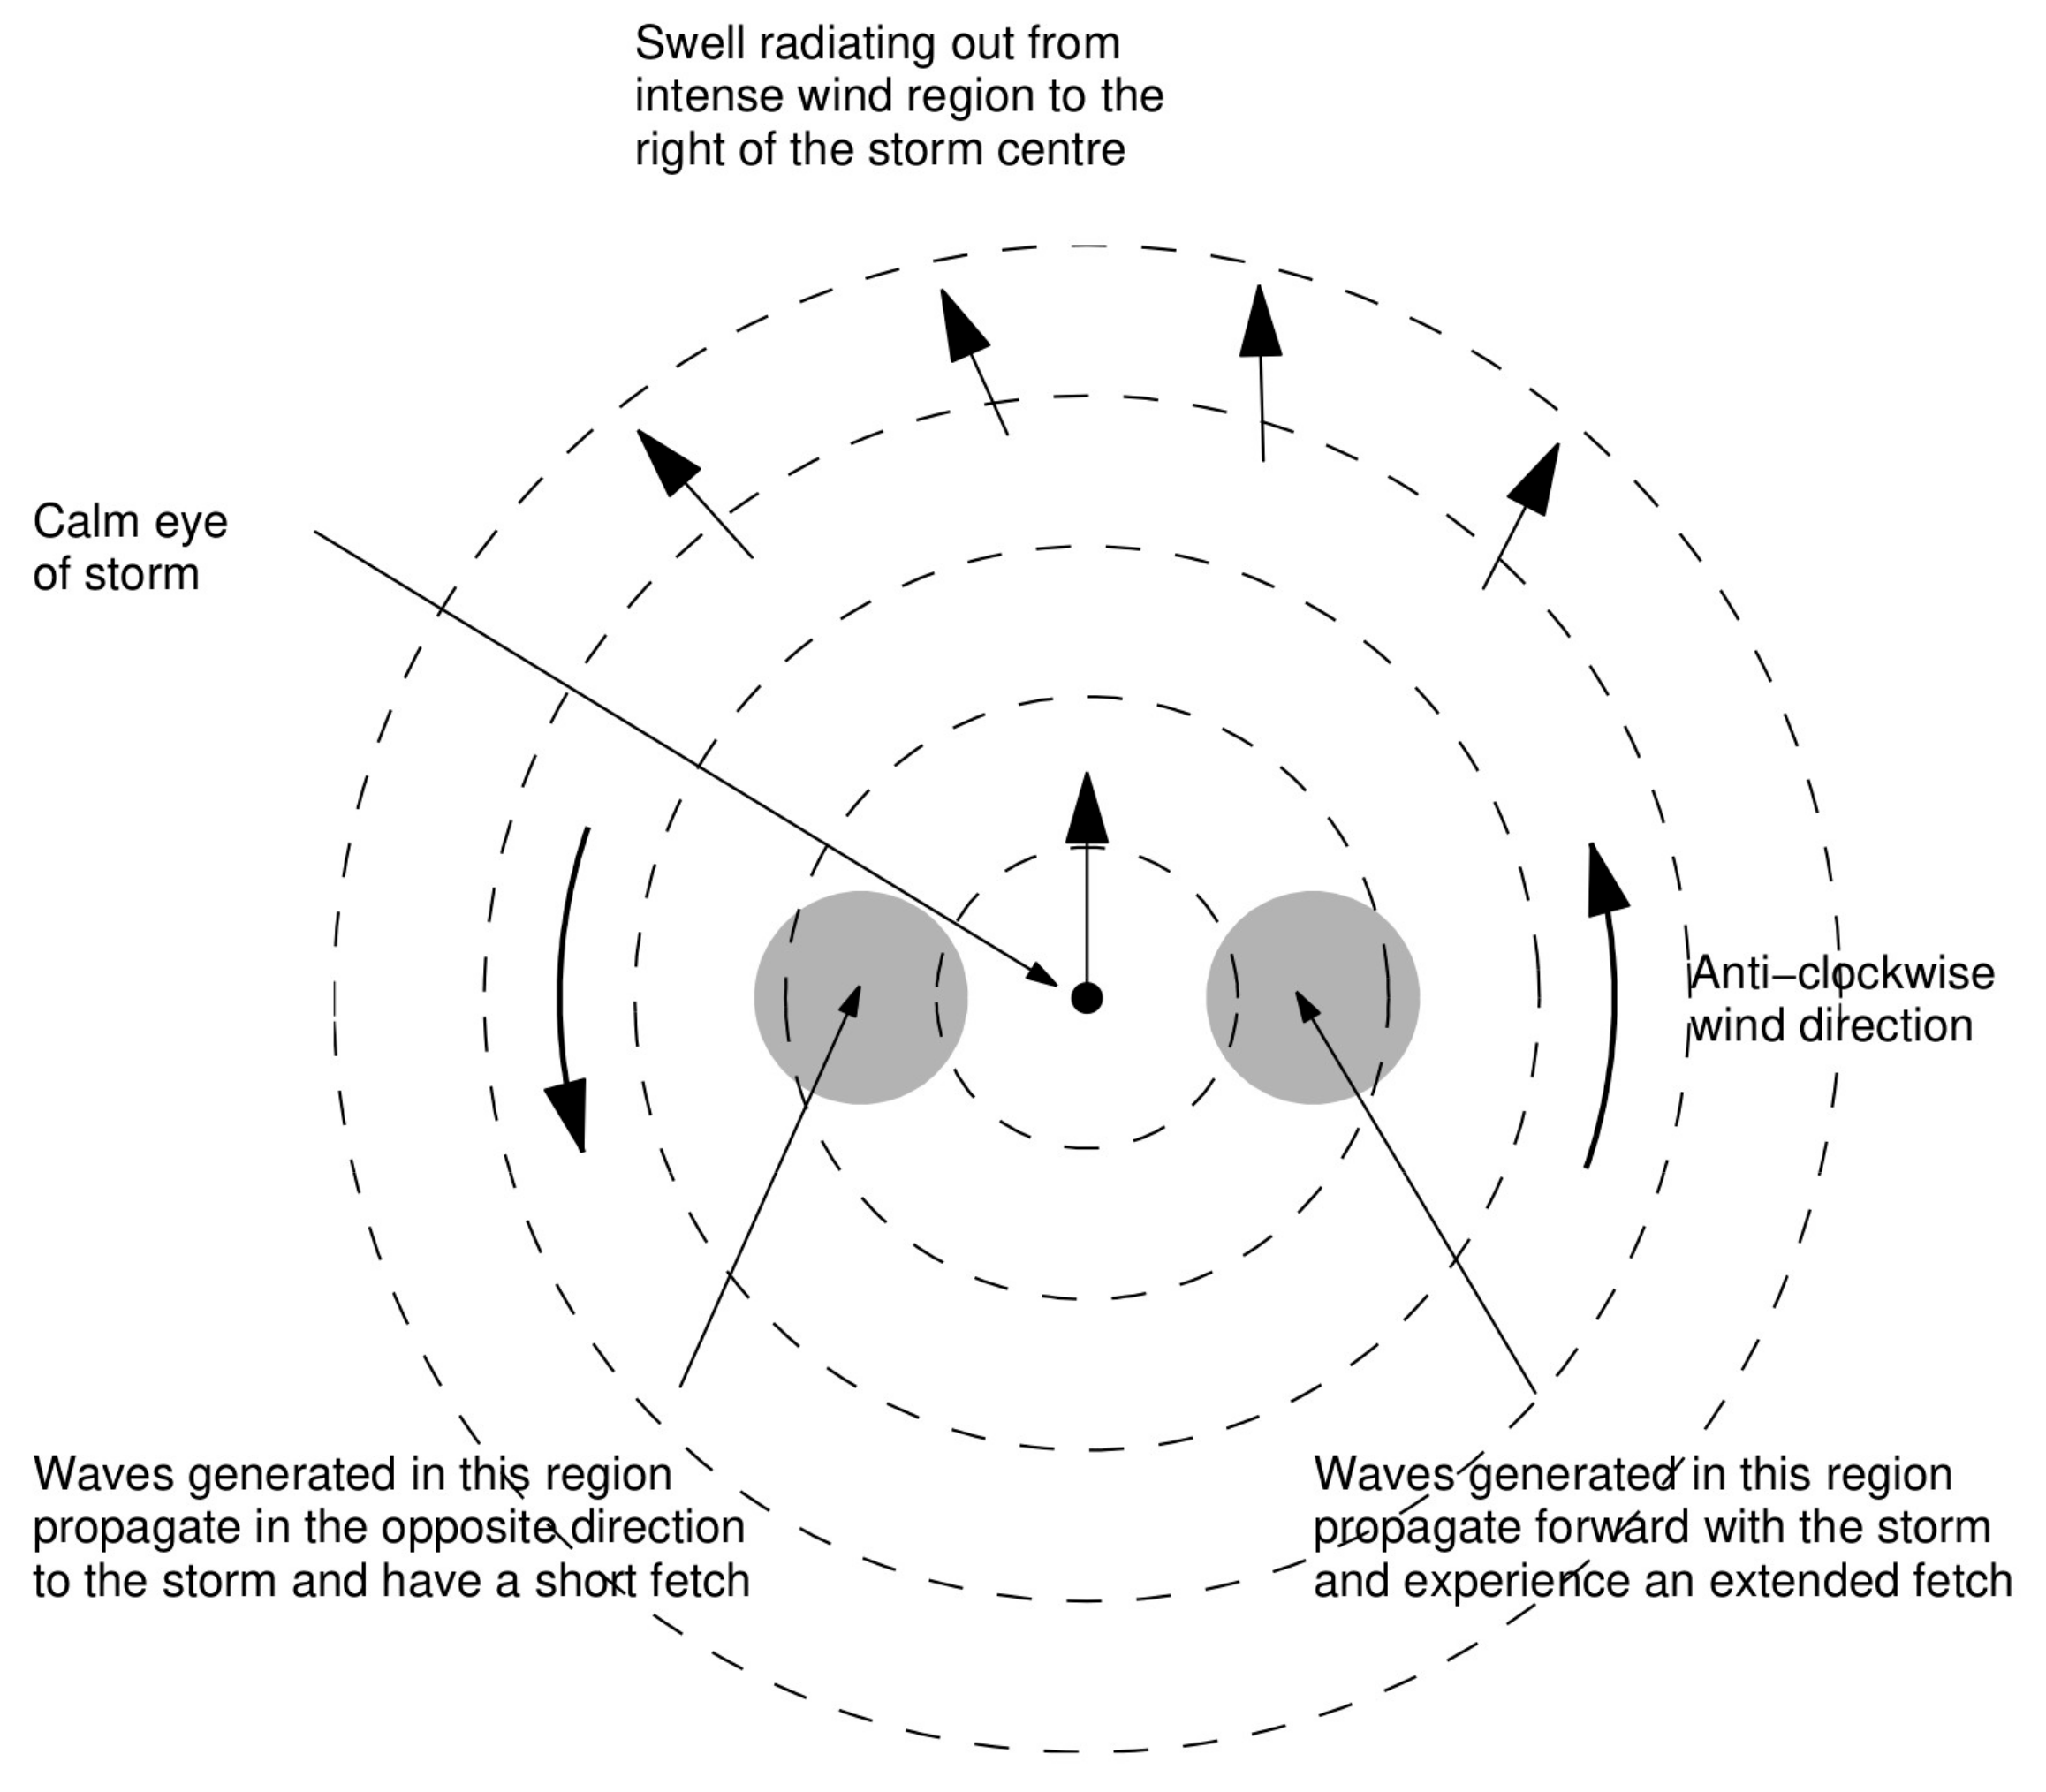
A key advance in our understanding of wind-wave generation in tropical cyclones and the resulting spatial distribution of wave energy was made by King and Shemdin [33]. Based on aircraft-based SAR measurements, they proposed the concept of an “extended” or “trapped” fetch within tropical cyclones. An examination of Figure 1 shows that to the right of the storm centre, the wind direction approximately aligns with the direction of propagation of the storm. As a result, in this region, it could be expected that the waves would propagate forward with the storm and hence remain within the intense wind regions of the storm for an extended period. Thus, they would be subjected to an “extended” fetch, also sometimes known as a “cumulative” fetch. Such waves are sometimes referred to as “fetch-trapped” waves. If the speed of propagation of the waves (group velocity, C g ) is approximately equal to the velocity of the forward movement of the storm ( V f m ), the waves would remained “locked” to the tropical cyclone and an infinite or “trapped” fetch [45] would result (i.e., for the condition V f m C g ).
The concept of an extended fetch has other implications, namely that if an extended fetch exists to the right of the storm, the opposite must occur on the left of the storm. Here, the wind direction and the direction of propagation of the storm are opposed and the waves would remain in the strong wind regions for only a short period of time. This means that it could be expected that the degree of asymmetry of the wave field would be greater than the wind field. In addition, as waves propagate once generated, it could also be expected that the spatial extent of the wave field would be greater than the wind field. These two conclusions explain why the spatial distribution of waves within a tropical cyclone does not mirror the wind field, as originally assumed [21,22,23,24]. Figure 2 shows a diagram of the concept of such an extended fetch within a tropical cyclone wind field.

3.1. Energy-Peak Frequency Relationship

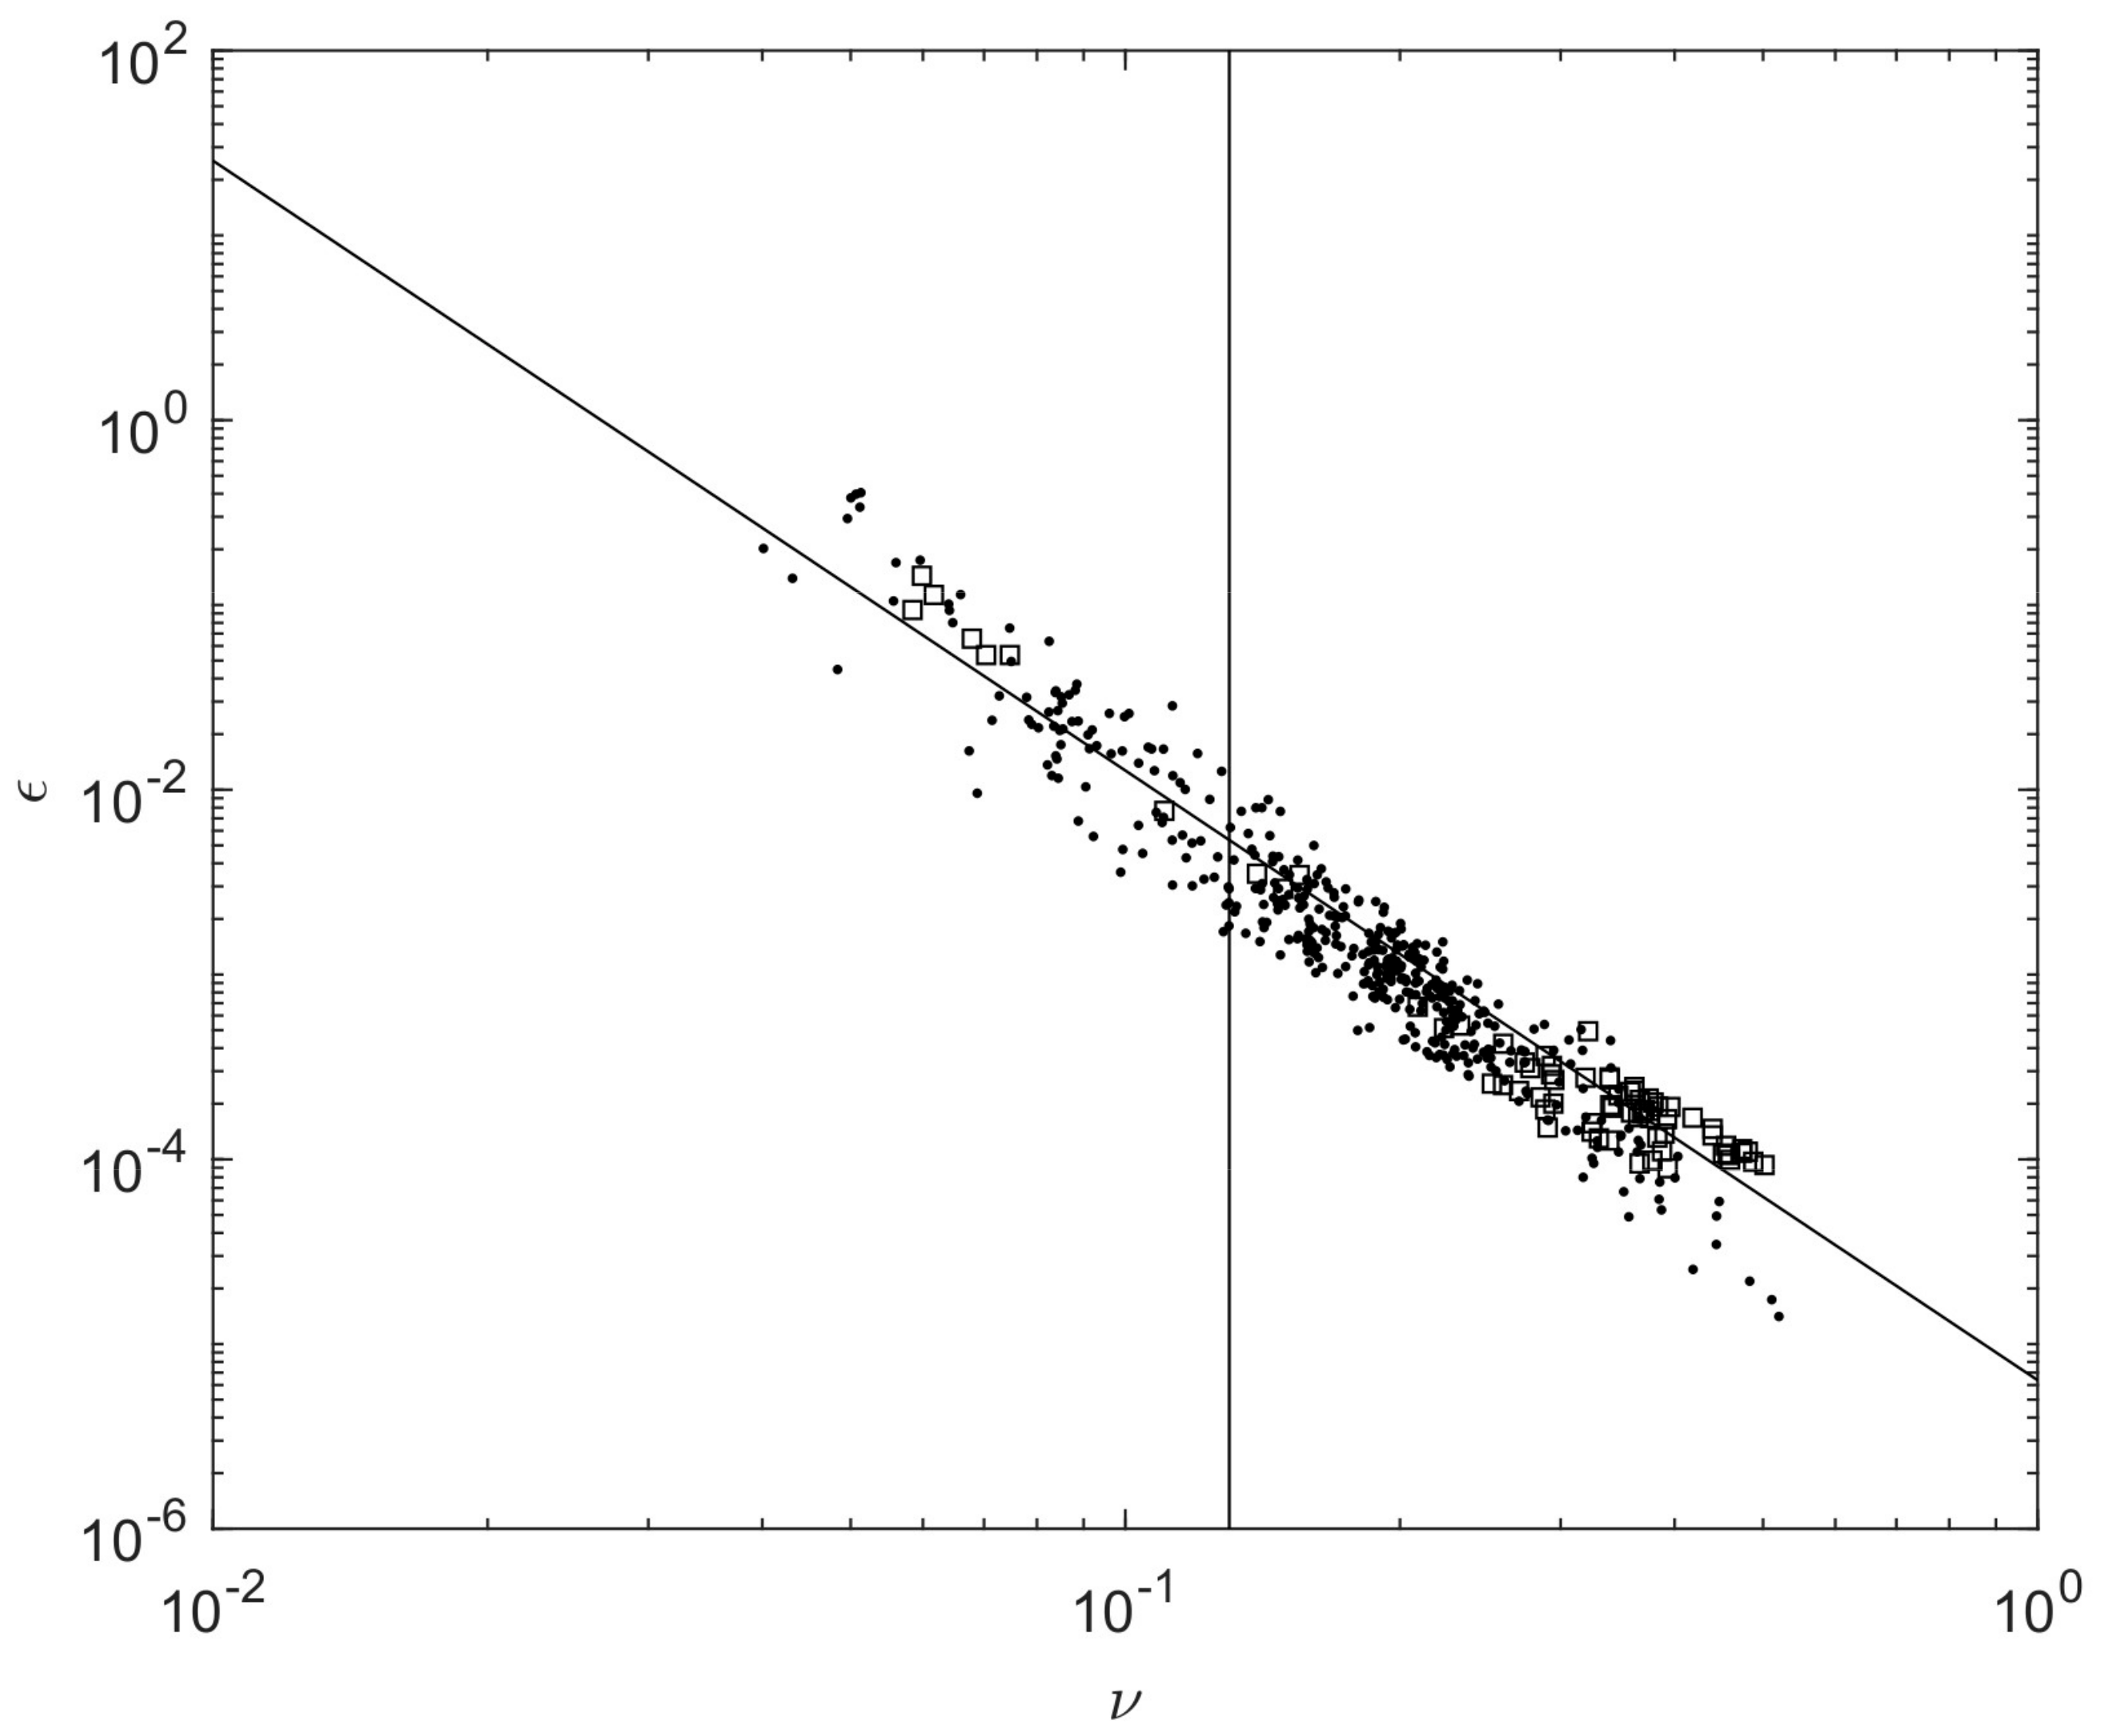
A “fetch”, however, is traditionally defined as the distance from shore over which a uniform uni-directional wind blows [46]. As such, the applicability of such a concept in a spatially and temporally variable tropical cyclone wind field is not obvious. Young [30,31] presented data from approximately 26 tropical cyclones measured on the North-West coast of Australia. Following the approaches commonly used in fetch-limited studies (e.g., [46,47]), they presented the data in non-dimensional form, ε = g 2 E T o t / U 10 4 and ν = f p U 10 / g , where E T o t = F ( f ) df = ( H s / 4 ) 2 and E T o t is the total energy of the waves, F ( f ) is the frequency spectrum of the waves, H s is the significant wave height, f p is the spectral peak frequency, and g is gravitational acceleration. Figure 3 shows non-dimensional energy, ε as a function of non-dimensional frequency, ν . Also shown is the relationship develop by Donelan et al. [47] for fetch-limited growth
ε = 6.365 × 10 6 ν 3.3
Data from Young [30,31] are shown by the solid dots and that from the Hurricane Hunter missions [48,49,50,51] by the open squares. Relationship (4), as proposed by Donelan et al. [47] for fetch-limited uni-directional winds is shown by the line through the data. The vertical line drawn at ν = 0.13 is the commonly adopted demarcation between swell and wind-sea.
The agreement between the fetch-limited relationship (4) and the tropical cyclone data is remarkable, considering the totally different wind fields involved (unidirectional vs tropical cyclone vortex). In a recent set of papers [48,49,50,51], the Scanning Radar Altimeter data of the Hurricane Hunter missions [39,52,53,54] was reanalyzed. Although this data covers only four missions, it gives a unique spatial view of the directional wave spectrum in typical northern hemisphere tropical cyclones. This data is also plotted in Figure 3 and is in excellent agreement with both the data of Young [30,31] and relationship (4). Recent analysis of Gulf of Mexico in situ data [55] confirm this same scaling within North American hurricanes.
In addition to the relationship between non-dimensional energy and non-dimensional frequency being almost identical in tropical cyclone and fetch-limited conditions, the data of Young [30,31] and Hu and Chen [55] also show that the detailed shape of the one-dimensional frequency spectrum is also the same. This is discussed in detail in Section 6, where it is also proposed that the reason for this remarkable degree of similarity is because nonlinear interactions control the shape of the spectrum in both cases. This dominant role played by nonlinear processes means that JONSWAP-type scaling can be used to describe the wave field in tropical cyclones.

3.2. Defining the Equivalent “Fetch” in a Tropical Cyclone

Although relationship (4) is a useful relationship, it does not, by itself, allow the determination of either H s or f p for a given tropical cyclone, just the relationship between these two quantities. Noting the applicability of fetch-limited scaling, the requirement is to define the equivalent fetch for typical tropical cyclones. Using a series of numerical model runs, Young [43] showed that the equivalent fetch is a function of the velocity of the forward movement of the storm, V f m and the maximum wind velocity in the storm, V max . He parameterized the equivalent fetch, x by the relationship
x R = ψ [ a V max 2 + b V max V f m + c V f m 2 + d V max + e V f m + f ]
where a =   2.175 × 10 3 , b = 1.506 × 10 2 , c =   1.223 × 10 1 , d = 2.190 × 10 1 , e = 6.737 × 10 1 and f = 7.980 × 10 1 . The term ψ is a scaling factor that Young [43] set to one. The term R is a normalization factor, which can be related to the radius to maximum winds, R by the non-linear relationship
R = 22.5 × 10 3 log R 70.8 × 10 3
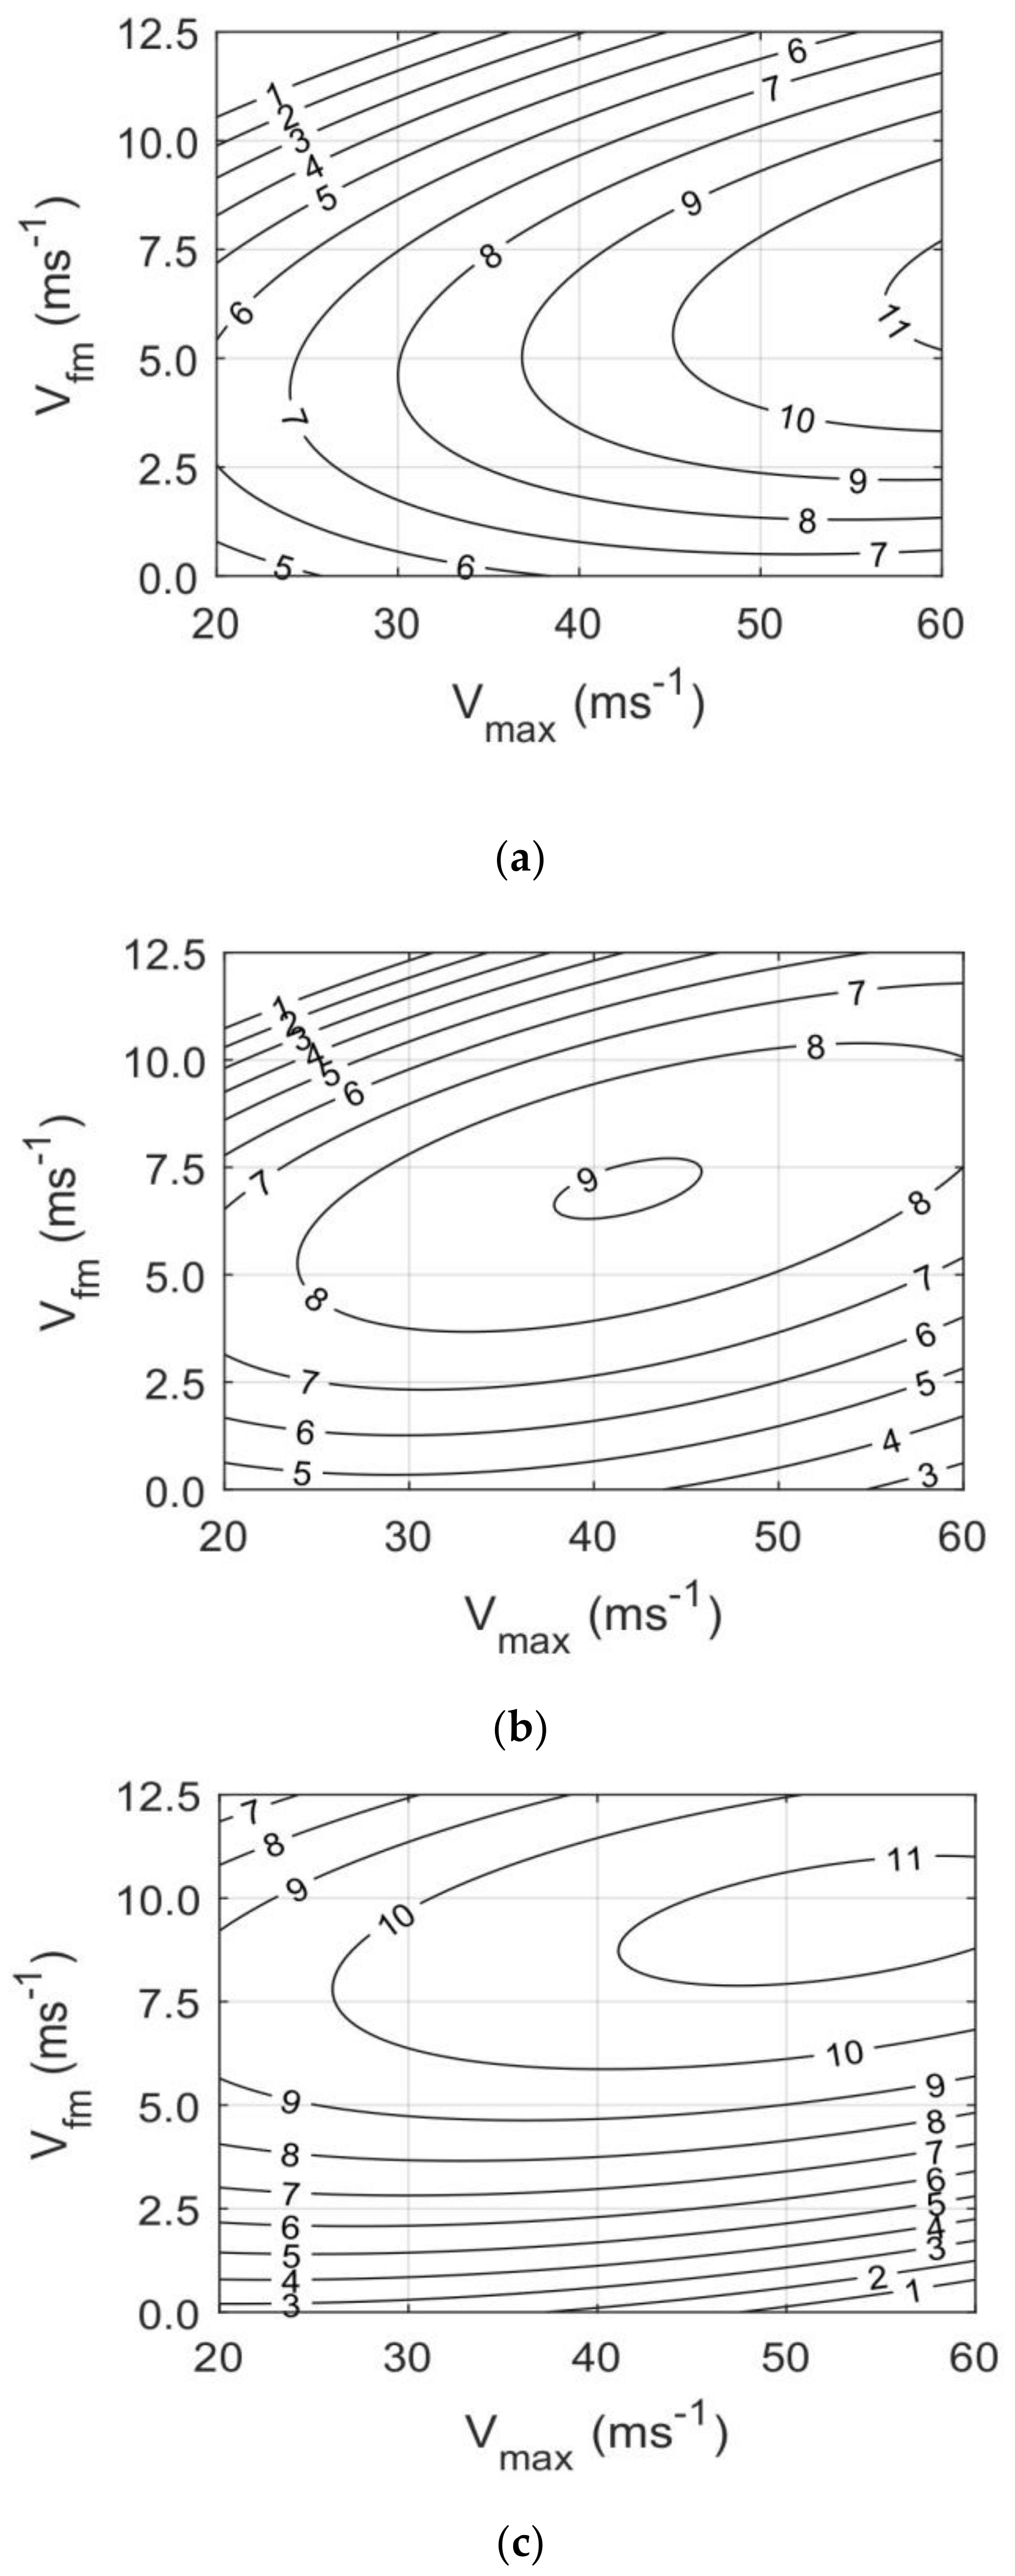
In relationships (5) and (6) all of the terms are in standard S.I. units (i.e., V f m , V max -[ m s 1 ]; x , R , R -[ m ]). Figure 4a shows contours of x / R as a function of V f m and V max calculated from relationship (5).
For a given value of V max , Figure 4a shows that as V f m increases, x / R increases until it reaches a maximum. For larger values of V f m , x / R then decreases. The maximum value of x / R defines the value of V f m for which the waves will stay in the maximum wind region for the longest period for the given V max . If the storm moves more slowly (i.e., V f m decreases), then the group velocity of the waves will be such that they outrun the storm (i.e., move faster than V f m ) and the equivalent fetch decreases. Conversely, if the storm moves more rapidly (i.e., V f m increases), then the group velocity of the waves will be such that they are left behind by the storm (i.e., move slower than V f m ) and again the equivalent fetch decreases. As the intensity of the storm increases, (i.e., V max increases), one would expect the tropical cyclone to generate larger waves, which would have a lower peak frequency, f p . That is, the group velocity of the largest waves will increase. As a result, the “ridge” in Figure 4a slopes upwards to the right. That is, as the storm intensifies, it must propagate more quickly to reach the optimal speed to generate the largest waves. Although (5) is an empirical relationship, it captures the inter-related role that V f m and V max play in defining the equivalent fetch, x / R . The empirical nature of relationship (5) means that it is applicable only over the parameter space for which it was developed [ V max = 20 60 ms 1 , V f m = 0 12.5 ms 1 ].
As noted above, the “equivalent fetch” concept is introduced to allow JONSWAP scaling to be applied in such situations. A true fetch, as defined for fetch-limited growth, does not exist in the complex vortex of a tropical cyclone. Rather, the concept captures the fact that the translating vortex of the tropical cyclone means that waves can move forward with the storm and thus remain in the intense wind regions for an extended period of time. This, in effect, is similar to winds blowing over a longer fetch in more simplified wind field conditions.
With the equivalent fetch defined, Young [43] used the JONSWAP relationship [46] to determine the maximum significant wave height within the storm, H s max .
g H s max V max 2 = 0.0016 ( g x V max 2 ) 0.5
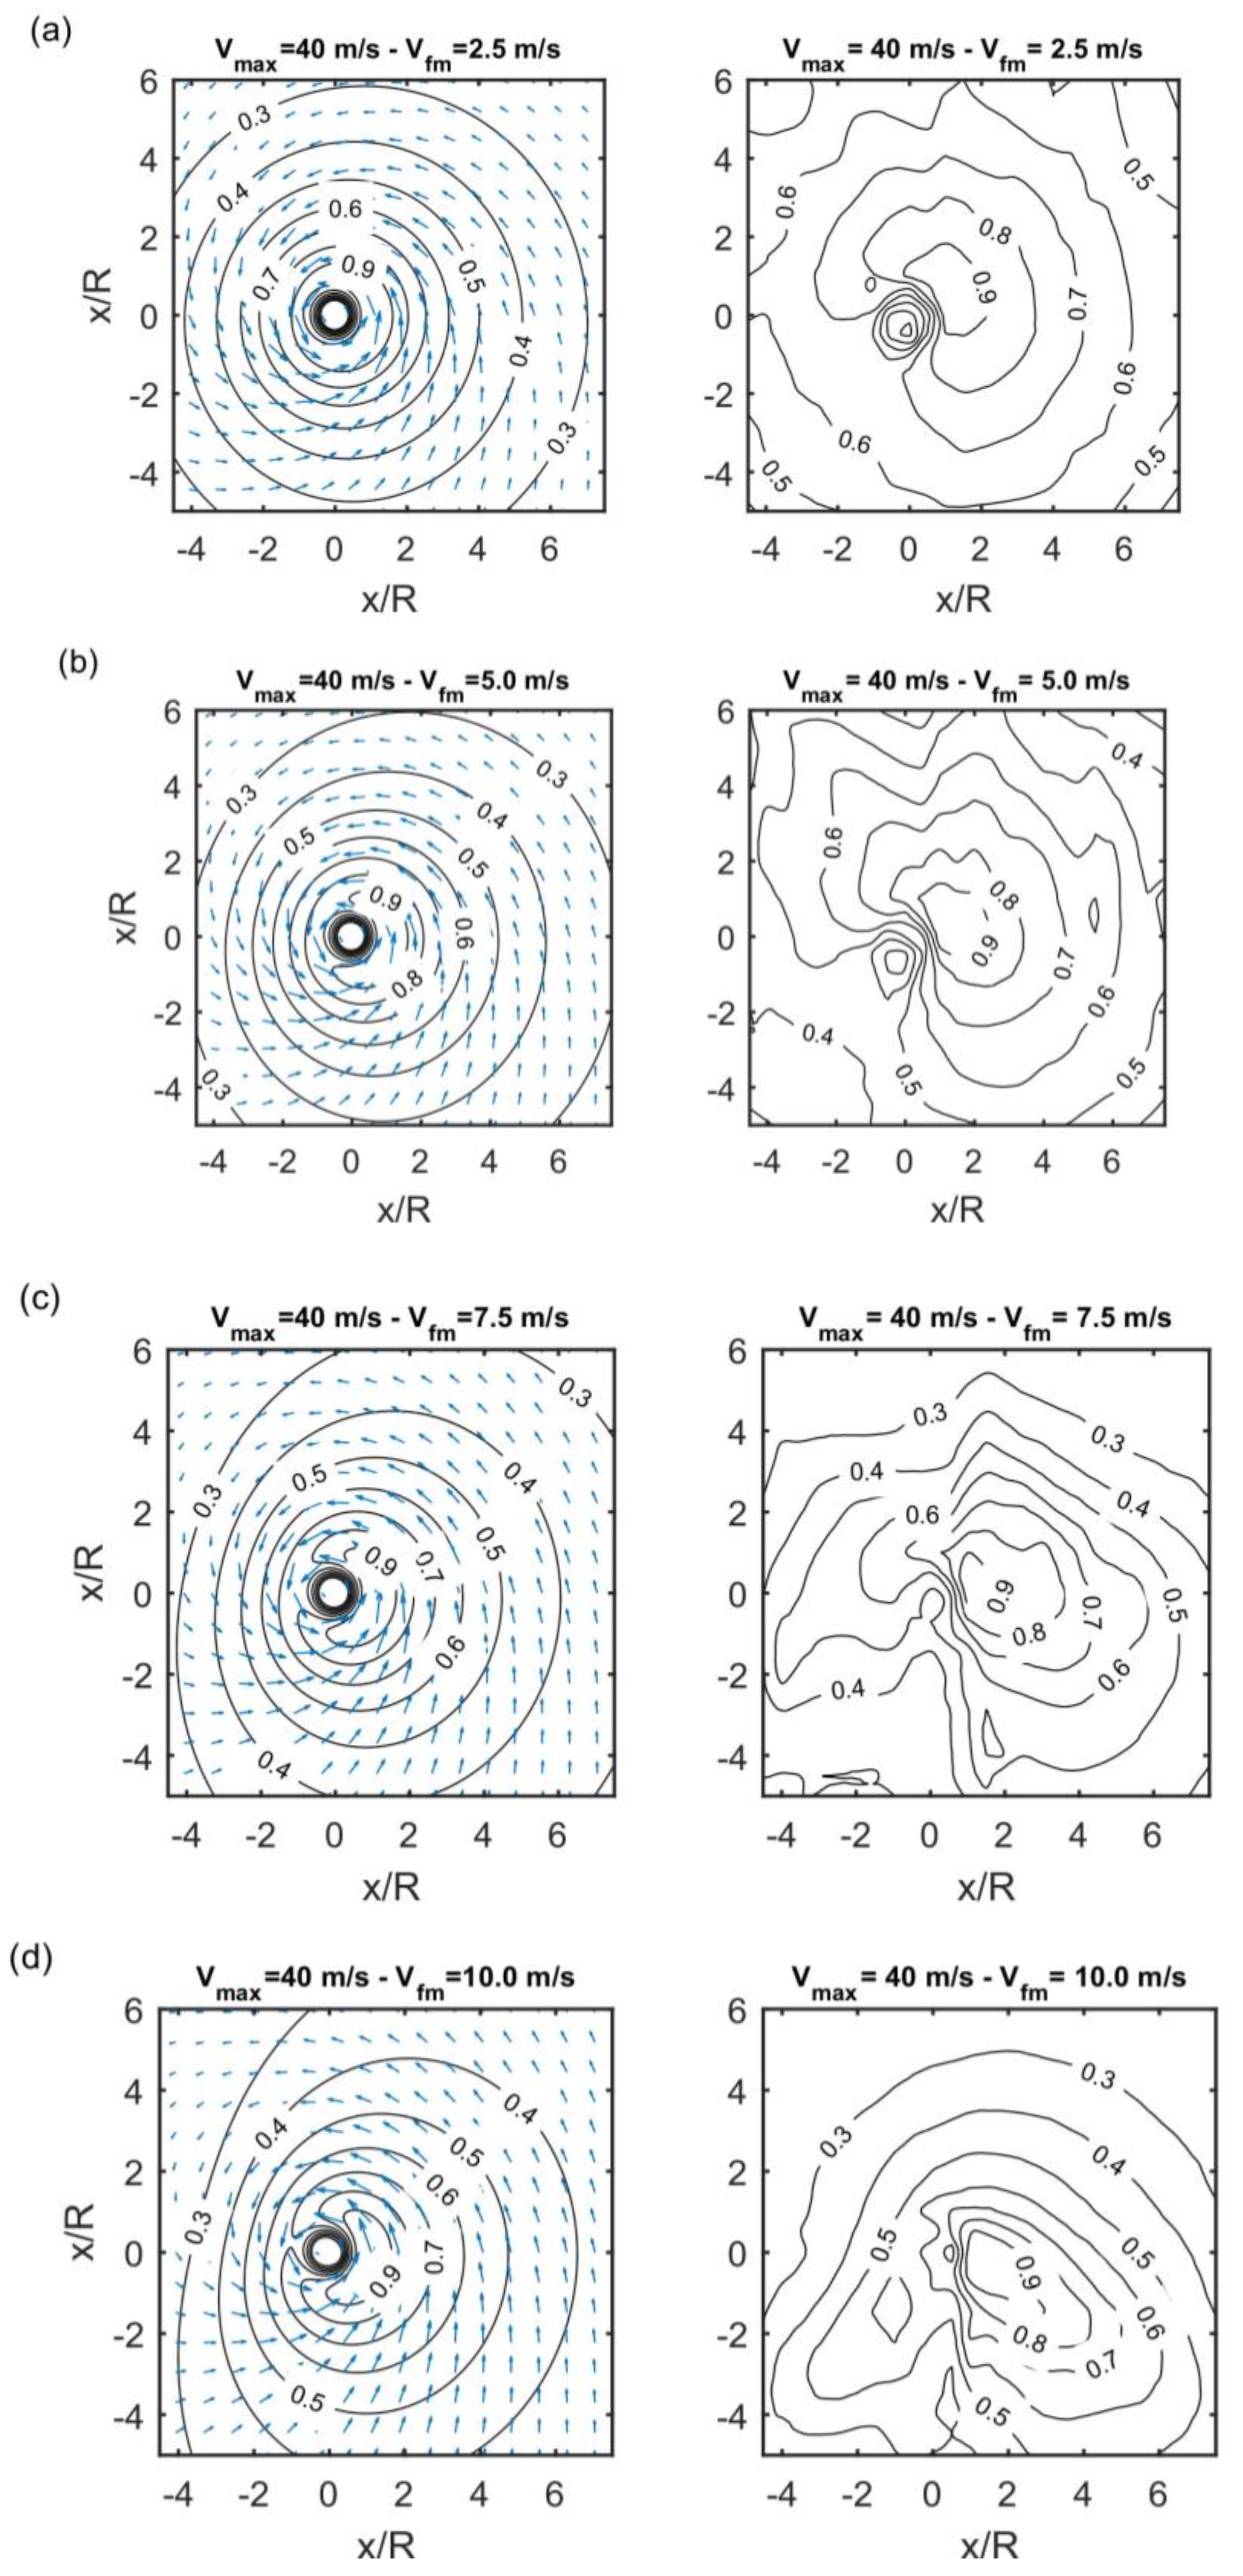
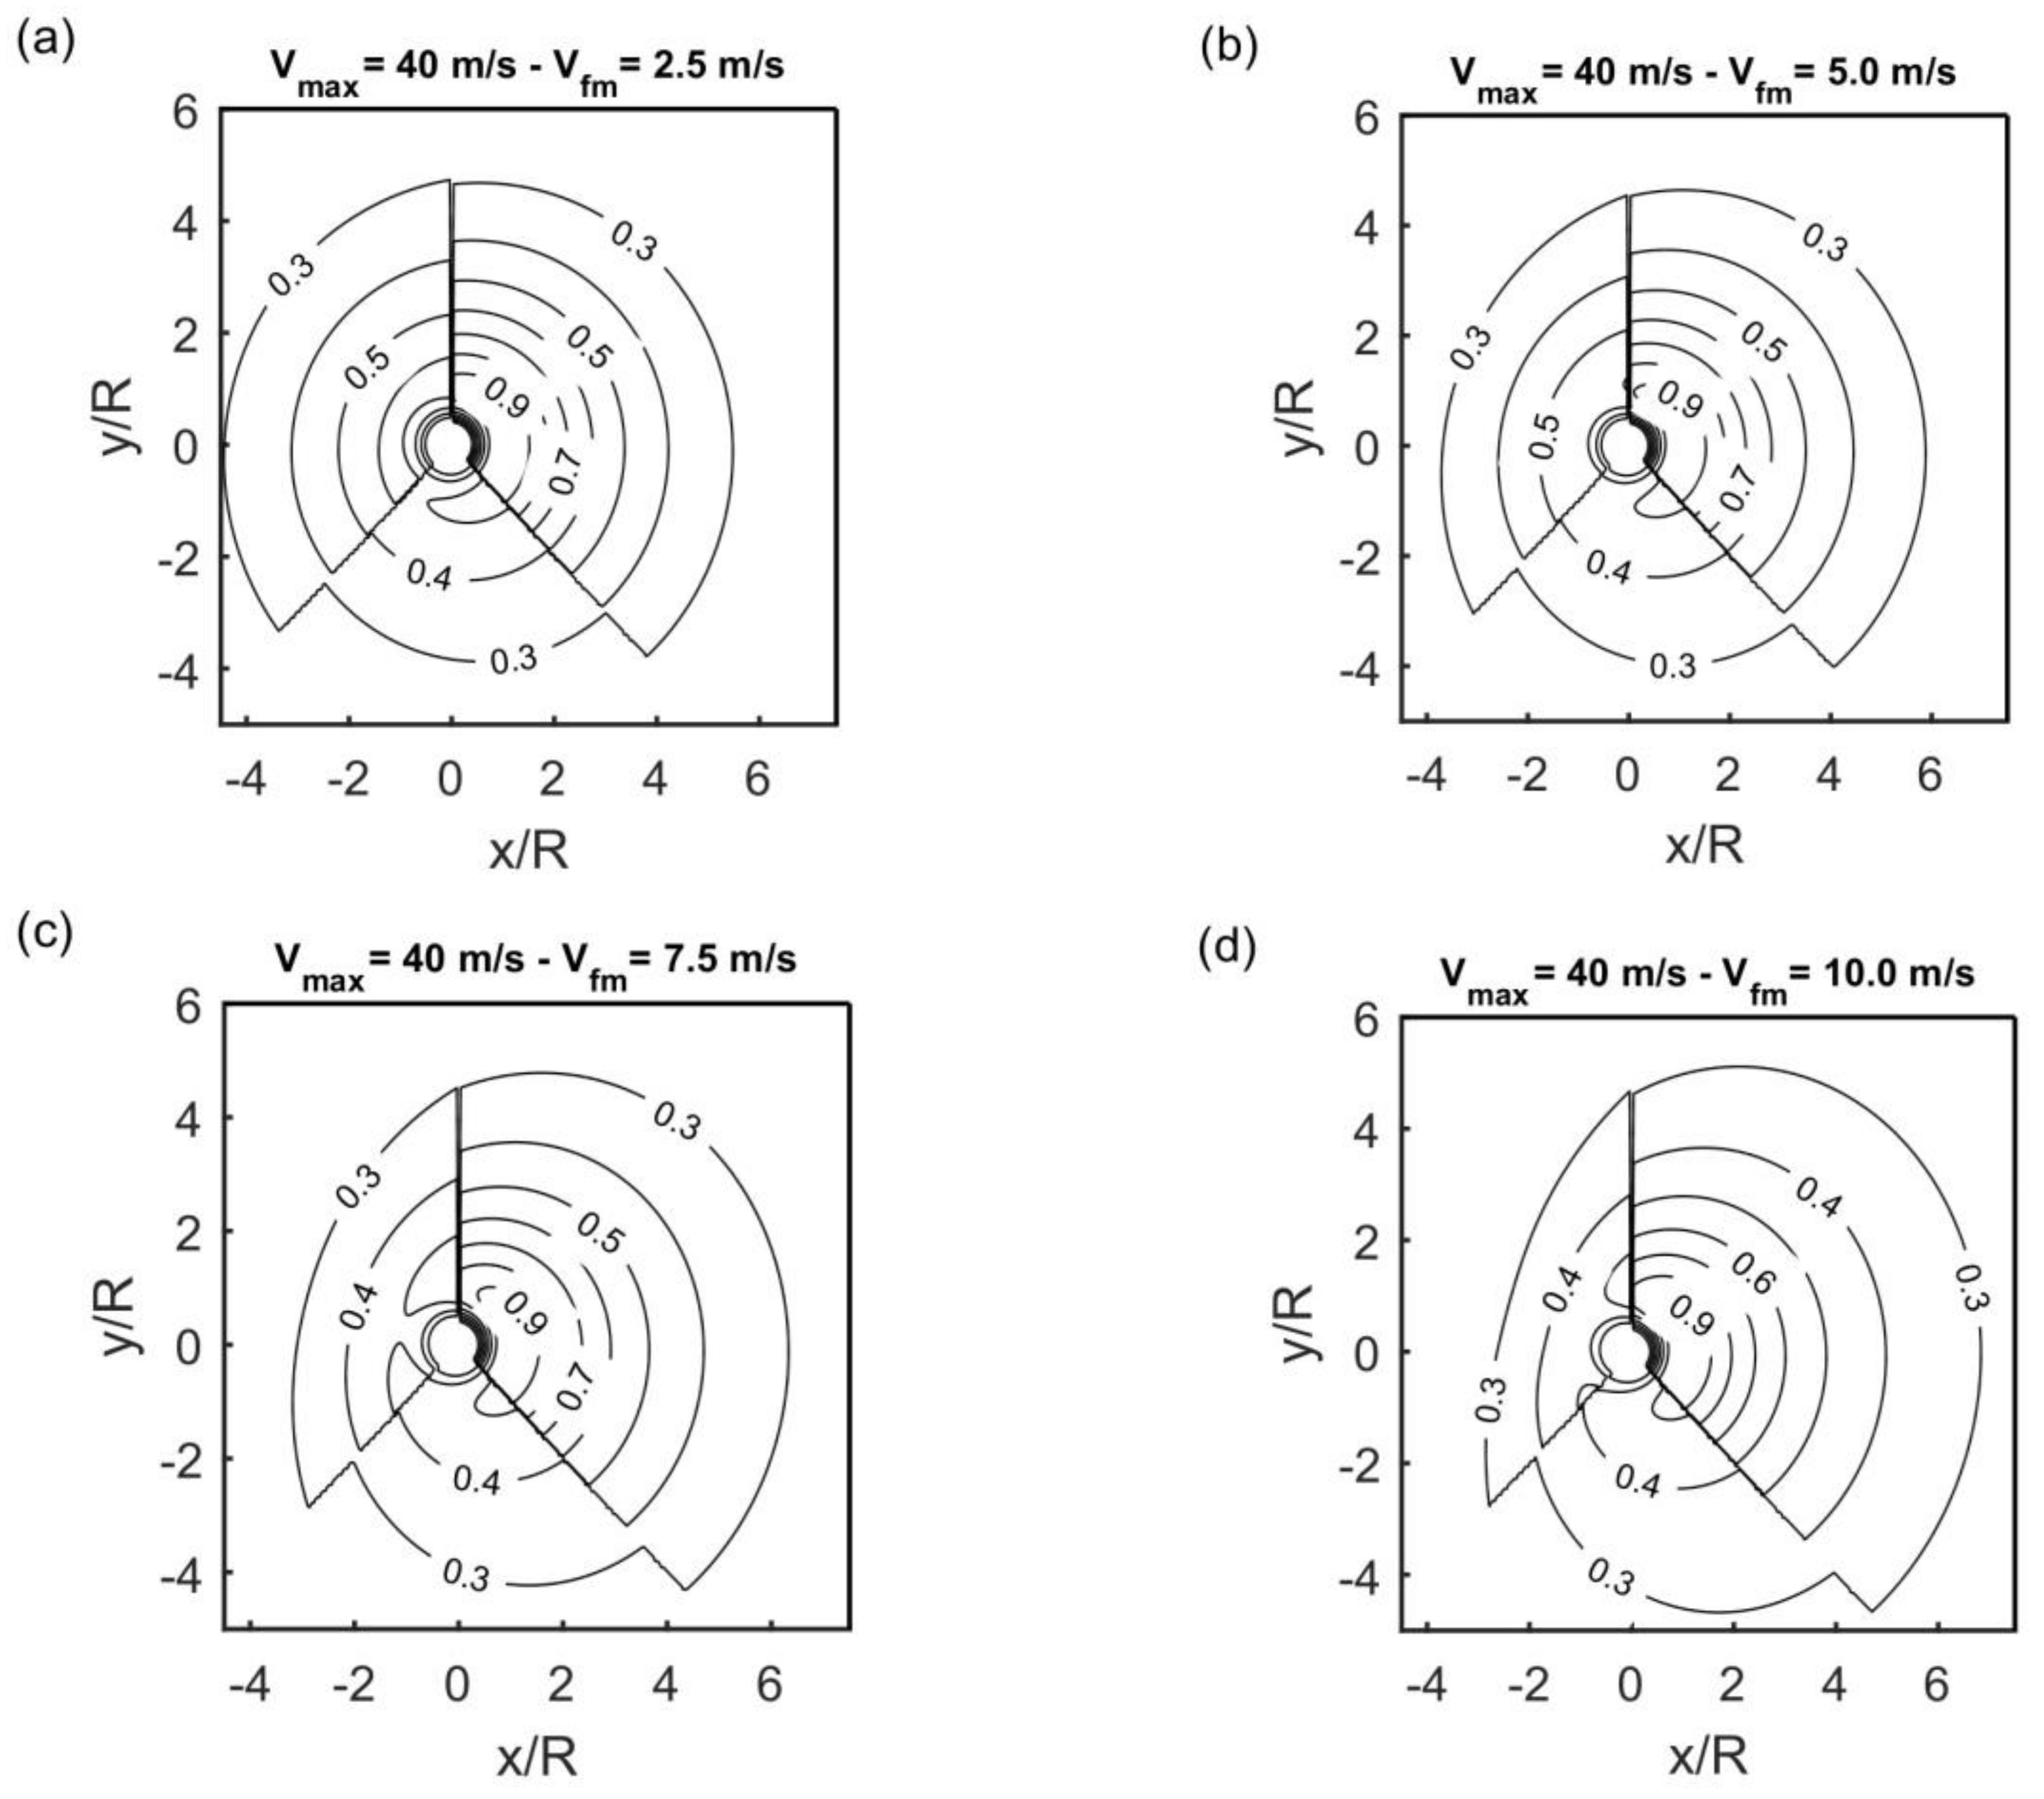
With the maximum significant wave height defined, Young [43] presented a series of non-dimensional ( H s / H s max ) diagrams for a range of values of V f m , V max . These diagrams were generated from the numerical model runs used in the study. Figure 5 shows both the wind field and the resulting wave field, both non-dimensionalized in terms of their respective maximum values. The four cases shown all have a maximum wind speed of V max = 40 m s 1 but with an increasing velocity of forward movement: (a) V f m = 2.5 m s 1 , (b) V f m = 5.0 m s 1 , (c) V f m = 7.5 m s 1 , (d) V f m = 10.0 m s 1 . As noted above, the wave field does not follow the same distribution as the winds. As the velocity of forward movement increases, the contours of significant wave height tend to be swept back behind the storm centre. This occurs because the tropical cyclone propagates faster than the group velocity of the waves it generates. As a result, these waves cannot keep pace with the storm. In Figure 5a,b, the spatial extent of the wave field is clearly larger than the wind field (i.e., H s decays more slowly than U 10 . This is because the waves can propagate ahead of the slowly moving storm and fill the full domain. At higher values of V f m , (Figure 5c,d), the waves are largely locally generated as they cannot outrun the storm and the decay rate of H s is very similar to U 10 .
The Young [43] parametric model has been successfully adopted in many engineering studies. This success is largely due to the fact that the model captures the important physics of tropical cyclone wind-wave generation. That is, the dominance of the nonlinear terms as represented by the JONSWAP scaling and the extended fetch, which is a function of V f m and V max . The Young [43] parametric model does, however, have two significant limitations. The first of these is that the numerical model used to generate the data utilized a 2nd generation spectral model, typical of its time [42]. The second is that the wind field used to force the model was a single vortex Holland [1] form model (1). As noted above, this means that the wind field and the resulting wave field probably decay more rapidly than for typical tropical cyclones embedded in a background flow. As a result, the Young [43] parametric model is probably only applicable relatively close to the centre of the storm (i.e., less than 4 R from the centre).
In an attempt to address these limitations, satellite altimeter data was used to modify the fetch relationship (5). Young and Burchell [38] considered GEOSAT data from approximately 100 tropical cyclones and concluded there was a systematic bias in the equivalent fetch, x / R determined by Equation (5) and proposed ψ take the form
ψ =   0.015 V max +   0.0431 V f m + 1.30
In a subsequent study, Young and Vinoth [56] used the satellite altimeter database of Zieger et al. [57] to identify more than 400 satellite transects across tropical cyclones. As a result of this extended data, they modified the coefficients in relationship (5) to: a   =   2.175 × 10 3 , b   =   1.506 × 10 2 , c   = 1.223 × 10 1 , d   = 8.760 × 10 2 , e   = 1.516 and f   = 1.756 , with the scale factor ψ   =   1 . Figure 4b,c show the modified equivalent fetch relationships proposed by Young and Burchell [38] and Young and Vinoth [56], respectively. These relations maintain the “ridge” structure in the diagrams, which defines the extended fetch resonance condition but moved the position of this condition to larger values of V f m . Although these subsequent studies modified the fetch relationship that determines H s max , the spatial distributions of H s were left unchanged from that predicted by the 2nd generation spectral model [42].

3.3. Wind Field Curvature

Alves et al. [58] undertook a preliminary analysis to address the limitation posed by the use of a 2nd generation spectral wave model to generate the data used to develop the Young [43] parametric model. They undertook an analysis using the 3rd Generation WAVEWATCH III model [59] and a moving tropical cyclone grid. They proposed that the radius to maximum winds, R , be included as an additional parameter in defining the functional form of the equivalent fetch, along with V f m and V max in the generalized JONSWAP form based on [46]. This contrasts with the approach proposed by Young [43] where R was included as a scaling parameter through relationship (6). The argument for such an inclusion is that the wind field curvature will affect the effective fetch. That is, if R is small, then the wind field curvature is large and this will result in a smaller equivalent fetch (waves propagate in straight lines). The approach of using an enhanced spectral wave model and investigating more fully the role of wind field curvature certainly represents an advance in such parametric approaches. The encouraging results reported by [58] indicates such developments need further research.
More recently, Hwang [48] and Hwang and Walsh [49] have proposed quite a different approach to defining the tropical cyclone wave field. As noted earlier, their data comes from a small number of North American tropical cyclones. As shown in Figure 3, this data is consistent with fetch-limited results. Rather than adopting one of the fetch-limited results, such as Equation (4), Hwang and Wang [60] found a best-fit result for their data of
ε   =   5.478 × 10 6 ν 3.42
Noting this scaling, they proposed a “circular racetrack” model for the determination of the fetch for any location. Essentially, they noted that the circular path traced out by the wind increases with r , and hence the effective fetch should also increase with r . Based on their data, the relationship appeared to vary depending on the relative location of interest. They divided the wave field into three sectors: left (0° to 135°), back (135° to 225°) and right (225° to 360°). These angles are measured anti-clockwise from the direction of propagation of the storm (0°). Relationships for the effective fetch, x for each sector were defined as
x = { 0.26 r + 259.79 right sec tor 1.25 r + 58.25 left sec tor 0.71 r + 30.02 back sec tor
Note that x and r have units of [ k m ] in Equation (10).
Substituting Equation (10) into Equation (9), a relationship for H s at any location in the wave field can be derived as
H s   =   8.10 × 10 4 U 10 1.19 x 0.405
where U 10 has units of [ m s 1 ] and x has units of [ k m ]. Figure 6 show contours of normalized wave height ( H s / H s max ) for the same cases, as shown in Figure 5. The piecewise angular discontinuities are obvious and the distributions are clearly quite different to those of the extended fetch model of Figure 5. It is, however, clear that these relations do result in shorter fetches in the rear sector as compared to the other sectors. This is consistent with the notion of an extended fetch. That is, waves generated to the right of the storm can move forward with the storm and that energy from this region will appear in both the left and right sectors. It should also be noted that relationships (10) cannot be directly compared to relationship (5). In the case of the relationships (10), the fetch is related to H s at any location, whereas relationship (5) relates to H s max , H s at any location then being determined from the spatial distribution diagrams, as in Figure 5.
Although the Hwang [48] and Hwang and Walsh [49] data represents a valuable dataset, it comes from only a very limited number of tropical cyclones with a very limited parameter range. As such, the relationships (10) may not be generally applicable. As the relationships ignore the well-established concepts of an extended fetch, it may be argued that they fail to capture the important generation physics to be applicable across a wide parameter range.

4. One-Dimensional Spectrum

In situ (wave buoy) measurements of one-dimensional spectra within tropical cyclones (e.g., [26,28,29,52,61,62,63,64,65,66,67]) consistently indicate that one-dimensional wave spectra measured relatively close to the storm centre (i.e., within 8 R of the centre) are unimodal. Noting this, and the fetch-limited type scaling indicated by Equation (4), Young [30,31] proposed the generalized JONSWAP form
F ( f )   =   β g 2 ( 2 π ) 4 f p ( 5 + n ) f n exp [ n 4 ( f f p ) 4 ] · γ exp [ ( f f p ) 2 2 σ 2 f p 2 ]
where F ( f ) is the frequency spectrum (units [ m 2 s ]), β is a scale parameter, f p is the spectral peak frequency, γ is a spectral peak enhancement factor, and σ is a spectral width parameter. The parameter n represents the slope of the high frequency face of the spectrum. For a value of n =   5 , Equation (12) reverts to the standard JONSWAP form [46], and for n =   4 to the form proposed by Toba [68] and Donelan et al. [47].
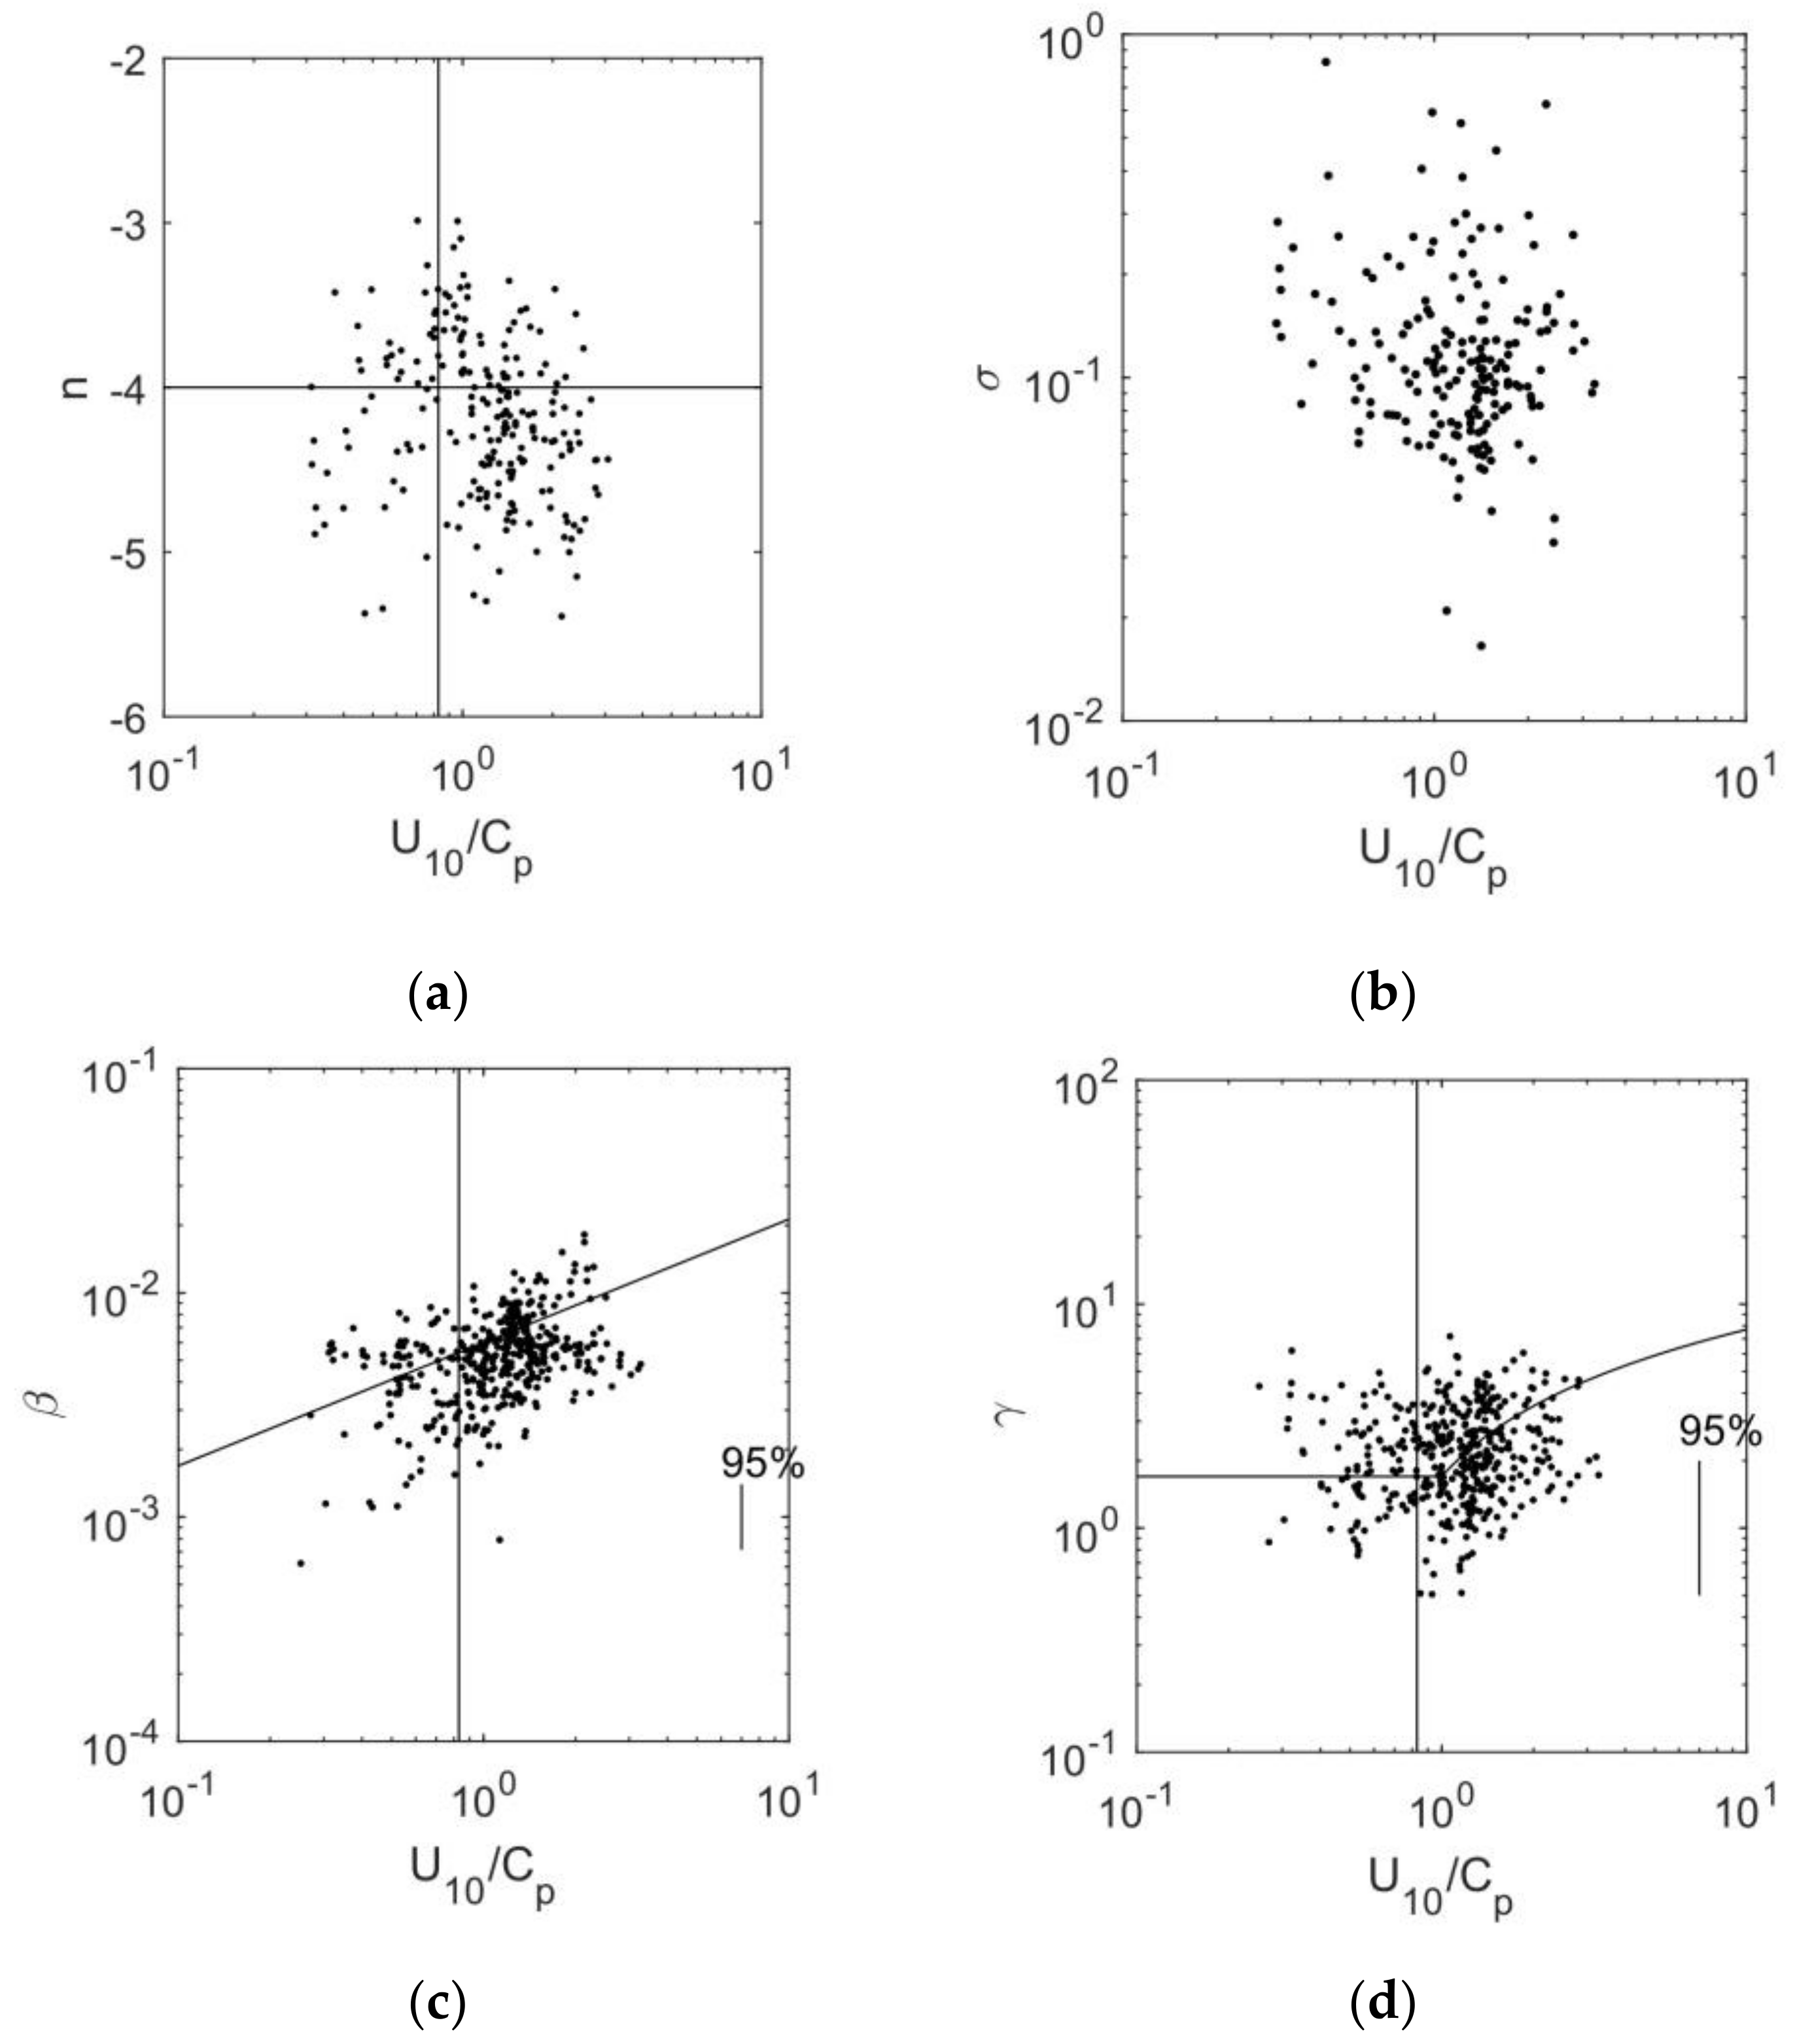
Young [30,31] fitted Equation (12) to their measured tropical cyclone one-dimensional spectra and determined the spectral parameters ( β , γ , σ , n ) as a function of the inverse wave age U 10 / C p = 2 π ν , where C p = g / ( 2 π f p ) , is the phase speed of waves at the spectral peak frequency. The data for each of these parameters is shown in Figure 7. They found no clear trends for n or σ as a function of U 10 / C p (Figure 7a,b) as found for fetch-limited data [47]. The mean values in each case, n =   4.2 and σ = 0.11 were, however, consistent with the fetch-limited data of Donelan et al. [47]. Noting the scatter, Young [31] recommended adopting the integer value n   4 . The Donelan et al. [47] relationships for β (Figure 7c) and γ (Figure 7d) are in good agreement with the tropical cyclone data.
β = 0.006 ( U 10 / C p ) 0.55
γ = { 1.7 for 0.83 U 10 / C p < 1 1.7 + 6 log 10 ( U 10 / C p ) for 1 U 10 / C p < 5
Equations (13), (14) and (4), together with the mean values for n and σ completely define the one-dimensional spectrum within about 8 R of the centre of the storm. Beyond this, the one-dimensional spectra tend to become bi-modal, with a distinct separate swell peak.

5. Directional Distribution of Waves

The original aircraft remote sensing data of King and Shemdin [33] indicated that the waves tended to radiate out from the intense wind regions to the right of the storm centre (Figure 2). This result has subsequently been verified by aircraft-based scanning radar altimeter data [48,49,50,51,52]. As noted in the above discussion of the extended fetch, this situation would likely not occur for very fast moving storms, where the group velocity of waves generated in this strong wind region would not be able to “outrun” the storm. Note that for f p = 0.08 Hz , a typical value for tropical cyclone waves, the group velocity is C g p = 9.76   ms 1 , and hence the velocity of forward movement would need to exceed this value, for waves radiating out from the centre of the storm to not dominate the forward quadrants of the storm. As V f m   10 ms 1 is quite a high value, for most tropical cyclones, areas ahead of storm are dominated by these radiating waves.
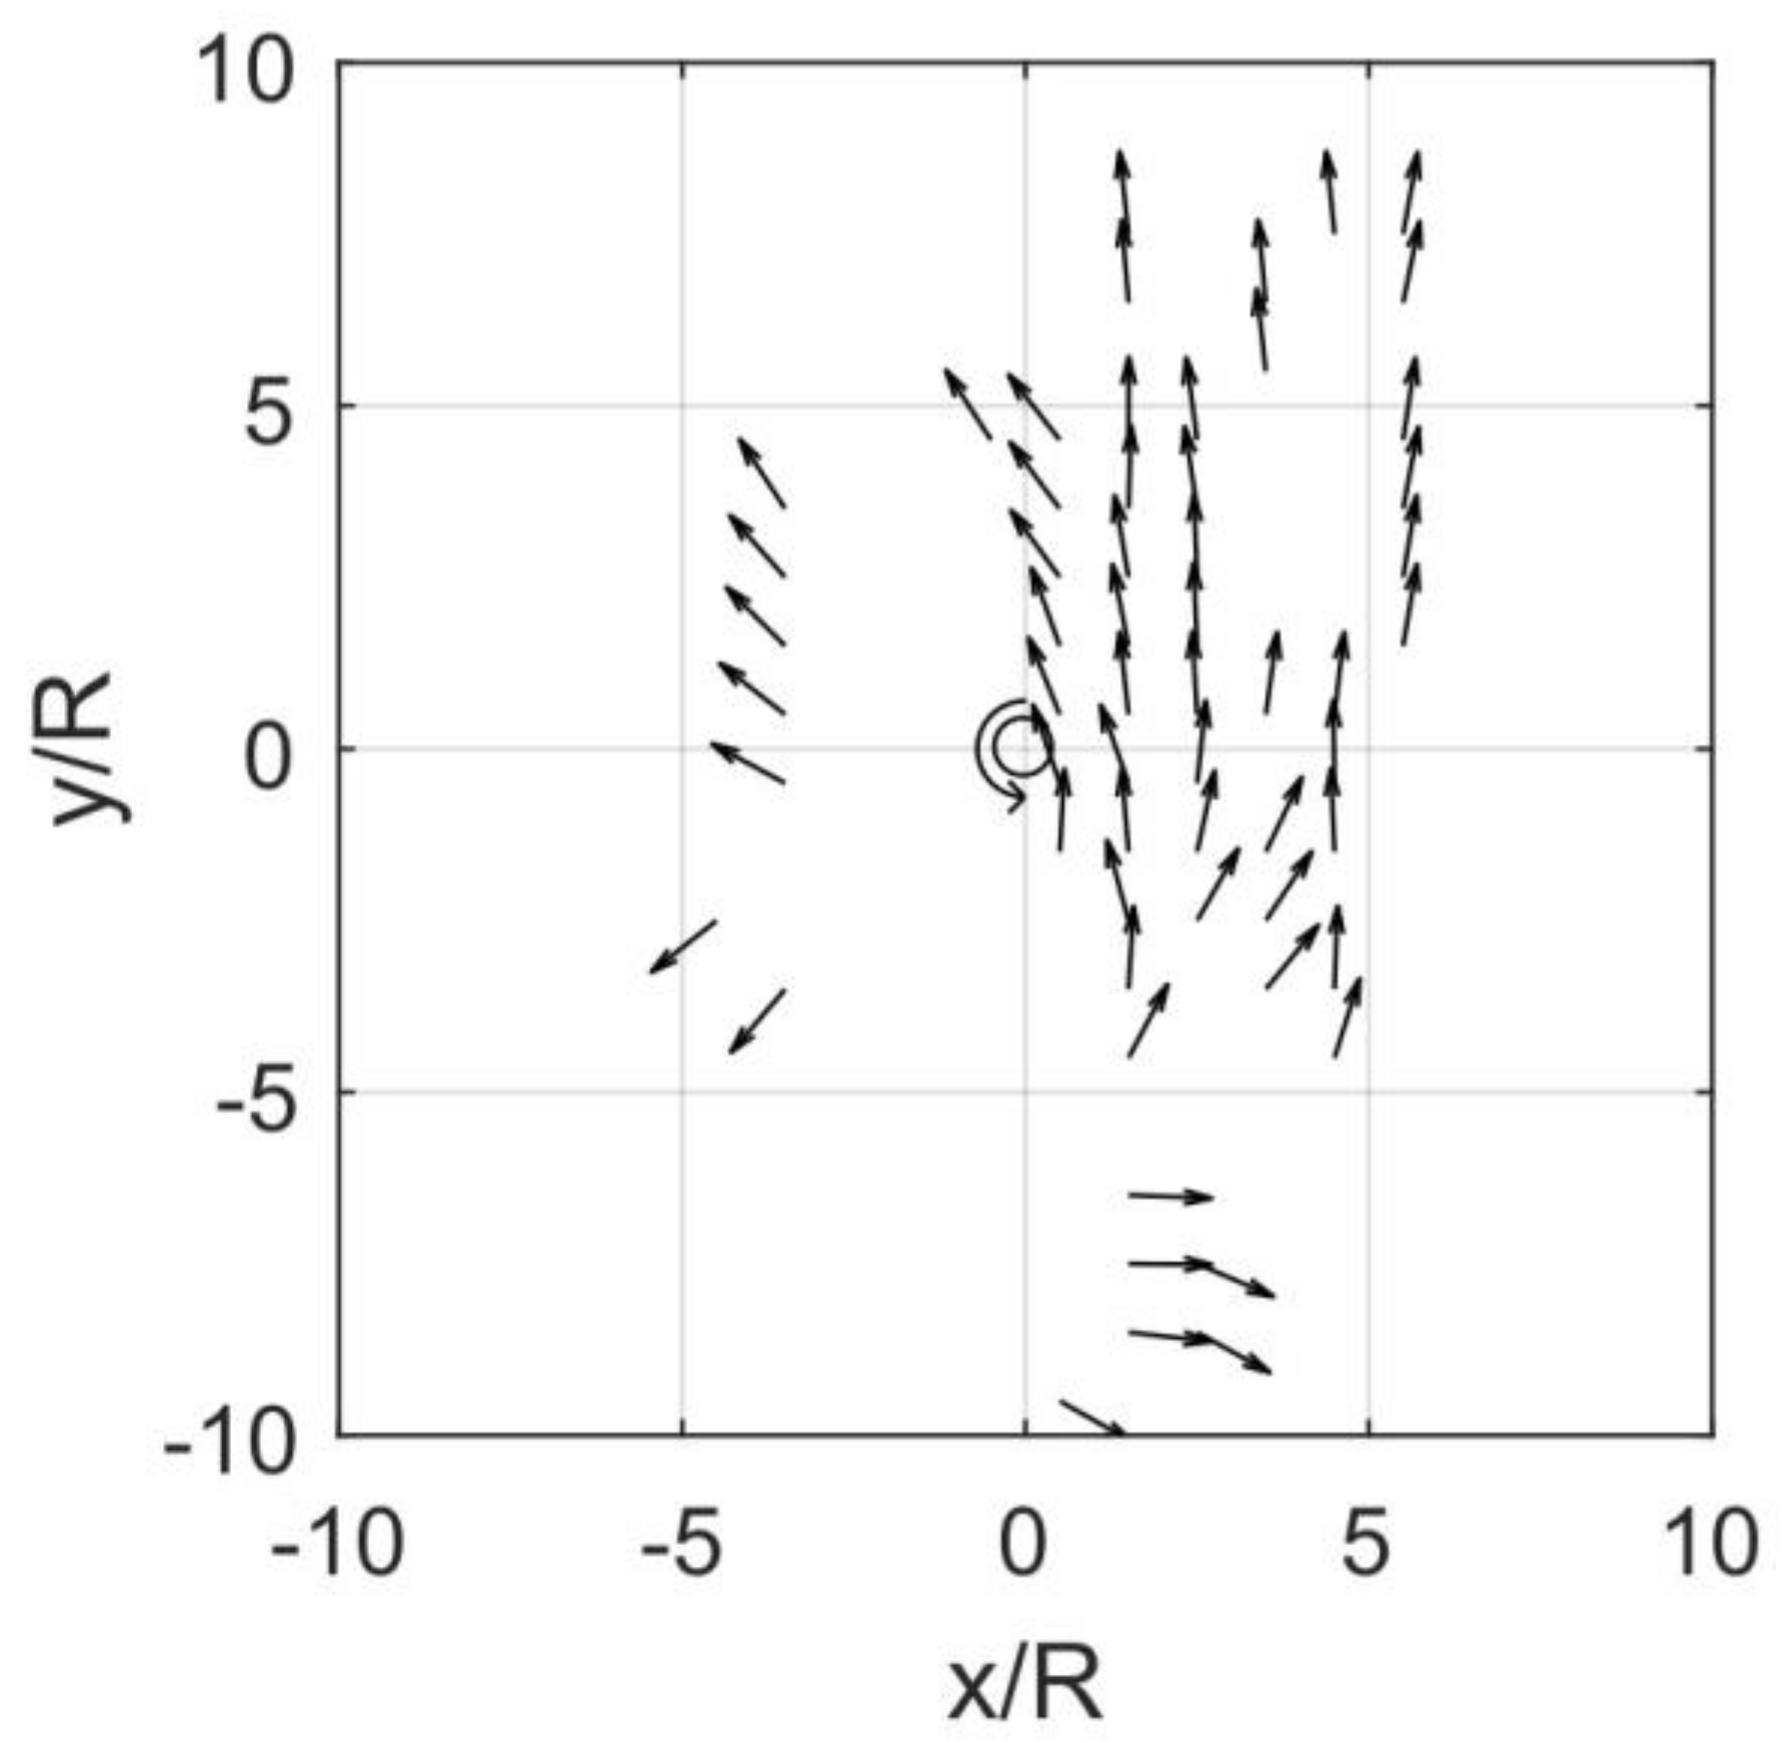
Young [31] put together a composite directional data set from each of the tropical cyclones in his in situ database to develop an understanding of this distribution. Figure 8 shows the mean direction of propagation of waves from this dataset. The similarity between this distribution and the conceptual diagram in Figure 2 is quite remarkable.
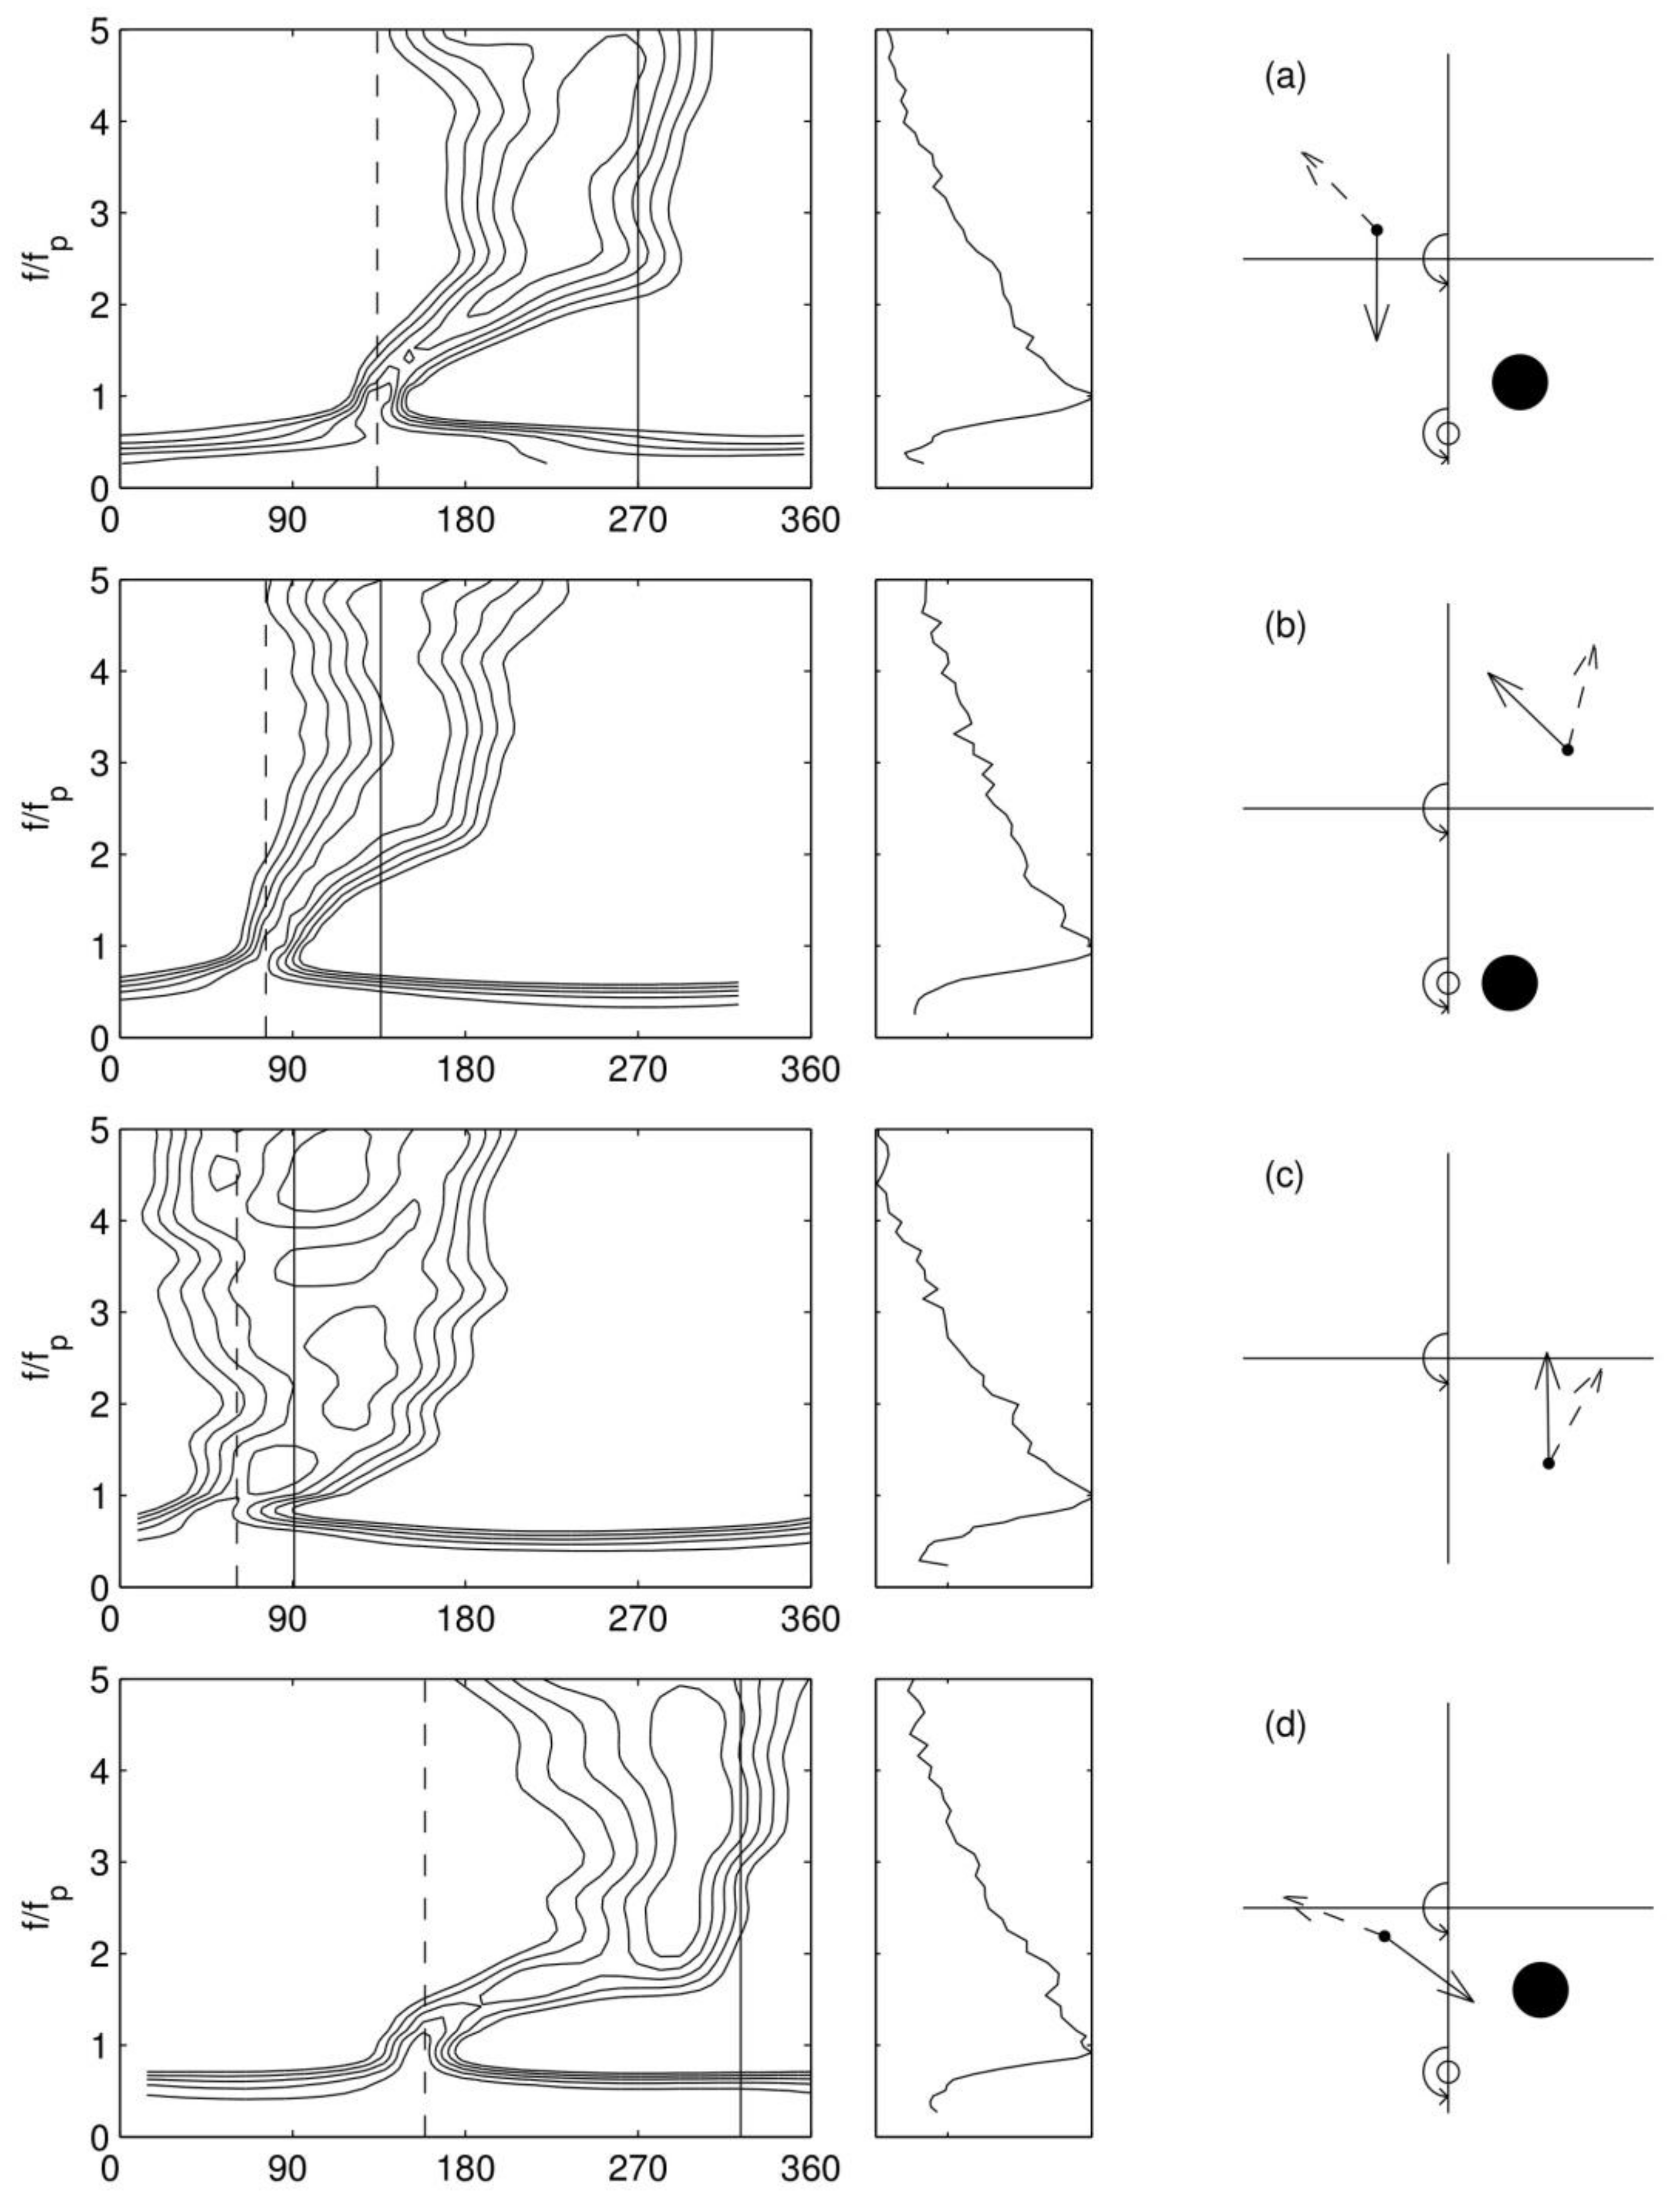
Examples of both the directional spectrum and the directionally integrated one-dimensional form for each of the quadrants in Figure 8 are shown in Figure 9. This figure shows examples of the directional spreading function, Equation (15) for each quadrant of a tropical cyclone [31]. For each quadrant, the panel to the left shows the contoured directional spectrum. The vertical dashed line shows the dominant wave direction and the vertical solid line the local wind direction. One-dimensional frequency spectra are shown to the right. The panels to the extreme right show the corresponding position of the measurement in the quadrant under consideration (small solid dot). The dominant wave direction is shown by the dashed arrow and the local wind direction by the solid arrow. The open circle below the cross shows the estimated position of the centre of the tropical cyclone at the time when the dominant waves at the measurement location were generated. The large solid circle to the right of this point shows the approximate region in which these dominant waves were generated. These generation locations were estimated by ray tracing backwards in time from the measured location with the wave direction to a point where the wind direction would have aligned with the measured wave direction. The system is shown for the Northern Hemisphere (i.e., anti-clockwise circulation).
This diagram shows that, although the one-dimensional spectra are uni-modal, and are very similar to fetch-limited forms, the directional spectra are typically directionally skewed. The high frequency waves align with the local wind direction but the waves at the spectral peak are clearly generated elsewhere (the high wind region to the right of the storm centre). The scanning radar altimeter data presented by Hwang et al. [51] provide an ideal approach to the analysis of the spatial distribution of these directional relationships, and their data again confirm the fact that the forward quadrants of tropical cyclones are dominated by waves radiating out from the intense wind regions to the right of the storm centre. These directional measurements provide a very compelling corroboration of the concept of an “extended fetch” within tropical cyclones. That is, although the high frequency waves may be locally generated, the dominant waves are the result of a complex interplay between the translating storm and the propagation speed of the waves.
Noting that one-dimensional tropical cyclone spectra conformed to fetch-limited relationships, Young [31] investigated whether the directional spectrum could also be parameterized in a similar manner to fetch-limited data. He adopted the model of Longuet-Higgins et al. [69]
E ( f , θ ) = G F ( f ) cos 2 s ( θ θ ¯ 2 )
where E is the directional frequency spectrum, θ is the direction at frequency, f and θ ¯ is the mean wave direction at that same frequency. The normalization factor, G , ensures the total energy of the one-dimensional and the directional spectra are the same. The exponent, s , determines the spectral width at frequency, f , with large values of s indicating narrow spreading.
As is clear in Figure 9, the directional distribution is narrowest at the spectra peak, and increases in width both above and below the peak. Young [31] parameterized the data as
s ( f ) = { 20 ( f / f p ) 4.5 for f / f p < 1 20 ( f / f p ) 2.4 for f / f p > 1
The determination of directional spreading from buoy data with a limited number of degrees of freedom (i.e., pitch, roll, heave sensors) is, however, not precise [70], and Young [31] noted that the spectral form could be equally well modelled by the forms proposed by Donelan et al. [47] or Babanin and Soloviev [71].

6. Physical Processes Active in Tropical Cyclone Wave Generation

The consensus position on wind wave generation [44] is that wind wave evolution is the result of three main processes: wind input, nonlinear interaction, and dissipation. The observations outlined previously confirm this balance. Importantly, the relationships developed above are not merely parametric fits to observed data, they capture the physics active in tropical cyclones.
The extended fetch model, recognizes that in a wind field which can be represented by a translating vortex, the relative speed of translation of the storm compared to the speed of propagation of the waves generated, will be critical. If the speed of propagation of the waves is approximately equal to the velocity of forward movement of the storm, a near-resonant condition can develop and large waves result. As pointed out by Young [43], the nonlinear processes always cause a gradual migration of the spectra peak to lower frequencies (i.e., faster speed of wave propagation). Therefore, the waves will never become fully “locked” to the speed of propagation of the storm. Rather, they will always tend to downshift in frequency and outrun the storm, except for very fast moving storm systems.
Importantly, the extended fetch models, which rely on the JONSWAP scaling Equation (7), only attempt to predict H s max , rather than values of H s throughout the wave field. In the intense wind regions of the tropical cyclone, where H s max occurs, there is little swell and the spectrum can be truly described as wind sea [43,55]. Thus, Equation (7), with the equivalent fetch described by Equation (5), yields reasonable results [56]. For the spatial distribution of H s it appears that non-dimensional distributions obtained from numerical models need to be used, as shown in the examples of Figure 5.
The fact that the one-dimensional spectra are very similar to fetch-limited forms is believed to be a result of the shape-stabilizing influence of the nonlinear terms [72]. These nonlinear terms tend to continually force spectra back to a unimodal form with a high frequency face, which decays at approximately f 4 [73]. The tropical cyclone data presented above represents a compelling case for the dominant role played by nonlinear interactions. In many of the figures shown above, data exists for U 10 / C p < 1 , that is, for waves propagating faster than the local wind. In such cases, these waves cannot be receiving input from the wind. Despite this, the spectra are almost identical to actively wind generated fetch-limited spectra. The low frequency portions of the tropical cyclone spectra must be under active modification by the nonlinear terms. It is believed the nonlinear terms are continually shaping the spectra to a JONSWAP-type form, even though significant portions of the spectrum are not receiving direct wind input. This is clearly seen in Figure 9. Because of this dominant role, the parametric forms represented by Equations (4), (13), (14), and (16) are equally applicable in tropical cyclones and fetch-limited growth.
Although the one-dimensional spectra conform to a uni-modal, JONSWAP-like form, the directional spectra are often directionally skewed, as shown in Figure 9 [31,51]. In these directionally skewed spectra, the components of swell and locally generated wind sea are clearly separated in directional space. The fact that tropical cyclone directional spectra are commonly directionally skewed and bi-modal, whilst the one-dimensional spectra are uni-modal accounts for apparently contradicting reports. In the literature, such tropical cyclone spectra are described as being both dominated by swell (directional spectra) and uni-modal (on-dimensional spectra) [24,27,30,31,33,39,51,54,55].

7. Discussion and Conclusions

More than three decades of measurements and modelling of tropical cyclone wind wave generation have resulted in a consistent and remarkably comprehensive understanding of the wave field in tropical cyclones. The description above outlines these relationships and the main physical processes responsible for the parametric description of the wave field. This understanding can be summarized as follows.
The tropical cyclone wind field is generally well represented by a vortex model of the form (1) or a double-vortex variant of this form. This enables the determination of the wind speed, U 10 , at any point in the wind field. An extended fetch exists within tropical cyclones, in which the relative values of the velocity of forward movement, V f m and the maximum wind speed in the storm, V max define an equivalent fetch, x . This equivalent fetch can be defined by Equations (5) and (6), and is shown diagrammatically in Figure 4. With this equivalent fetch defined, Equation (7) specifies the maximum significant wave height, H s max in the tropical cyclone. Values of H s at any location in the tropical cyclone can be determined using non-dimensional distributions obtained from numerical modelling. Examples are given in Figure 5 and more detailed results can be obtained on request from the author.
With H s defined, the peak frequency, f p can be determined at this same location from Equation (4). The one-dimensional spectrum associated with this combination of H s and f p can be defined by Equation (12), with the parameters of the spectrum given by Equations (13) and (14), together with mean values for the spectral parameters n and σ . Finally, the directional spectrum can be defined by Equations (15) and (16).
This set of relationships work successfully in this apparently complex situation due to the basic physics of wind-wave generation, which is captured in the concept of the extended fetch, together with the shape stabilizing effects of the nonlinear interactions.
It is difficult to accurately determine the error bounds on estimates of the significant wave height field estimated from these parametric approaches. In addition to the errors introduced by the limited number of parameters defining the empirical equivalent fetch function (5), characterizing actual tropical cyclone wind fields by a simple vortex model (1) is a gross simplification. Comparisons with data from satellite altimeter measurements [56] shows that, in the mean, the parametric relationships presented above are consistent with measured data. However, for individual tropical cyclones, the RMS errors in H s can be up to 40% and there is significant scatter. Further refinement of such parametric models using more sophisticated numerical models to define the parameter space (see below) may reduce such errors.
Despite this relatively comprehensive picture of the tropical cyclone wave field, there are a number of areas where further research is needed. Modern day 3rd Generation Spectral Wave models require better parameterizations of the nonlinear source term. As noted above, this term is critical in the accurate prediction of waves in tropical cyclones. Although the parametric relations developed above are valuable for ideal cases (i.e., constant track direction, constant wind field intensity), more complex cases involving a complex track or weakening/strengthening systems require such full spectral models.
The development of the extended fetch model described above has relied heavily on relatively old 2nd generation spectral models. This could be much enhanced by application of modern 3rd generation models to “re-tune” the extended fetch relations, define the spatial distributions of significant wave height, and the mean directions of propagation of the waves. However, as shown by Liu et al. [17], 3rd generation wave models use a Discrete Interaction Approximation to the nonlinear source terms, which tends to produce spectra which are excessively broad. Hence, tropical cyclone wind fields may represent a demanding test for even these models. The results of Liu et al. [17] indicate that such models have difficulty modelling the correct asymmetry in typical tropical cyclones. Although one would expect such models to represent an enhancement, tuning against buoy and satellite data may still be required.

Acknowledgments

Much of the work of the author has been supported by a range of research funding from the Australian Research Council (ARC). This includes grants: LP0883888, DP120100227 and DP130100215. This sustained support is gratefully acknowledged.

Conflicts of Interest

The author declares no conflict of interest.

References

  1. Holland, G.J. An analytical model of the wind and pressure profiles in hurricanes. Mon. Weather Rev. 1980, 108, 1212–1218. [Google Scholar] [CrossRef]
  2. Schloemer, R.W. Analysis and synthesis of hurricane wind patterns over Lake Okechobee, Florida. In Hydromet Report; Govt Print Office: Washington, DC, USA, 1954; p. 49. [Google Scholar]
  3. Graham, H.E.; Hudson, G.N. Surface winds near the center of hurricanes (and other cyclones). In NHRP Report; Govt Print Office: Washington, DC, USA, 1960; Volume 39, p. 200. [Google Scholar]
  4. Smith, R.K. The surface boundary layer of a hurricane. Tellus 1968, 20, 473–484. [Google Scholar] [CrossRef]
  5. Gray, W.M.; Shea, D.J. The hurricane’s inner core region, II: Thermal stability and dynamic characteristics. J. Atmos. Sci. 1973, 30, 1565–1576. [Google Scholar] [CrossRef]
  6. Simiu, E.; Patel, V.C.; Nash, J.F. Mean speed profiles of hurricane winds. J. Eng. Mech. Div. Am. Soc. Civ. Eng. 1976, 102, 265–273. [Google Scholar]
  7. Atkinson, G.D.; Holliday, C.R. Tropical cyclone minimum sea level pressure-maximum sustained wind relationship for western North Pacific. Mon. Weather Rev. 1977, 105, 421–427. [Google Scholar] [CrossRef]
  8. Wang, G.C. Sea level pressure profile and gusts within a typhoon circulation. Mon. Weather Rev. 1978, 106, 954–960. [Google Scholar] [CrossRef]
  9. Courtney, J.; Knaff, J.A. Adapting the Knaff and Zehr wind-pressure relationship for operational use in Tropical Cyclone Warning Centres. Aust. Meteorol. Ocean. 2009, 58, 167–179. [Google Scholar] [CrossRef]
  10. Shea, D.J.; Gray, W.M. The hurricane’s inner core region, I: Symmetric and asymmetric structure. J. Atmos. Sci. 1973, 30, 1544–1564. [Google Scholar] [CrossRef]
  11. Uhlhorn, E.W.; Klotz, B.W.; Vukicevic, T.; Reasor, P.D.; Rogers, R.F. Observed Hurricane Wind Speed Asymmetries and Relationships to Motion and Environmental Shear. Mon. Weather Rev. 2014. Available online: https://doi.org/10.1175/MWR-D-13-00249.1 (accessed on 18 August 2017).
  12. Thompson, E.F.; Cardone, V.J. Practical modelling of hurricane surface wind fields. J. Waterw. Port Coast. Ocean Eng. 1996, 122, 195–205. [Google Scholar] [CrossRef]
  13. McConochie, J.D.; Mason, L.B.; Hardy, T.A. A Coral Sea cyclone wind model intended for wave modelling. In Coasts & Ports 1999: Challenges and Directions for the New Century, Proceedings of the 14th Australasian Coastal and Ocean Engineering Conference and the 7th Australasian Port and Harbour Conference, Perth, Western Australia, 14–16 April, 1999; National Committee on Coastal and Ocean Engineering, Institution of Engineers: Barton, A.C.T., Australia, 1999; pp. 387–392. [Google Scholar]
  14. Powell, M.D. Evaluations of diagnostic marine boundary layer models applied to hurricanes. Mon. Weather Rev. 1980, 108, 758–766. [Google Scholar] [CrossRef]
  15. Powell, M.D.; Houston, S.H. Hurricane Andrew’s landfall in South Florida. Part II: Surface wind fields and potential real-time applications. Weather Forecast. 1996, 11, 329–349. [Google Scholar] [CrossRef]
  16. Powell, M.D.; Murillo, S.; Dodge, P.; Uhlhorn, E.; Gamache, J.; Cardone, V.; Cox, A.; Otero, S.; Carrasco, N.; Annane, B.; et al. Reconstruction of Hurricane Katrina’s wind fields for storm surge and wave hindcasting. Ocean Eng. 2010, 37, 26–36. [Google Scholar] [CrossRef]
  17. Liu, Q.; Babanin, A.; Fan, Y.; Zieger, S.; Guan, C.; Moon, I.-J. Numerical simulations of ocean surface waves under hurricane conditions: Assessment of existing model performance. Ocean Model. 2017, in press. [Google Scholar] [CrossRef]
  18. Tolman, H.L.; Alves, J.-H.G. Numerical modeling of wind waves generated by tropical cyclones using moving grids. Ocean Model. 2005, 9, 305–323. [Google Scholar] [CrossRef]
  19. Ardhuin, F.; Rogers, E.; Babanin, A.; Filipot, J.-F.; Magne, R.; Roland, A.; Van Der Westhuysen, A.; Queffeulou, P.; Lefevre, J.-M.; Aouf, L.; et al. Semi-empirical dissipation source functions for ocean waves: Part I, definition, calibration and validation. J. Phys. Oceanogr. 2010, 40, 1917–1941. [Google Scholar] [CrossRef]
  20. Harper, B.A. Best practice in tropical cyclone wind hazard modelling: In search of data and emptying the skeleton cupboard. In Proceedings of the 16th Australasian Wind Engineering Society Workshop, Brisbane, Qld, Australia, 18–19 July 2013. [Google Scholar]
  21. Bretschneider, C.L. Hurricane design—Wave practices. Trans. ASCE 1959, 124, 39–62. [Google Scholar]
  22. Bretschneider, C.L. A non-dimensional stationary hurricane wave model. In Proceedings of the Fourth Offshore Technology Conference, Houston, TX, USA, 1–3 May 1972. [Google Scholar]
  23. U.S. Army Corp of Engineers. Shore Protection Manual: Volume I,II,III—Three Volumes; U.S. Army Coastal Engineering Research Center: Vicksburg, MS, USA, 1977. [Google Scholar]
  24. Ross, D.B. A simplified model for forecasting hurricane generated waves (Abstract). Bull. Am. Meteorol. Soc. 1976, 113–115. [Google Scholar]
  25. Patterson, M.M. Oceanographic data from Hurricane Camille. In Proceedings of the Offshore Technology Conference, Houston, TX, USA, 6–8 May 1974. OTC-2109-MS. [Google Scholar]
  26. Whalen, J.E.; Ochi, M.K. Variability of wave spectral shapes associated with hurricanes. In Proceedings of the Offshore Technology Conference, Houston, TX, USA, 8–11 May 1978. OTC3228. [Google Scholar]
  27. Black, J.L. Hurricane Eloise directional wave energy spectra. In Proceedings of the Offshore Technology Conference, Houston, TX, USA, 30 April–3 May 1979. OTC 3594. [Google Scholar]
  28. Ochi, M.K.; Chiu, M.H. Nearshore wave spectra measured during Hurricane David. In Proceedings of the 18th International Confession on Coastal Engineering, Cape Town, South Africa, 14–19 November 1982; ASCE: Hamburg, Germany; pp. 77–86. [Google Scholar]
  29. Ochi, M.K. On hurricane-generated seas. In Proceedings of the 2nd International Symposium on Ocean Wave Measurement and Analysis, New Orleans, LA, USA, 25–28 July 1993; ASCE: New Orleans, LA, USA, 1993; pp. 374–387. [Google Scholar]
  30. Young, I.R. Observations of the spectra of hurricane generated waves. Ocean Eng. 1998, 25, 261–276. [Google Scholar] [CrossRef]
  31. Young, I.R. Directional spectra of hurricane wind-waves. J. Geophys. Res. 2006, 111, C08020. [Google Scholar] [CrossRef]
  32. Elachi, C.; Thompson, T.W.; King, D.B. Observations of the ocean wave pattern under Hurricane Gloria with synthetic aperture radar. Science 1977, 198, 609–610. [Google Scholar] [CrossRef] [PubMed]
  33. King, D.B.; Shemdin, O.H. Radar observations of hurricane wave directions. In 16th International Confession on Coastal Engineering; Hamburg, Germany, 1978, ASCE: Hamburg, Germany, 1987; pp. 209–226. [Google Scholar]
  34. Gonzalez, F.I.; Thompson, T.E.; Brown, W.E.; Weissman, D.E. Seasat wind and wave observations of Northeast Pacific Hurricane Iva, 13 August 1978. J. Geophys. Res. 1982, 87, 3431–3438. [Google Scholar] [CrossRef]
  35. McLeish, W.; Ross, D.B. Imaging radar observations of directional properties of ocean waves. J. Geophys. Res. 1983, 88, 4407–4419. [Google Scholar] [CrossRef]
  36. Holt, B.; Gonzalez, F.I. SIR-B observations of dominant ocean waves near hurricane Josephine. J. Geophys. Res. 1986, 91, 8595–8598. [Google Scholar] [CrossRef]
  37. Beal, R.C.; Gerling, T.W.; Irvine, D.E.; Monaldo, F.M.; Tilley, D.G. Spatial variations of ocean wave directional spectra from the Seasat synthetic aperture radar. J. Geophys. Res. 1986, 91, 2433–2449. [Google Scholar] [CrossRef]
  38. Young, I.R.; Burchell, G.P. Hurricane generated waves as observed by satellite. Ocean Eng. 1986, 23, 761–776. [Google Scholar] [CrossRef]
  39. Wright, C.W.; Walsh, E.J.; Vandemark, D.; Krabill, W.B.; Garcia, A.W.; Houston, S.H.; Powell, M.D.; Black, P.G.; Marks, F.D. Hurricane directional wave spectrum spatial variation in the open ocean. J. Phys. Oceanogr. 2001, 31, 2472–2488. [Google Scholar] [CrossRef]
  40. Black, P.G.; D’Asaro, E.A.; Drennan, W.M.; French, J.R.; Niiler, P.P.; Sanford, T.B.; Terrill, E.J.; Walsh, E.J.; Zhang, J.A. Air-sea exchange in hurricanes: Synthesis of observations from the coupled boundary layer air-sea transfer experiment. Bull. Am. Meteorol. Soc. 2007, 88, 357–374. [Google Scholar] [CrossRef]
  41. SWAMP Group. Ocean Wave Modelling; Plenum Press: New York, NY, USA, 1985; p. 256. [Google Scholar]
  42. Young, I.R. A shallow water spectral wave model. J. Geophys. Res. 1988, 93, 5113–5129. [Google Scholar] [CrossRef]
  43. Young, I.R. A parametric hurricane wave prediction model. J. Waterw. Port Coast. Ocean Eng. 1988, 114, 637–652. [Google Scholar] [CrossRef]
  44. The WAMDI Group. The WAM model—A third generation ocean wave prediction model. J. Phys. Oceanogr. 1988, 18, 1775–1810. [Google Scholar]
  45. Bowyer, P.J.; MacAfee, A.W. The theory of trapped-fetch waves within tropical cyclones—An operational perspective. Weather Forecast. 2005, 20, 229–244. [Google Scholar] [CrossRef]
  46. Hasselmann, K.; Barnett, T.P.; Bouws, E.; Carlson, H.; Cartwright, D.E.; Enke, K.; Ewing, J.A.; Gienapp, H.; Hasselmann, D.E.; Kruseman, P.; et al. Measurements of wind-wave growth and swell decay during the Joint North SeaWave Project (JONSWAP). In Hydraulic Engineering Reports; Deutches Hydrographisches Institute: Hamburg, Germany, 1973; p. 95. [Google Scholar]
  47. Donelan, M.A.; Hamilton, J.; Hui, W.H. Directional spectra of wind-generated waves. Philos. Trans. R. Soc. B Ser. A 1985, 315, 509–562. [Google Scholar] [CrossRef]
  48. Hwang, P.A. Fetch- and duration-limited nature of surface wave growth inside tropical cyclones: With applications to air-sea exchange and remote sensing. J. Phys. Oceanogr. 2016, 46, 41–56. [Google Scholar] [CrossRef]
  49. Hwang, P.A.; Walsh, E.J. Azimuthal and radial variation of wind-generated surface waves inside tropical cyclones. J. Phys. Oceanogr. 2016, 46, 2605–2621. [Google Scholar] [CrossRef]
  50. Hwang, P.A.; Fan, Y. Effective fetch and duration of tropical cyclone wind fields estimated from simultaneous wind and wave measurements: Surface wave and air-sea exchange computation. J. Phys. Oceanogr. 2017, 47, 447–470. [Google Scholar] [CrossRef]
  51. Hwang, P.A.; Fan, Y.; Ocampo-Torres, F.J.; García-Nava, H. Ocean Surface 1 Wave Spectra inside Tropical Cyclones. J. Phys. Oceanogr 2017, in press. [Google Scholar] [CrossRef]
  52. Walsh, E.J.; Wright, C.W.; Vandemark, D.; Krabill, W.B.; Garcia, A.W.; Houston, S.H.; Murillo, S.T.; Powell, M.D.; Black, P.G.; Marks, F.D. Hurricane directional wave spectrum spatial variation at landfall. J. Phys. Oceanogr. 2002, 32, 1667–1684. [Google Scholar] [CrossRef]
  53. Fan, Y.; Ginis, I.; Hara, T. The effect of wind-wave-current interaction on air-sea momentum fluxes and ocean response in tropical cyclones. J. Phys. Oceanogr. 2009, 39, 2097–2116. [Google Scholar] [CrossRef]
  54. Moon, I.-J.; Ginis, I.; Hara, T.; Tolman, H.L.; Wright, C.W.; Walsh, E.J. Numerical simulation of sea surface directional wave spectra under hurricane wind forcing. J. Phys. Oceanogr. 2003, 33, 1680–1706. [Google Scholar] [CrossRef]
  55. Hu, K.; Chen, Q. Directional spectra of hurricane-generated waves in the Gulf of Mexico. Geophys. Rev. Lett. 2011, 38, L19608. [Google Scholar] [CrossRef]
  56. Young, I.R.; Vinoth, J. An ‘extended fetch’ model for the spatial distribution of tropical cyclone wind-waves as observed by altimeter. Ocean Eng. 2013, 70, 14–24. [Google Scholar] [CrossRef]
  57. Zieger, S.; Vinoth, J.; Young, I.R. Joint calibration of multi-platform altimeter measurements of wind speed and wave height over the past 20 years. J. Atmos. Ocean. Technol. 2009, 12, 2549–2564. [Google Scholar] [CrossRef]
  58. Alves, J.H.G.M.; Tolman, H.L.; Chao, Y.Y. Hurricane-Generated Wind-Wave Research at NOAA/NCEP. NCEP Marine Modeling and Analysis Branch. 2004; Report No: 242, 13. Available online: http://polar.ncep.noaa.gov/mmab/notes.shtml (accessed on 18 August 2017).
  59. Tolman, H.L. A Third-Generation Model for Wind Waves on Slowly Varying, Unsteady, and Inhomogeneous Depths and Currents. J. Phys. Oceanogr. 1991, 21, 782–797. [Google Scholar] [CrossRef]
  60. Hwang, P.A.; Wang, D.W. Field measurements of duration limited growth of wind-generated ocean surface waves at young stage of development. J. Phys. Oceanogr. 2004, 34, 2316–2326. [Google Scholar] [CrossRef]
  61. Ochi, M.K. A Series of JONSWAP Wave Spectra for Offshore Structural Design. Available online: https://www.tib.eu/en/search/id/tema-archive%3ATEMAM84091112475/A-series-of-JONSWAP-wave-spectra-for-offshore-structure/?tx_tibsearch_search[searchspace]=tn (accessed on 18 August 2017).
  62. Ross, D. Observing and predicting hurricane wind and wave conditions. In Proceedings of the Joint IOC/WMO Seminar on Oceanographic Products and the IGOSS Data Processing and Services System, Moscow, Russia, 2–6 April 1979; pp. 309–321. [Google Scholar]
  63. Antani, J.K. Mathematical Representation of Hurricane Associated Wave Spectra; UFL/COEL-87-007; University of Florida: Gainesville, FL, USA, 1981. [Google Scholar]
  64. Foster, E.R. JONSWAP Spectral Formulation Applied to Hurricane Generated Seas; UFL/COEL-82/004; University of Florida: Gainesville, FL, USA, 1982. [Google Scholar]
  65. Knabb, R.D.; Rhome, J.R.; Brown, D.P. Tropical Cyclone Report: Hurricane Katrina: 23–30 August 2005. Available online: http://www.nhc.noaa.gov/pdf/TCRAL122005Katrina.pdf (accessed on 18 August 2017).
  66. Liu, P.C.; Chen, H.S.; Doong, D.-J.; Kao, C.C.; Hsu, Y.-J.G. Monstrous ocean waves during Typhoon Krosa. Ann. Geophys. 2008, 26, 1327–1329. [Google Scholar] [CrossRef]
  67. Wang, D.W.; Mitchell, D.A.; Teague, W.J.; Jarosz, E.; Hulbert, M.S. Extreme waves under Hurricane Ivan. Science 2005, 309, 896. [Google Scholar] [CrossRef] [PubMed]
  68. Toba, Y. Local balance in the air-sea boundary process. J. Oceanogr. Soc. Jpn. 1973, 29, 209–220. [Google Scholar] [CrossRef]
  69. Longuet-Higgins, M.S.; Cartwright, D.E.; Smith, N.D. Observations of the directional spectrum of sea waves using the motions of a floating buoy. In Ocean Wave Spectra; Prentice Hall: Upper Saddle River, NJ, USA, 1963; pp. 111–136. [Google Scholar]
  70. Young, I.R. On the measurement of directional wave spectra. Appl. Ocean Res. 1994, 16, 283–294. [Google Scholar] [CrossRef]
  71. Babanin, A.V.; Soloviev, Y.P. Variability of directional spectra of wind-generated waves, studied by means of wave staff arrays. J. Mar. Freshw. Res. 1998, 49, 89–101. [Google Scholar] [CrossRef]
  72. Young, I.R.; van Vledder, G.P. The central role of nonlinear interactions in wind-wave evolution. Philos. Trans. R. Soc. B 1993, 342, 505–524. [Google Scholar] [CrossRef]
  73. Zakharov, V.E. Theoretical interpretations of fetch-limited wind-driven sea observations. Nonlinear Process. Geophys. 2005, 12, 1011–1020. [Google Scholar] [CrossRef]
Figure 1. Tropical cyclone wind fields. (a) Left panel—calculated with a single Holland vortex (1) and parameters, p 0 = 950 HPa , p n = 1005   HPa , R = 30 km , B = 1.75 and V f m = 5 ms 1 (b) Right panel—calculated with a double Holland vortex and parameters, p 0 1 = 955 HPa , p 0 2 = 1000 HPa , R 1 = 30 km , R 2 = 300 km , B 1 = 1.75 and B 2 = 2.2 .
Atmosphere 08 00194 g001
Figure 2. Schematic diagram showing the generation of waves within a translating northern hemisphere tropical cyclone. The tropical cyclone shown is translating ‘‘up the page’’, as shown by the arrow at the centre of the storm. The wave field is characterized by (i) swell ahead of the storm, radiating out from the intense wind region to the right of the storm centre, and (ii) significant asymmetry caused by the higher winds and extended translating fetch to the right of the storm centre.
Atmosphere 08 00194 g002
Figure 3. Values of the non-dimensional energy, ε as a function of non-dimensional peak frequency, ν . The buoy data of Young [30,31] are shown by the solid dots and the aircraft based Hurricane Hunter data [48,49,50,51] by the open squares. The vertical line makes the commonly adopted division between swell (left of line) and wind-sea (right of line).
Atmosphere 08 00194 g003
Figure 4. The tropical cyclone effective fetch. Contours are of x / R . The results shown are for (a) top—Young [30], (b) middle—Young and Burchell [38] and (c) bottom—Young and Vinoth [56].
Atmosphere 08 00194 g004
Figure 5. Tropical cyclone wind fields (left) and wave fields (right). The wind is calculated from the Holland vortex [1] and the waves from the results of Young [43]. The contours show normalized wind speed U 10 / V max (left) and normalized wave height H s / H s max (right). Each of the panels (aߝd) are for a different combination of V f m and V max , as marked.
Atmosphere 08 00194 g005
Figure 6. Tropical cyclone wave fields, calculated from the model of Hwang [48] and Hwang and Walsh [49]. Contours are of H s / H s max . Each of the panels (a) to (d) is for a different combination of V f m and V max , as marked.
Atmosphere 08 00194 g006
Figure 7. Spectral parameters for the one-dimensional form (12) as determined by Young [31]. (a) top left—spectral decay, n , with n =   4 shown, (b) top right—spectral width, σ , (c) bottom left—scale parameter, β , with relationship (13), (d) bottom right—peak enhancement, γ , with relationship (14).
Atmosphere 08 00194 g007
Figure 8. A composite of all of the data considered by Young [31] showing the mean values of the dominant wave direction in squares of size 1R × 1R. Areas with no vectors shown correspond to squares where there were insufficient measurements to form a reliable estimate of dominant wave direction. The tropical cyclone centre is shown by the open circle at co-ordinates (0, 0). The system is shown for the Northern Hemisphere (i.e., anti-clockwise circulation).
Atmosphere 08 00194 g008
Figure 9. Examples of the directional spreading function, Equation (15) for each quadrant of a tropical cyclone [31] ((a) Forward left quadrant, (b) Forward right quadrant, (c) Rear right quadrant, (d) Rear left quadrant). The panels to the left shows the directional spreading function and the central panels the corresponding one-dimensional spectrum. The panels on the right show the measurement location (solid dot), the tropical cyclone position (cross), the wave direction (dashed arrow), the local wind direction (solid arrow), and the likely position where the measured waves were generated (large solid dot).
Atmosphere 08 00194 g009